Abstract
Submarine permafrost is widely distributed in polar ocean, which has an important impact on polar engineering and subsea energy exploitation. According to the frozen porous medium theory, an analytical solution of the one-dimensional vertically dynamic response of the submarine permafrost is derived by using the Laplace transform and the separation variable method. Using the general forms of partial differential equations and the pressure acoustics module in COMSOL software, a finite element model of submarine permafrost overlying a seawater layer is established. The results show that the degraded solution agrees well with the existing results of the vertically dynamic response of the saturated soil layer in the seabed, and the analytical and numerical solutions are in good agreement. The water depth, saturation and temperature have important effects on the dynamic responses of submarine permafrost. When the soil layer is fully saturated, the water depth has a weak effect on resonance frequency. However, if not fully saturated, even a small amount of air bubbles will have a significant impact on the resonance frequency of the soil layer, and this effect increases with the increase of water depth. The effect of temperature on the nearly saturated permafrost layer is also significantly higher than that on the saturated permafrost layer.
1. Introduction
The subsea contains a large amount of oil and gas resources, and the development of underwater production systems plays an important role in the exploitation of oil and gas resources in polar oceans. However, earthquakes are potentially harmful to the exploitation of submarine oil and gas resources, and a recent survey has summarized some damage to fixed marine platforms in the vicinity of the Arctic induced by five earthquakes [1]. It is worth noting that, in recent years, researchers have found that there are a large number of submarine permafrost layers in the polar oceans [2,3,4,5,6,7]. Generally, the submarine permafrost is in a saturated state. With global warming, the polar ice caps melt, seawater heats up, and some organic matter in the permafrost decomposes, resulting in a small amount of gas dissolved in pore water of the soil layer. Consequently, a nearly saturated submarine permafrost containing microbubbles will be formed [8,9]. In addition, because the submarine permafrost layer is located in deep water, the soil layer is subjected to overlying water pressure, and the elastic modulus of the nearly saturated submarine permafrost layers is different from that in the frozen soil on land.
When earthquake waves are incident to the submarine permafrost, it may cause site amplification of the soil layer and endanger the safety of underwater production systems. Since the underwater production system consists of multiple pieces of wellhead equipment and a large number of pipelines, the destructive effect of vertical earthquakes on the system is more obvious. Therefore, studying the vertical earthquake response of submarine permafrost has important application value. In the existing literature, the vertical site response of the soil layer is generally based on a single-phase medium theory, and a large number of dynamic response characteristics have been obtained in this regard [10,11]. However, soil is a complex multiphase medium. Under the action of vertical earthquake waves, the zooming and filtering effects of the liquid phase in the soil layer cannot be ignored. Several researchers have carried out site response analysis of saturated and nearly saturated strata based on Biot’s saturated porous medium theory, and the corresponding results show that both types of compressional waves in the soil layer have an effect on the vertical ground motion of the soil layer [12,13]. On this basis, in recent years, some researchers have studied the effect of submarine earthquakes or waves on the site response of the subsea soil layer [14,15,16]. However, for the submarine permafrost layer, its wave propagation characteristics are significantly different from those of unfrozen soil layers. Leclaire et al. first proposed the theoretical framework of frozen saturated porous media [17], and Carcione et al. considered the interaction between the solid phase and ice, which can be extended to materials such as gas hydrates and shale containing viscous substances [18,19,20]. Recently, Du also proposed a similar method, with the difference being the treatment of ice pressure [21]. Furthermore, Santos et al. studied wave propagation based on the theory, and established a theoretical and numerical solution of the wave equation [22]. Those achievements provide a theoretical framework for studying the engineering properties of permafrost and predicting wave propagation in complex porous media; however, they are still insufficient in numerical verification. Due to the existence of an ice phase in frozen soil, wave propagation and site response are obviously different from the commonly used single-phase and dual-phase medium models. To reflect the effect of ice formation on the site response after freezing, it is necessary to establish an effective solid–ice–liquid coupling finite element model. However, the existing results of finite element simulation on site response are mainly based on single-phase or two-phase medium theory [23,24,25,26,27], and limited investigations are performed on the dynamic model of the three-phase coupling in frozen soil; the influence of the overlying seawater layer is even more lacking for the submarine permafrost containing a small amount of biogas or natural gas.
On the basis of Leclaire’s works [17], we establish the governing equations to describe the submarine permafrost containing microbubbles. The one-dimensional site response of the submarine permafrost stratum is solved by using the variables separation method, and a transient model of the dynamic response of the submarine permafrost is established by using the general form of COMSOL. The analytical solution is verified by the finite element methods. Finally, the influence of frozen porous media parameters on the one-dimensional site response of submarine permafrost layers is analyzed, which is of great value for engineering applications in polar regions.
2. Mathematical Model and Assumptions
2.1. Assumptions
To investigate the one-dimensional site response of submarine permafrost, a composite porous medium model is employed to simulate the frozen soil with the following assumptions:
- (1)
- The permafrost consists of four phases: solid particles, ice, water and a small number of bubbles, where the bubbles dissolve in the water and flow together with the water, which can be regarded as a fluid. The three-phase volume ratios of solid, ice and fluid are ϕs, ϕi and ϕf, respectively, and satisfy: ϕs + ϕi + ϕf = 1. The volume fraction of bubbles in the fluid is sg, and the volume fraction of water in the fluid is sw = (1 − sg). Similarly, ice can also be represented by its volume fraction in the composite solid phase, denoted as I = ϕi/(ϕs + ϕi).
- (2)
- The permafrost is a homogeneous, isotropic saturated or nearly saturated poroelastic medium with the ambient temperature T and the freezing point T0. Although the soil has temperature-dependent thermal and mechanical behaviors, and it is not negligible in the study of consolidation problems [28,29], the time lapse of the wave and dynamical response is very short; correspondingly, the heat transfer has little effect on the wave propagation of frozen soil. Therefore, ignoring the thermodynamic equilibrium equations is feasible.
- (3)
- The effect of salinity and pressure on the freezing temperature of submarine permafrost is ignored.
- (4)
- Ignoring the recharge of groundwater of submarine permafrost, correspondingly, the frost heave is neglected.
- (5)
- The submarine permafrost is infinite and horizontal with an overlying seawater layer and a bedrock underneath, and is subjected to a vertically incident longitudinal wave.
According to these assumptions, the one-dimensional schematic diagram of the deep-sea submarine permafrost is shown in Figure 1.
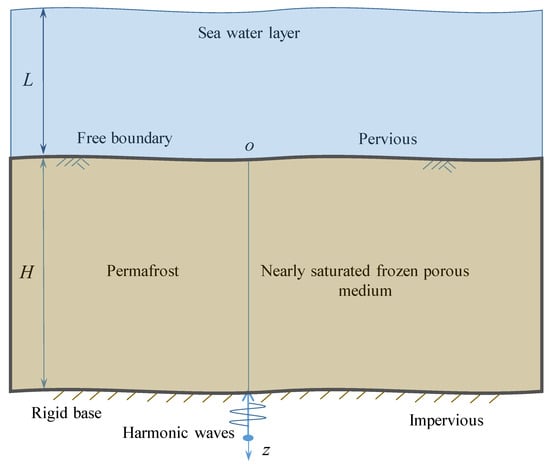
Figure 1.
Schematic diagram of site response of submarine permafrost.
2.2. Governing Equations of the Dynamic Response of Submarine Permafrost
Under plane strain conditions, governing equations of submarine permafrost can be written as:
where , and are the three vertical displacements of the frozen porous medium, and superscripts s, f and i represent the solid, fluid and ice, respectively. z is the vertical coordinate, and t denotes time. ρ11 is the density of soil particles, ρ22 is the fluid density, ρ33 is the density of ice, and ρ12 and ρ23 are the coupling densities of the solid phase and liquid phase, the ice phase and liquid phase, respectively. The viscous coupling coefficients between the soil skeleton and the pore fluid and the ice skeleton and the pore fluid are noted as b11 and b33. , , , , , μ11 and μ33 are the shear moduli of soil and ice, and K1, K2 and K3 are the bulk elastic moduli of the solid, fluid and ice, respectively. Moreover, C12 and C23 are the solid–liquid and the ice–liquid coupling coefficient, respectively.
Based on the assumption that the initial state of the soil layer is static, the mathematical problem can be expressed in a matrix form, by using the Laplace transformation and nondimensionalization, as:
where denotes the dimensionless displacement field vectors of nearly saturated frozen soil, and the matrix [B] is listed as follows:
where the dimensionless coefficients of the unfrozen soil are , , , , , , , , and s is the Laplacian transform of time t. ρ and μ denote the density and shear modulus of unfrozen saturated soil, respectively. H is the thickness of submarine permafrost.
The porosity and ice content are important parameters that affect the properties of the media. Leclaire’s expression of ice content adopts the normal distribution of pores [17]. At a certain temperature, the water in the pores larger than a certain pore size will be frozen. Therefore, the relationship between pore ice content and temperature was calculated.
where erf is the error function, , . rav is the average pore radius, Δr denotes the standard deviation of pore radius, and r0 = 0.228 nm.
The microbubbles contained in the seabed permafrost are affected by the water depth pressure and have a significant impact on the bulk compressive modulus of the fluid phase, which is calculated by the following formula [30]:
where Kf, Kw and Kg are the bulk compressive modulus of fluid phase, water bulk compressive modulus and gas bulk compressive modulus, respectively. The water is regarded as an incompressible fluid; therefore, Kw remains unchanged, and the bulk compressive modulus of the gas varies with water depth (overlying pressure) and temperature, and is calculated as follows:
where ρg is the density of the gas, assuming it does not change with temperature, and the densities of the gas at the corresponding water depths L of 0 m, 12 m, 120 m and 1200 m are 0.712 kg/m3, 1.566 kg/m3, 9.256 kg/m3 and 86.152 kg/m3, respectively. a and b are the pressure correction parameter and volume correction parameter of the van der Waals constant, respectively. For submarine permafrost, the main component is water vapor, a = 0.557 Pa(m3/mol)2, b = 3.1 × 10⁻⁵ (m3/mol). Pa is the standard atmospheric pressure, Pa = 1.01 × 10⁵ Pa; R is the ideal gas constant, generally taken as 8.314 J/(mol·K).
Kf = 1/(sw/Kw + sg/Kg)
2.3. Boundary Conditions
According to the model shown in Figure 1, the seabed is the origin, and the z-axis is downward; a nearly saturated permafrost with a thickness of H is depicted in the following section. The seabed is free and permeable, and the bottom of the submarine permafrost is rigid and impervious. The boundary conditions of the submarine permafrost are expressed as follows:
where , and are the three vertical stresses of the permafrost, respectively. ug(t) can be a random input signal of the displacement on the bedrock; for simplification, ug(t) is described in the sine form with 0.2[1.0 + 0.5sin(2t)] mm. denotes that the overlying water pressure is equal to the hydrodynamic pore pressure under earthquake action [14,15], and denotes the relative fluid displacement of the submarine permafrost.
3. Solution to the Dynamic Problem of Frozen Porous Media
The solutions can be obtained by using the Helmholtz decomposition method of the nearly saturated frozen soil layer, based on the Equations (1)–(3).
where (l = 1, 2, 3) can be obtained by calculating the 6th-order characteristic equation, as listed in Appendix A. and are the undetermined coefficients. and are the correlation coefficients taking into account the correlation in Equation (2), , . Of note, the symbol overbar is omitted for simplicity.
The stresses of the frozen porous media in dimensionless form can be obtained through the stress-strain relationships under the one-dimensional condition.
where , , , , , .
Substituting Equations (8)–(13) into boundary conditions, a matrix equation can be obtained as:
where , , , where , , , , , , ,, , , , , , j = 1, 2, 3. Ug(s) is the Laplacian transform of ug(t).
The coefficient matrix is thus determined, and the one-dimensional site response can be obtained by substituting it into the displacement expression of the permafrost layer. When the amplification coefficient of the submarine ground is defined as , the amplification coefficient of the seabed at z = 0 is:
where AL0 denotes the amplification factor of the seafloor, , and , l = 1, 2, 3.
4. Numerical Verification
To verify the theoretical solution of the submarine permafrost layer, the analytical solution of a saturated soil layer overlaid with a seawater layer given by Chen et al. [15] is employed for comparison. Furthermore, a finite element model for dynamic response of the submarine permafrost layer is established in a general form of partial differential equations of the frozen porous media by using COMSOL Multiphysics software.
4.1. Implementation Method for Dynamic Response of Frozen Porous Medium Using COMSOL
COMSOL Multiphysics software provides a numerical computing platform for multiphysics coupling, the advantage of which is that finite element analysis can be realized from manipulating the governing equations.
The general form of PDE provided in COMSOL software is expressed by:
where Γ is the conserved flux, ea is the mass matrix, da is the damping matrix, and f is the source term.
Corresponding to the frozen porous media, for a two-dimensional plane problem, as shown in Figure 2, the matrix forms of the conserved fluxes can be obtained according to the Equation (2) as:
where conserved fluxes Γ1, Γ2, Σ1, Σ2, Λ1 and Λ2 represent the conserved fluxes in the x and z directions of the solid, liquid and ice phases in the frozen porous media, respectively. Correspondingly, the matrix forms of the inertia term and damping term are:
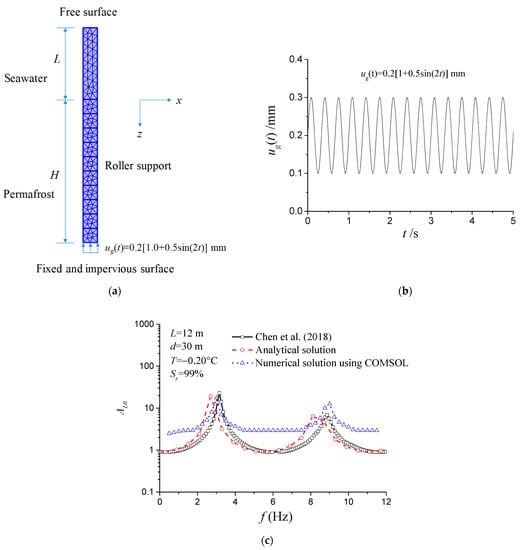
Figure 2.
Finite element model and amplifications of submarine permafrost degraded soil column: (a) diagram of FEM under seawater; (b) harmonic loading; (c) amplification coefficients [14].
In addition, the rest of the expressions can be regarded as source terms:
Since the permafrost layer is located in the deep sea, the overlying seawater layer can be simplified as an ideal fluid and can be treated as a fluid pressure acoustic problem.
4.2. Numerical Verification of Dynamic Response of Soil Column
Figure 2 shows the comparison of the amplification coefficients of the presented analytical solution and numerical solution by COMSOL with the solution given by Chen et al. [15]. As shown in the literature, a nearly saturated (Sr = 99%) soil column model of a deep-sea soil layer with a thickness of 30 m under 12 m water depth is investigated (although the soil layer is divided into two layers in the literature [15], the parameters of the two layers are the same except for the permeability coefficient, and the difference in the permeability coefficient is also small; therefore, it is very close to the single-layer soil case in this section). The dynamic response of a permafrost soil column can be compared with that of an unfrozen saturated soil column when the ice content is close to zero, i.e., the frozen porous media degenerates into saturated soil, as shown in Figure 2a. The column includes the upper water column and the lower soil column with one end fixed and the other free. The soil column height is H, the lateral displacement is limited by the Dirichlet condition, the bottom is fixed and impervious, and the upper is the permeable boundary condition, with the average permeability coefficient of soil ks0 = 5.0 × 10⁻⁹ m2. The other parameters are consistent with those in the literature [15]: ϕs = 0.7, μ = 50 MPa, ρs= 2650 kg/m3, ρi = 920 kg/m3, ρw = 1000 kg/m3, K1 = 36.0 GPa, K2 = 2.0 GPa, K3 = 8.58 GPa, and Poisson ratio υ = 0.333. The bottom of the soil layer is subjected to harmonic signal of displacement, as shown in Figure 2b. Figure 2c shows the comparisons between the amplification coefficient of the degraded permafrost layer under harmonic loading and the results in the literature. In the calculation, the temperature is taken as T = −0.20 °C, and the corresponding ice content of the frozen soil is approximately 0.008, and very close to zero; therefore, the frozen soil can be regarded as consistent with the saturated soil. For comparison, semi-logarithmic coordinates are used in the figure. The theoretical solution in the figure is calculated by Formula (17), and the numerical solution is obtained by parametric sweep in COMSOL Multiphysics software, where the sweep frequency range is 0~12 Hz. As seen from Figure 2c, the theoretical degenerate solution and numerical results are close to the amplification coefficients in the literature. The first resonance frequency of the permafrost layer of the theoretical solution is approximately 2.9 Hz, the second resonance frequency is 8.3 Hz, and the results obtained from the COMSOL numerical model are 3 Hz and 9 Hz, respectively, which are consistent with the theoretical results in the literature [15]. The slight difference in resonance between the numerical and theoretical solution is due to the fact that, in the theoretical model, the upper seawater layer is simplified as the dynamic water pressure acting on the soil layer, while the upper water column is directly used for simulation in the COMSOL model.
The example shows that the analytical and numerical dynamic responses of nearly saturated strata obtained after the degradation of the submarine permafrost model are in good agreement with the existing results in the literature, indicating that the present theoretical and numerical models are reasonable.
5. Parametric Study on Vertical Dynamic Responses of Submarine Permafrost
Using the theoretical method and the COMSOL finite element method, the effects of water depth, saturation and freezing temperature on the vertical site amplifications of submarine permafrost are depicted in the following subsections. The notation list of parameters involved in the calculation can refer to previously published studies by Carcione et al. [18,19,20] and Li et al. [31,32]. For convenience, the main parameters are listed in Appendix B.
5.1. Effect of Water Depth
The submarine permafrost layer is located in the high pressure and low temperature environment. The water depth has an important impact on the site response of the submarine permafrost due to the variations of the bulk compression modulus. The effects of water depth on the site responses of the permafrost are discussed in the two cases of full saturation and near-saturation.
Taking the thickness of the permafrost layer as 30 m and the temperature T = −0.50 °C (ϕi = 0.192), it is found that the influence of water depth varies with saturation. Figure 3 investigates the effects of water depth on the site responses of fully saturated and nearly saturated permafrost layers. As seen from Figure 3a, with an increase in the water depth of the fully saturated submarine permafrost, the resonant frequency of site amplification of the permafrost layer is almost unchanged, regardless of the theoretical calculation or the numerical calculation. This is because the equilibrium of pressure and temperature in frozen soil is ignored in this model, and only the change of pore fluid bulk compressive modulus due to the overlying pressure is considered. Since there are no air bubbles in the fully saturated permafrost layer and the bulk compressive modulus remains unchanged with the water depth, the resonant frequency of site amplification of the permafrost layer is not affected by the variation of water depth under the fully saturated case. In addition, there are some special interferences in the analytical results. This phenomenon does not appear in the degenerate solution in Figure 2. It is deduced that the interference is related to ice content in frozen soil. Figure 3b shows that the resonant frequency gradually increases with an increase in water depth for a nearly saturated soil layer with a saturation of 99%. When the water depth is 12 m, 120 m and 1200 m, the first resonant frequencies are approximately 11.5 Hz, 12.0 Hz and 14.0 Hz, while the second resonant frequencies are approximately 34.5 Hz, 36.0 Hz and 43.0 Hz, respectively. The reasons for these changes are deduced to be because the change of water depth has an obvious effect on the air bubbles in the case of near-saturation. With an increase in water depth, the gas bulk compressive modulus increases, which changes the bulk compressive modulus of the pore fluid, resulting in the change of the resonance frequency of the permafrost layer. Furthermore, as seen from Figure 3, the resonant frequencies of the amplification factors obtained by the analytical and numerical methods are the same, but the peaks are significantly different. The reason is that the two models have different treatment methods for the overlying water layer. In the theoretical calculation, the overlying seawater layer is simplified as dynamic water pressures, while a pressure–acoustic coupling between the seawater layer and the permafrost layer is established in the numerical model; therefore, the latter exhibits more damping than the former.
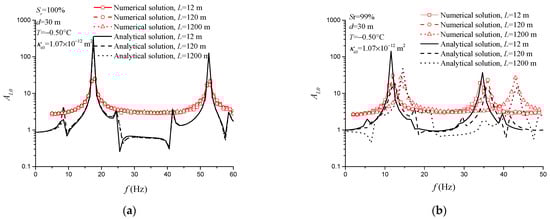
Figure 3.
Influence of water depth on amplification factors of fully saturated/nearly saturated submarine permafrost: (a) fully saturation (Sr = 100%); (b) nearly saturation (Sr = 99%).
5.2. Effect of Saturation
Figure 4 reflects the effect of saturation on the site response of the submarine permafrost layer with a permafrost thickness of 20 m. The temperature is T = −0.40 °C (ϕi = 0.192) and the water depth is L = 120 m. It can be seen that in the deep-sea environment, the saturation has a significant effect on the resonance frequency and a dramatic reduction in resonance frequency of the nearly saturated soil layer is observed. When fully saturated, the first-order resonance frequency of the permafrost layer calculated by analytical and numerical simulation is basically the same, approximately 22.5 Hz. However, if not fully saturated (Sr = 99%), the first resonance frequencies of the analytical and numerical results are also the same, but the frequencies are dropped into approximately 11.5 Hz.
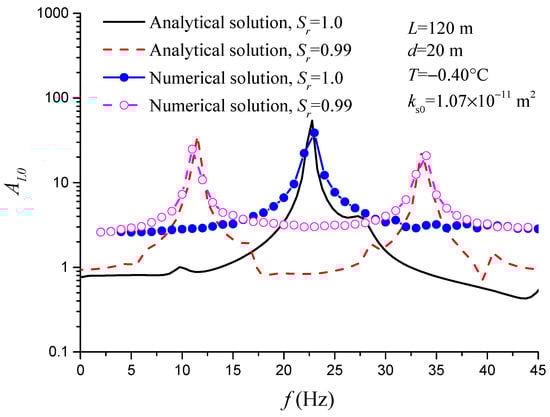
Figure 4.
Comparison of amplification factors of nearly and fully saturated submarine permafrost.
5.3. Effect of the Freezing Temperature
Figure 5 shows the effect of temperature on the amplification factors of the fully saturated and nearly saturated permafrost layers when the permafrost layer thickness is 20 m, the water depth is 120 m, and the permafrost layer saturation is 100% and 99%, respectively. The resonance frequencies obtained by theoretical and numerical models are in good agreement. Seen from Figure 5a, with the decrease in temperature, the resonance frequencies of the fully saturated permafrost layer slightly increase. At temperatures of −0.30 °C (ϕi = 0.067) and −0.40 °C (ϕi = 0.138), the first resonance frequencies are 22.5 Hz and 23.0 Hz, respectively, and the increase in the first resonance frequency is small, at approximately 2%. As seen from Figure 5b, as the temperature decreases, the increase of the resonance frequency of the nearly saturated permafrost layer is significantly higher than that of the fully saturated case. When the temperature decreases from −0.30 °C to −0.40 °C, the first resonance frequencies change from 7.5 Hz to 12 Hz, increasing by 60%. Although saturation is only 1% lower than the full saturation case, the reduction in resonant frequency is 67% and 48% at the temperatures of −0.30 °C and −0.40 °C, respectively.
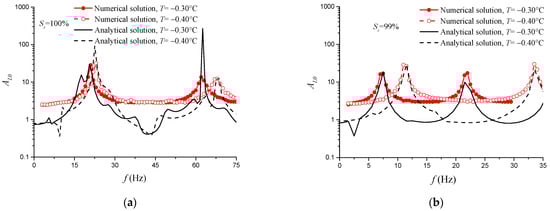
Figure 5.
Effects of temperature on amplification factors of site responses of fully saturated and nearly saturated submarine permafrost: (a) fully saturation (d = 20 m, κs0 = 1.07 × 10⁻¹² m2); (b) nearly saturation (d = 20 m, κs0 = 1.07 × 10⁻¹² m2).
6. Conclusions
Firstly, a simplified dynamic model of the submarine permafrost layer in polar oceans is established based on the nearly saturated frozen porous medium, and the site response is obtained by an analytical method. Then, a finite element model of a vertically dynamic response of submarine permafrost is obtained by using the general forms of partial differential equations in COMSOL Multiphysics software.
Comparison with the one-dimensional site response of an unfrozen soil layer revealed that the submarine permafrost can degenerate into unfrozen soil when the temperature is close to the freezing point. Furthermore, the analytical result is in good agreement with that of the finite element method using COMSOL software.
Finally, several factors affecting the amplification factors of the submarine permafrost layer are investigated, and the results show that the water depth, saturation and temperature are the key parameters affecting the dynamic responses of the submarine permafrost layer. Among them, the change of water depth has an important influence on the amplifications of the permafrost, but this influence depends on whether the permafrost is fully saturated or not. When fully saturated, water depth has little effect on the amplitude-frequency curve. When not fully saturated, the greater the water depth, the greater the resonance frequency. Saturation has a dramatic effect on the amplification factors of submarine permafrost; even with a small decrease in saturation, the resonant frequency drops sharply. The lower the temperature, the higher the resonant frequency of the permafrost layer, and the effect of temperature on the permafrost layer resonance is significantly stronger when it is not fully saturated than when it is fully saturated.
This analytical and numerical method may be useful to obtain insight into the mechanism of site response of the submarine permafrost.
Author Contributions
Conceptualization, Q.L.; methodology, Y.C.; software, Y.W.; validation, Y.C., W.D. and Y.W.; formal analysis, Q.L. and M.W.; investigation, Y.C.; resources, M.W.; data curation, Y.W.; writing—original draft preparation, Y.C.; writing—review and editing, Q.L.; visualization, Y.W.; supervision, Q.L.; project administration, Q.L. and M.W.; funding acquisition, M.W. All authors have read and agreed to the published version of the manuscript.
Funding
This research was funded by the National Natural Science Foundation of China, grant number No. 52108347.
Institutional Review Board Statement
Not applicable.
Informed Consent Statement
Not applicable.
Data Availability Statement
The data presented in this study are available on request from the corresponding author.
Conflicts of Interest
The authors declare no conflict of interest.
Appendix A
Appendix B

Table A1.
Material properties of frozen porous medium.
Table A1.
Material properties of frozen porous medium.
| ρs/kg·m−3 | ρi/kg·m−3 | ρf/kg·m−3 | ϕs/ | Ks/GPa | Ki/GPa | Kf/GPa | μs/GPa | μi/GPa | μ/GPa |
|---|---|---|---|---|---|---|---|---|---|
| 2700 | 920 | 1000 | 0.6 | 36.0 | 8.58 | 2.25 | 28.7 | 3.7 | 0.08 |
References
- Necci, A.; Tarantola, S.; Vamanu, B.; Krausmann, E.; Ponte, L. Lessons Learned from Offshore Oil and Gas Incidents in the Arctic and Other Ice-Prone Seas. Ocean Eng. 2019, 185, 12–26. [Google Scholar] [CrossRef]
- Angelopoulos, M.; Overduin, P.P.; Miesner, F.; Grigoriev, M.N.; Vasiliev, A.A. Recent Advances in the Study of Arctic Submarine Permafrost. Permafr. Periglac. Process. 2020, 31, 442–453. [Google Scholar] [CrossRef]
- Overduin, P.P.; Haberland, C.; Ryberg, T.; Kneier, F.; Jacobi, T.; Grigoriev, M.N.; Ohrnberger, M. Submarine Permafrost Depth from Ambient Seismic Noise. Geophys. Res. Lett. 2015, 42, 7581–7588. [Google Scholar] [CrossRef]
- Overduin, P.P.; Schneider von Deimling, T.; Miesner, F.; Grigoriev, M.N.; Ruppel, C.; Vasiliev, A.; Lantuit, H.; Juhls, B.; Westermann, S. Submarine Permafrost Map in the Arctic Modeled Using 1-D Transient Heat Flux (SuPerMAP). J. Geophys. Res. Ocean. 2019, 124, 3490–3507. [Google Scholar] [CrossRef]
- Brothers, L.L.; Herman, B.M.; Hart, P.E.; Ruppel, C.D. Subsea Ice-Bearing Permafrost on the U.S. Beaufort Margin: 1.Minimum Seaward Extent Defined from Multichannel Seismic Reflection Data. Geochem. Geophys. Geosyst. 2016, 17, 4354–4365. [Google Scholar] [CrossRef]
- Nicolsky, D.J.; Romanovsky, V.E.; Romanovskii, N.N.; Kholodov, A.L.; Shakhova, N.E.; Semiletov, I.P. Modeling Sub-Sea Permafrost in the East Siberian Arctic Shelf: The Laptev Sea Region. J. Geophys. Res. Earth Surf. 2012, 117, 1–22. [Google Scholar] [CrossRef]
- Shakhova, N.E.; Nicolsky, D.Y.; Semiletov, I.P. Current State of Subsea Permafrost on the East Siberian Shelf: Tests of Modeling Results Based on Field Observations. Dokl. Earth Sci. 2009, 429, 1518–1521. [Google Scholar] [CrossRef]
- Chen, M.; Kim, J.H.; Lee, Y.K.; Lee, D.H.; Jin, Y.K.; Hur, J. Subsea Permafrost as a Potential Major Source of Dissolved Organic Matter to the East Siberian Arctic Shelf. Sci. Total Environ. 2021, 777, 146100. [Google Scholar] [CrossRef]
- Semenov, P.; Portnov, A.; Krylov, A.; Egorov, A.; Vanshtein, B. Geochemical Evidence for Seabed Fluid Flow Linked to the Subsea Permafrost Outer Border in the South Kara Sea. Chem. Der Erde 2020, 80, 125509. [Google Scholar] [CrossRef]
- Li, C.; Hao, H.; Li, H.; Bi, K. Theoretical Modeling and Numerical Simulation of Seismic Motions at Seafloor. Soil Dyn. Earthq. Eng. 2015, 77, 220–225. [Google Scholar] [CrossRef]
- Han, B.; Zdravkovic, L.; Kontoe, S. Analytical and Numerical Investigation of Site Response Due to Vertical Ground Motion. Geotechnique 2018, 68, 467–480. [Google Scholar] [CrossRef]
- Yang, J.; Sato, T. Analytical Study of Saturation Effects on Seismic Vertical Amplification of a Soil Layer. Geotechnique 2001, 51, 161–165. [Google Scholar] [CrossRef]
- Li, W.; Zheng, J.; Trifunac, M.D. Saturation Effects on Ground Motion of Unsaturated Soil Layer-Bedrock System Excited by Plane P and SV Waves. Soil Dyn. Earthq. Eng. 2018, 110, 159–172. [Google Scholar] [CrossRef]
- Chen, W.Y.; Wang, Z.H.; Chen, G.X.; Jeng, D.S.; Wu, M.; Zhao, H.Y. Effect of Vertical Seismic Motion on the Dynamic Response and Instantaneous Liquefaction in a Two-Layer Porous Seabed. Comput. Geotech. 2018, 99, 165–176. [Google Scholar] [CrossRef]
- Chen, W.; Jeng, D.; Chen, W.; Chen, G.; Zhao, H. Seismic-Induced Dynamic Responses in a Poro-Elastic Seabed: Solutions of Different Formulations. Soil Dyn. Earthq. Eng. 2020, 131, 106021. [Google Scholar] [CrossRef]
- Li, X.B.; Zhang, Z.Q.; Pan, E.N. Wave-induced dynamic response in a transversely isotropic and multilayered poroelastic seabed. Soil Dyn. Earthq. Eng. 2020, 139, 106365. [Google Scholar] [CrossRef]
- Leclaire, P.; Cohen-Ténoudji, F.; Aguirre-Puente, J. Extension of Biot’s Theory of Wave Propagation to Frozen Porous Media. J. Acoust. Soc. Am. 1994, 96, 3753–3768. [Google Scholar] [CrossRef]
- Carcione, J.M.; Seriani, G. Wave Simulation in Frozen Porous Media. J. Comput. Phys. 2001, 170, 676–695. [Google Scholar] [CrossRef]
- Carcione, J.M.; Santos, J.E.; Ravazzoli, C.L.; Helle, H.B. Wave Simulation in Partially Frozen Porous Media with Fractal Freezing Conditions. J. Appl. Phys. 2003, 94, 7839–7847. [Google Scholar] [CrossRef]
- Santos, J.E.; Ravazzoli, C.L.; Carcione, J.M. A Model for Wave Propagation in a Composite Solid Matrix Saturated by a Single-Phase Fluid. J. Acoust. Soc. Am. 2004, 115, 2749–2760. [Google Scholar] [CrossRef]
- Du, C.; Li, D.; Ming, F.; Liu, Y.; Shi, X. Wave Propagation Characteristics in Frozen Saturated Soil. Sci. Cold Arid Reg. 2018, 10, 95–103. [Google Scholar] [CrossRef]
- Santos, J.E.; Gauzellino, P.M.; Carcione, J.M.; Ba, J. Effective Viscoelastic Representation of Gas-Hydrate Bearing Sediments from Finite-Element Harmonic Experiments. Comput. Geosci. 2021, 25, 2005–2017. [Google Scholar] [CrossRef]
- Yang, Z.J.; Dutta, U.; Xu, G.; Hazirbaba, K.; Marx, E.E. Numerical Analysis of Permafrost Effects on the Seismic Site Response. Soil Dyn. Earthq. Eng. 2011, 31, 282–290. [Google Scholar] [CrossRef]
- Chen, T.; Ma, W.; Zhou, G. Numerical Analysis of Ground Motion Characteristics in Permafrost Regions along the Qinghai-Tibet Railway. Cold Reg. Sci. Technol. 2018, 148, 88–95. [Google Scholar] [CrossRef]
- Wang, L.; Wu, Z.; Sun, J.; Liu, X.; Wang, Z. Characteristics of Ground Motion at Permafrost Sites along the Qinghai-Tibet Railway. Soil Dyn. Earthq. Eng. 2009, 29, 974–981. [Google Scholar] [CrossRef]
- Qi, J.; Ma, W.; Sun, C.; Wang, L. Ground Motion Analysis in Seasonally Frozen Regions. Cold Reg. Sci. Technol. 2006, 44, 111–120. [Google Scholar] [CrossRef]
- Xu, G.; Yang, Z.; Dutta, U.; Tang, L.; Marx, E. Seasonally Frozen Soil Effects on the Seismic Site Response. J. Cold Reg. Eng. 2011, 25, 53–70. [Google Scholar] [CrossRef]
- Wen, M.; Tian, Y.; Li, L.; Qiu, X.; Wang, K.; Wu, W.; Mei, G.; Xu, M. A general interfacial thermal contact model for consolidation of bilayered saturated soils considering thermos-osmosis effect. Int. J. Numer. Analyt. Meth. Geomech. 2022, 46, 2375–2397. [Google Scholar] [CrossRef]
- Wen, M.; Tian, Y.; Li, L.; Wang, K.; Wu, W. An imperfect thermal contact problem for consolidation of bilayered saturated soil subjected to a ramp-type heating. Int. J. Heat Mass Transf. 2022, 190, 122755. [Google Scholar] [CrossRef]
- Gei, D.; Carcione, J.M. Acoustic Properties of Sediments Saturated with Gas Hydrate, Free Gas and Water. Geophys. Prospect. 2003, 51, 141–158. [Google Scholar] [CrossRef]
- Li, Q.; Shu, W.; Cao, L.; Duan, W.; Zhou, B. Vertical vibration of a single pile embedded in a frozen saturated soil layer. Soil Dyn. Earthq. Eng. 2019, 122, 185–195. [Google Scholar] [CrossRef]
- Li, Q.; Shu, W.; Duan, W.; Cao, L. Vertical vibration of a pile in a double-layered stratum under the freezing and thawing processes of saturated porous media. Cold Reg. Sci. Technol. 2020, 169, 102891. [Google Scholar] [CrossRef]
Publisher’s Note: MDPI stays neutral with regard to jurisdictional claims in published maps and institutional affiliations. |
© 2022 by the authors. Licensee MDPI, Basel, Switzerland. This article is an open access article distributed under the terms and conditions of the Creative Commons Attribution (CC BY) license (https://creativecommons.org/licenses/by/4.0/).