Article

An Auto-Extraction Framework for CEP Rules Based on the Two-Layer LSTM Attention Mechanism: A Case Study on City Air Pollution Forecasting

1
Ministry of Education Key Laboratory for Modern Teaching Technology, Shaanxi Normal University, Xi’an 710119, China
2
School of Computer Science, Shaanxi Normal University, Xi’an 710062, China
3
School of Computer Science and Electronic Engineering, University of Essex, Colchester CO4 3SQ, UK
4
School of Computing and Engineering, University of Huddersfield, Huddersfield HD1 3DH, UK
*
Authors to whom correspondence should be addressed.
Energies 2022, 15(16), 5892; https://doi.org/10.3390/en15165892
Submission received: 12 July 2022 / Revised: 5 August 2022 / Accepted: 10 August 2022 / Published: 14 August 2022
(This article belongs to the Special Issue Internet of Energy and Artificial Intelligence for Sustainable Cities)

Abstract

:
Energy is at the center of human society and drives the technologies and overall human well-being. Today, artificial intelligence (AI) technologies are widely used for system modeling, prediction, control, and optimization in the energy sector. The internet of things (IoT) is the core of the third wave of the information industry revolution and AI. In the energy sector, tens of billions of IoT appliances are linked to the Internet, and these appliances generate massive amounts of data every day. Extracting useful information from the massive amount of data will be a very meaningful thing. Complex event processing (CEP) is a stream-based technique that can extract beneficial information from real-time data through pre-establishing pattern rules. The formulation of pattern rules requires strong domain expertise. Therefore, at present, the pattern rules of CEP still need to be manually formulated by domain experts. However, in the face of complex, massive amounts of IoT data, manually setting rules will be a very difficult task. To address the issue, this paper proposes a CEP rule auto-extraction framework by combining deep learning methods with data mining algorithms. The framework can automatically extract pattern rules from unlabeled air pollution data. The deep learning model we presented is a two-layer LSTM (long short-term memory) with an attention mechanism. The framework has two phases: in the first phase, the anomalous data is filtered out and labeled from the IoT data through the deep learning model we proposed, and then the pattern rules are mined from the labeled data through the decision tree data mining algorithm in the second phase. We compare other deep learning models to evaluate the feasibility of the framework. In addition, in the rule extraction stage, we use a decision tree data mining algorithm, which can achieve high accuracy. Experiments have shown that the framework we proposed can effectively extract meaningful and accurate CEP rules. The research work in this paper will help support the advancement of the sector of air pollution prediction, assist in the establishment of air pollution regulatory strategies, and further contribute to the development of a green energy structure.

1. Introduction

The energy industry is at a crossroads of development [1], and the efficient use of energy is a pressing issue to be addressed. The emergence of artificial intelligence provides an emerging impetus and solution for the development of the energy industry. With the fast-growing popularity and utilization of the IoT in the energy sector, AI technologies can provide increased opportunities for the development of the energy industry [2].
Today, the IoT is one of the most widely adopted and fastest growing technologies. It has a major impact on our daily lives in many respects, including the economy, society, health, and so on [3]. At the same time, the IoT has a broad range of applications in many areas, such as energy [4], smart transportation [5], emergency services [6], smart manufacturing [7], and e-health [8]. The IoT can also help the energy sector by increasing the share of renewable energy sources and reducing the environmental impact of energy consumption.
With the development of the internet of things, hundreds of millions of devices, such as sensors and mobile phones, will be connected to the Internet in the energy sector. The volume, speed, and diversity of data produced by this equipment are showing explosive growth [9]. In addition, the continuous data produced by this equipment require real-time analysis and processing [10,11]. The processed IoT data can provide valuable information to users, businesses, and society [12,13]. However, as IoT data continue to grow in size and variety, there will be situations where it is necessary to analyze heterogeneous data streams and detect complex patterns in near real-time, so there will be significant scope for complex event processing [14] in the IoT sector.
Complex event processing (CEP) is a relatively complex event processing framework based on dynamic environmental event streams, which enables real-time analysis of complex events [15,16]. It regards system data as different types of events and establishes different event relationship sequence libraries by analyzing the relationship among events. CEP uses technologies such as filtering, association, aggregation, and pattern matching to generate advanced events from simple events [17]. Figure 1 illustrates the basic framework of the CEP. CEP has three main components: data resources, the CEP engine, and the event consumer. The data streams generated by sensors are sent to the CEP engine. The CEP engine captures complicated events from a single atomic event and reveals meaningful and valued information based on CEP rules pre-defined by domain experts. Then, the results are used by the event consumer such as the forecasting system, alert system, etc.
Most IoT applications generate huge amounts of data, such as smart cities, various sensors (temperature, air quality), etc. These data must be analyzed in near real-time for better decision-making. However, these data often require technical support that can process complex events with minimal time delay. With its high processing speed and high throughput performance, CEP provides a good solution to the above problems. The CEP is ideal for many IoT applications due to its ability to perform distributed and parallel computing [18].
However, CEP also has some shortcomings. So far, the formulation of CEP rules still needs to be manually formulated by experts in professional fields. When the data to be generated are single and contain few attributes, this method is still feasible. However, as IoT technology develops, the diversity and complexity of data generated by IoT applications continue to grow, which makes it difficult to manually formulate rules. Moreover, due to the constant change and rapid update of IoT data, previously established rules require to be renewed within a certain period of time. At this time, manually formulating CEP rules will consume huge human, material, and financial resources, so we need to take other methods to automatically generate CEP rules.
In this paper, we propose LAD (two-layer LSTM [19] attention mechanism [20] with decision tree [21]), a framework for the auto-extraction of CEP rules. The framework can extract pattern rules from untagged IoT data automatically. We validate the feasibility of the framework with a real-world air quality dataset. As manufacturing, industrial technology, and urban transport develop, various pollutants emitted have caused more and more serious air pollution [22]. Some scholars proposed a number of approaches to air pollution prediction to improve the reliability and sustainability of the predictions. Todorov et al. [23] proposed an innovative digital stochastic method for multidimensional sensitivity analysis in air pollution modeling. This approach allowed the assessment of the impact of harmful emissions on human health. In addition, with the growing urban population, the air quality situation in large urban agglomerations is also facing serious problems [23]. Facing the declining trend of global air quality, all countries have strengthened the monitoring of air pollution gases (sulfur dioxide, particulate matter, ozone, nitrogen dioxide, carbon monoxide) [24], and control the impact of air pollution gases on human health and ecosystems [25]. It is easy to deploy air quality sensors indoors and outdoors, and the air quality data gathered can be made known to the public in real time, reminding the public to take precautions [26]. Therefore, being able to process abnormal air data and make decisions promptly will bring great value to society. At the same time, the prediction of urban air pollution can make a very important contribution to controlling the emergence of pollution, which is also conducive to energy saving and emission reduction, adjusting the energy structure, and accelerating the construction of energy intelligence. In the first phase of the LAD framework, we label the unlabeled air quality data by using the deep learning model we proposed. We then extract the CEP rules using a decision tree rule mining approach in the second phase. The CEP rules will be sent to the CEP engine to detect the alert air data.
The contributions are as follows:
  • We propose a novel framework LAD for the automatic extraction of CEP rules by combining a two-layer LSTM attention mechanism with a decision tree data mining approach.
  • We present a method for predicting air quality data and extracting meaningful CEP rules based on the LAD. The extracted CEP rules can be used to monitor the incoming air quality data stream in real time through the CEP engine.
The structure of this paper is given below: Section 2 presents research in the literature on automatic CEP rule extraction. Section 3 presents the design and implementation details of the framework and some related knowledge. In Section 4, we introduce the experimental results using a real-world air quality dataset, which proves the feasibility of our framework. We include the results of the comparison with other papers in the same field in Section 5. Finally, in Section 6, we draw conclusions and give our perspective for future work.

2. Related Work

Recently, a number of proposals for automatic mining of CEP rules have been released, yet the automatic acquisition of CEP rules is still an open issue [27]. In previous studies, some academics proposed CEP editors to help non-CEP domain experts build CEP rules [28]. Some scholars proposed the method to update CEP rules by using machine learning under some existing CEP rules [29]. Other scholars proposed some methods to extract and generate CEP rules that satisfy the conditions by using machine learning, deep learning methods, or rule mining methods. In the next paragraphs, we describe each of these solutions.
Boubeta-Puig et al. [28] proposed MEdit4CEP, a model-driven solution for real-time decision making in event-driven SOAs. This model allowed any user, whether a programmer or a CEP expert, to extract CEP rules from real-time information using the CEP event pattern graphic editor.
Sun et al. [29] proposed an automatic rule update method under existed CEP rules based on machine learning. Machine learning is performed on the changed rules to form new rules.
Mehdiyev et al. [27] used rule-based classifiers (OneR classifier, PART classifier, RIPPER classifier) to extract CEP rules to match events. The authors processed the users’ physical activity sensor data and then sent the processed data to rule classifiers to form CEP rules. They also compared the performance of several types of rule classification models and proved the feasibility of the method. Similarly, Naseri et al. [30] also used the same rule-based classifiers to perform rule learning on the hospital dataset to extract CEP rules.
Petersen et al. [31] extracted CEP rules from unlabeled data by combining the X-means clustering method with the SVM classification algorithm. The authors applied this approach to a real-world data set to demonstrate that their method works. Margara et al. [32] presented a solution for CEP with automatic rule generation, which was named iCEP. The method learns the hidden causal relationship between the received events and the events to be detected from historical data by applying crossover techniques and automatically generates CEP rules from them.
Simsek et al. [33] proposed an automatic extraction framework for CEP rules based on deep learning methods called ARECEP. The framework is divided into two stages. In the first phase, the authors used deep learning algorithms to perform regression prediction on IoT data. In the second stage, the authors used some common data mining algorithms to extract CEP rules. In [10], the authors first used the Canopy algorithm to select the cluster center and the optimal K values from the unlabeled IoT data, and then used the obtained data as the parameters of the K-means algorithm to classify and label the IoT data. The CEP rules were then mined from the data obtained during the first stage using a rule mining algorithm, as described previously. To our knowledge, our paper is the first research to use two LSTM layers attention mechanism with decision tree rule mining methods for automatic rule extraction in a CEP system.

3. The Introduction of LAD

In this section, we first show the overall design idea of LAD. Next, we introduce the two stages included in the framework in detail.

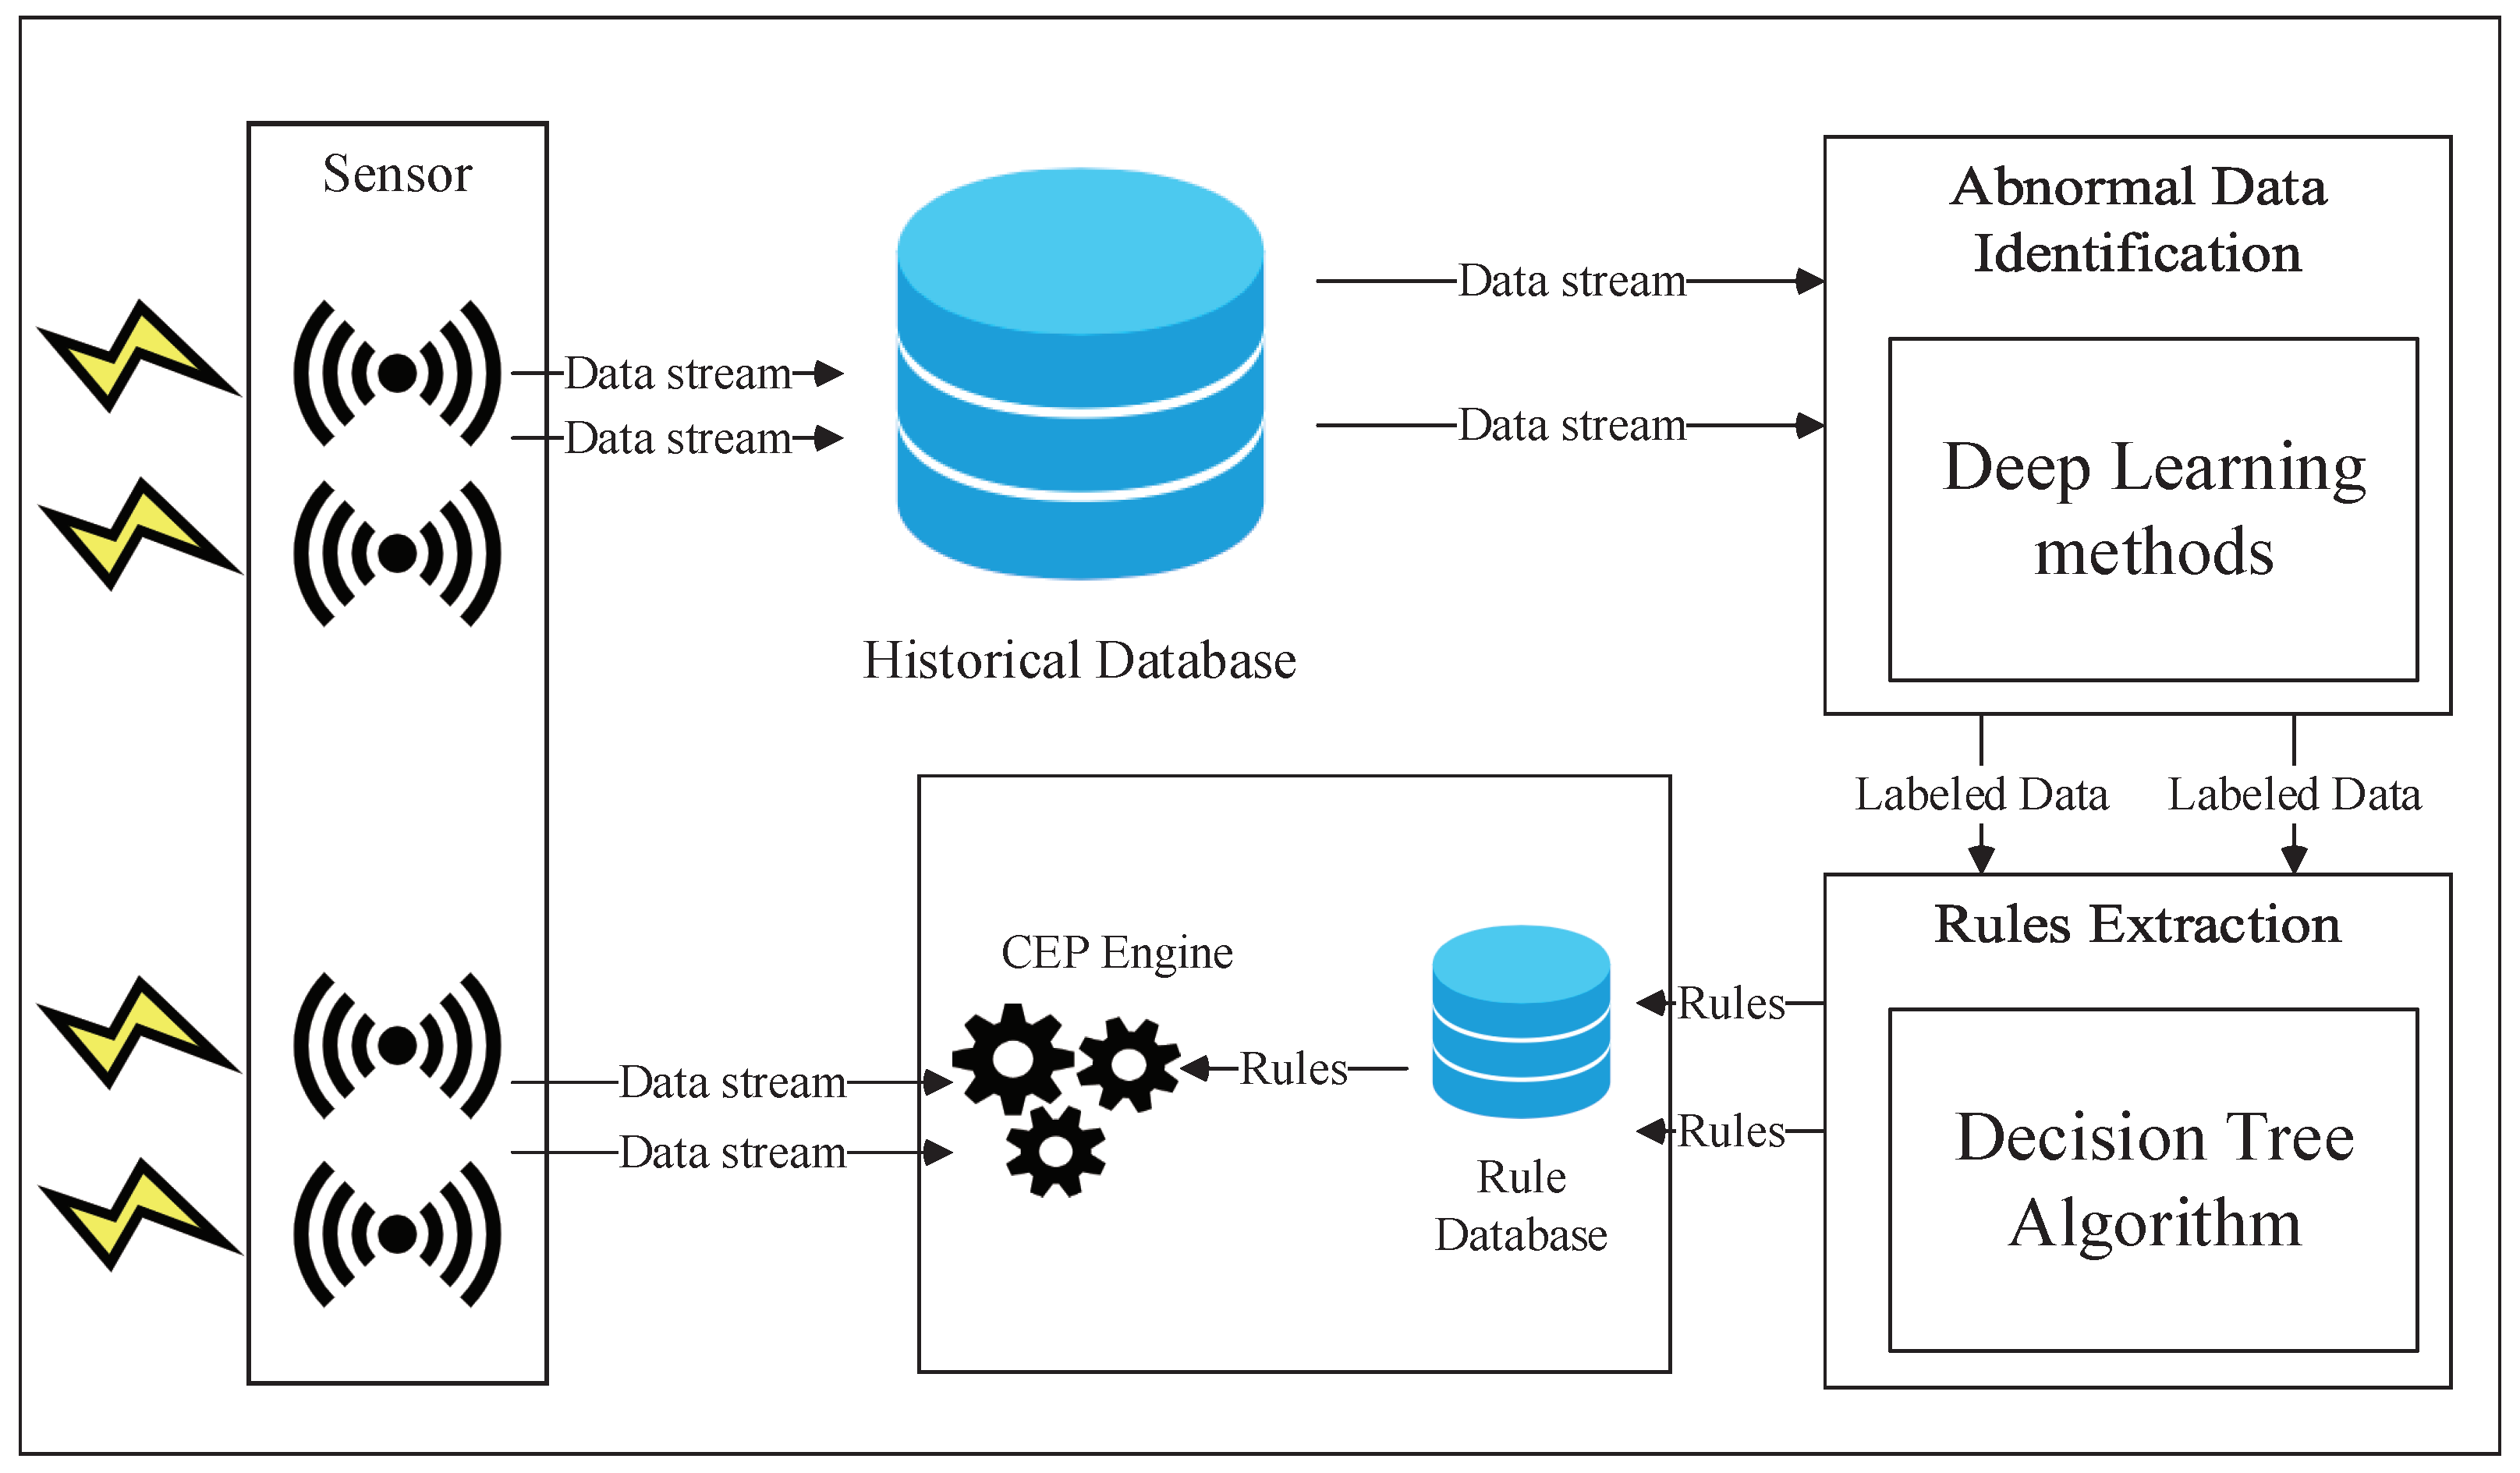
3.1. The Structure of Framework

The structure of LAD can be seen in Figure 2. First, the data collected by IoT sensors will be stored in a historical database. These historical data will be processed and analyzed by LAD. The framework contains two phases. We use deep learning methods to filter historical data for abnormal data and label the data in the first phase. This lays the groundwork for the extraction of CEP rules in the second phase. Then we extract CEP rules by using a decision tree data mining method from the labeled data in the second phase. These extracted rules will be fed into the CEP engine for risk identification on the data received by the sensors.

3.2. The First Phase: Abnormal Data Identification

In this phase, we will introduce our proposed two-layer LSTM attention mechanism model and how we filter out anomalous data.

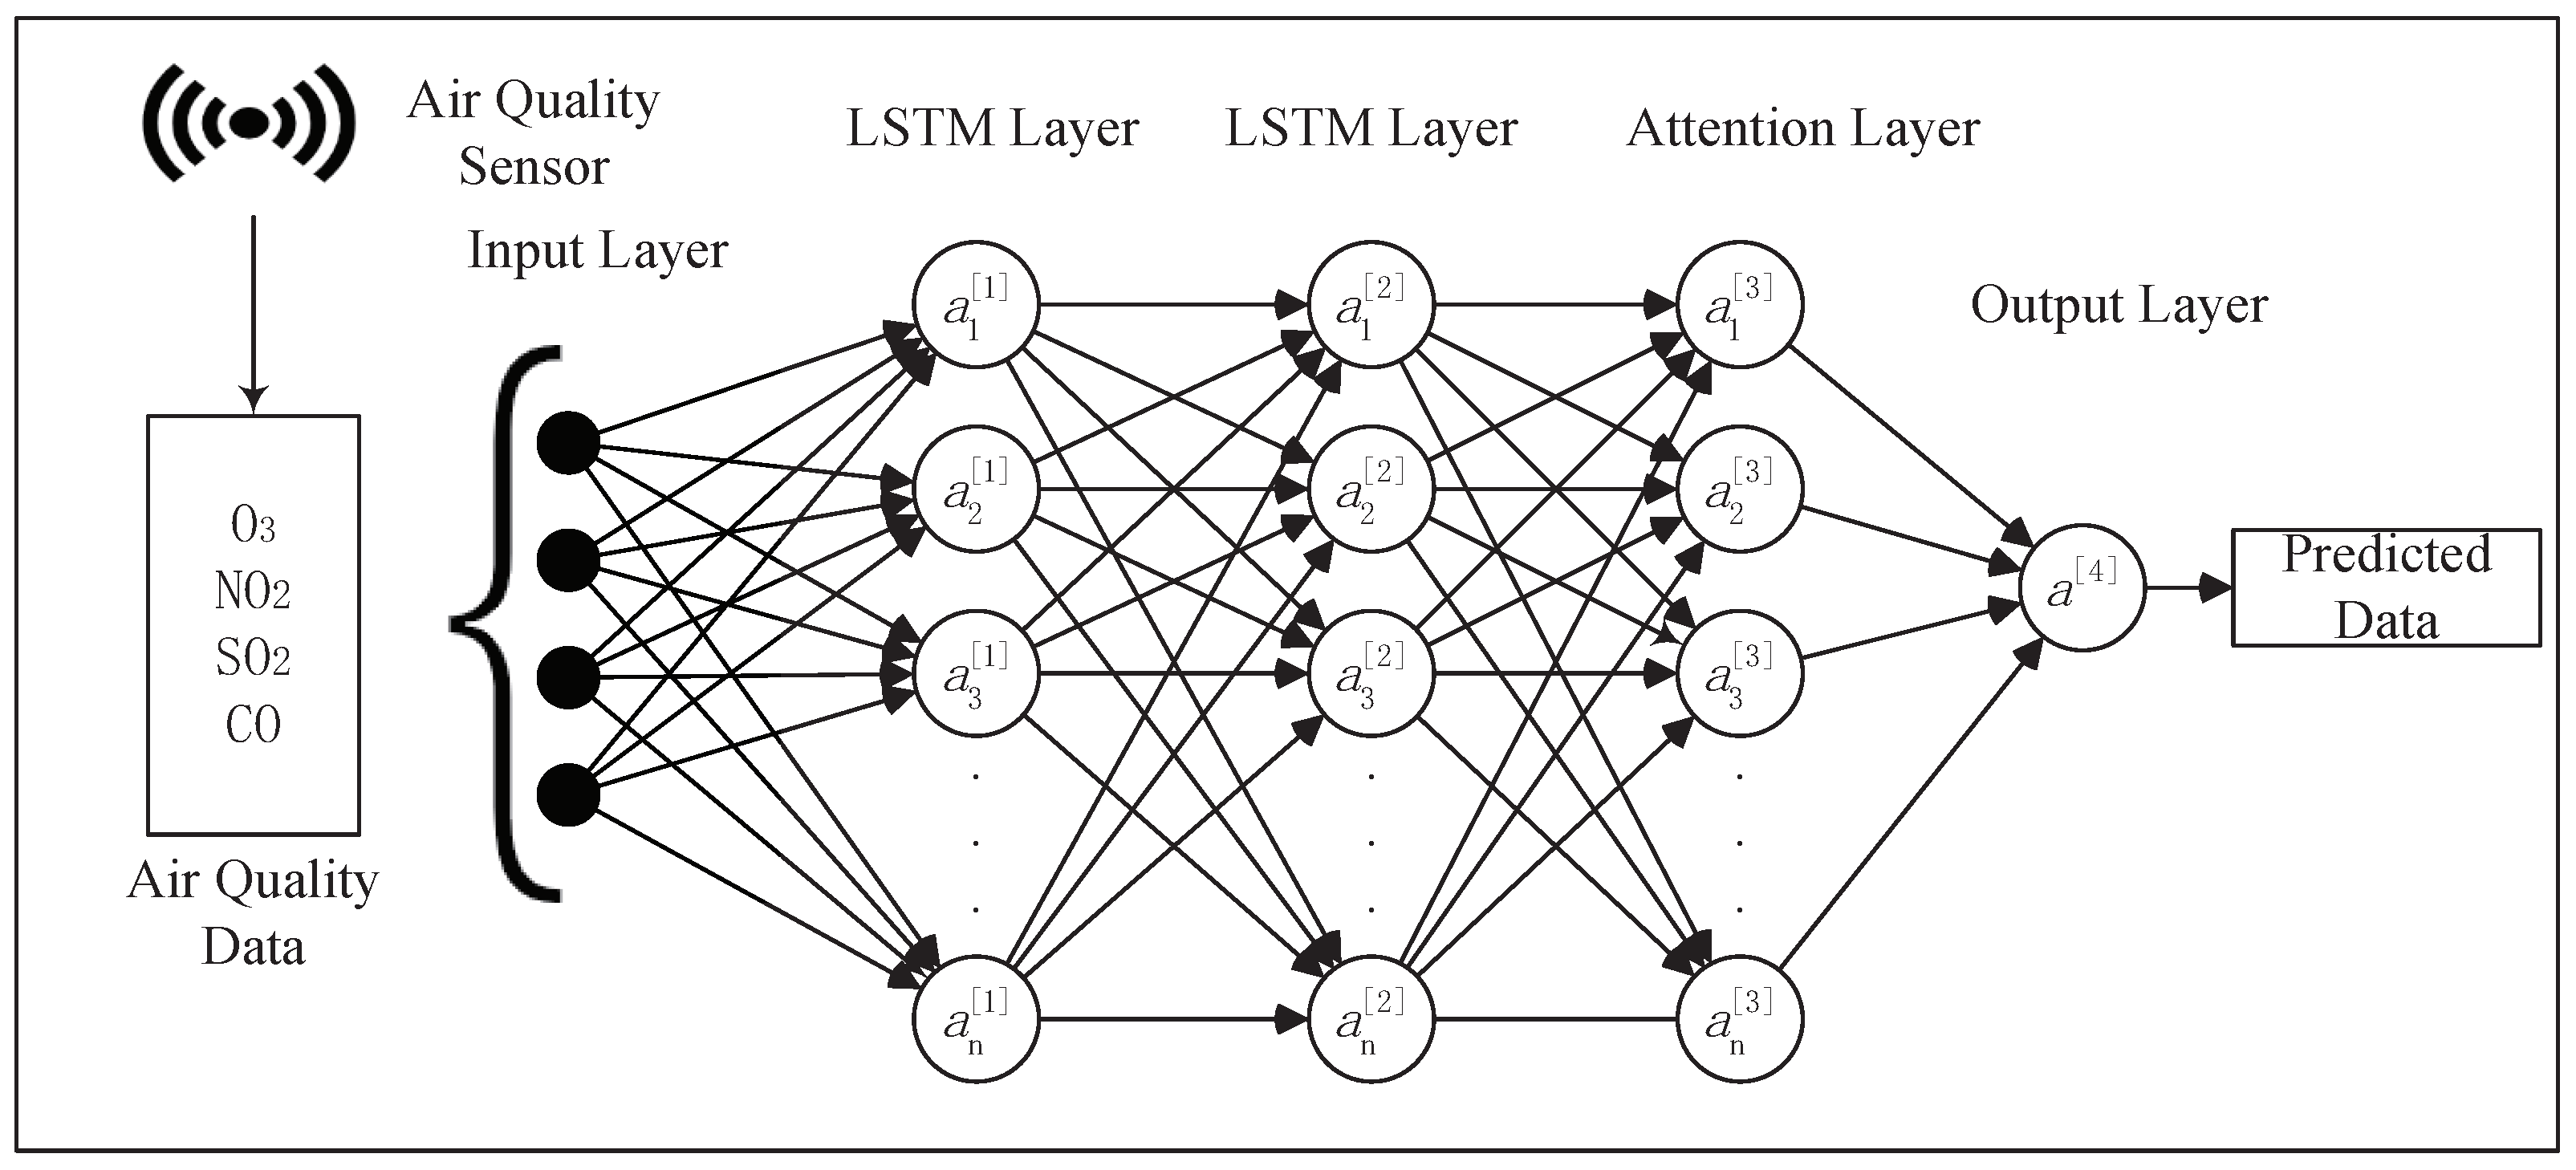
3.2.1. Two-Layer LSTM Attention Mechanism Model
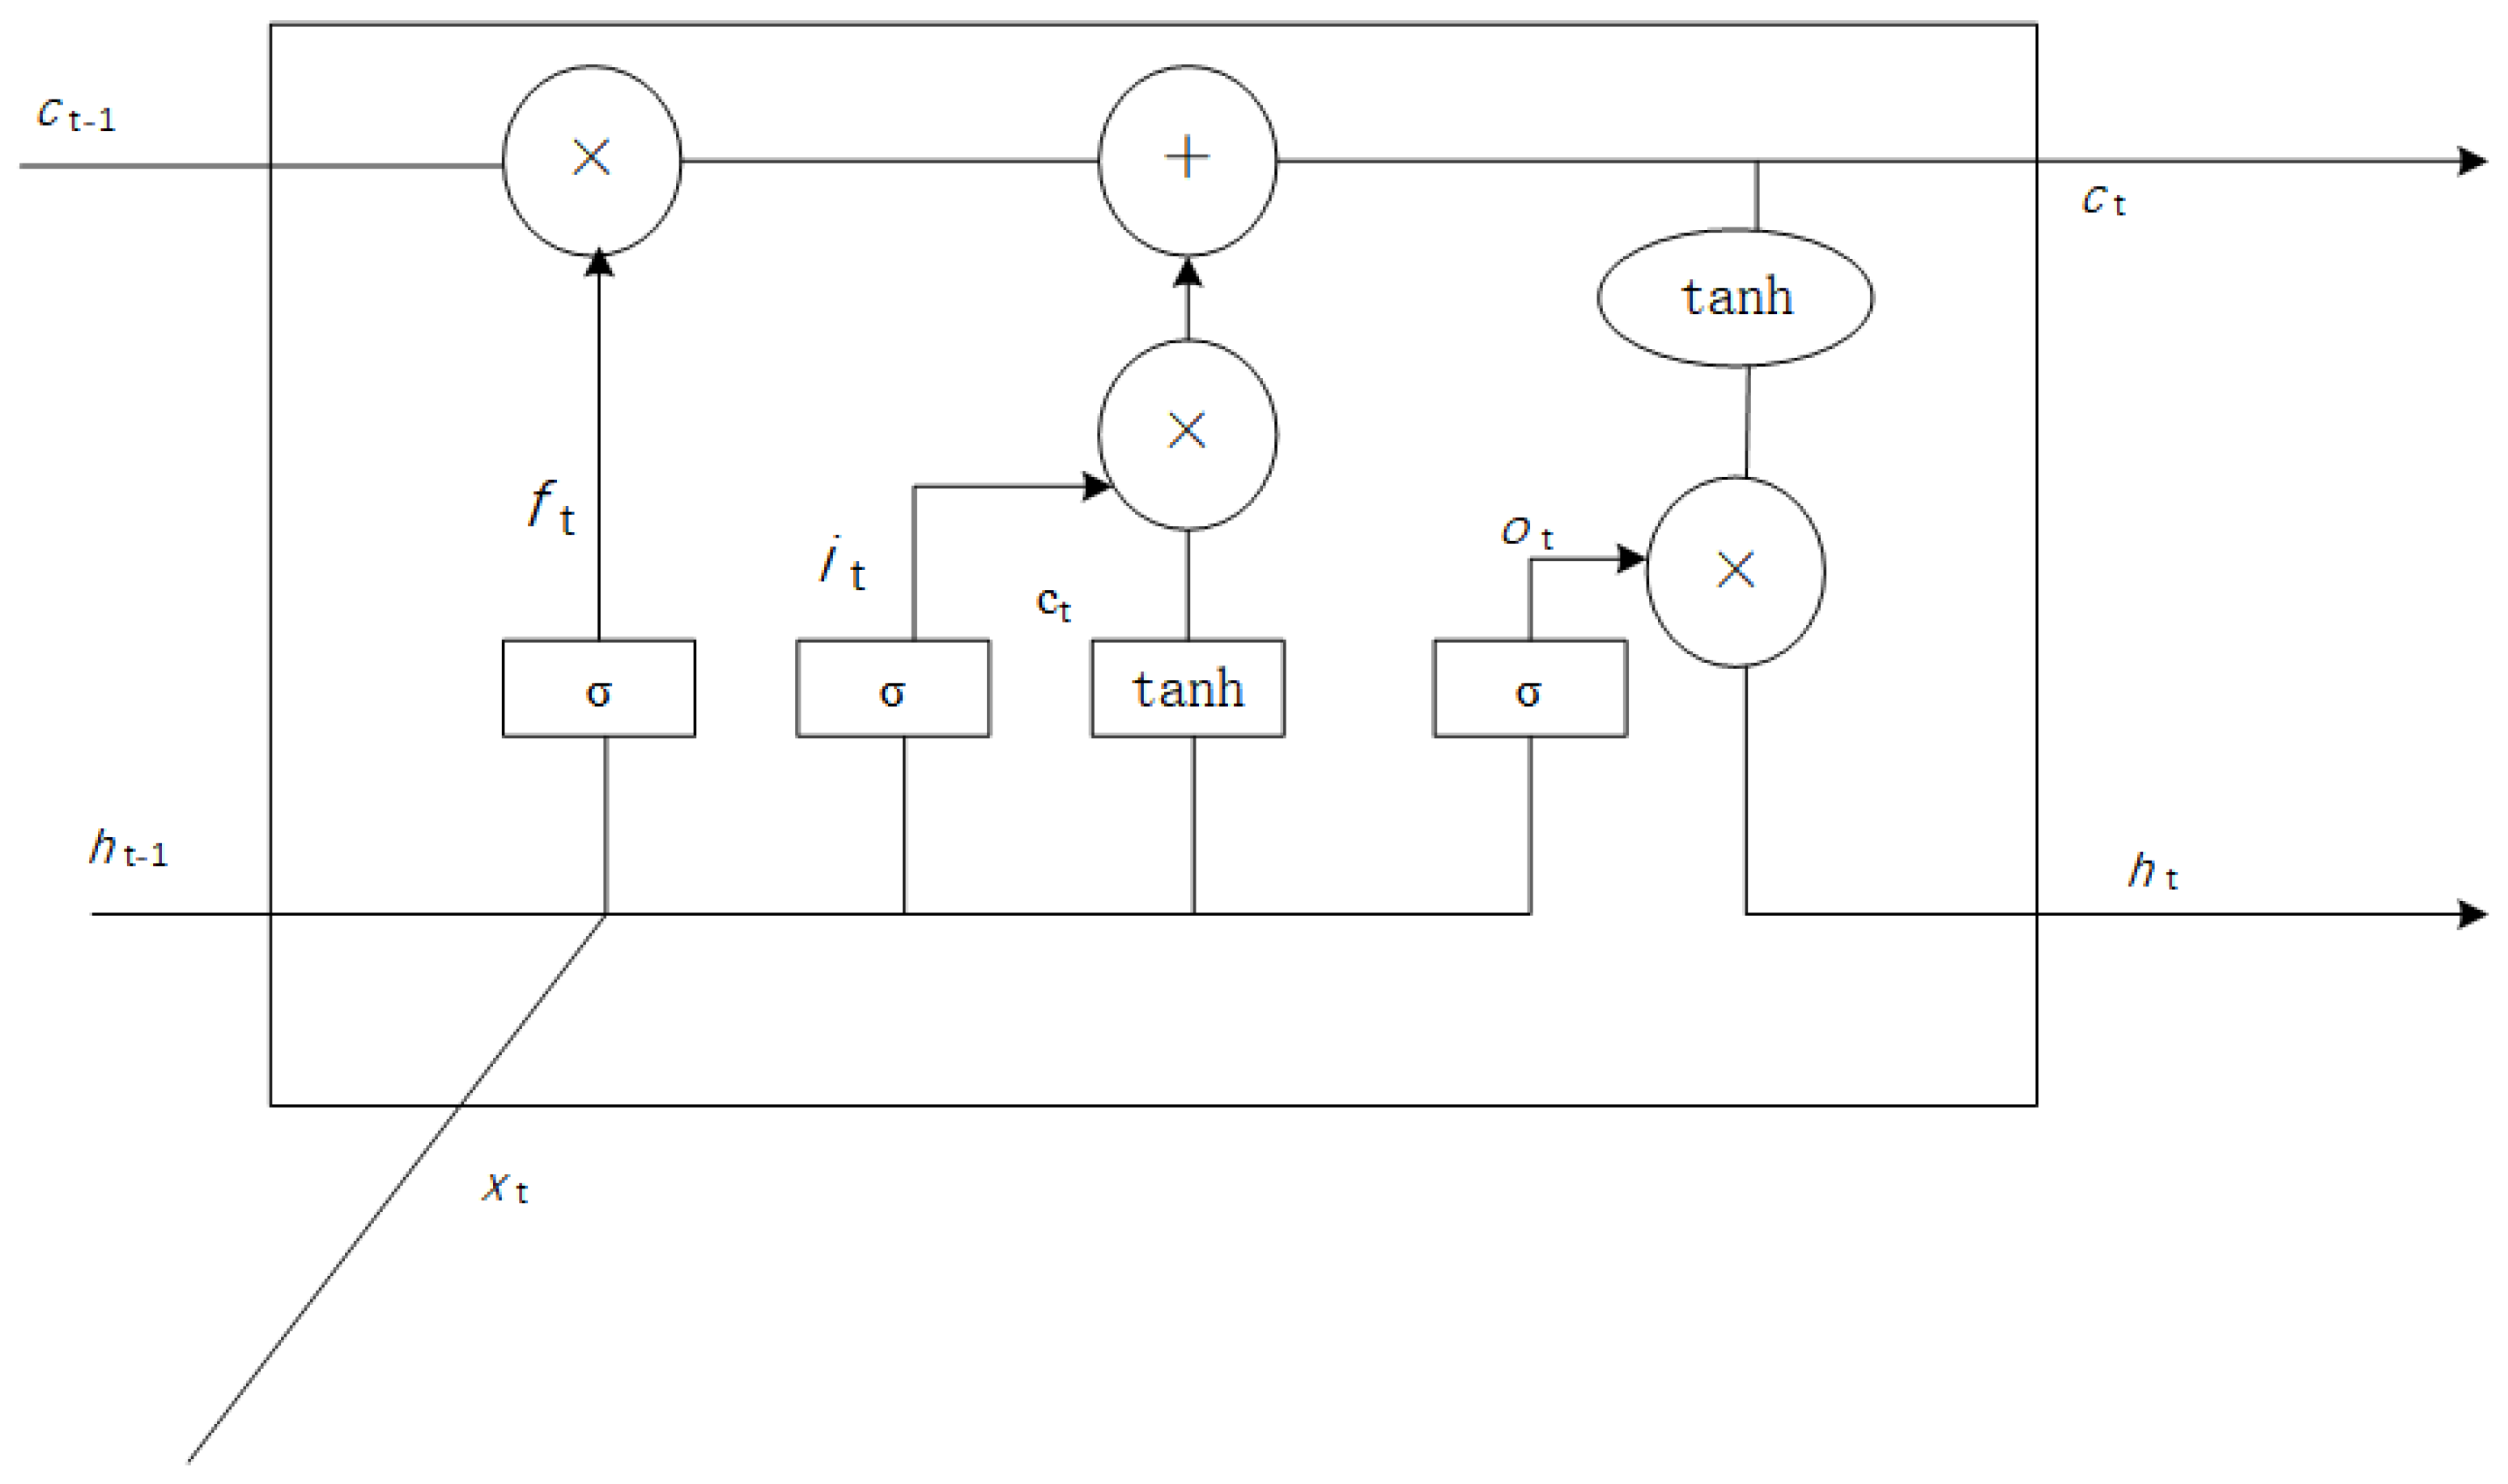
Figure 3 shows the basic structure of the model. This model is composed of an input layer, two LSTM layers, an attention layer, and an output layer.
First, the first LSTM layer acquires the long-running relationships between the attributes of the pre-processed IoT data. Then, the attention layer will learn the percentage of important attributes of the states hidden by the two LSTM layers. At last, a weighted sum is obtained as an output and a prediction is made.

3.2.2. LSTM Layer

The processed IoT data is fed into the LSTM layer. The LSTM is a modified recurrent neural network (RNN) that can address the long-distance dependency issue that RNNs are not able to handle. Compared to the hidden state of the original RNN, the LSTM adds a cell state. This cell state can update information in a timely manner and maintain the state of long-term memory [34]. The cell structure and connections of the LSTM are shown in Figure 4. An LSTM cell is made up of three basic types of gates: output gates, input gates, and forgetting gates. An LSTM cell can be calculated in the following way [35]:
f t = σ ( W f h h t 1 + W f x x t + b f )
i t = σ ( W i h h t 1 + W i x x t + b i )
c ˜ t = t a n h ( W c ˜ h h t 1 + W c ˜ x x t + b c ˜ )
c t = f t c t 1 + i t b c ˜
o t = σ ( W o h h t 1 + W o x x t + b o )
h t = o t t a n h ( c t )
where f t is the output of the forget gate; i t is the output of input gate; c ˜ t is the current input cell state; W f h is the weight of the forget gate to the output of the cell; W f x is the weight of the forget gate to the cell input; W i h is the weight of the input gate to the cell output; W i x is the weight of the input gate to the unit input; W c ˜ h is the weight from the current input cell state to the cell output; W c ˜ x is the weight from the current input cell state to the cell input; W o h is the weight of the output gate to the output of the cell; W o x is the weight of the forget gate to the input of the cell; b f is the bias of the forget gate; b i is the bias of the input gate; b c ˜ is the bias of the current input cell state; b o is the bias of the output gate; σ is the function of s i g m o i d ; the symbol “ ” means point multiplication of two vectors.
The cell state of each LSTM is controlled by the interaction of the input and output gates. The quantity of information about the cell state saved at time t − 1 to time t is controlled by the forgetting gate. (When the value of the forget gate f t is equal to 1, it means that the information is retained. When it is 0, it means to discard the information). At time t, the input gate and the output gate control the amount of information stored in the cell state and the amount of output respectively.

3.2.3. Attention Mechanism

After the two LSTM layers have extracted long-term dependencies relationship from all the attributes of the IoT data, their output is taken as an input to the next attention layer. The significance of each hidden state in the two-layer LSTM can be learned computationally by the new attention layer. The attention mechanism can be understood as a weighted sum. The importance of the input features needs to be calculated first. Then the contribution of each attribute at each step is then calculated by employing a s o f t m a x function and making the sum of the contribution weights of all attributes equal to 1. Each input feature is then multiplied by its corresponding weight and summed together to obtain the final result of the output. The formula for calculating the attentional mechanism can be listed as [37]:
a t k = exp ( e t k ) i = 1 n exp ( e t i )
e t k = g e T σ ( N e [ h t 1 , c t 1 ] + U e h t + b e )
z ¯ t = t T a t T h t T
where g e , b e R T , N e R T × m , and U e R m × m are the parameters will be obtained by using the formula; the parameter m represents the number of neurons; a t k is the attention weights of the K th input at time t; the magnitude of e t k represents the degree of importance of h t ; z ¯ t represents the output of the attention layer, the value of which is obtained by weighting the sum of all the hidden states.

3.2.4. Example

In the water quality prediction field, LSTM and attention mechanism have been used to predicate the values of the PH and NH3-N [37]. The approach of combining LSTM and an attention mechanism has shown good robustness and stronger generalization capabilities in the experiments.

3.2.5. Abnormal Data Filtering

First, the raw IoT data will be cleaned, filtered, and normalized to become standardized data. The data will then be divided into a training set and a test set. The data from the training set will be sent to our proposed model for learning and finally, an ideal model will be obtained. Then, the data of the test set will be sent to the trained model for regression prediction, and the model will output the predicted value. We need to calculate the reconstruction error ( R E ) between the true and predicted values, after obtaining the predicted values. The reconstruction error represents the differences between input data and predicted data [38]. It is defined as follows:
R E = υ υ
where the predicted data vector is represented by υ and the true data vector is represented by υ .
The reconstruction error will, through a given threshold, measure whether it is normal, that is, whether the data is normal or not. The selection of anomaly data thresholds is an important problem in the unsupervised learning area and is a key factor in determining the success of anomaly detection. In our study, we choose an approach commonly used in the field of anomaly detection which is to set δ = 3 σ , where δ is the threshold we choose, σ is the standard deviation of the reconstructed error series [39]. When R E > ± δ , these data will be labeled as abnormal data.

3.3. The Second Phase: CEP Rules Extraction

In this phase, we will use data mining methods to mine meaningful CEP rules from the labeled data obtained in the first phase. We use the decision tree algorithm to perform data mining. A decision tree is a commonly utilized data mining model to calculate regression and classification, as well as easily visualize the results [21]. It has a tree structure and makes decision judgments through conditional branches. When learning the model, the features and label information in the training set data need to be input into the model, and the model is learned by minimizing the loss function, then the optimal single-branch classification rule is calculated. Finally, the final classification results are obtained through different sub-classification rules, extending down from its root node. Given its strong interpretability and fast classification speed, the decision tree approach is often employed in the rule mining direction within the data mining profession.

4. Experiment Evaluations and Results

Through this section, the overall performance of LAD in the two phases will be presented in the form of data. In the first phase, we implement our proposed two-layer LSTM attention mechanism model. We also compare with traditional LSTM, bidirectional LSTM (BiLSTM) [40], and gate recurrent unit (GRU) [41] models to present the feasible of LAD. We then use these four models to identify abnormalities in the time series data collected b the IoT devices.
After identifying the abnormalities, labeled data would be sent to the next stage to assess the accuracy of the rule extraction. In the rule mining stage, we use a decision tree algorithm to extract the rules. We select air quality data from a smart urban scene to assess the whole forecasting ability of our framework.

4.1. Data Set

For all the experiments in this paper, we used data on urban air pollution collected by the Pulse of the City EU FP7 project [42]. The City Pulse EU FP7 Project provides data in many fields such as road traffic data, cultural event data, weather data, library event data, social event data, parking data, and pollution data [43]. In this paper, we use pollution data gathered at 5-minute time intervals between August and October 2014 in two cities, Aarhus and Brasov, Denmark. The dataset we use has a total of 17,568 samples and each sample contains eight features including particulate matter, sulfur dioxide, nitrogen dioxide, carbon monoxide, longitude, latitude, ozone, and timestamp [44]. More statistical information is shown in Table 1, including the max, min, mean and standard deviation (std) of the air pollution data.

4.2. Evaluation Metrics

In all the experiments included in this paper, we will use three evaluative metrics frequently employed in the regression prediction area to measure our model’s capabilities. The three evaluation criteria are mean absolute error (MAE), root mean square error (RMSE), and mean absolute percentage error (MAPE).
Suppose:
y ^ = { y ^ 1 , y ^ 2 , , y ^ n }
y = { y 1 , y 2 , , y n }
where y ^ is the set of predicted values and y is the actual value.

4.2.1. Mean Absolute Error (MAE)

The absolute error between the set of predicted vectors and the set of actual vectors calculated by MAE, which is the most common measure of average error size [45]. The formula for MAE can be expressed as:
M A E = 1 n i = 1 n | y ^ i y i |

4.2.2. Root Mean Squared Error (RMSE)

RMSE is often used in the field of regression forecasting to measure the deviation between the predicted and true values. It can capture anomalies in the data used and is very sensitive to outliers [46]. The formula for RMSE can be expressed as:
R M S E = 1 n i = 1 n ( y ^ i y i ) 2

4.2.3. Mean Absolute Percentage Error (MAPE)

MAPE is often used in the field of regression forecasting for the assessment of uniform forecast errors and is one of the more commonly used assessment criteria [47]. The formula for MAPE can be expressed as:
M A P E = 100 % n i = 1 n | y ^ i y i y i |

4.3. Experiment Environment

In the first phase, we label urban air quality IoT data as normal or abnormal by training and adjusting the four models employed on the Python platform using the Tensor Flow and Keras deep learning frameworks. In the second phase, we adopt the sklearn.tree from scikit-learn machine learning tools to extract the CEP rules. All experiments in the two phases conducted in this paper were performed on a Windows 10 system equipped with an AMD A10-9630P RADEON R5, 10 computing core CPU. The machine is equipped with an 8 GB running memory and it runs at a maximum speed of 2.78 GHZ.

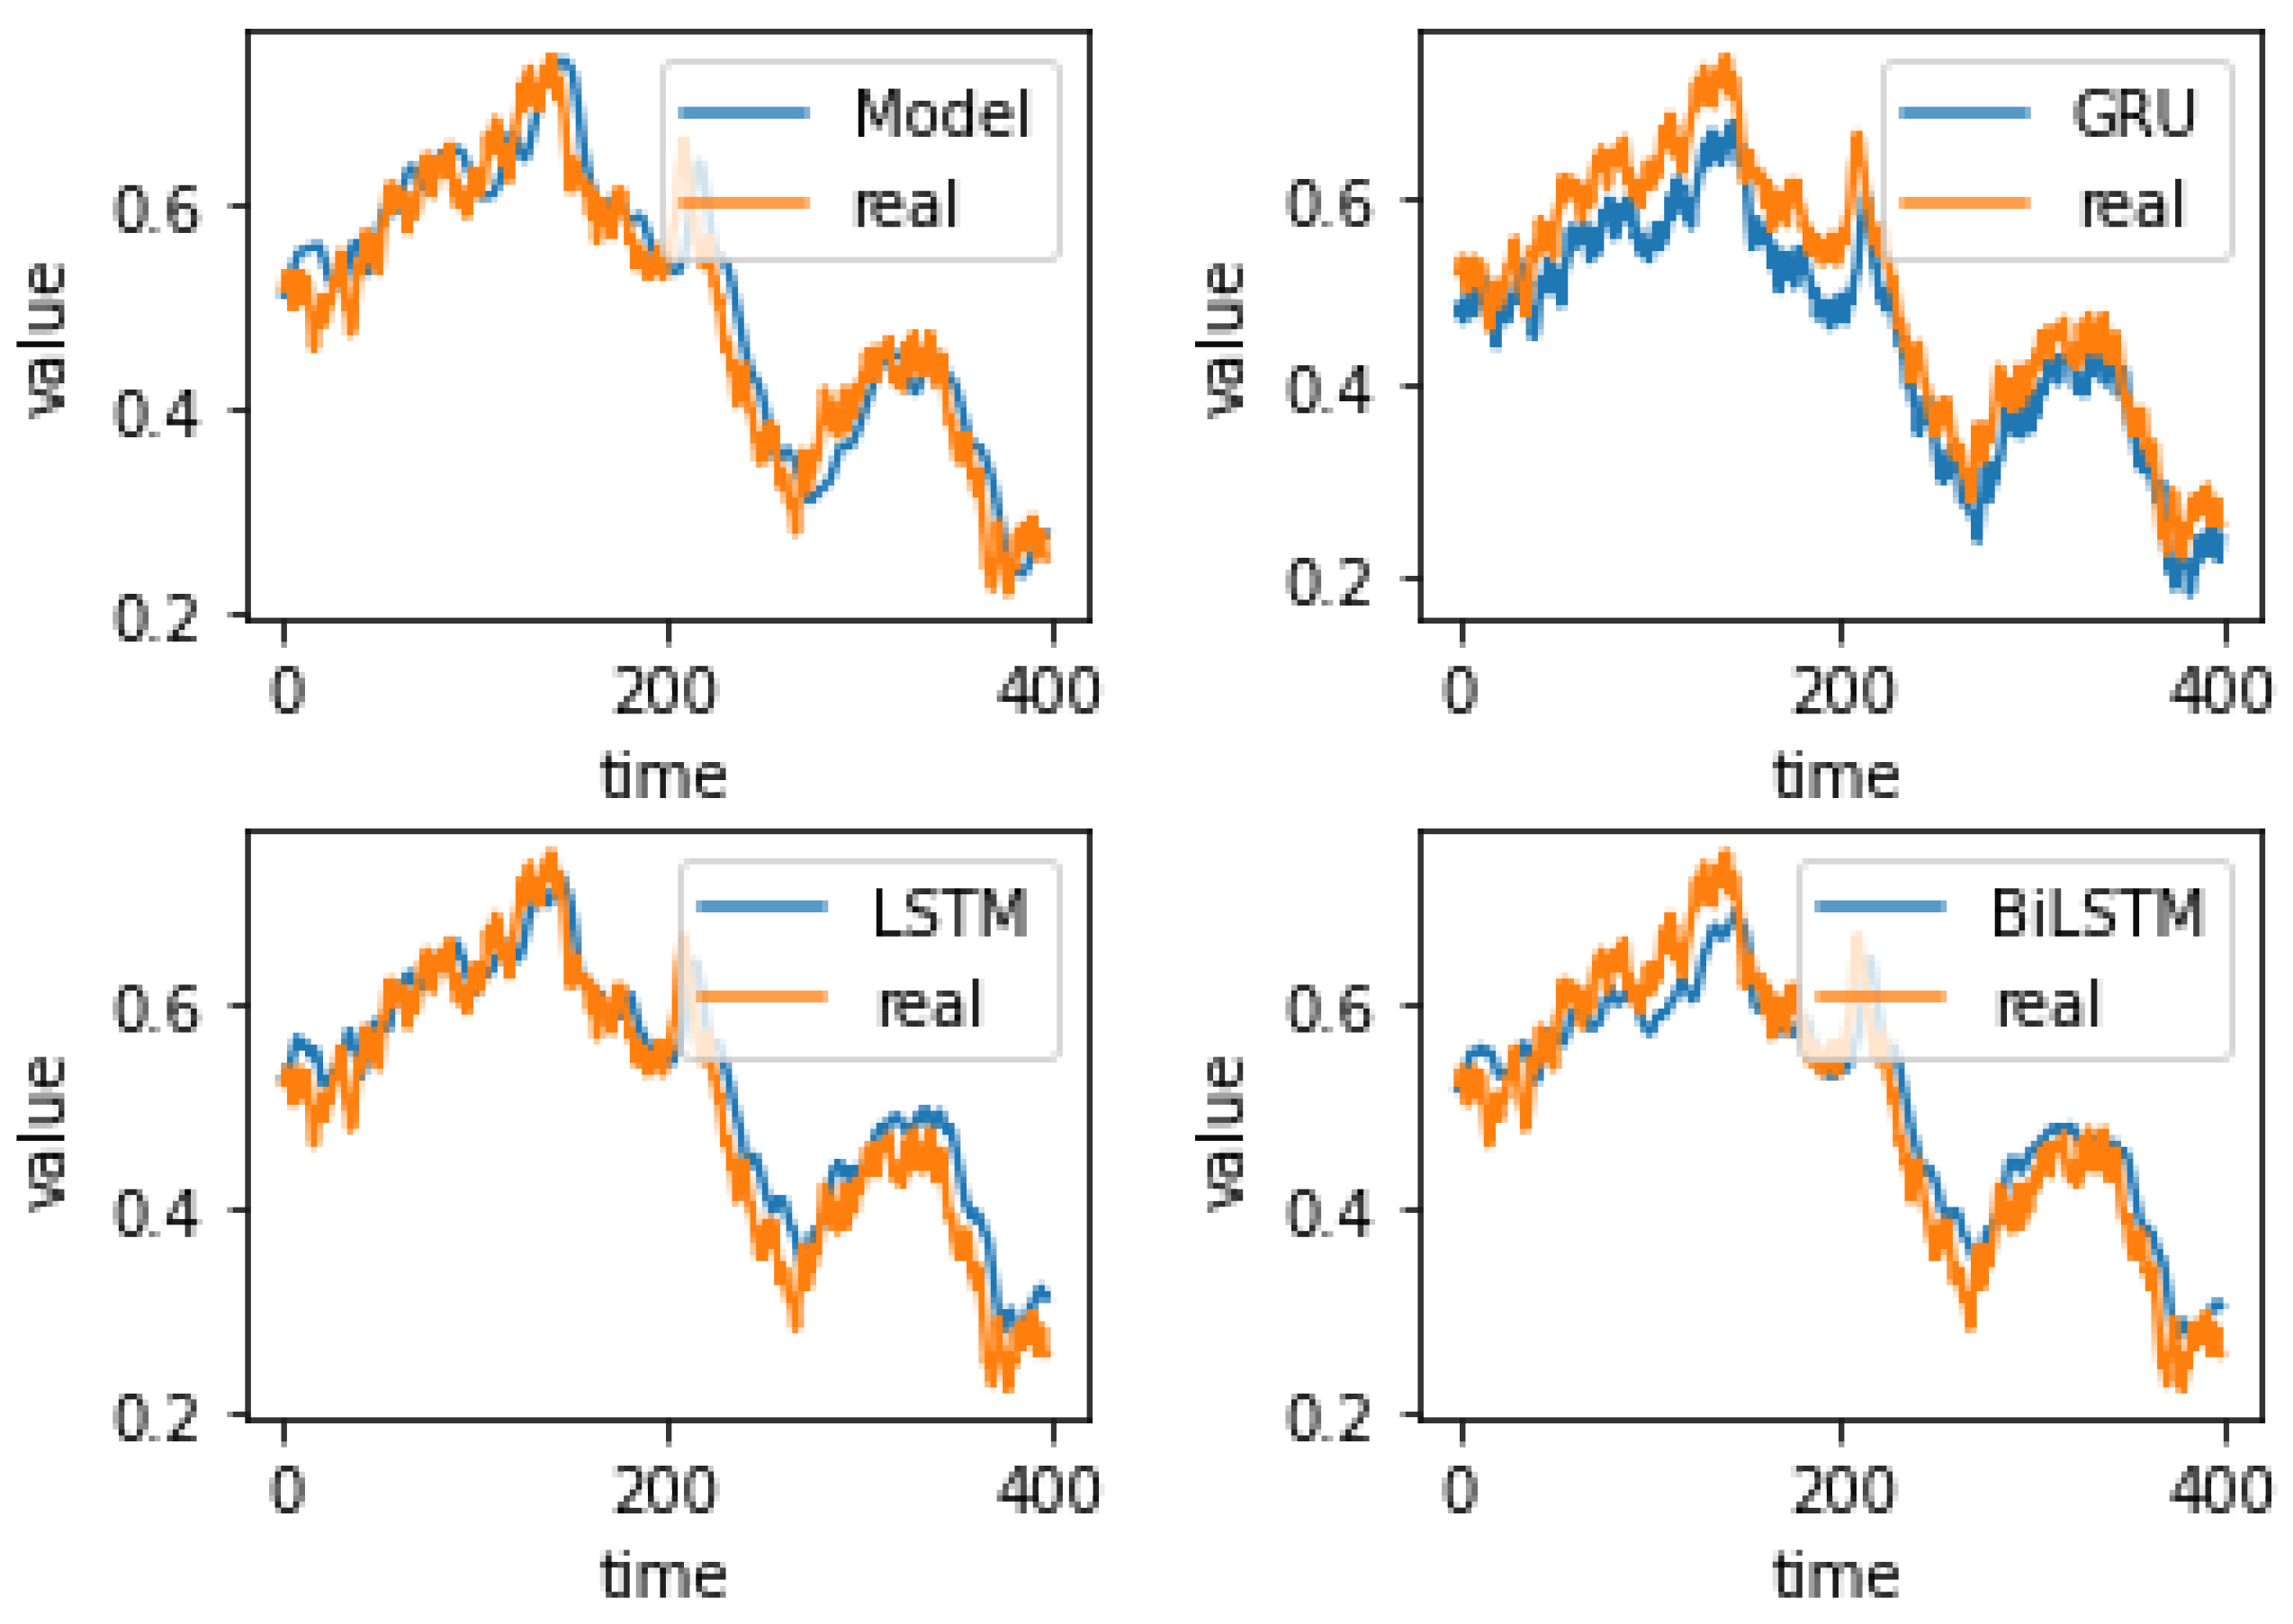
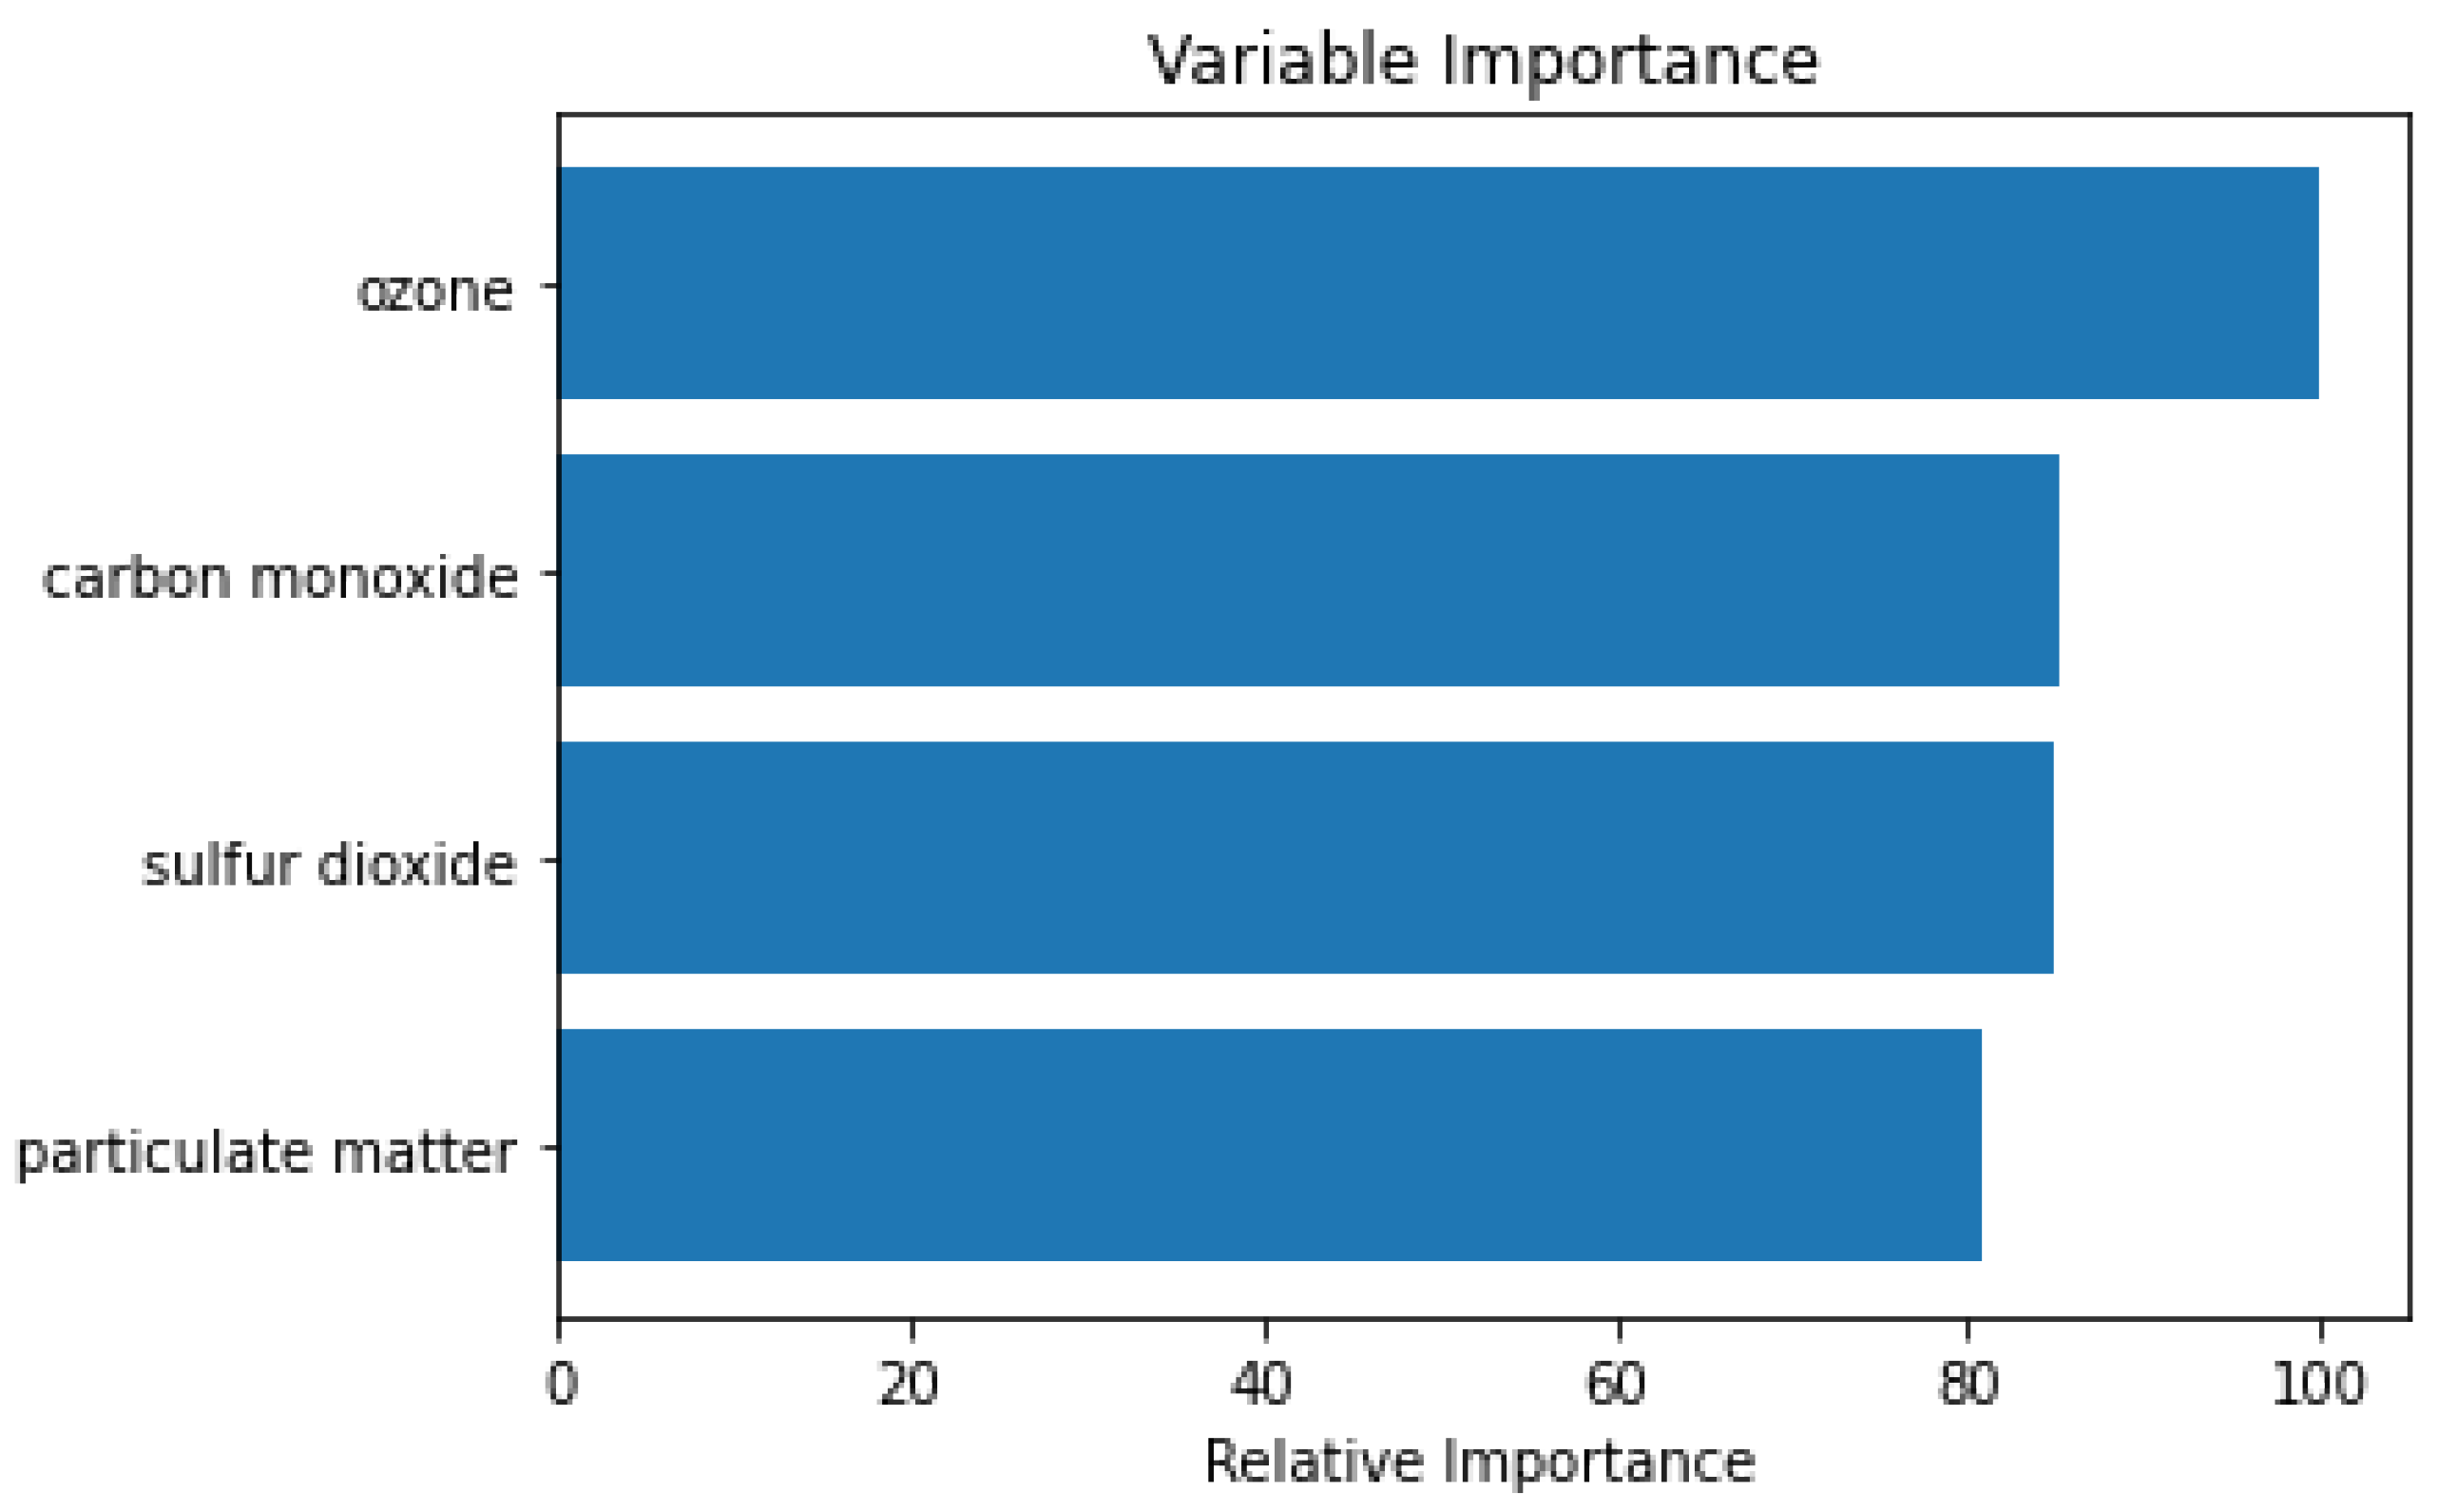
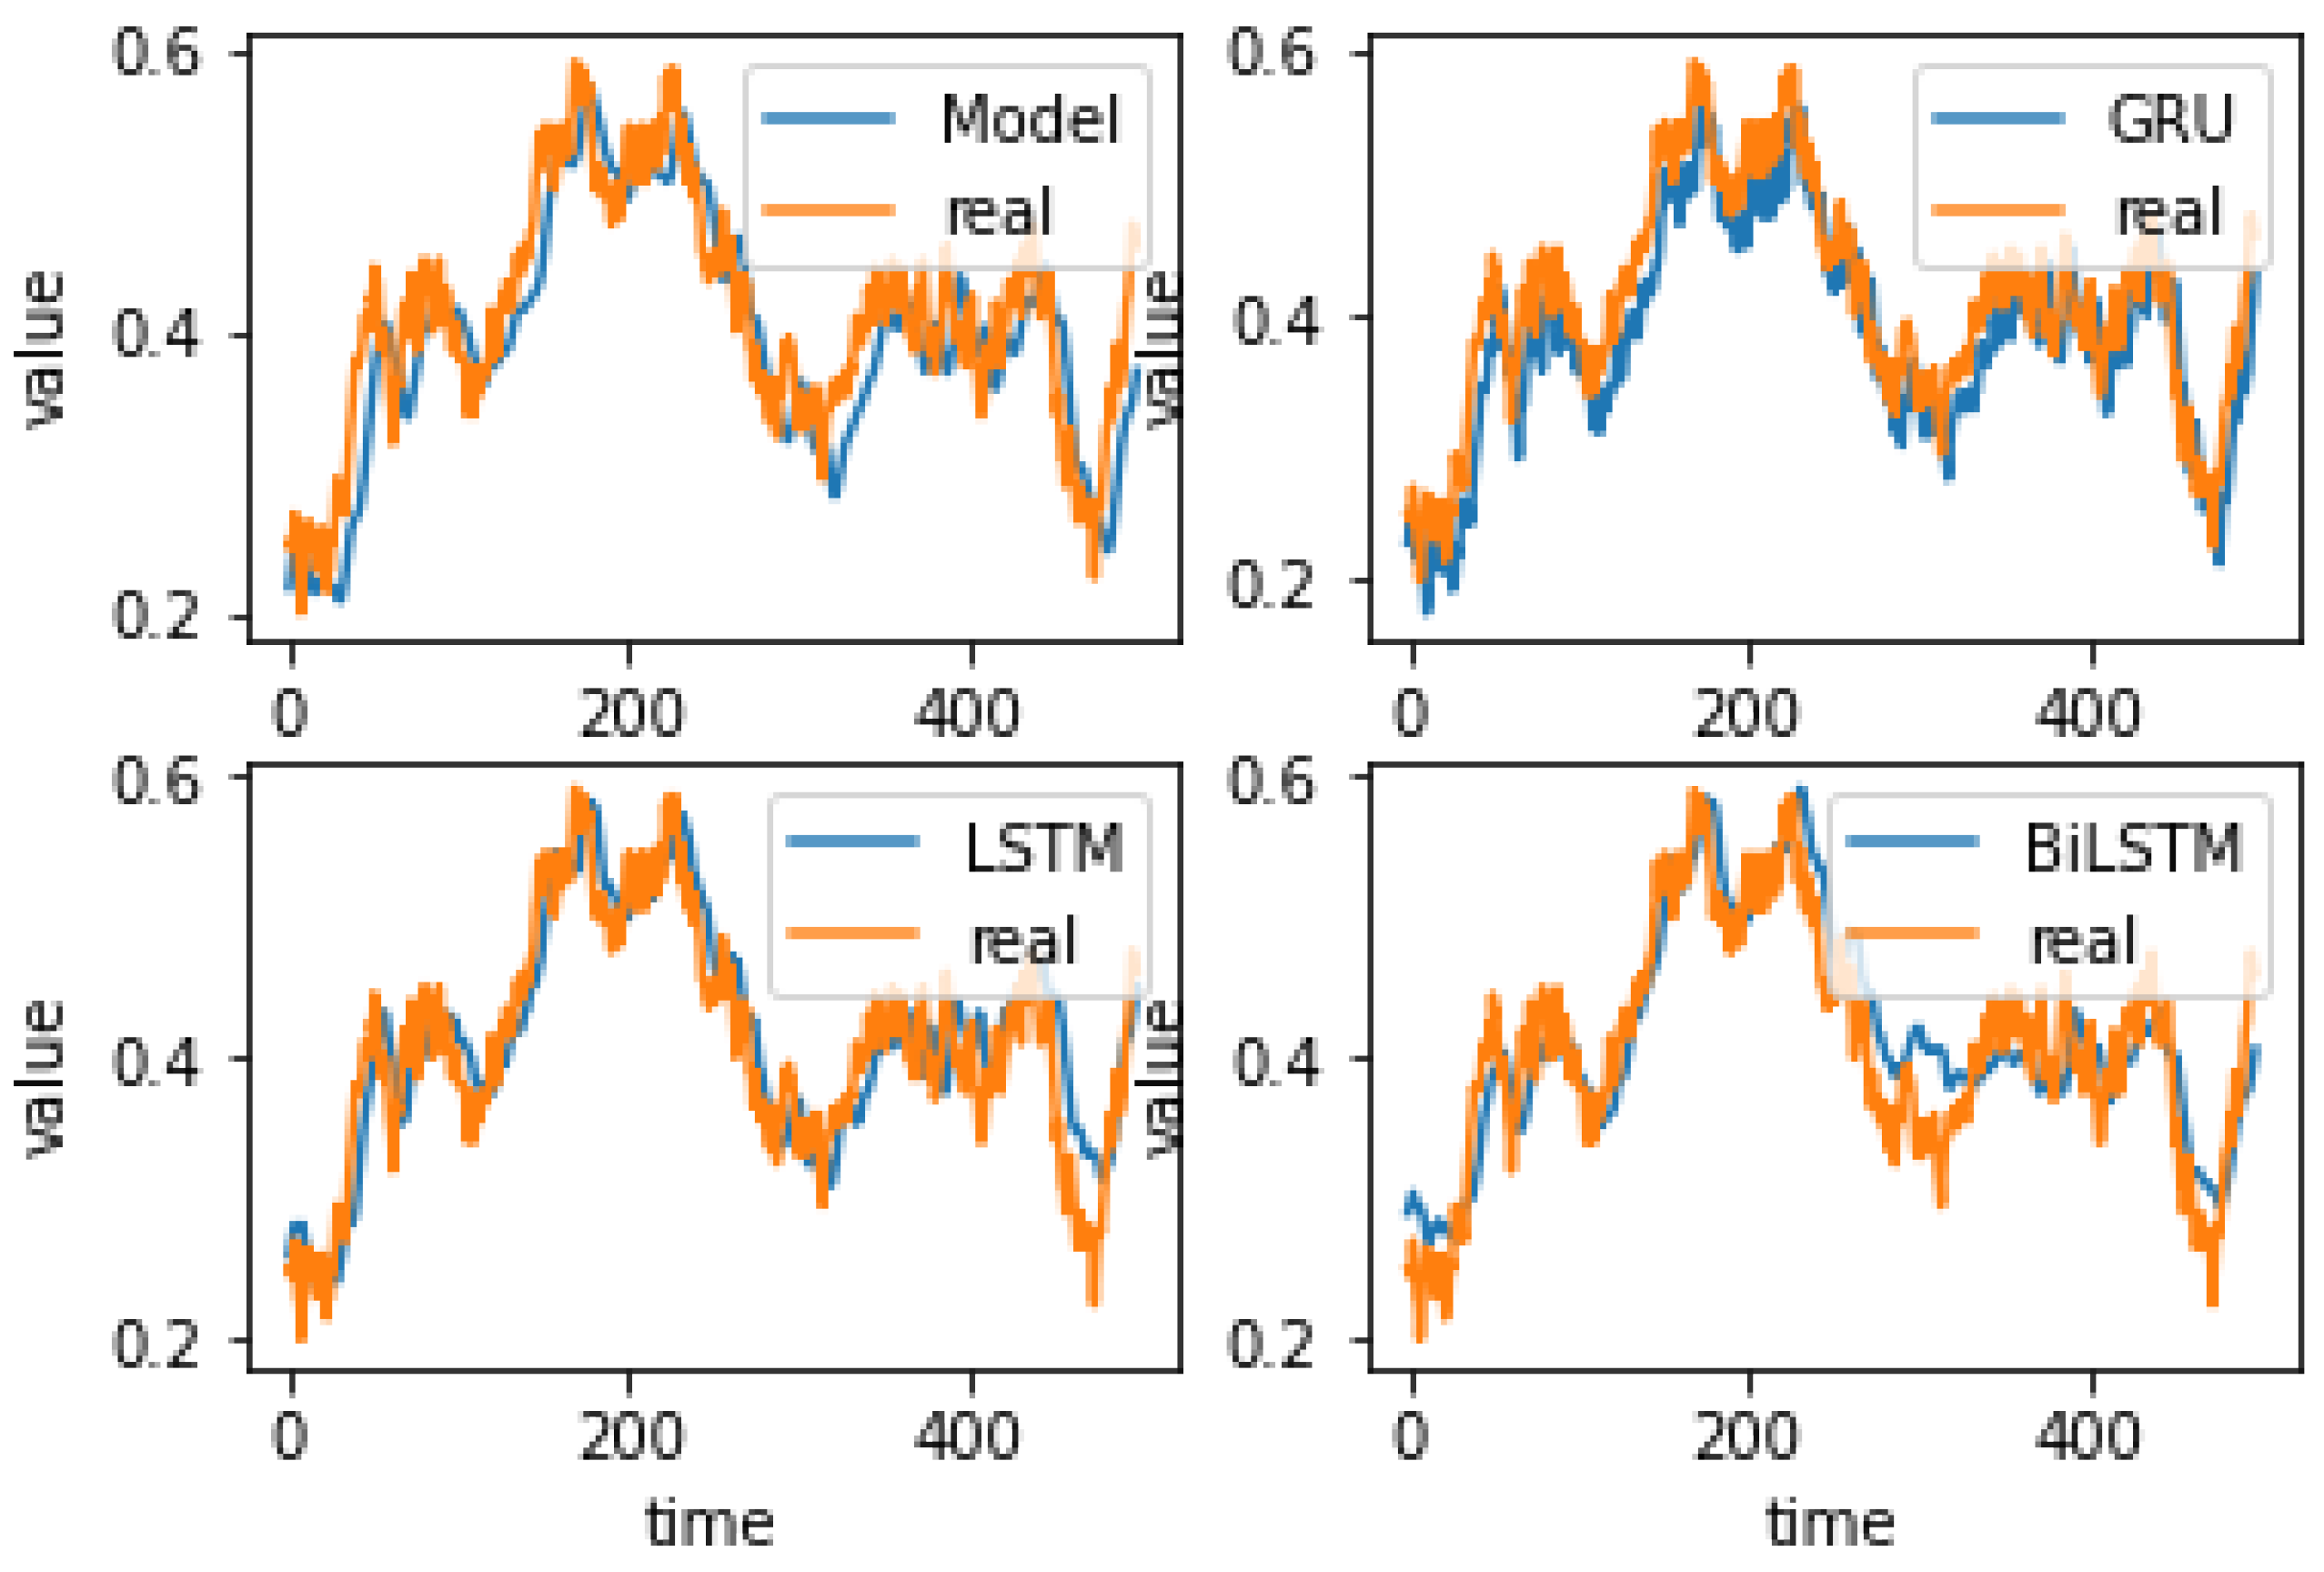
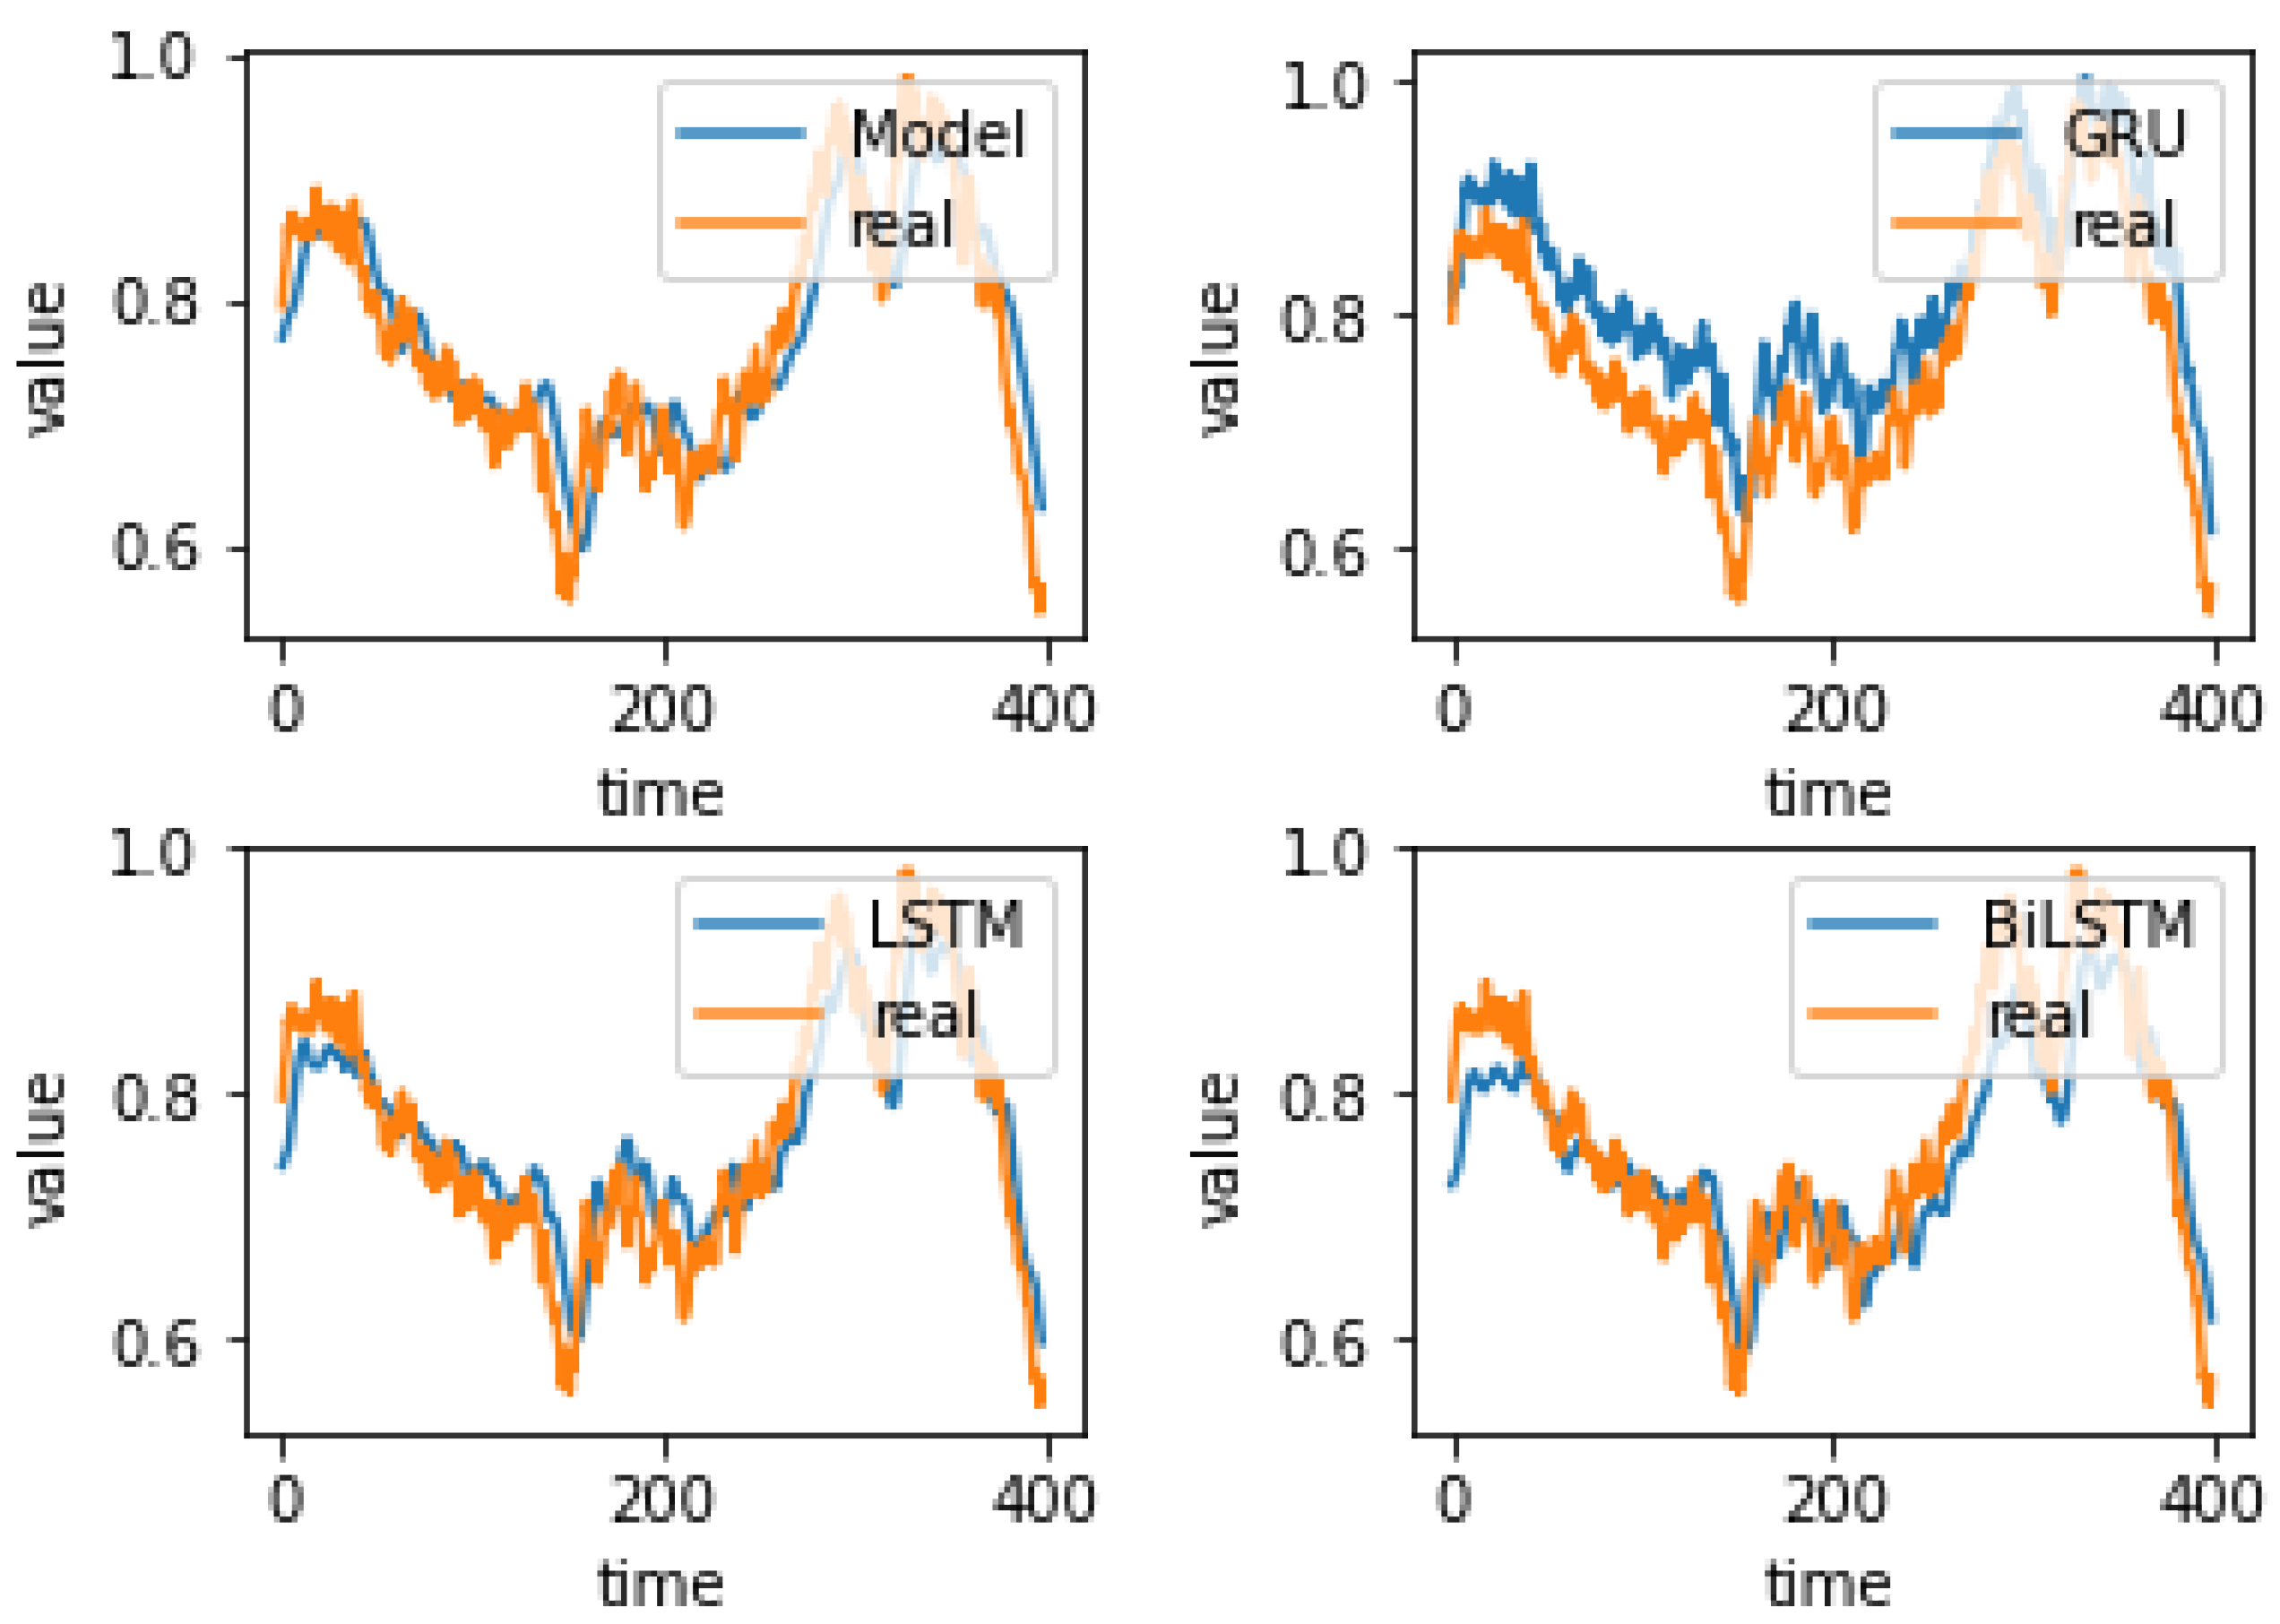
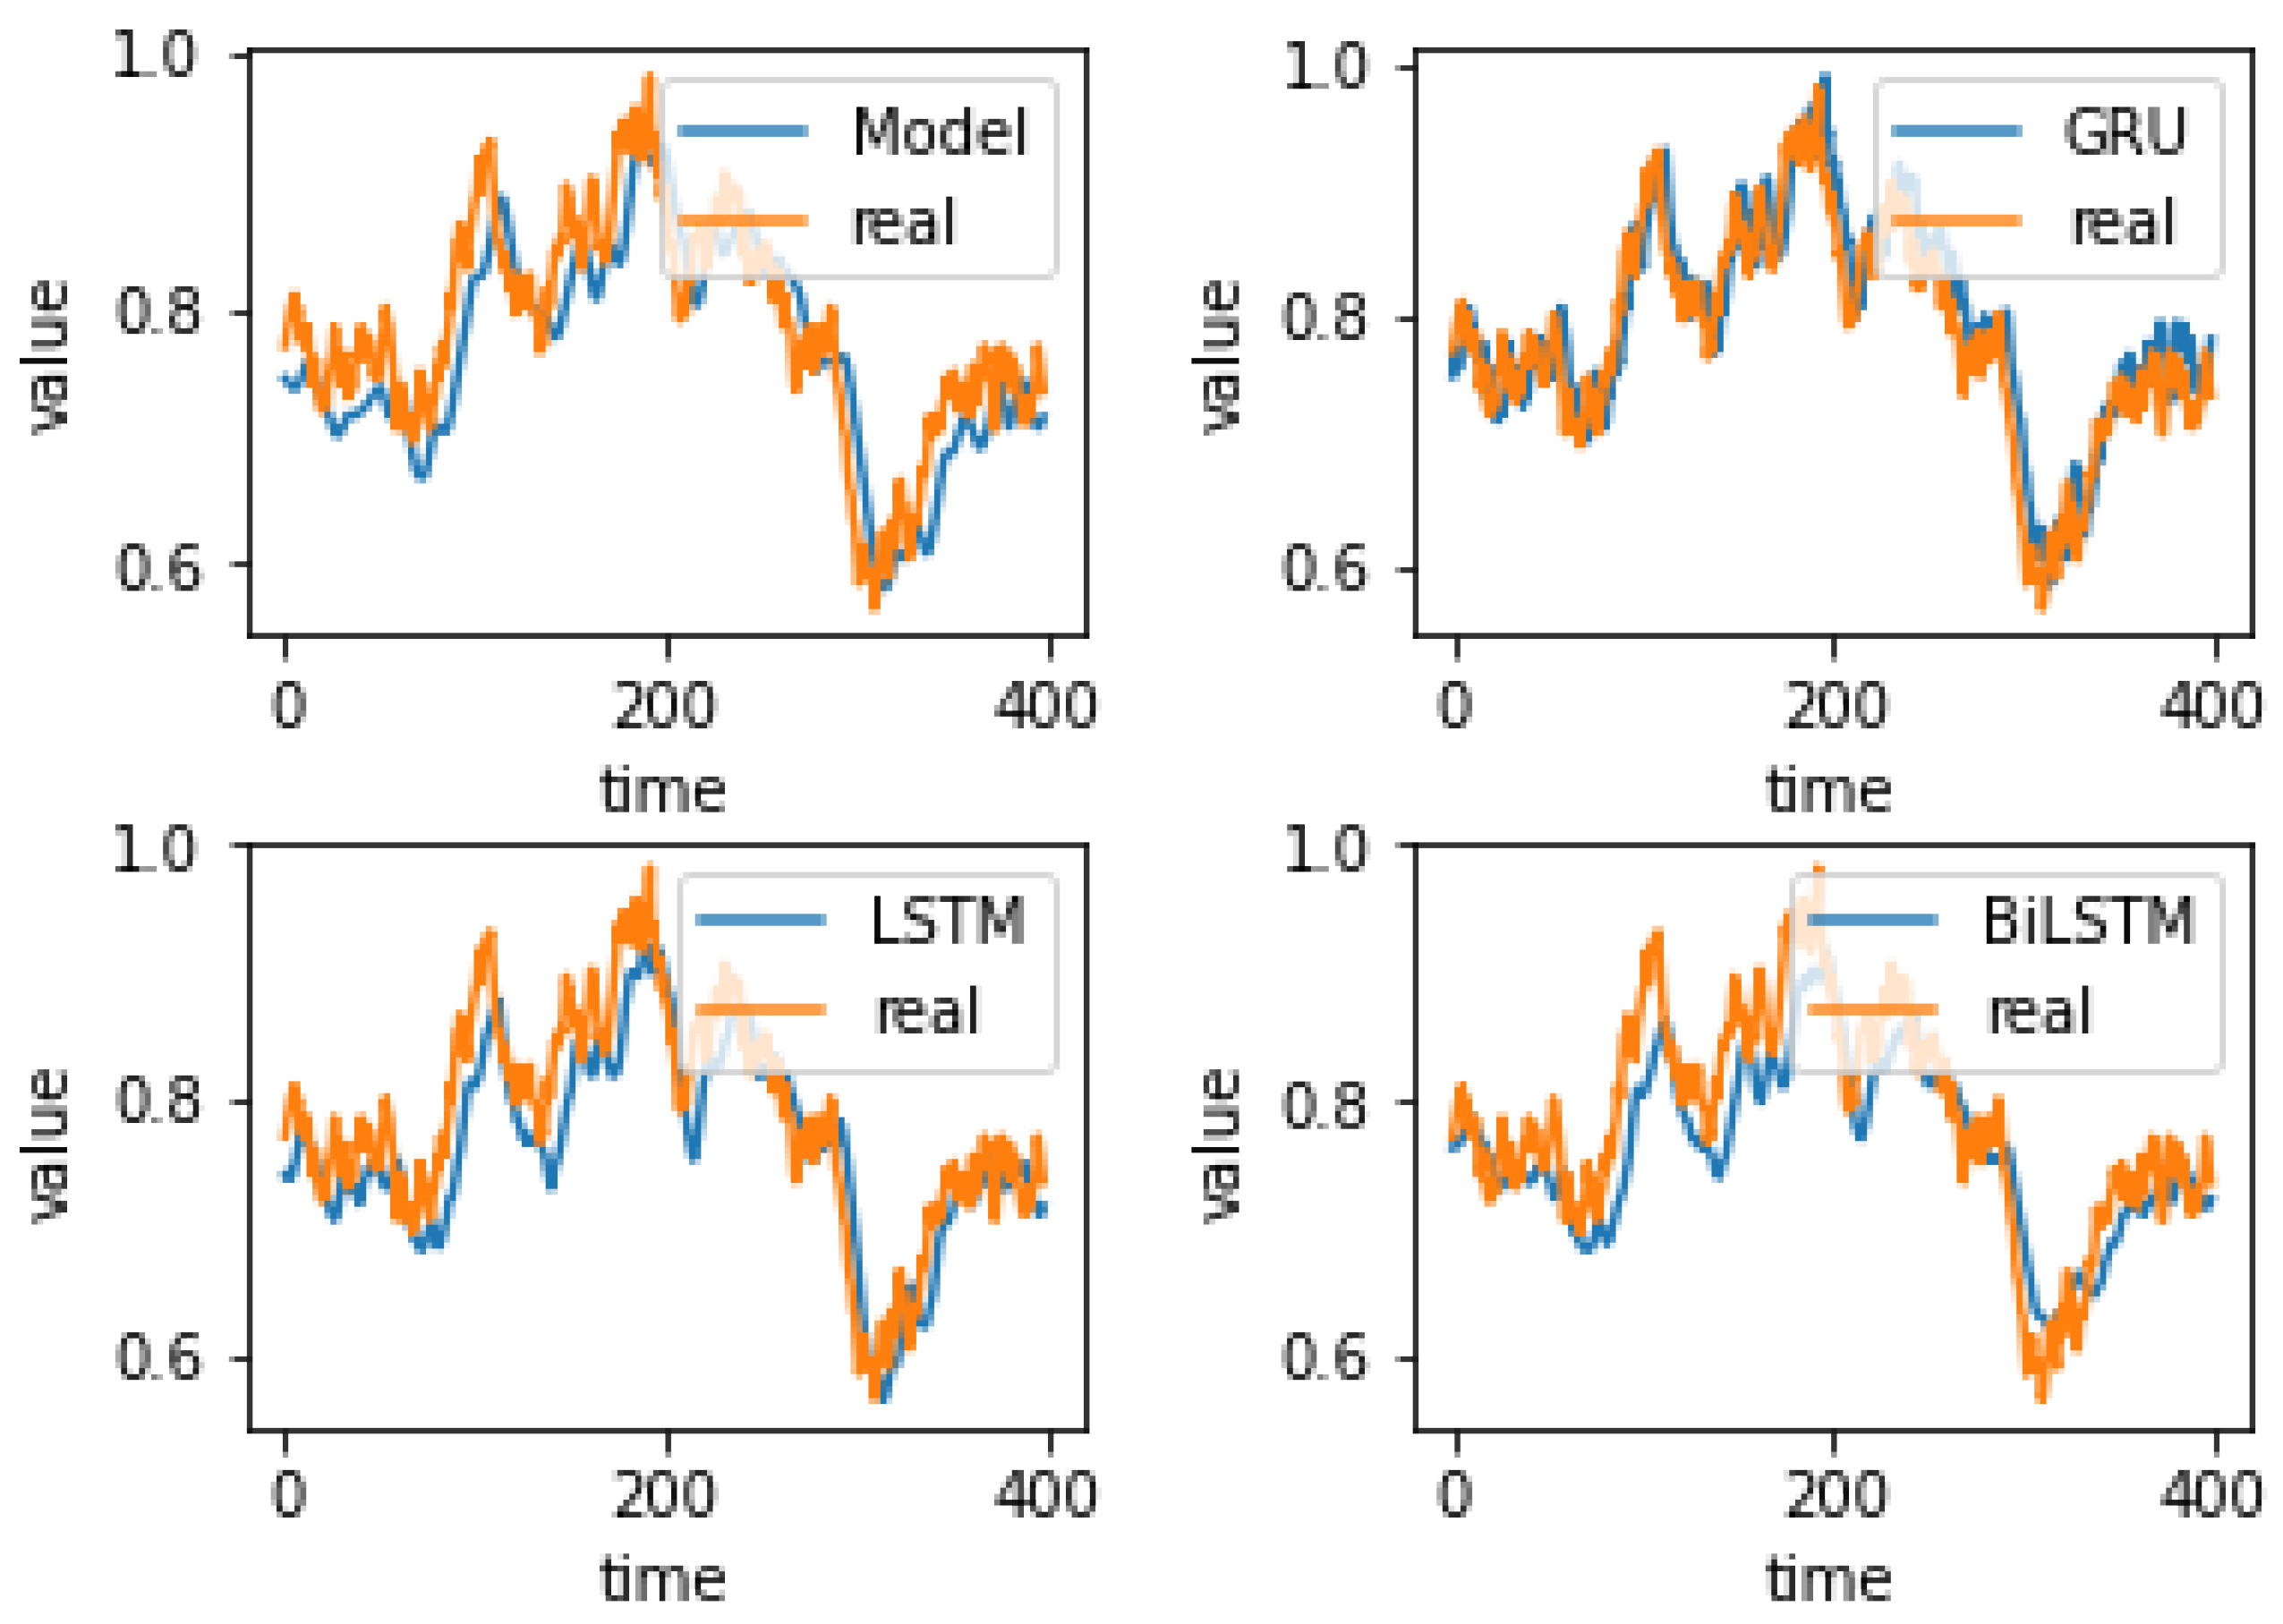
4.4. Experiment Results

Before we start our first phase of experiments, we normalize the raw sensor data by min-max normalization within the interval [0, 1] and then used it to fit the four models. The normalization [48] is shown as follows:
y = y y m i n y m a x y m i n
where y m i n and y m a x are the minimum and maximum of the raw data, respectively. In Table 2 the basic parameters in the four models we have compared are presented.
Then, the normalized air quality IoT data is randomly divided into an 80% train set and a 20% test set, with the 80% training set containing a 10% validation set. The training set and the test set are used for different aspects. The training set will be applied to train and fit the four models. The test set will be employed to calculate the values of the three evaluation metrics that we have used to compare the performance of the four models. During each prediction, we use the first 8 h of data to predict the value of the next timestamp. In the same experimental environment, the performances of the four models are shown in Table 3. We then plotted the comparison between the predicted and true values of these four models for particulate matter, ozone, sulfur dioxide, and nitrogen monoxide in the air pollution data. The difference between the results and the real observations can be seen in Figure 5, Figure 6, Figure 7 and Figure 8.
From the experimental results and comparative figures, we can see that our proposed model shows the best results in terms of the three evaluation criteria used, MAE, RMSE, and MAPE. GRU is the best model of the three traditional models. The MAE of the model we proposed is 0.047, which is 8.74% lower than that of the GRU model. The RMSE of the model we proposed is 0.051, which is 10.53% lower than that of the GRU model. The MAPE of the model is 16.49, which is 16.34% lower than that of the best traditional models. From Figure 5, Figure 6, Figure 7 and Figure 8, the predicted results of LAD are the closest to the real data, indicating that LAD has a good performance than the three other models. The experimental results of the first phase show that our proposed two-layer LSTM attention mechanism model performs well in predicting air pollution data.
Following the prediction of air pollution data, we obtain the reconstruction error ( R E ) between the predicted and real data through the model calculation, and 3 times the standard deviation of the reconstruction error is selected as the threshold δ . If the R E > δ , then the data will be labeled abnormal.
After finishing the first phase, we get the series of labeled data for the second phase. In the next second stage, we used the classical decision tree process mining algorithm to extract criteria-compliant CEP rules from the labeled IoT data obtained in the first stage. Then, we assessed the feasibility of the decision tree algorithm used in our second stage by calculating the precision, recall, and F1 score of the predictions. The final results for each of these items are presented in Table 4.
We divided the classification results of the decision tree into two categories, 0 and 1. Here, class 0 stands for normal IoT data, while class 1 stands for anomalous IoT data. Based on the results shown in Table 4, we can observe that the decision tree algorithm has a prediction accuracy of over 90% for anomalous data. The overall accuracy of the prediction reached 89%. We also compared the importance and correlation of several attributes in the air pollution data to the final classification prediction results. The specific results are shown in Figure 9. By examining the results presented in Figure 9, we can obtain the following order of importance of these four attributes to the final classification result: ozone, sulfur dioxide, carbon monoxide, and particulate matter. Each attribute is more than 80% relative importance with the final classification results, which indicates that the attributes of the IoT data we used are correct.
Next, we visualize the obtained decision tree model, which will help us better extract rules from the decision tree. The part of the decision tree is shown in Figure 10. Then we use codes to convert the decision tree model into CEP rules. Two of the rules we extracted are as follows:
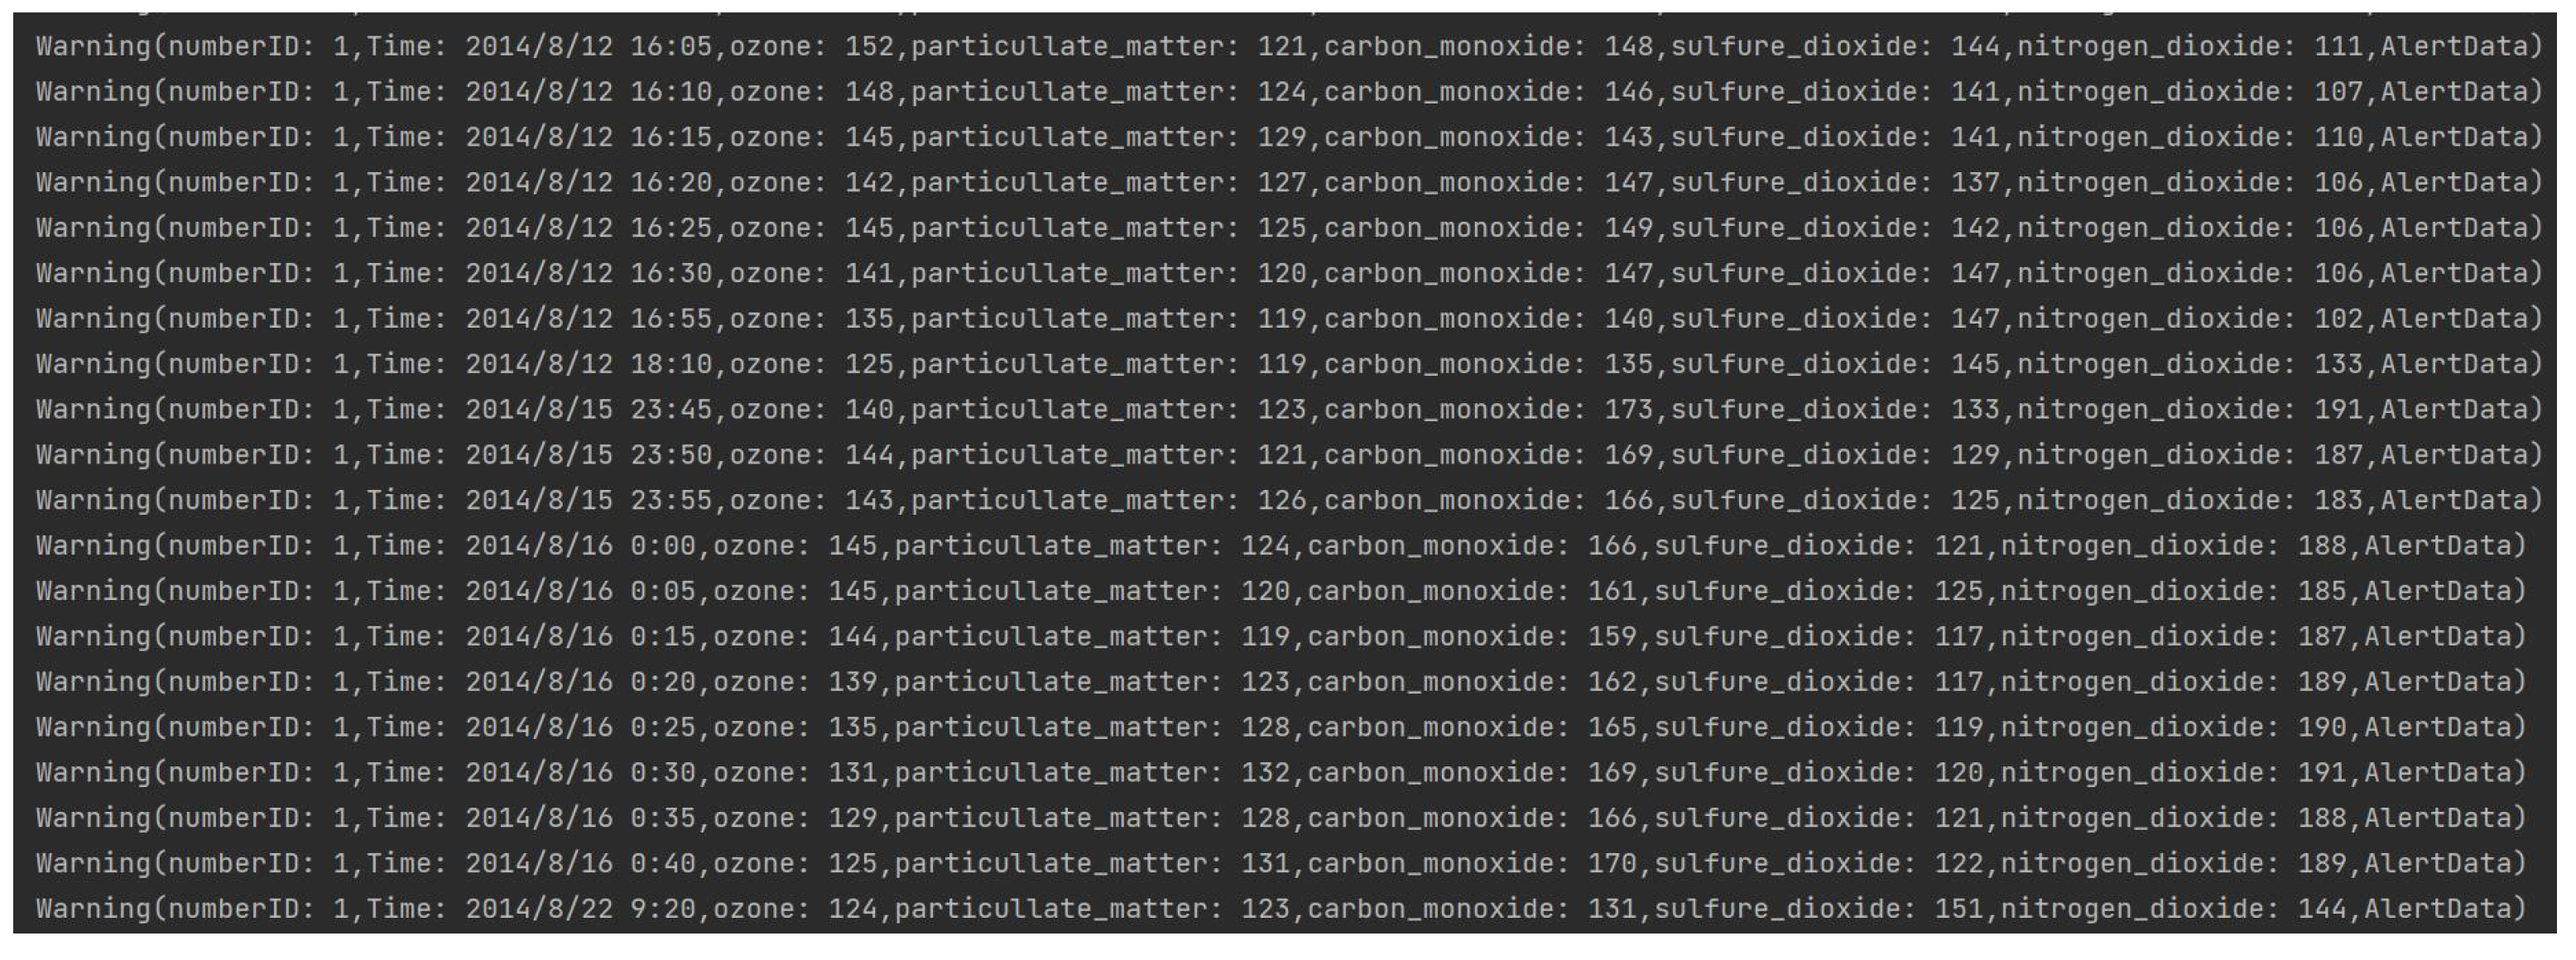
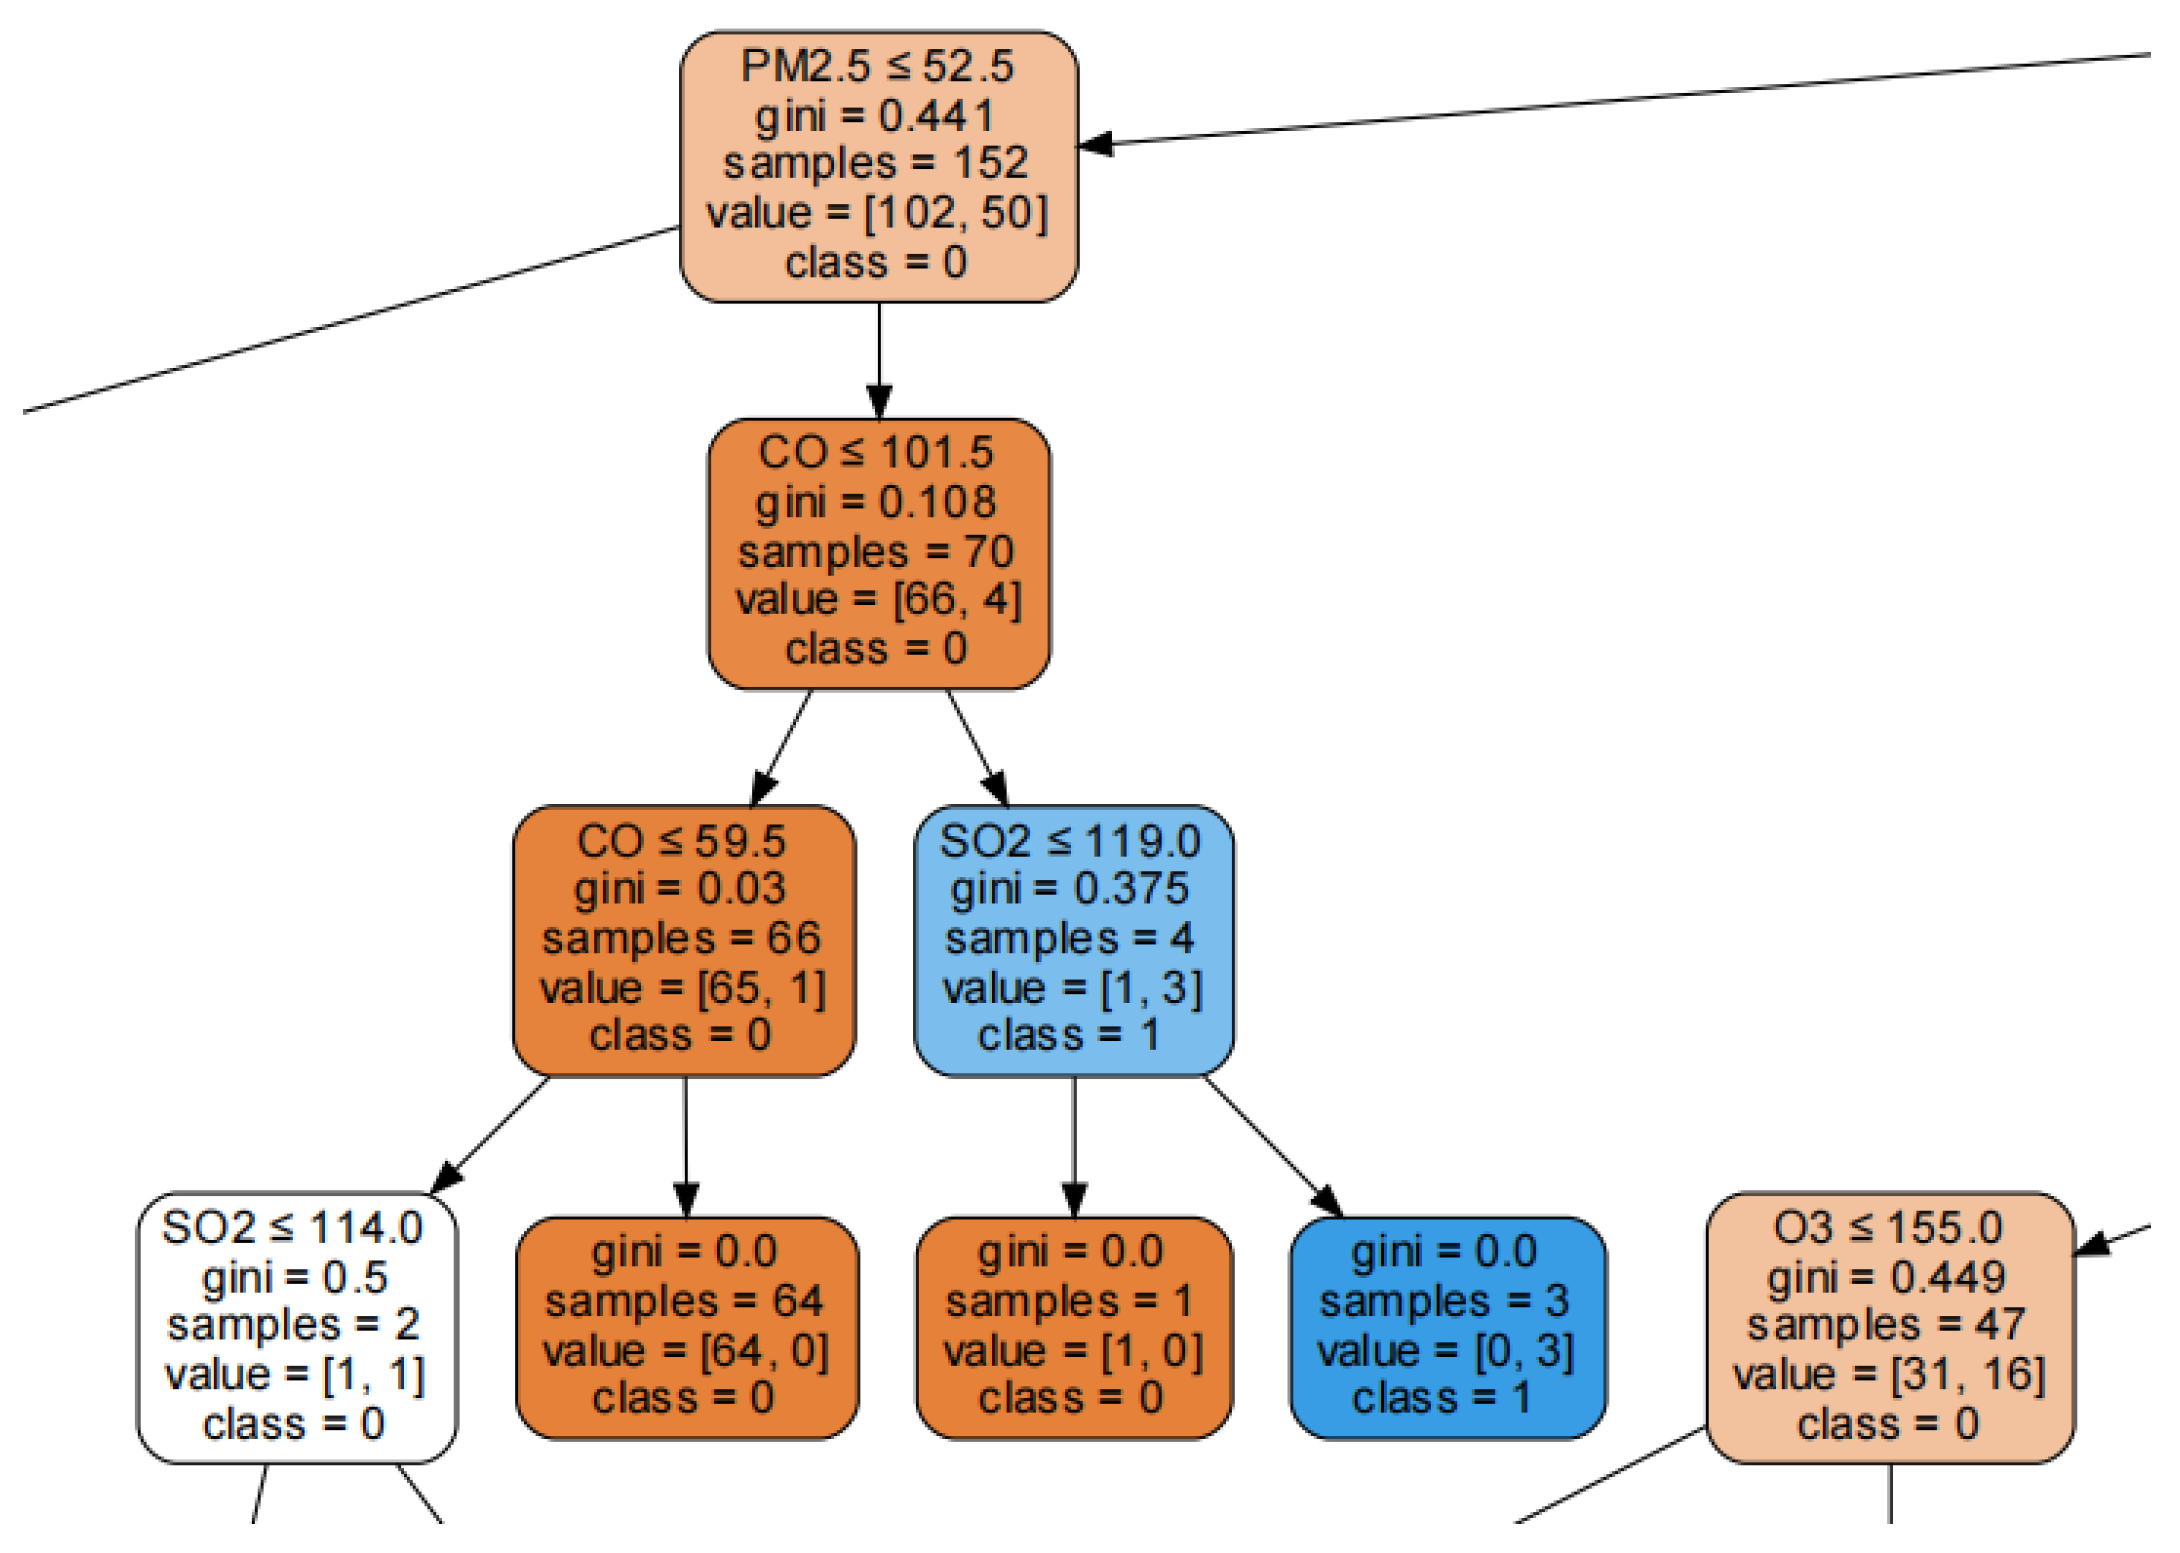
  • “ozone > 124 and ozone < 193 and particulate matter > 117.5 and carbon monoxide > 126.5 and carbon monoxide < 173.5 and sulfur dioxide > 106.5 and sulfur dioxide < 192.5”.
  • “ozone > 79.5 and ozone < 193 and particulate matter > 125.5 and carbon monoxide > 126.5 and sulfur dioxide > 106.5 and sulfur dioxide < 191”.
What the CEP rules we extracted mean that air quality records will be recognized by the CEP engine when the hazardous gases meet the conditions at the same time.
Figure 10. The part of the decision tree.
Energies 15 05892 g010
We take the first rule as an example. According to the Air Quality Index (AQI) issued by the World Health Organization (WHO) [49], as shown in Figure 11, we can find that the AQI values for “sulphur dioxide” in our extracted rule are between 106.5 and 192.5, which is labeled by the WHO as unhealthy and can cause a lot of harm to people’s health. The AQI values for other harmful gases in the rule are also largely at unhealthy levels. Therefore, the rules extracted by our proposed framework can be used to identify abnormal values in the air quality data.
Next, we apply the extracted CEP rules to the Flink CEP engine. We then write a CEP pattern event based on the extracted rules and performed early warnings on real-world air quality data. The results of the early warning are shown in Figure 12 below.

5. Discussion

In our work, we propose a framework LAD that could extract CEP rules from unlabeled IoT data. LAD has two stages. In the first stage, we utilize a two-layer LSTM attention mechanism model to detect anomalous IoT data. We also compare it with LSTM, bidirectional LSTM, and GRU algorithms. In terms of three evaluation indicators, MAE, RMSE, and MAPE, the experiment results show that our proposed model has a better performance compared to the other three deep learning models. In the second phase, we use a decision tree data mining algorithm to extract the CEP rules that satisfy the conditions from the tagged IoT data obtained in the first phase. The two-stage experiments show that our proposed framework is feasible. At the same time, our work differs from that of other scholars in many ways.
Our work extracts CEP rules by combing deep learning and data mining methods. Previous studies extracted CEP rules by rule-based classifiers or CEP editors. Different methods have their own advantages in different areas. This work applies CEP to the field of air pollution forecasting and monitoring. Other works apply CEP to human activity detection and medical applications respectively, i.e., [27,30]. This shows that CEP can be applied to different areas. Compared with other works, the objects of experiment comparison and the indicators of evaluation are different. We compare four deep learning methods and use three evaluation metrics, MAE, RMSE, and MAPE. This is different from other works, e.g., [33].
Every work has its advantages and limitations. Our work innovatively incorporates attention mechanisms into deep learning methods and applies them to the field of automatic extraction of CEP rules. The CEP rules are extracted from the unlabeled data by our proposed method. Previous studies extracted CEP rules from tagged data by rule-based classifiers. They complement each other.

6. Conclusions

Energy is the driving force for the development of human society. The efficient use of energy will play a vital role in environmental protection, green development, and sustainable city construction. In our work, we propose a framework that extracts CEP rules from unlabelled IoT data. This framework can be applied to IoT data in the energy industry, which will promote the development of IoT in the energy sector. By predicting air pollution data, this framework can be used to help the formulation of controlling air pollution regulation strategies and drive the development of renewable energies and the construction of sustainable cities.
The model we proposed also has several limitations. First, the amount of data is too small. The dataset we used only has air quality data for two months. Therefore, it is unknown how well our framework will perform in the face of data with seasonal attributes. So using a larger dataset to experiment with our framework is one of our future work directions. In addition, our framework learns and extracts CEP rules from historical datasets, rather than learning CEP rules online. Due to the strong uncontrollability of online learning [50], the performance of our proposed model has limitations. Therefore, extracting rules from IoT data through online learning is also a direction for our future work.

Author Contributions

Data curation, Y.L.; Formal analysis, W.Y.; Methodology, W.Y.; Project administration, C.G.; Software, Y.L.; Supervision, W.Y.; Writing—original draft, Y.L.; Writing—review and editing, W.Y., C.G. and M.C. All authors have read and agreed to the published version of the manuscript.

Funding

This work was supported by the Natural Science Foundation of Shaanxi Province under Grants 2021JM-205 and the UK Engineering and Physical Sciences Research Council through grants EP/V034111/1, Royal Society IEC/NSFC/201079.

Institutional Review Board Statement

Not applicable.

Informed Consent Statement

Not applicable.

Data Availability Statement

Links to publicly available datasets are placed in the references.

Conflicts of Interest

The authors declare no conflict of interest.

References

  1. Ahmad, T.; Zhang, D.; Huang, C.; Zhang, H.; Dai, N.; Song, Y.; Chen, H. Artificial intelligence in sustainable energy industry: Status Quo, challenges and opportunities. J. Clean. Prod. 2021, 289, 125834. [Google Scholar] [CrossRef]
  2. Kaplan, A.; Haenlein, M. Rulers of the world, unite! The challenges and opportunities of artificial intelligence. Bus. Horiz. 2020, 63, 37–50. [Google Scholar] [CrossRef]
  3. Sarker, I.H.; Khan, A.I.; Abushark, Y.B.; Alsolami, F. Internet of things (iot) security intelligence: A comprehensive overview, machine learning solutions and research directions. Mob. Netw. Appl. 2022, preview. [Google Scholar] [CrossRef]
  4. Hossein Motlagh, N.; Mohammadrezaei, M.; Hunt, J.; Zakeri, B. Internet of Things (IoT) and the energy sector. Energies 2020, 13, 494. [Google Scholar] [CrossRef]
  5. Zhou, K.; Song, S.; Xue, A.; You, K.; Wu, H. Smart train operation algorithms based on expert knowledge and reinforcement learning. IEEE Trans. Syst. Man Cybern. Syst. 2020, 52, 716–727. [Google Scholar] [CrossRef]
  6. Chen, L.W.; Liu, J.X. Time-efficient indoor navigation and evacuation with fastest path planning based on Internet of Things technologies. IEEE Trans. Syst. Man Cybern. Syst. 2019, 51, 3125–3135. [Google Scholar] [CrossRef]
  7. Tao, F.; Qi, Q. New IT driven service-oriented smart manufacturing: Framework and characteristics. IEEE Trans. Syst. Man Cybern. Syst. 2017, 49, 81–91. [Google Scholar] [CrossRef]
  8. Saxena, D.; Raychoudhury, V. Design and verification of an NDN-based safety-critical application: A case study with smart healthcare. IEEE Trans. Syst. Man Cybern. Syst. 2017, 49, 991–1005. [Google Scholar] [CrossRef]
  9. de Assuncao, M.D.; da Silva Veith, A.; Buyya, R. Distributed data stream processing and edge computing: A survey on resource elasticity and future directions. J. Netw. Comput. Appl. 2018, 103, 1–17. [Google Scholar] [CrossRef]
  10. Şimşek, M.U.; Özdemir, S. CEP Rule Extraction From Unlabeled Data in IoT. In Proceedings of the 2018 3rd International Conference on Computer Science and Engineering (UBMK), Sarajevo, Bosnia and Herzegovina, 20–23 September 2018; pp. 429–433. [Google Scholar]
  11. Gökalp, M.O.; Koçyiğit, A.; Eren, P.E. A visual programming framework for distributed Internet of Things centric complex event processing. Comput. Electr. Eng. 2019, 74, 581–604. [Google Scholar] [CrossRef]
  12. Starks, F.; Goebel, V.; Kristiansen, S.; Plagemann, T. Mobile distributed complex event processing—Ubi Sumus? Quo vadimus? In Mobile Big Data; Springer: Berlin/Heidelberg, Germany, 2018; pp. 147–180. [Google Scholar]
  13. Monnier, O. A Smarter Grid with the Internet of Things. Texas Instruments. 2013. Available online: https://files.iccmedia.com/pdf/ti-iot-tf140513.pdf (accessed on 2 May 2022).
  14. Eckert, M.; Bry, F. Aktuelles Schlagwort “Complex Event Processing (cep)”. Informatik-Spektrum. 2009, pp. 163–167. Available online: https://epub.ub.uni-muenchen.de/14902/1/bry_14902.pdf (accessed on 3 May 2022).
  15. Wanner, J.; Wissuchek, C.; Janiesch, C. Machine Learning and Complex Event Processing. EMISAJ 2020, 15, 1. [Google Scholar] [CrossRef]
  16. Ma, Z.; Yu, W.; Zhai, X.; Jia, M. A complex event processing-based online shopping user risk identification system. IEEE Access 2019, 7, 172088–172096. [Google Scholar] [CrossRef]
  17. Cugola, G.; Margara, A. Processing flows of information: From data stream to complex event processing. ACM Comput. Surv. 2012, 44, 1–62. [Google Scholar] [CrossRef]
  18. Akbar, A.; Carrez, F.; Moessner, K.; Sancho, J.; Rico, J. Context-aware stream processing for distributed IoT applications. In Proceedings of the 2015 IEEE 2nd World Forum on Internet of Things (WF-IoT), Milan, Italy, 14–16 December 2015; pp. 663–668. [Google Scholar]
  19. Graves, A. Long short-term memory. In Supervised Sequence Labelling with Recurrent Neural Networks; 2012; pp. 37–45. Available online: https://linkspringer.53yu.com/chapter/10.1007/978-3-642-24797-2_4 (accessed on 3 May 2022).
  20. Vaswani, A.; Shazeer, N.; Parmar, N.; Uszkoreit, J.; Jones, L.; Gomez, A.N.; Kaiser, Ł.; Polosukhin, I. Attention is all you need. In Proceedings of the Thirty-First Annual Conference on Neural Information Processing Systems (NIPS), Long Beach, CA, USA, 4–9 December 2017. [Google Scholar]
  21. Quinlan, J.R. Induction of decision trees. Mach. Learn. 1986, 1, 81–106. [Google Scholar] [CrossRef]
  22. Chang, Y.S.; Chiao, H.T.; Abimannan, S.; Huang, Y.P.; Tsai, Y.T.; Lin, K.M. An LSTM-based aggregated model for air pollution forecasting. Atmos. Pollut. Res. 2020, 11, 1451–1463. [Google Scholar] [CrossRef]
  23. Cichowicz, R.; Dobrzański, M. Analysis of Air Pollution around a CHP Plant: Real Measurements vs. Computer Simulations. Energies 2022, 15, 553. [Google Scholar] [CrossRef]
  24. Delavar, M.R.; Gholami, A.; Shiran, G.R.; Rashidi, Y.; Nakhaeizadeh, G.R.; Fedra, K.; Hatefi Afshar, S. A novel method for improving air pollution prediction based on machine learning approaches: A case study applied to the capital city of Tehran. ISPRS Int. J. Geo-Inf. 2019, 8, 99. [Google Scholar] [CrossRef]
  25. Todorov, V.; Dimov, I. Innovative Digital Stochastic Methods for Multidimensional Sensitivity Analysis in Air Pollution Modelling. Mathematics 2022, 10, 2146. [Google Scholar] [CrossRef]
  26. Motlagh, N.H.; Zaidan, M.A.; Fung, P.L.; Li, X.; Matsumi, Y.; Petäjä, T.; Kulmala, M.; Tarkoma, S.; Hussein, T. Low-cost air quality sensing process: Validation by indoor-outdoor measurements. In Proceedings of the 2020 15th IEEE Conference on Industrial Electronics and Applications (ICIEA), Kristiansand, Norway, 9–13 November 2020; pp. 223–228. [Google Scholar]
  27. Mehdiyev, N.; Krumeich, J.; Enke, D.; Werth, D.; Loos, P. Determination of rule patterns in complex event processing using machine learning techniques. Procedia Comput. Sci. 2015, 61, 395–401. [Google Scholar] [CrossRef]
  28. Boubeta-Puig, J.; Ortiz, G.; Medina-Bulo, I. MEdit4CEP: A model-driven solution for real-time decision making in SOA 2.0. Knowl.-Based Syst. 2015, 89, 97–112. [Google Scholar] [CrossRef]
  29. Sun, Y.; Li, G.; Ning, B. Automatic Rule Updating based on Machine Learning in Complex Event Processing. In Proceedings of the 2020 IEEE 40th International Conference on Distributed Computing Systems (ICDCS), Singapore, 29 November–1 December 2020; pp. 1338–1343. [Google Scholar]
  30. Naseri, M.M.; Tabibian, S.; Homayounvala, E. Intelligent Rule Extraction in Complex Event Processing Platform for Health Monitoring Systems. In Proceedings of the 2021 11th International Conference on Computer Engineering and Knowledge (ICCKE), Mashhad, Iran, 28–29 October 2021; pp. 163–168. [Google Scholar]
  31. Petersen, E.; To, M.A.; Maag, S.; Yamga, T. An unsupervised rule generation approach for online complex event processing. In Proceedings of the 2018 IEEE 17th International Symposium on Network Computing and Applications (NCA), Cambridge, MA, USA, 1–3 November 2018; pp. 1–8. [Google Scholar]
  32. Margara, A.; Cugola, G.; Tamburrelli, G. Learning from the past: Automated rule generation for complex event processing. In Proceedings of the 8th ACM International Conference on Distributed Event-Based Systems, Mumbai, India, 26–29 May 2014; pp. 47–58. [Google Scholar]
  33. Simsek, M.U.; Yildirim Okay, F.; Ozdemir, S. A deep learning-based CEP rule extraction framework for IoT data. J. Supercomput. 2021, 77, 8563–8592. [Google Scholar] [CrossRef]
  34. Shi, X.; Chen, Z.; Wang, H.; Yeung, D.Y.; Wong, W.K.; Woo, W.c. Convolutional LSTM network: A machine learning approach for precipitation nowcasting. In Proceedings of the 28th International Conference on Neural Information Processing Systems, Montreal, QC, Canada, 7–12 December 2015. [Google Scholar]
  35. Liu, B.; Yan, S.; Li, J.; Qu, G.; Li, Y.; Lang, J.; Gu, R. An attention-based air quality forecasting method. In Proceedings of the 2018 17th IEEE International Conference on Machine Learning and Applications (ICMLA), Orlando, FL, USA, 17–20 December 2018; pp. 728–733. [Google Scholar]
  36. Hochreiter, S.; Schmidhuber, J. Long short-term memory. Neural Comput. 1997, 9, 1735–1780. [Google Scholar] [CrossRef] [PubMed]
  37. Yang, Y.; Xiong, Q.; Wu, C.; Zou, Q.; Yu, Y.; Yi, H.; Gao, M. A study on water quality prediction by a hybrid CNN-LSTM model with attention mechanism. Environ. Sci. Pollut. Res. 2021, 28, 55129–55139. [Google Scholar] [CrossRef] [PubMed]
  38. Bahdanau, D.; Cho, K.; Bengio, Y. Neural machine translation by jointly learning to align and translate. arXiv 2014, arXiv:1409.0473. [Google Scholar]
  39. Braei, M.; Wagner, S. Anomaly detection in univariate time-series: A survey on the state-of-the-art. arXiv 2020, arXiv:2004.00433. [Google Scholar]
  40. Graves, A.; Schmidhuber, J. Framewise phoneme classification with bidirectional LSTM and other neural network architectures. Neural Netw. 2005, 18, 602–610. [Google Scholar] [CrossRef]
  41. Chung, J.; Gulcehre, C.; Cho, K.; Bengio, Y. Empirical evaluation of gated recurrent neural networks on sequence modeling. arXiv 2014, arXiv:1412.3555. [Google Scholar]
  42. The CityPulse Consortium. CityPulse Annual Report. 2016. Available online: http://iot.ee.surrey.ac.uk:8080/datasets/pollution (accessed on 30 May 2022).
  43. Ali, M.I.; Gao, F.; Mileo, A. CityBench: A Configurable Benchmark to Evaluate RSP Engines Using Smart City Datasets. In Proceedings of the ISWC 2015, 14th International Semantic Web Conference, Bethlehem, PA, USA, 11–15 October 2015; pp. 374–389. [Google Scholar]
  44. Kolozali, S.; Bermudez-Edo, M.; Puschmann, D.; Ganz, F.; Barnaghi, P. A Knowledge-based Approach for Real-Time IoT Data Stream Annotation and Processing. In Proceedings of the IEEE International Conference on Internet of Things (iThings), Taipei, Taiwan, 1–3 September 2014. [Google Scholar] [CrossRef]
  45. Willmott, C.J.; Matsuura, K. Advantages of the mean absolute error (MAE) over the root mean square error (RMSE) in assessing average model performance. Clim. Res. 2005, 30, 79–82. [Google Scholar] [CrossRef]
  46. Chai, T.; Draxler, R.R. Root mean square error (RMSE) or mean absolute error (MAE)?–Arguments against avoiding RMSE in the literature. Geosci. Model Dev. 2014, 7, 1247–1250. [Google Scholar] [CrossRef]
  47. Zhang, J.; Florita, A.; Hodge, B.M.; Lu, S.; Hamann, H.F.; Banunarayanan, V.; Brockway, A.M. A suite of metrics for assessing the performance of solar power forecasting. Solar Energy 2015, 111, 157–175. [Google Scholar] [CrossRef]
  48. Jain, A.; Nandakumar, K.; Ross, A. Score normalization in multimodal biometric systems. Pattern Recognit. 2005, 38, 2270–2285. [Google Scholar] [CrossRef]
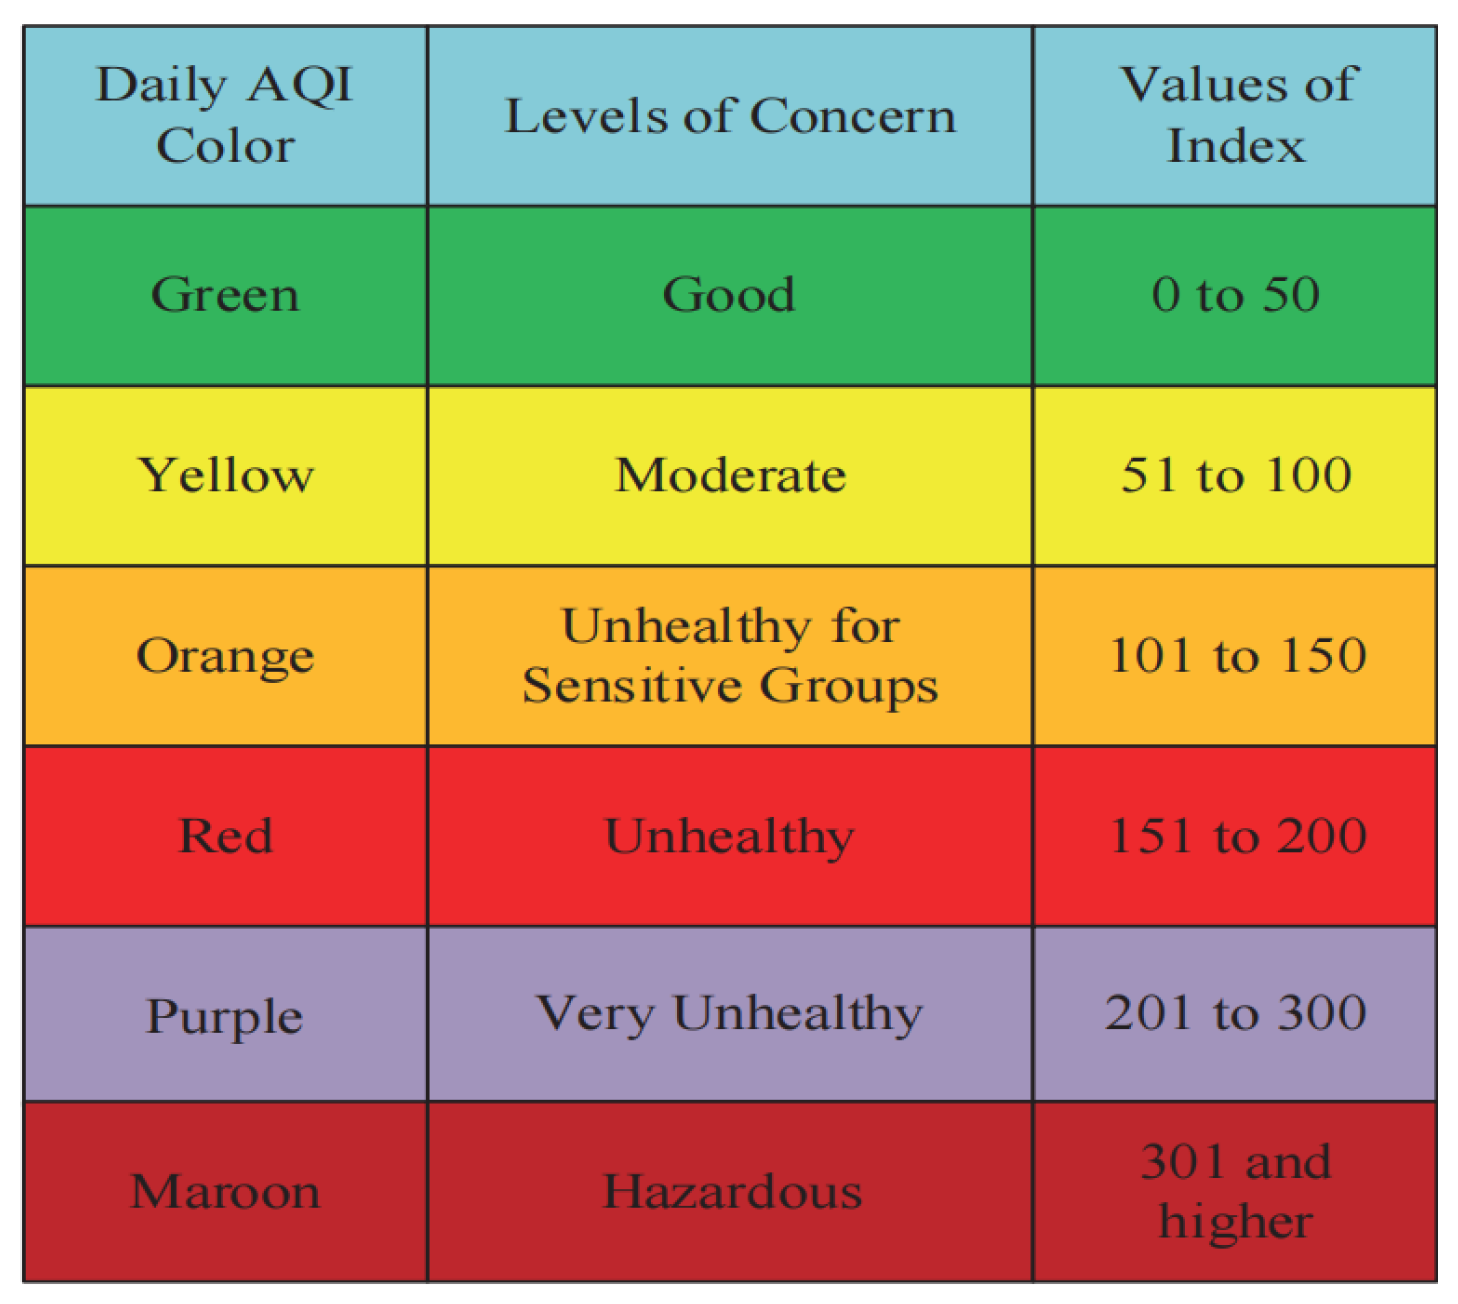
  49. Gadekar, M.C.S. Air Quality Index (AQI) Basics. Int. J. Res. Publ. Rev. 2022, 3, 805–807. [Google Scholar]
  50. McMahan, H.B.; Holt, G.; Sculley, D.; Young, M.; Ebner, D.; Grady, J.; Nie, L.; Phillips, T.; Davydov, E.; Golovin, D.; et al. Ad click prediction: A view from the trenches. In Proceedings of the 19th ACM SIGKDD International Conference on Knowledge Discovery and Data Mining, Chicago, IL, USA, 11–14 August 2013; pp. 1222–1230. [Google Scholar]
Figure 1. The CEP framework.
Energies 15 05892 g001
Figure 2. The proposed framework.
Energies 15 05892 g002
Figure 3. The proposed model.
Energies 15 05892 g003
Figure 4. The structure of the LSTM [36].
Energies 15 05892 g004
Figure 5. The comparison for particulate matter.
Energies 15 05892 g005
Figure 6. The comparison for ozone.
Energies 15 05892 g006
Figure 7. The comparison for sulfur dioxide.
Energies 15 05892 g007
Figure 8. The comparison for carbon monoxide.
Energies 15 05892 g008
Figure 9. The importance of the variables.
Energies 15 05892 g009
Figure 11. AQI.
Figure 11. AQI.
Energies 15 05892 g011
Figure 12. The warning data.
Energies 15 05892 g012
Table 1. The basic information contained in the dataset.
MaxMinMeanStd
particulate matter21515124.9054.04
nitrogen dioxide21515107.1054.09
sulfur dioxide21515116.5954.61
carbon monoxide2151598.1349.70
ozone21515111.0455.04
Table 2. The optimal hyperparameters of the four models.
Model NameParameter SettingLearning Rate
LSTMEpoch: 50, Batch Size: 128, Units: 1280.001
Bidirectional LSTMEpoch: 40, Batch Size: 128, Units: 1280.001
GRUEpoch: 40, Batch Size: 128, Units: 1280.001
NewModelEpoch: 40, Batch Size: 128,0.001
First-Layer LSTM Units: 64,
Second-Layer LSTM Units: 32
Table 3. The performance of the four models.
LSTMBiLSTMGRUNew Model
MAE0.04580.05240.04460.0407
RMSE0.0590.0660.0570.051
MAPE27.1525.6019.7116.49
Table 4. Prediction results of the decision tree algorithm.
Class01Accuracy
Precision0.790.93
Recall0.800.92
F1-Score0.790.930.89
Support180519699
Publisher’s Note: MDPI stays neutral with regard to jurisdictional claims in published maps and institutional affiliations.

