Abstract
Production of syngas from the gasification of a biomass is attracting attention with an eye to the concepts of circularity, sustainability, and recent needs, triggered by socio-political events, to increase the level of self-sufficiency of energy sources for a given community. This manuscript reports on the gasification of spruce wood chips in a demonstration fluidised bed gasifier (1.5 MWth, height of 5.40 m, internal diameter of 1.2 m), with 0.2–0.4 mm olivine inventory (1000 kg). Gasification was carried out in air, at four different values of equivalence ratio (from 27% to 36%). The bed was fluidised at about 0.6 m/s, and the bed temperature resulted in the range of about 960–1030 °C as a function of the different tests. A mass flow rate of biomass in the range of about 360–480 kg/h (as a function of the different tests) was fed to the fluidised bed gasifier. Syngas lower heating value, specific mass and energetic yield, and chemical composition, were reported along with data on the production of elutriated fines. Moreover, tar compounds were collected, quantified and chemically speciated. The effect of the equivalence ratio on the main process parameter was critically discussed, proposing useful analytical relationships for the prediction of syngas lower heating value, tar mass flow rate and chemical composition.
Keywords:
gasification; fluidised bed; biomass; spruce wood chips; equivalence ratio; syngas; hydrogen; tar 1. Overview
Among the advantages of gasification over combustion of solid wastes, a lower production of sulphur and nitrogen oxides, of dioxins, and a reduction in the reactor volume are here recalled [1]. Syngas obtained via gasification, to be then flexibly used, e.g., as an energy source also in places/times different from those of production, can be effectively obtained using biomass as solid fuel, with an eye to the concepts of circularity and sustainability (that can be, in turn, increased if gasification ashes are used in the construction materials industry or as adsorbent for fluid streams purification [2,3,4]). In addition, recent events are highlighting the need, for each community, to increase the level of self-sufficiency in terms of energy sources. Furthermore, it is well known that syngas has wide potential for use as a material source, as well [5]. Finally, the concept gains further interest if medium/low-quality biomass, such as that under scrutiny in this work (i.e., spruce wood chips (SWC)), is used as a parent fuel [6,7,8,9].
Nonetheless, concerns arise when a biomass is used as fuel to produce syngas, and they are mainly focused on the heterogeneous composition of these materials, which may negatively affect both the gasifier performance and the generation of undesired compounds such as tar, condensable organic compounds produced along with syngas that are commonly not accepted in the devices for end-use application of the syngas [10]. Proper selection of gasifier design and operating conditions, use of a catalyst during gasification, cleaning of the syngas (e.g., by thermo-catalytic tar cracking or by filtering) are means to deal with this issue.
In this context, fluidised bed (FB) reactors are widely known to be appropriate as gasifiers, due to the very good mass and heat transfer coefficients ensured by FB fluid-dynamics, and to the possibility of controlling emissions through a proper design of the gasifier and its operating conditions [11,12,13,14,15,16,17,18].
Gasification of wood biomass is a topic of interest in many research papers. A review on the present state of wood biomass gasification technologies can be found in [19]. Most of the research, indeed, has been focused on lab-scale FB gasifiers [20,21,22]. Less has been said on the performance of this process at larger reactor scale. Accordingly, in this manuscript, a FB facility (demonstration scale, 1.5 MWth) was used for investigating the effect of the air/fuel equivalence ratio, as the most relevant operating condition, on syngas lower heating value, specific mass and energetic yield, chemical composition, production of tar compounds and their chemical speciation. Apart from the novelty represented by the use of a large-scale fluidised bed gasifier, analytical relationships relating equivalence ratio, syngas lower heating value, mass flow rate of tar, and concentration of groups of species in tar, are obtained with the aim of offering an operative tool for the system under investigation.
2. Materials, Equipment, and Experimental Procedures
2.1. Biomass
The lignocellulosic biomass used as fuel is red spruce wood, coming from the Tuscan-Emilian Apennines (Italy), collected in the surroundings of the gasification facility. The red spruce logs are processed in a drum chipper and then sieved, in order to obtain SWC with particle size distribution P45, according to the technical specification CEN/TS 14961:2005.
SWC has been characterised by elemental and proximate analysis (LECO CHN628 analyser with ASTM D5373 standard procedure for C, H, N determination; LECO SC-144DR analyser with UNI 7584 standard procedure for S determination; TGA701 LECO thermobalance, UNI 9903/ASTM D5142 standard procedures for proximate analysis). Results are reported, on dry and wet basis, in Table 1. The contents of C (44–48%), H (circa 6%), N (<1%) and S (not detected) are in line with typical ranges for such kinds of biomasses. SWC moisture amount is about 9%, and its ash content about 0.15%.

Table 1.
Elemental and proximate analysis of spruce wood chips (% by weight).
2.2. Fluidised Bed Gasifier
The experimental runs were carried out using a demonstration bubbling fluidised bed gasifier (BFBG) with maximum thermal input of 1.5 MWth, located in Emilia-Romagna region, Italy. The gasification facility consists of three main sections: the FB gasifier, the gas treatment section, and the energy generation unit. A schematic illustration of the system is shown in Figure 1.
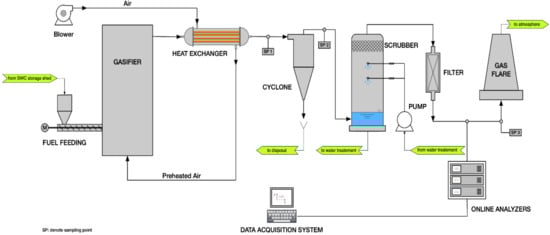
Figure 1.
Scheme of the 1.5 MWth spruce wood chips gasification facility.
The BFBG has a cylindrical shape with total height of 5.40 m and internal diameter of 1.20 m. During the start-up phase, the BFBG is heated-up to 350 °C, thanks to the sensible heat generated by a 250 kW methane burner. Then, the gasification starting bed temperature of 800 °C (measured with three K-type thermocouples positioned at 120 degrees in the splashing zone of the bed) is reached operating the FB reactor in combustion mode, using air as comburent and SWC as fuel. A blower, with maximum flow rate of 1000 kg/h, provides air supply to the reactor.
During the gasification process, the burner is turned-off and air is pre-heated at about 550 °C (at steady state conditions) by a shell and tube heat exchanger (air flows through the shell, while syngas flows through the tubes). The pre-heated air enters the plenum of the reactor from the bottom, and then into the bed through nozzles specifically designed to ensure a homogeneous distribution of the fluidising/gasifying gas in the bed cross-section.
SWC coming from the storage shed is dried in a belt dryer, and then it is sent to a wood chip hopper. From the hopper, through a screw-feeder, SWC is continuously over-bed fed to the reactor. An air flow of 10 Nm3/h is used to help the fuel feeding and to avoid the back flow of the hot gas to the feedstock hopper. The SWC and the air flow rates are mutually adjusted so that, at the fixed fluidising velocity, the desired air/fuel equivalence ratio (ER; defined, as usual, as the ratio between the actual flow rate of oxygen in air supply and that theoretically required for the stoichiometric combustion of the fuel fed to the reactor) is obtained.
The gas generated in the reactor is sent to the gas treatment section composed of a high efficiency cyclone, a wet scrubber, a wood chip filter, and a flare zone. The cyclone removes large part of the particulate (elutriated fines) contained in the gas. At the exit of the cyclone, there is the heat exchanger and then the water scrubber which provides for the removal of almost all the remaining solid particles, NH3, HCl, H2S and tars. Then, the gas is sent to the wood chip filter, which eliminates moisture and tar residues from the gas. Finally, the syngas, when it is not being used for electric power generation, is burned in the flare section.
The gasification facility is equipped with a 500 kWel Guascor gas engine generator, for the conversion of syngas into electric power.
2.3. Analytical Equipment for Gasification Products Characterisation
Syngas coming from the gas cleaning section was analysed by using an Agilent 490 Micro GC QUAD gas chromatograph (µGC) which provides the gas composition in terms of CO2, CO, H2, CH4, N2 and light hydrocarbons (CnHm), i.e., hydrocarbons containing 2–4 atoms of C, such as C2H2, C2H4, C2H6, C3H6, C3H8 and C4H10. The flow rate of syngas was measured by using a Pitot tube flowmeter and calculated by applying the tie component method to the nitrogen content in the dry gas, as obtained by on-line µGC measurements.
Elutriated particles collected by the cyclone were analysed with a LECO CHN628 instrument for C, H, N determination.
For the sampling of tars, a system composed of a heated probe, a heated particle filter and a series of four impinger bottles (containing dichloromethane to dissolve tars) was used. The gas was sampled for 1 h at a flow rate of 0.10 Nm3/min. The sampler probe was inserted into a pipeline downstream of the reactor, where the temperature of the syngas was about 400 °C. The condensed tars are then washed from the sampling line and impinger bottles using dichloromethane, and collected in dark glass bottles. After, the condensate is off-line analysed in an Agilent 7890A gas chromatograph (GC) with MSD5975C mass spectrometric (MS) detector.
2.4. Operating Conditions of the Gasification Tests
Four gasification tests have been carried out, as listed in Table 2.
Table 2.
Main operating conditions of FB gasification tests of spruce wood chips.
Olivine was chosen as bed material for its ability to act as catalyst for in situ tar decomposition and to favourably adjust the syngas composition [23,24,25]. For each experimental run, an inventory of 1000 kg of olivine with particles size range of 0.2–0.4 mm was used. The olivine used in this work was provided by Magnolithe GmbH (Austria), and was mainly composed of MgO (49%), SiO2 (40%), and Fe2O3 (10%) oxides, while traces of Al2O3, CaO and Cr2O3 were present.
The bed was fluidised at a velocity UG of about 0.6 m/s (calculated at process conditions), so to operate the FB under bubbling regime. Fluidising agent was air (mass flow rate WA = 680 kg/h). The fuel biomass mass flow rate, WF, ranged between 359 and 478 kg/h. Knowing the SWC characteristics as in Table 1, these values result in ER of 0.27, 0.30, 0.33 and 0.36 of the stoichiometric value for test termed ER27, ER30, ER33 and ER36, respectively, so ensuring operating conditions sufficiently far from ER = 100% and able to favour the desired gasification (rather than combustion) kinetic patterns. The bed temperature TB ranged between 960 and 1030 °C, increasing at increasing ER value.
3. Results and Discussion
3.1. Production of Syngas and Fines Elutriation
We start our analysis with the outcomes of the test ER27 (Table 3 and Figure 2). Values of the average absolute deviation δ, taken on n = 10 measurements, have been reported:
where ξ is the measurement value of a given parameter, and μ is the average value for ξ over ten measures. FB gasification of SWC determined a syngas whose H2 and CO content (dry basis) was 12.29% and 18.44%, respectively. The methane amount was 4.76%, while the content of other hydrocarbons (indicated with CnHm and represented by acetylene, ethylene, ethane, propylene, propane, isobutane) was 1.56%. The rest is CO2 (14.81%) and N2 (48.14%). The lower heating value (LHV) was calculated, from the syngas chemical composition, as 6352 kJ/Nm3. The syngas specific mass yield, defined as the ratio between the syngas volumetric flow rate (QSG) and the fuel mass flow rate:
was 1.81 Nm3/kg for this test. The product between the last two parameters gives the syngas specific energetic yield:
the result of which is 11,525 kJ/kg.
Table 3.
Main outcomes of the spruce wood chips FB gasification tests (chemical composition for syngas is reported in Figure 2). Average absolute deviation (on ten measurements) is reported.
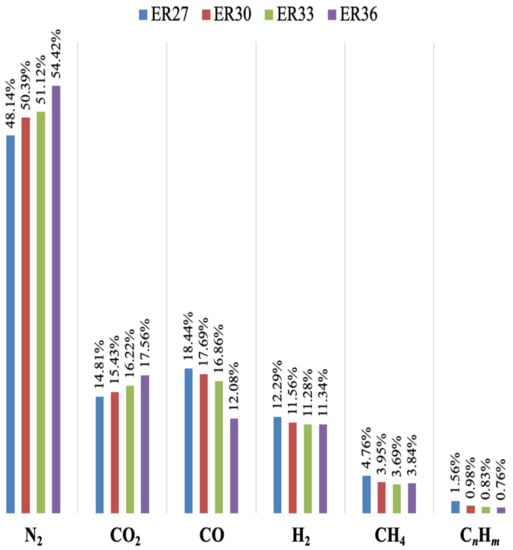
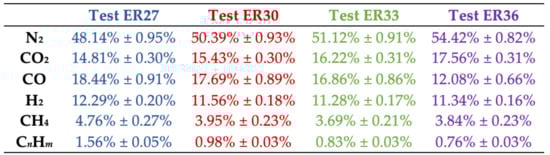
Figure 2.
Chemical speciation of syngas (% by vol.) produced by FB gasification of spruce wood chips, at different values of the equivalence ratio (CnHm = C2H2 + C2H4 + C2H6 + C3H6 + C3H8 + C4H10). The scheme below the figure reports values for average absolute deviation, on ten measurements.
At increasing values of the equivalence ratio (and, therefore, of bed temperature from about 960 °C to 1030 °C, cf. Table 2), biomass decomposition into syngas was enhanced. Therefore, higher values for YSG at increasing ER (i.e., going from test ER27 to test ER36, YSG increases from 1.81 to 2.14) were observed. Nonetheless, the less reducing conditions, experienced by the SWC biomass in the FB gasifier when ER was increased, determined a lower quality of the syngas. As a matter of fact, H2, CH4, CO and CnHm content decreased down to 11.34%, 3.84%, 12.08% and 0.76%, respectively, while that of carbon dioxide increased (it was 17.56% for ER = 0.36) in close relationship with the larger oxygen content available for higher values of the equivalence ratio. In terms of LHV, a loss of 27.5% was recorded in test ER36 vs. test ER27. More in detail, an almost linear effect of ER on LHV was observed (Figure 3) under our operating conditions:
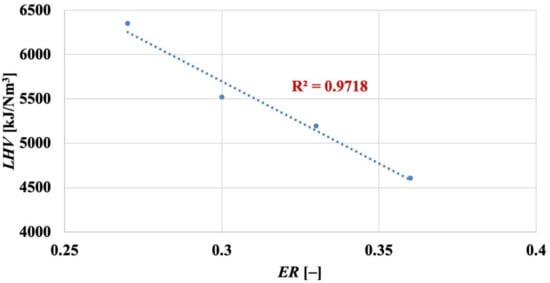
Figure 3.
Fluidised bed gasification of spruce wood chips: effect of equivalence ratio on lower heating value (dry basis) of the produced syngas.
Equation (4) gives LHV in [kJ/Nm3], for ER expressed on 1-basis. In Equation (3), the role of decreasing LHV overtakes that of increasing YSG; therefore, a loss of 14.6% in was observed in test ER36 vs. test ER27.
Indeed, our values for LHV (dry basis), when reported on a N2-free basis, range between 10.1 and 12.2 MJ/Nm3, i.e., within the range reported by NETL-DOE, USA [26], where data from industrial gasifiers to produce syngas as energetic vector are reported (LHV = 8.3–13.0 MJ/Nm3 on a dry and N2-free basis). In addition, it is observed that a qualitative relationship between ER and LHV, similar to the one depicted in Figure 3, has been highlighted by Lan et al. in their Figure 9 [20], although using a different biomass (pine wood chips) and under different operating conditions (temperature from 700 to 800 °C, ER from 0.15 to 0.25). Moreover, the quality of the obtained syngas is satisfying when compared with the data present in the literature. For example, it has been reported [21] that, at ER = 0.26, gasification of a biomass based on spruce wood chips yielded a syngas with values for the H2/CO and H2/CH4 ratios of 0.49 and 1.73, respectively. From Figure 2, at a similar ER (= 0.27), it is H2/CH4 = 0.67 and H2/CH4 = 2.58, to highlight the high hydrogen yield obtained in our demonstration FB gasifier. Finally, the absence of oxygen in syngas (cf. Figure 2) confirms its full involvement in the biomass gasification process.
The amount of elutriated fines ranged between 8.99 and 26.85 kg/h, values that, reported vs. WF, lie between 1.88 and 4.00%, while when reported vs. QSG, the fines concentration was in the range 10.36–20.33 g/Nm3.
3.2. Tar Production and Characterisation
As listed in Table 3, tar production accounted for a mass flow rate WT decreasing from 3.35 kg/h to 1.32 kg/h (i.e., from 0.70% to 0.37% of WF) when the equivalence ratio increased from 0.27 to 0.36. While, as reported in Figure 3, lower ER values increase the syngas quality, the less oxidising conditions (and the lower bed temperatures) associated with low equivalence ratios orient the kinetic patterns towards the production of tar (rather than to tar conversion towards less harmful species), with an influence of ER on the % of produced tar (respect to the inlet biomass) which, again, results in an almost linear effect (Figure 4):
with ER expressed on 1-basis. If the tar production is expressed as CT, concentration in syngas (Table 3):
it can be seen that values, decreasing from 3.86 to 1.72 g/Nm3, are in line with the literature indications when starting from biomass as a parent fuel [27,28]. This highlights the efficacy of both the operating conditions employed and reactor design. The general circumstance that at higher temperatures (i.e., cf. Table 2, higher equivalence ratio), the syngas yield is higher, and the tar yield is lower, is in line with the literature indications [22].
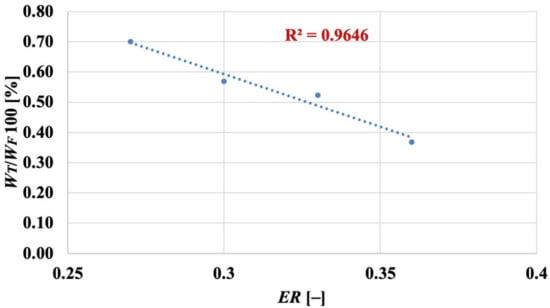
Figure 4.
Fluidised bed gasification of spruce wood chips: effect of equivalence ratio on % of produced tar vs. inlet biomass.
Values of CT were quantitatively speciated through GC-MS analysis, to scrutinise the chemical composition of tar (Table 4 and Figure 5). For the SWC gasification carried out at ER = 0.27, CT was 3.86 g/Nm3, which comprised the following:
Table 4.
Chemical speciation (GC-MS analysis) of tar produced upon fluidised bed gasification of spruce wood chips, as a function of the equivalence ratio. List of substances investigated but not retrieved in tar samples: 1-Methylethylidene phenol; Benzene; Phenylacetylene; Benzonitrile; Indene; Biphenylene; Cyclopenta[c,d]pyrene; Coronene; Dibenzo[a,i]pyrene; Perylene.
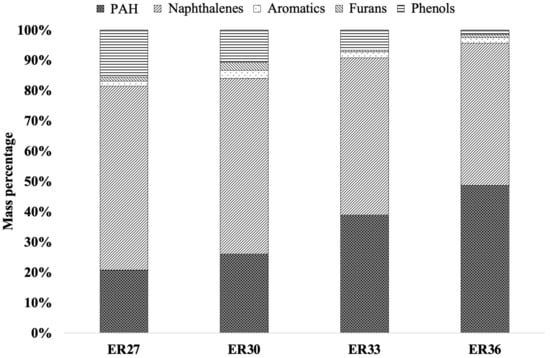
Figure 5.
Speciation (GC-MS analysis) of tar produced upon fluidised bed gasification of spruce wood chips, as a function of the equivalence ratio and according to chemical classes of compounds as defined in Table 4.
- Naphthalene, a 2-rings polycyclic aromatic hydrocarbon (PAH), along with small amounts of 1- and 2-methylnaphthalene, accounted for the most relevant fraction (60.77%);
- Other PAH (from C9 to C16), prevailingly composed by indane (2-rings), acenaphthylene (3-rings), phenanthrene (3-rings) and pyrene (4-rings), accounted for 20.79%;
- 15.52% was characterised by phenol;
- Styrene and dibenzofuran (a 3-rings PAH containing oxygen) accounted for 1.56% and 1.36%, respectively.
When ER is increased up to 0.36, the most noticeable observations are:
- The amount of phenols steadily decreases, down to 1.49% (on the basis of the value of CT) for ER = 0.36; starting from ER = 0.33, 3- and 4-methylphenol are observed as minor compounds in this class; the same happens for the three naphthalene-based compounds (whose total concentration steadily decreases to 46.92% at ER = 0.36);
- Correspondingly, the higher temperatures associated with higher ER values favour the formation of other (and, also, more complex) PAH (up to C16, C20 and C22 for ER = 0.30, 0.33 and 0.36, respectively), whose total concentration steadily increases up to 48.75% for ER = 0.36; starting from ER = 0.30 on, biphenyl (2-rings), fluorene (3-rings) and anthracene (3-rings) appear as other relevant species, together with a plethora of minor compounds.
Figure 6a–c illustrates the linear relationship binding ER with the % of phenols, naphthalenes, and other PAH, respectively. They are represented by the following fitting equations (showing, as the others proposed in this work, very good values for the coefficient of determination); it is recalled that, for “other PAH”, we mean those listed in Table 4; ER in the following equations is, again, expressed on 1-basis:
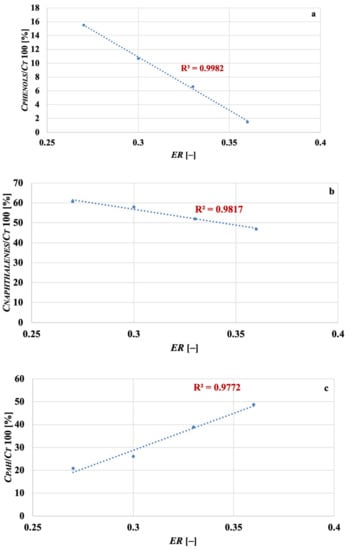
Figure 6.
Fluidised bed gasification of spruce wood chips: effect of equivalence ratio on % of phenols (a), naphthalenes (b) and other PAH (c) retrieved in tar.
4. Conclusions
From gasification tests of spruce wood chips, carried out in a demonstration bubbling fluidised bed gasifier (1.5 MWth, fully equipped and operative; this, indeed, is representative of a reactor scale rarely investigated in the literature) at four different values of the air/fuel equivalence ratio (ER), it resulted that tests at higher ER (i.e., less reducing conditions and higher bed temperatures) determined a higher syngas specific mass yield (up to 2.14 Nm3/kg of fuel) but with a less favourable chemical composition. For example, a loss of 14.6% and 27.5% in syngas specific energetic yield and lower heating value, respectively, was recorded when ER was increased from 0.27 to 0.36. On a N2-free basis, the syngas lower heating value was about 10–12 MJ/Nm3, falling in the range recommended for industrial syngas seen as energetic vector. Hydrogen-to-carbon monoxide and hydrogen-to-methane ratios in syngas were fully satisfying when compared with data reported in the literature for fluidised bed gasification of the same kind of biomass.
On the other hand, the higher the ER, the less relevant is the tar production (decreasing to 1.32 kg/h for ER = 0.36; tar concentration in syngas is in line with the literature indications). This highlights the need of a proper trade-off in order to select the value of the equivalence ratio (and, therefore, the inlet flow rates of air and fuel) most useful according to the required specifics. To give a contribution in this sense, analytical linear relationships connecting the equivalence ratio with (i) syngas lower heating value, (ii) mass flow rate of tar (reported to inlet biomass flow rate), and (iii) concentration of phenols, naphthalenes, and other polycyclic aromatic hydrocarbons in tar are proposed in this work as an operative tool for the system under scrutiny.
Author Contributions
Conceptualization, L.Z.; methodology, L.Z.; formal analysis, F.M. and L.Z.; investigation, L.Z.; resources, L.Z.; data curation, F.M. and L.Z.; writing—original draft preparation, F.M. and L.Z.; writing—review and editing, F.M. and L.Z.; visualization, F.M.; supervision, F.M. and L.Z.; project administration, L.Z. All authors have read and agreed to the published version of the manuscript.
Funding
This research received no external funding.
Acknowledgments
The authors are indebted to Vincenzo Leone, who performed part of the off-line analysis of the reported runs.
Conflicts of Interest
The authors declare no conflict of interest.
Abbreviations
| CNAPHTHALENES | Concentration of naphthalenes in tar | [g/Nm3] |
| CPAH | Concentration of other PAH in tar | [g/Nm3] |
| CPHENOLS | Concentration of phenols in tar | [g/Nm3] |
| CT | Tar concentration in syngas | [g/Nm3] |
| ER | Air/fuel equivalence ratio | [–] |
| LHV | Lower heating value | [kJ/Nm3] |
| n | Number of measurements | [–] |
| QSG | Syngas volumetric flow rate | [Nm3/h] |
| TB | Bed temperature | [°C] |
| UG | Superficial fluidisation velocity | [m/s] |
| WA | Air inlet mass flow rate | [kg/h] |
| WF | Fuel (biomass) inlet mass flow rate | [kg/h] |
| WT | Tar mass flow rate | [kg/h] |
| YSG | Syngas specific mass yield | [Nm3/kg] |
| Syngas specific energetic yield | [kJ/kg] | |
| δ | Average absolute deviation | |
| µ | Average value for a given parameter over n measures | |
| ξ | Measurement value of a given parameter |
References
- Stiegel, G.J.; Maxwell, R.C. Gasification technologies: The path to clean, affordable energy in the 21st century. Fuel Process. Technol. 2001, 71, 79–97. [Google Scholar] [CrossRef]
- Kalpokaitė-Dičkuvienė, R.; Lukošiūtė, I.; Brinkienė, K.; Striūgas, N.; Baltušnikas, A.; Lukauskaitė, R.; Čėsnienė, J. Utilization of sewage sludge-biomass gasification residue in cement-based materials: Effect of pozzolant type. Environ. Technol. 2018, 39, 2937–2950. [Google Scholar] [CrossRef] [PubMed]
- Maneerung, T.; Li, X.; Li, C.; Dai, Y.; Wang, C. Integrated downdraft gasification with power generation system and gasification bottom ash reutilization for clean waste-to-energy and resource recovery system. J. Clean. Prod. 2018, 188, 69–79. [Google Scholar] [CrossRef]
- Ribeiro, P.B.; de Freitas, V.O.; Machry, K.; Muniz, A.R.C.; da Rosa, G.S. Evaluation of the potential of coal fly ash produced by gasification as hexavalent chromium adsorbent. Environ. Sci. Pollut. Res. 2019, 26, 28603–28613. [Google Scholar] [CrossRef]
- Dudyński, M. Gasification of selected biomass waste for energy production and chemicals recovery. Chem. Eng. Trans. 2018, 65, 391–396. [Google Scholar]
- Wang, L.; Maziarka, P.; Skreiberg, Ø.; Løvås, T.; Wądrzyk, M.; Sevault, A. Study of CO2 gasification reactivity of biocarbon produced at different conditions. Energy Procedia 2017, 142, 991–996. [Google Scholar] [CrossRef]
- Pollex, A.; Lesche, S.; Kuptz, D.; Zeng, T.; Kuffer, G.; Mühlenberg, J.; Hartmann, H.; Lenz, V. Influence of screening and drying on low-quality wood chips for application in small-scale gasification plants. Chem. Eng. Technol. 2020, 43, 1493–1505. [Google Scholar] [CrossRef]
- Cerone, N.; Zimbardi, F. Effect of oxygen and steam equivalence ratios on updraft gasification of biomass. Energies 2021, 14, 2675. [Google Scholar] [CrossRef]
- Korus, A.; Ravenni, G.; Loska, K.; Korus, I.; Samson, A.; Szlęk, A. The importance of inherent inorganics and the surface area of wood char for its gasification reactivity and catalytic activity towards toluene conversion. Renew. Energy 2021, 173, 479–497. [Google Scholar] [CrossRef]
- Baratieri, M.; Baggio, P.; Fiori, L.; Grigiante, M. Biomass as an energy source: Thermodynamic constraints on the performance of the conversion process. Bioresour. Technol. 2008, 99, 7063–7073. [Google Scholar] [CrossRef]
- Arena, U.; Zaccariello, L.; Mastellone, M.L. Gasification of natural and waste biomass in a pilot scale fluidized bed reactor. Combust. Sci. Technol. 2010, 182, 625–639. [Google Scholar] [CrossRef]
- Arena, U.; Zaccariello, L.; Mastellone, M.L. Fluidized bed gasification of waste-derived fuels. Waste Manag. 2010, 30, 1212–1219. [Google Scholar] [CrossRef]
- Mastellone, M.L.; Zaccariello, L.; Arena, U. Co-gasification of coal, plastic waste and wood in a bubbling fluidized bed reactor. Fuel 2010, 89, 2991–3000. [Google Scholar] [CrossRef]
- Kern, S.; Pfeifer, C.; Hofbauer, H. Gasification of wood in a dual fluidized bed gasifier: Influence of fuel feeding on process performance. Chem. Eng. Sci. 2013, 90, 284–298. [Google Scholar] [CrossRef]
- Zaccariello, L.; Mastellone, M.L. Fluidized-bed gasification of plastic waste, wood, and their blends with coal. Energies 2015, 8, 8052–8068. [Google Scholar] [CrossRef]
- Liu, Z.; Mayer, B.K.; Venkiteshwaran, K.; Seyedi, S.; Raju, A.S.K.; Zitomer, D.; McNamara, P.J. The state of technologies and research for energy recovery from municipal wastewater sludge and biosolids. Curr. Opin. Environ. Sci. Health 2020, 14, 31–36. [Google Scholar] [CrossRef]
- Migliaccio, R.; Brachi, P.; Montagnaro, F.; Papa, S.; Tavano, A.; Montesarchio, P.; Ruoppolo, G.; Urciuolo, M. Sewage sludge gasification in a fluidized bed: Experimental investigation and modeling. Ind. Eng. Chem. Res. 2021, 60, 5034–5047. [Google Scholar] [CrossRef]
- Coppola, A.; Sattari, A.; Montagnaro, F.; Scala, F.; Salatino, P. Performance of limestone-based sorbent for sorption-enhanced gasification in dual interconnected fluidized bed reactors. AIChE J. 2022, in press. [CrossRef]
- Kozlov, A.; Marchenko, O.; Solomin, S. The modern state of wood biomass gasification technologies and their economic efficiency. Energy Procedia 2019, 158, 1004–1008. [Google Scholar] [CrossRef]
- Lan, W.; Chen, G.; Zhu, X.; Wang, X.; Wang, X.; Xu, B. Research on the characteristics of biomass gasification in a fluidized bed. J. Energy Inst. 2019, 92, 613–620. [Google Scholar] [CrossRef]
- Agu, C.E.; Moldestad, B.M.E.; Pfeifer, C. Assessment of combustion and gasification behavior in a bubbling fluidized bed reactor: A comparison between biomass with and without chemical additives. Energy Fuels 2020, 34, 9654–9663. [Google Scholar] [CrossRef]
- Bandara, J.C.; Jaiswal, R.; Nielsen, H.K.; Moldestad, B.M.E.; Eikeland, M.S. Air gasification of wood chips, wood pellets and grass pellets in a bubbling fluidized bed reactor. Energy 2021, 233, 121149. [Google Scholar] [CrossRef]
- Rapagnà, S.; Jand, N.; Kiennemann, A.; Foscolo, P.U. Steam-gasification of biomass in a fluidised bed of olivine particles. Biomass Bioenergy 2000, 19, 187–197. [Google Scholar] [CrossRef]
- Hu, G.; Xu, S.; Li, S.; Xiao, C.; Liu, S. Steam gasification of apricot stones with olivine and dolomite as downstream catalysts. Fuel Process. Technol. 2006, 87, 375–382. [Google Scholar] [CrossRef]
- Soomro, A.; Chen, S.; Ma, S.; Xiang, W. Catalytic activites of nickel, dolomite, and olivine for tar removal and H2-enriched gas production in biomass gasification process. Energy Environ. 2018, 29, 839–867. [Google Scholar] [CrossRef]
- NETL-DOE. Available online: https://www.netl.doe.gov/research/coal/energy-systems/gasification/gasifipedia/syngas-composition-igcc (accessed on 7 July 2022).
- Saxena, R.C.; Seal, D.; Kumar, S.; Goyal, H.B. Thermo-chemical routes for hydrogen rich gas from biomass: A review. Renew. Sustain. Energy Rev. 2008, 12, 1909–1927. [Google Scholar] [CrossRef]
- Huang, J.; Schmidt, K.G.; Bian, Z. Removal and conversion of tar in syngas from woody biomass gasification for power utilization using catalytic hydrocracking. Energies 2011, 4, 1163–1177. [Google Scholar] [CrossRef]
Publisher’s Note: MDPI stays neutral with regard to jurisdictional claims in published maps and institutional affiliations. |
© 2022 by the authors. Licensee MDPI, Basel, Switzerland. This article is an open access article distributed under the terms and conditions of the Creative Commons Attribution (CC BY) license (https://creativecommons.org/licenses/by/4.0/).