
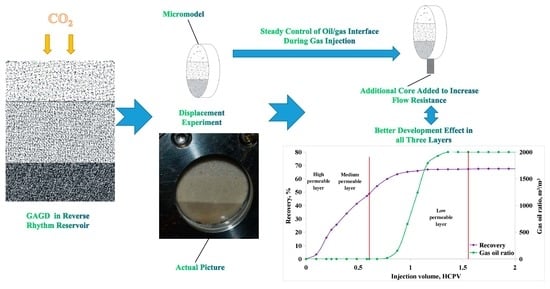
Experimental Characterization of Oil/Gas Interface Self-Adjustment in CO2-Assisted Gravity Drainage for Reverse Rhythm Reservoir

Abstract
:
1. Introduction
2. Materials and Methods
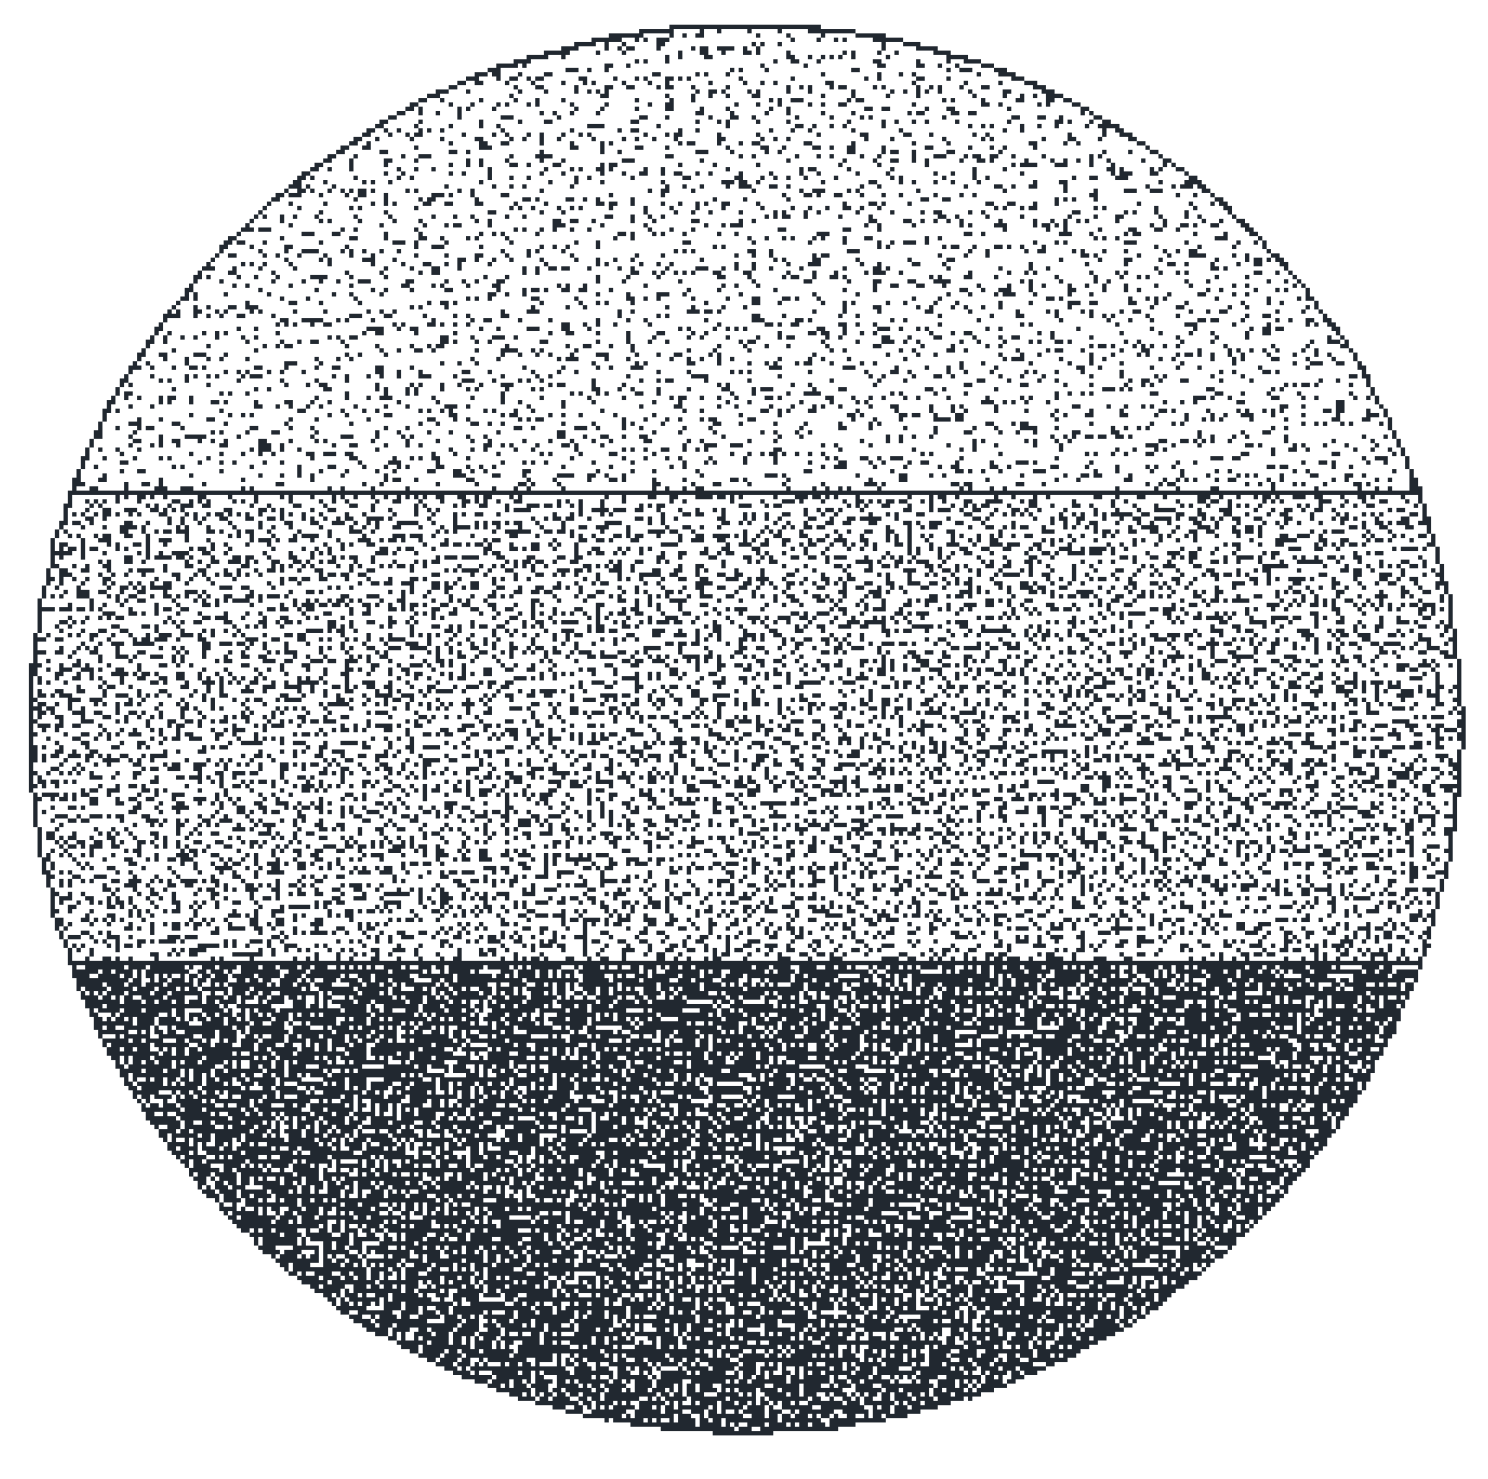
2.1. Model Design and Experimental Materials
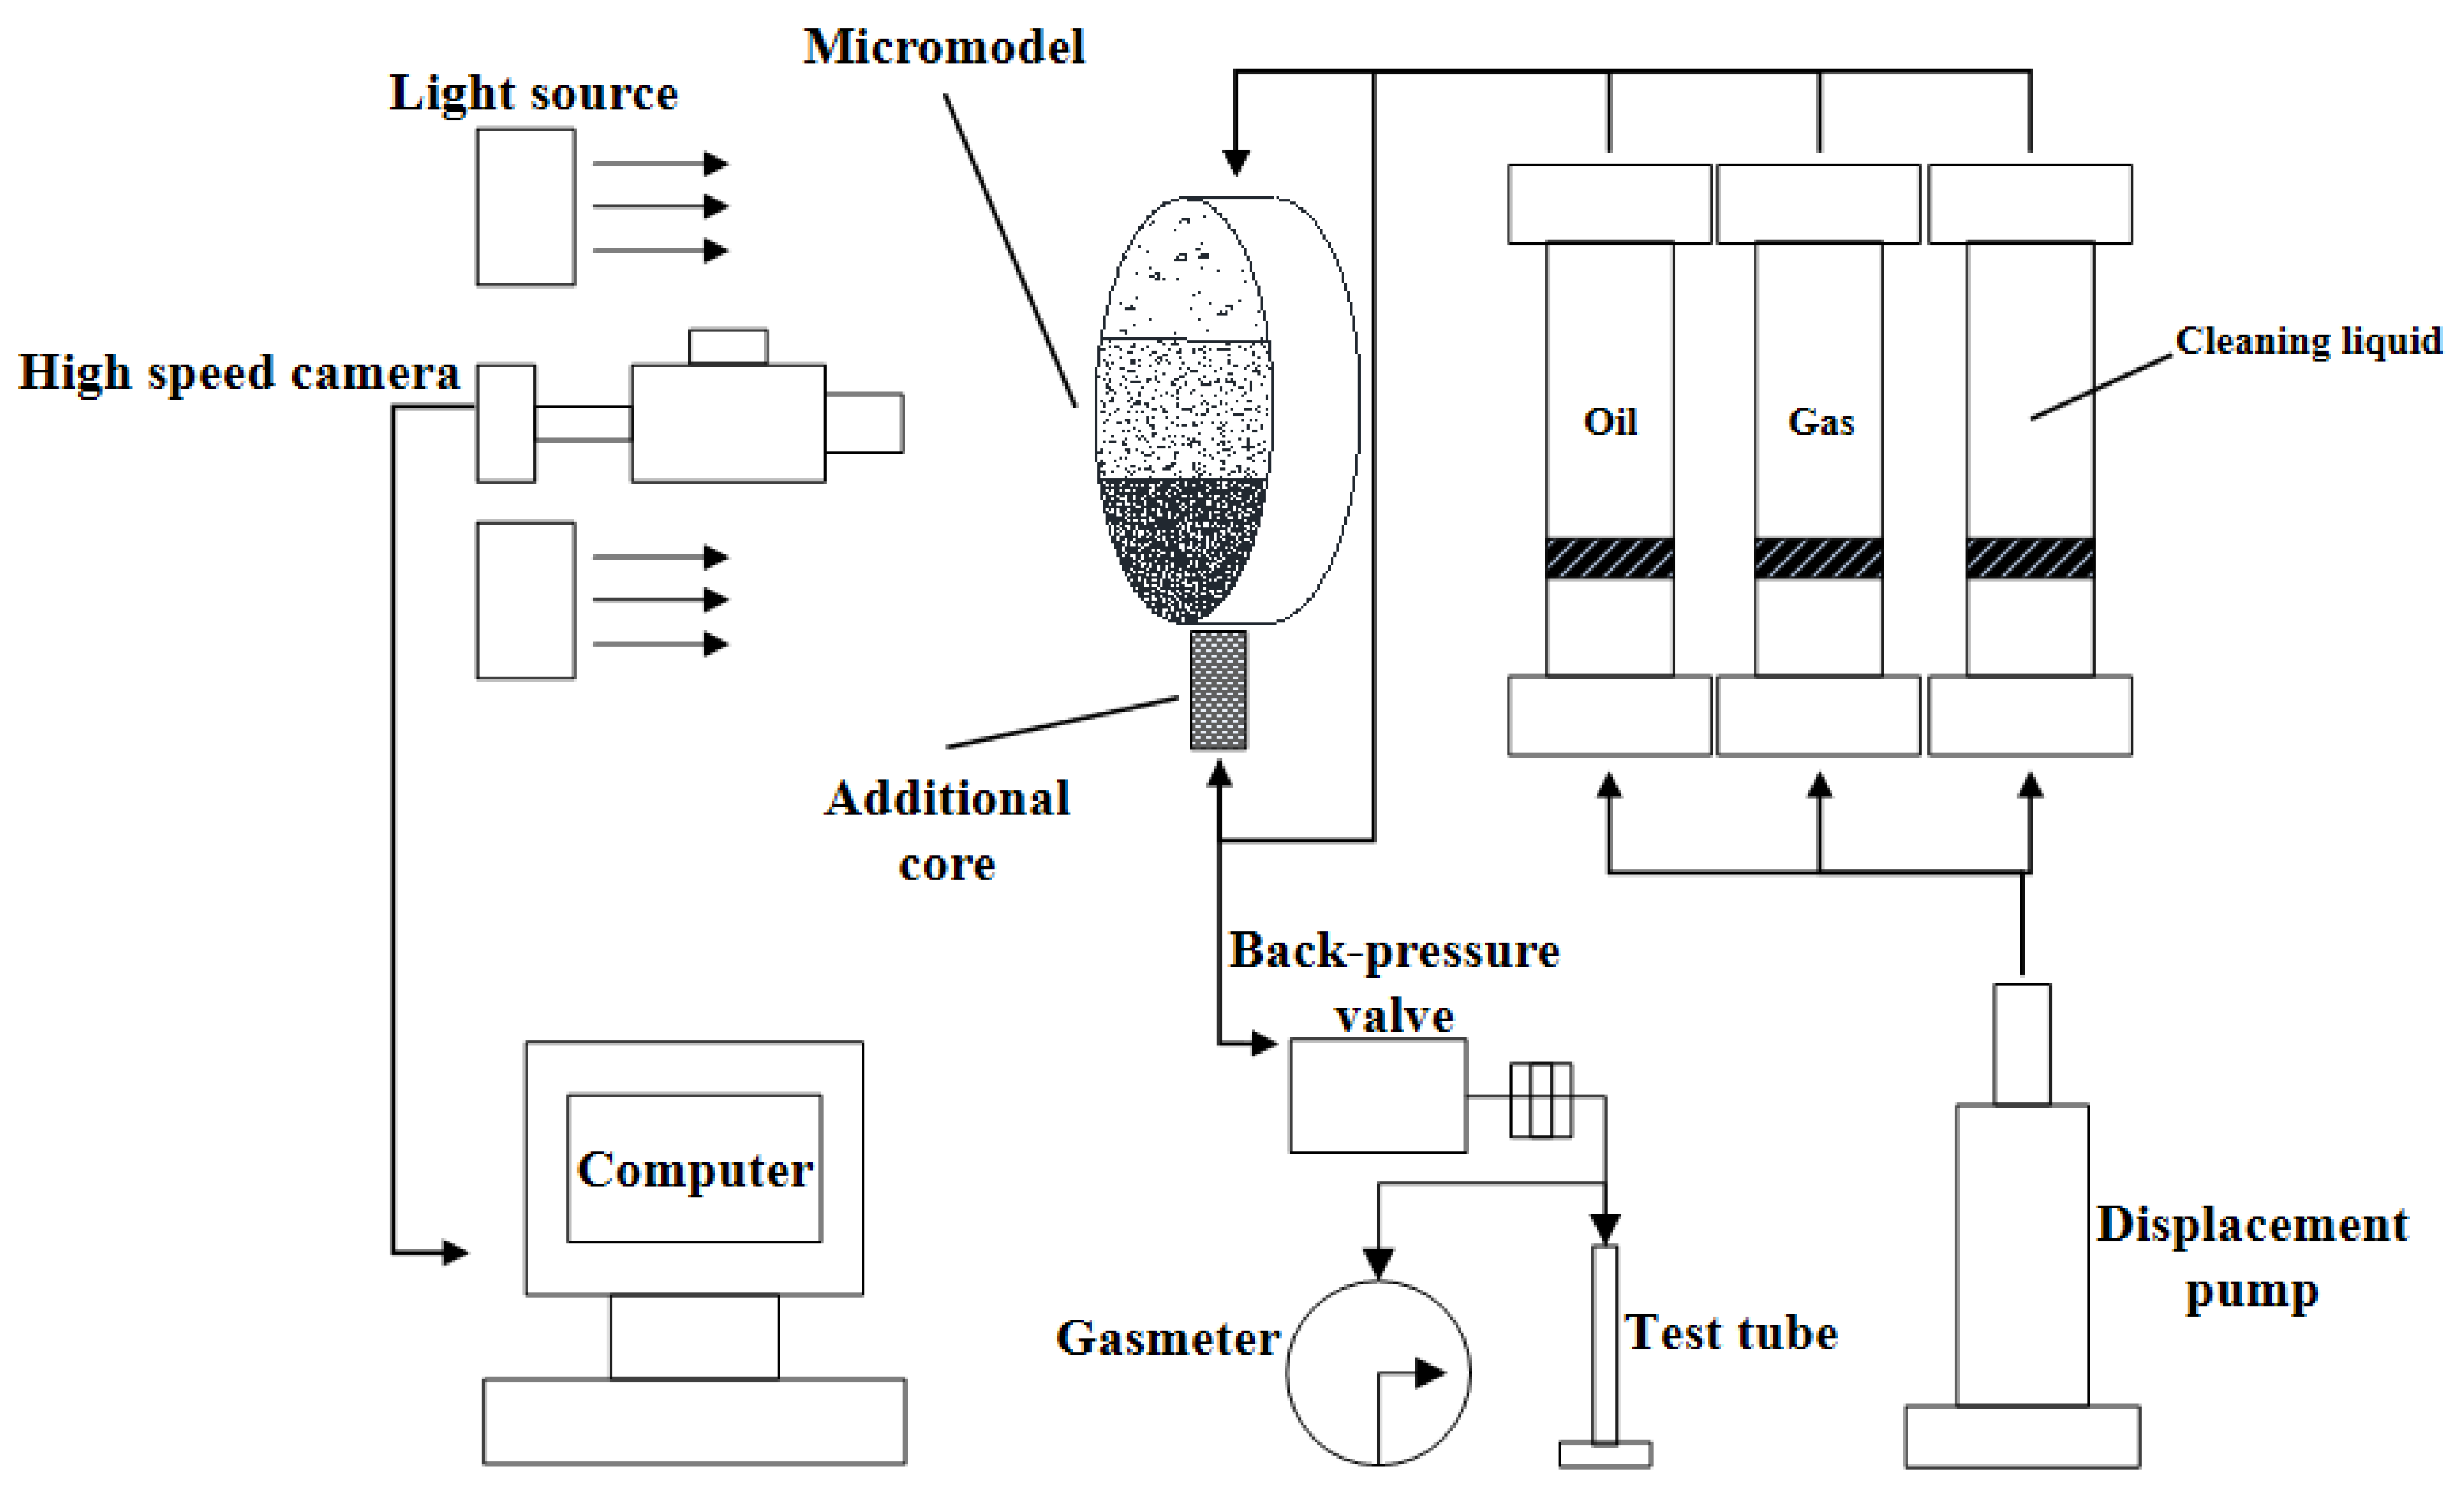
2.2. Experimental Apparatus
2.3. Experimental Procedure
3. Results
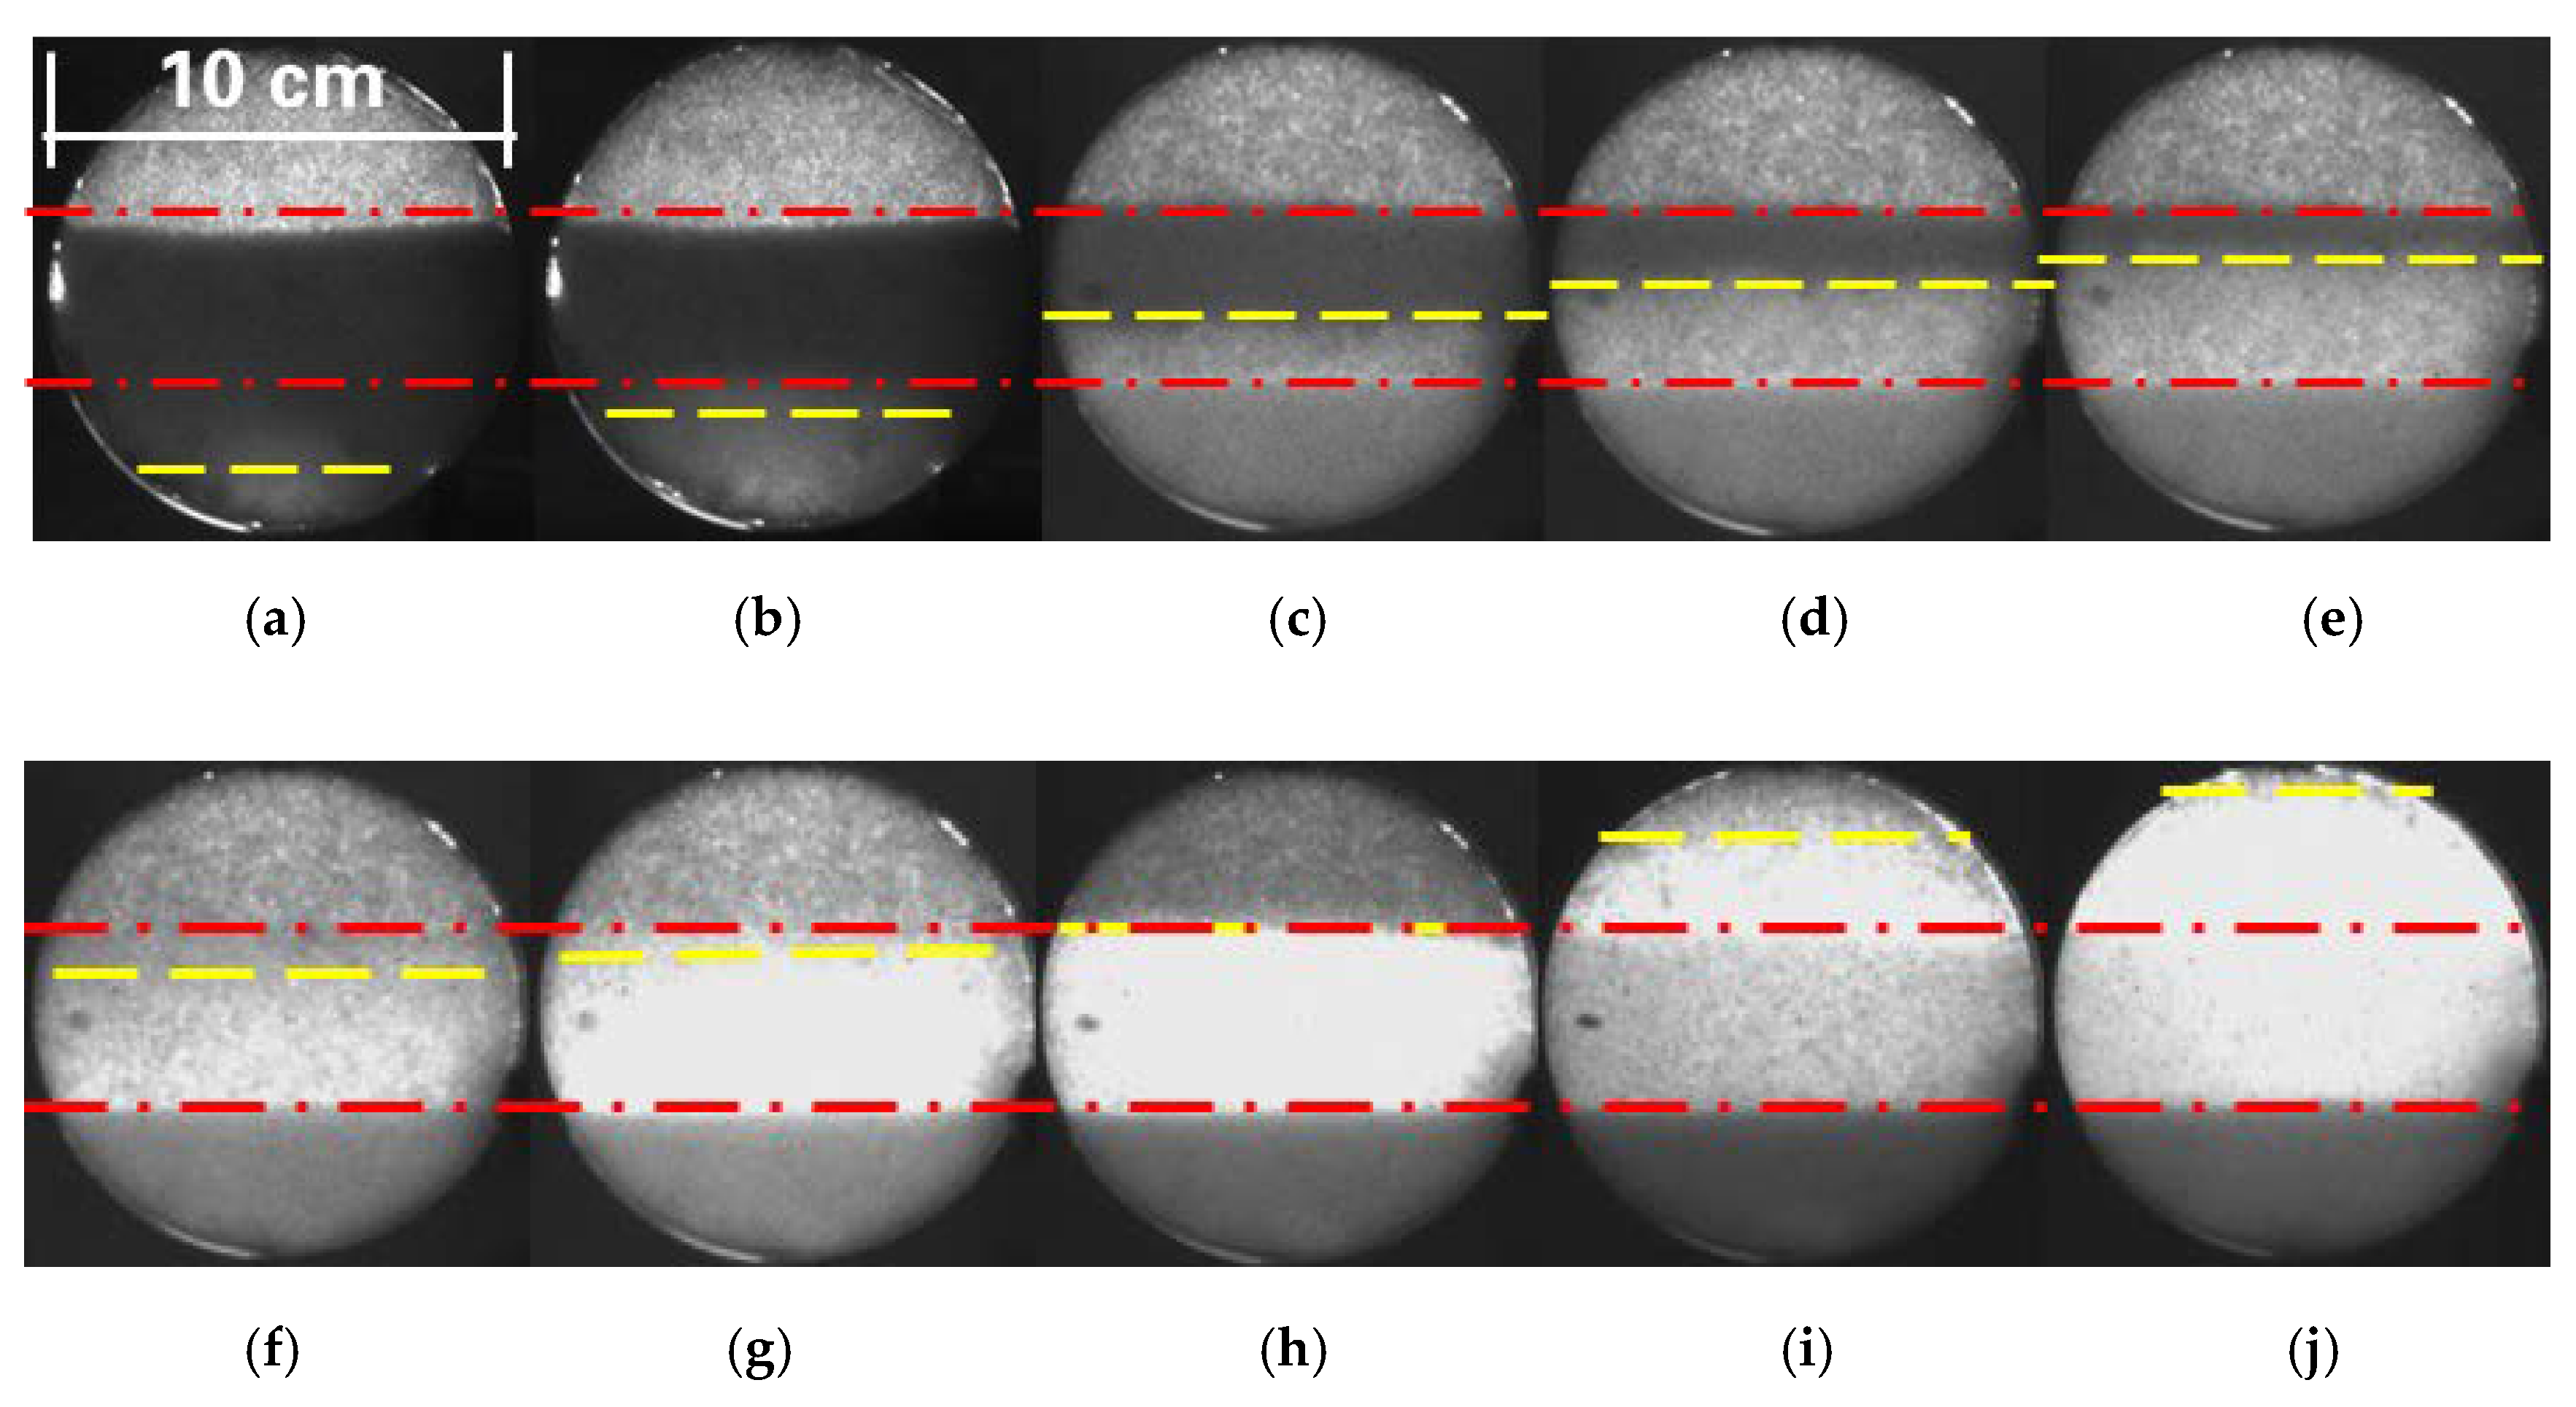
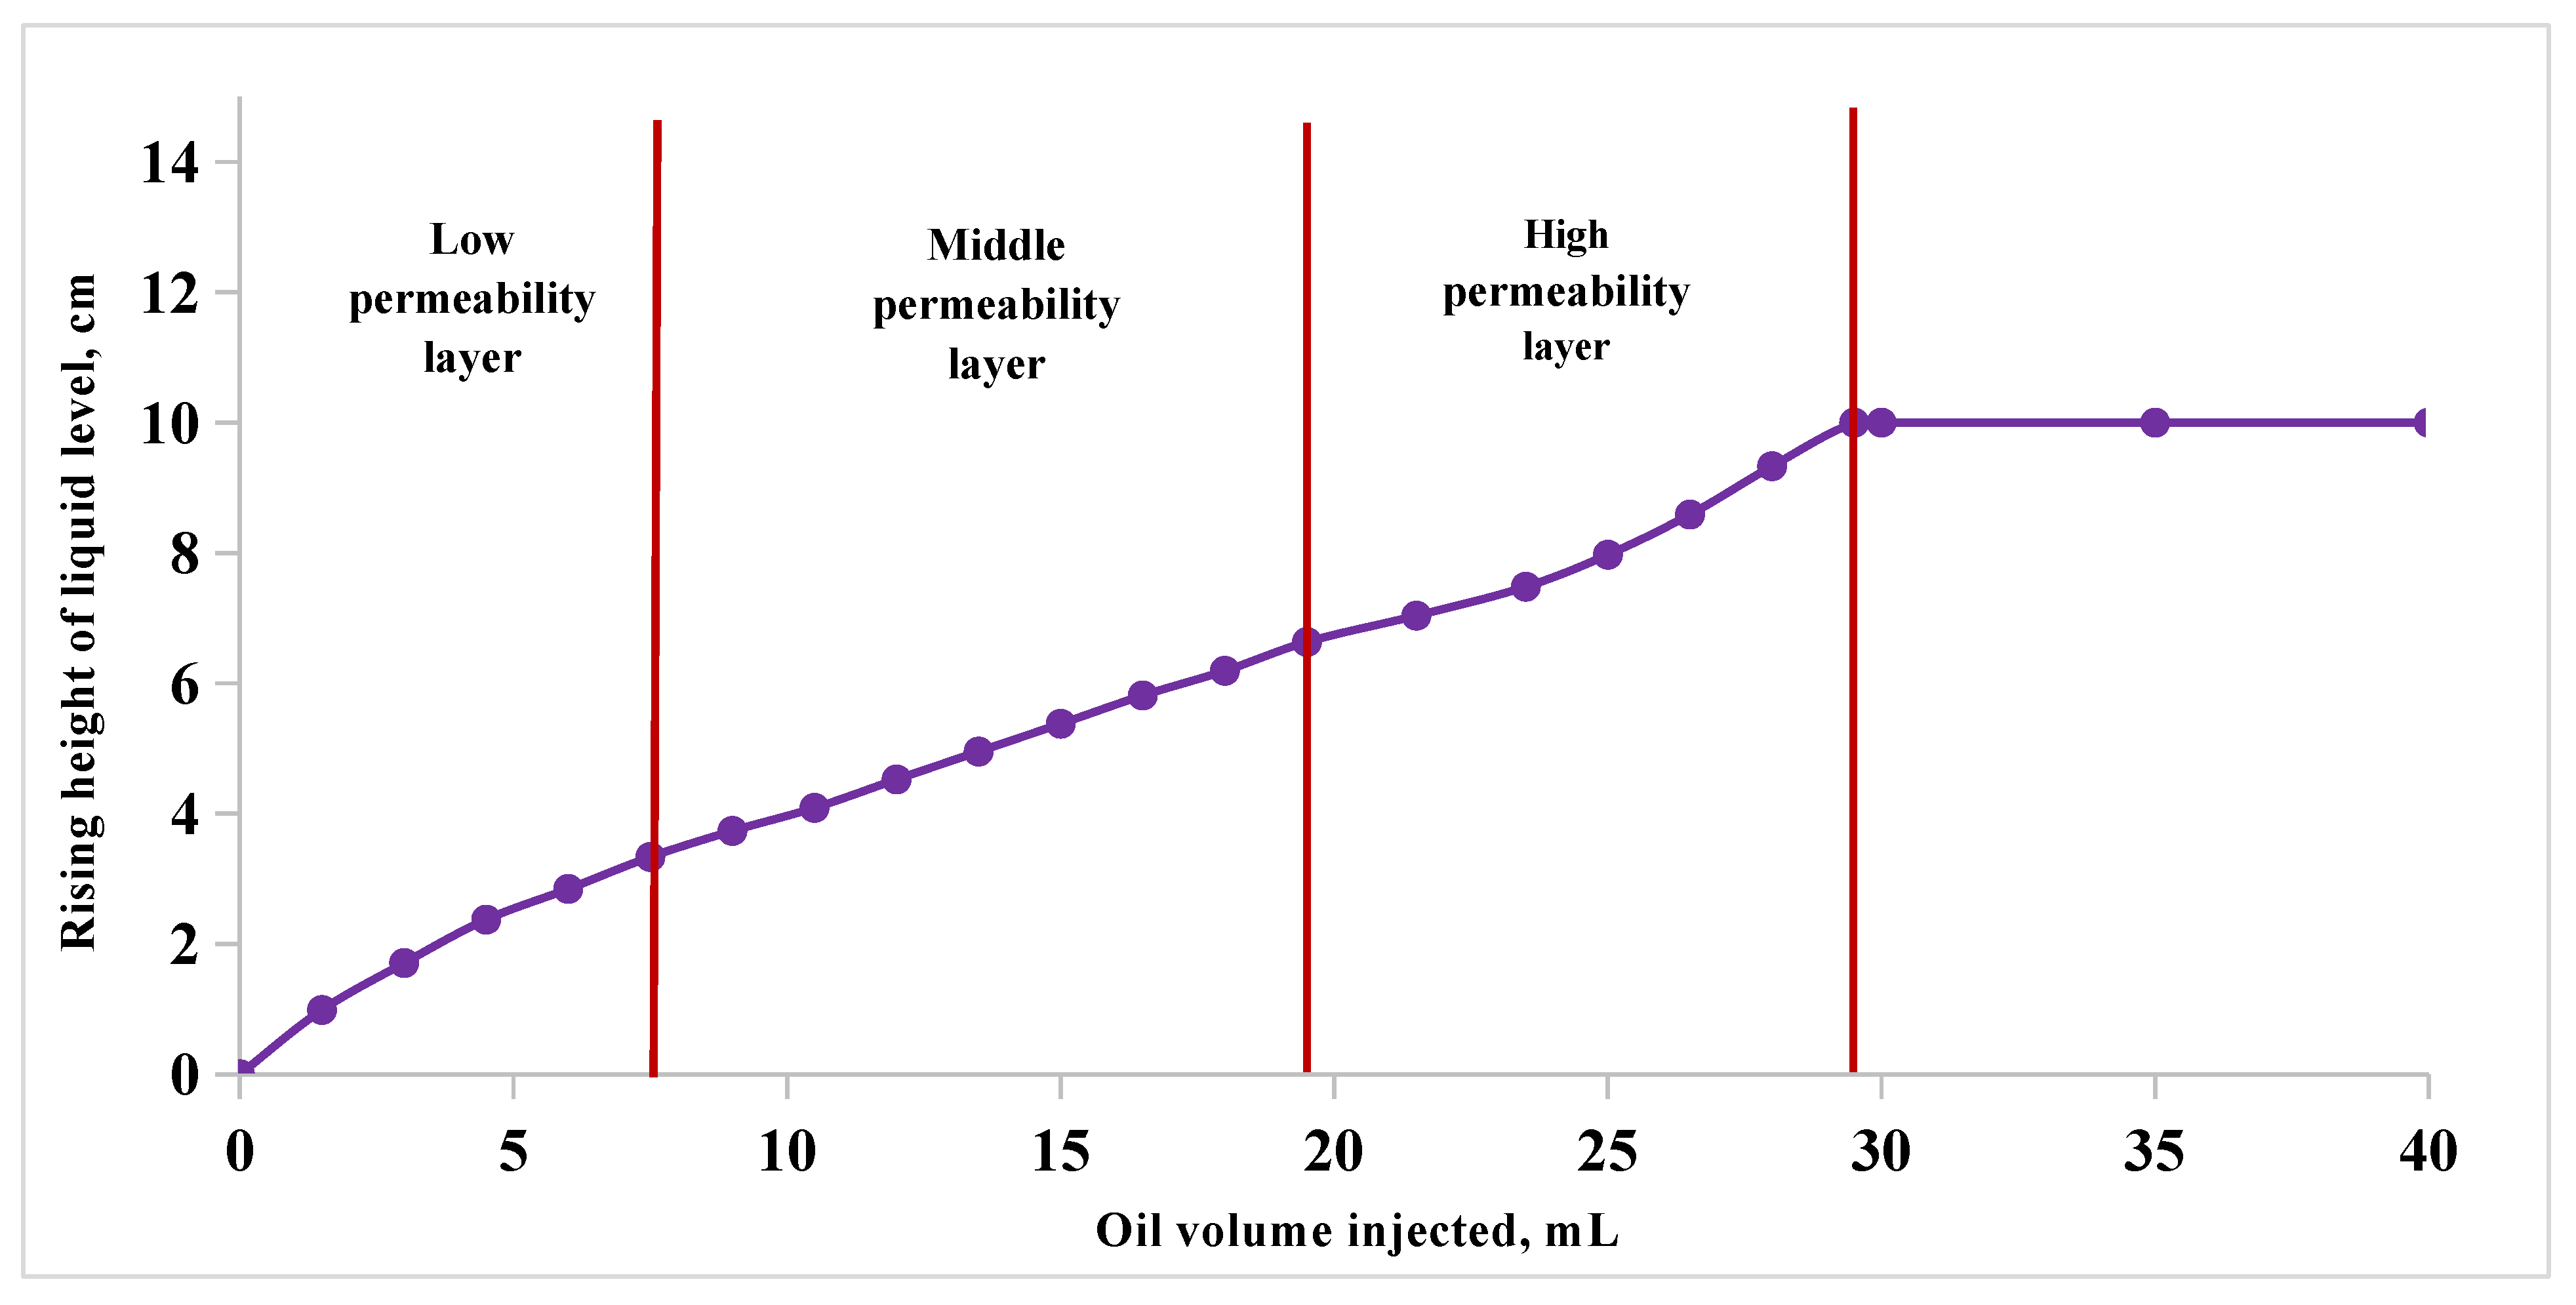
3.1. Oil Saturation Process
3.2. CO2-Assisted Gravity Drainage
- (1)
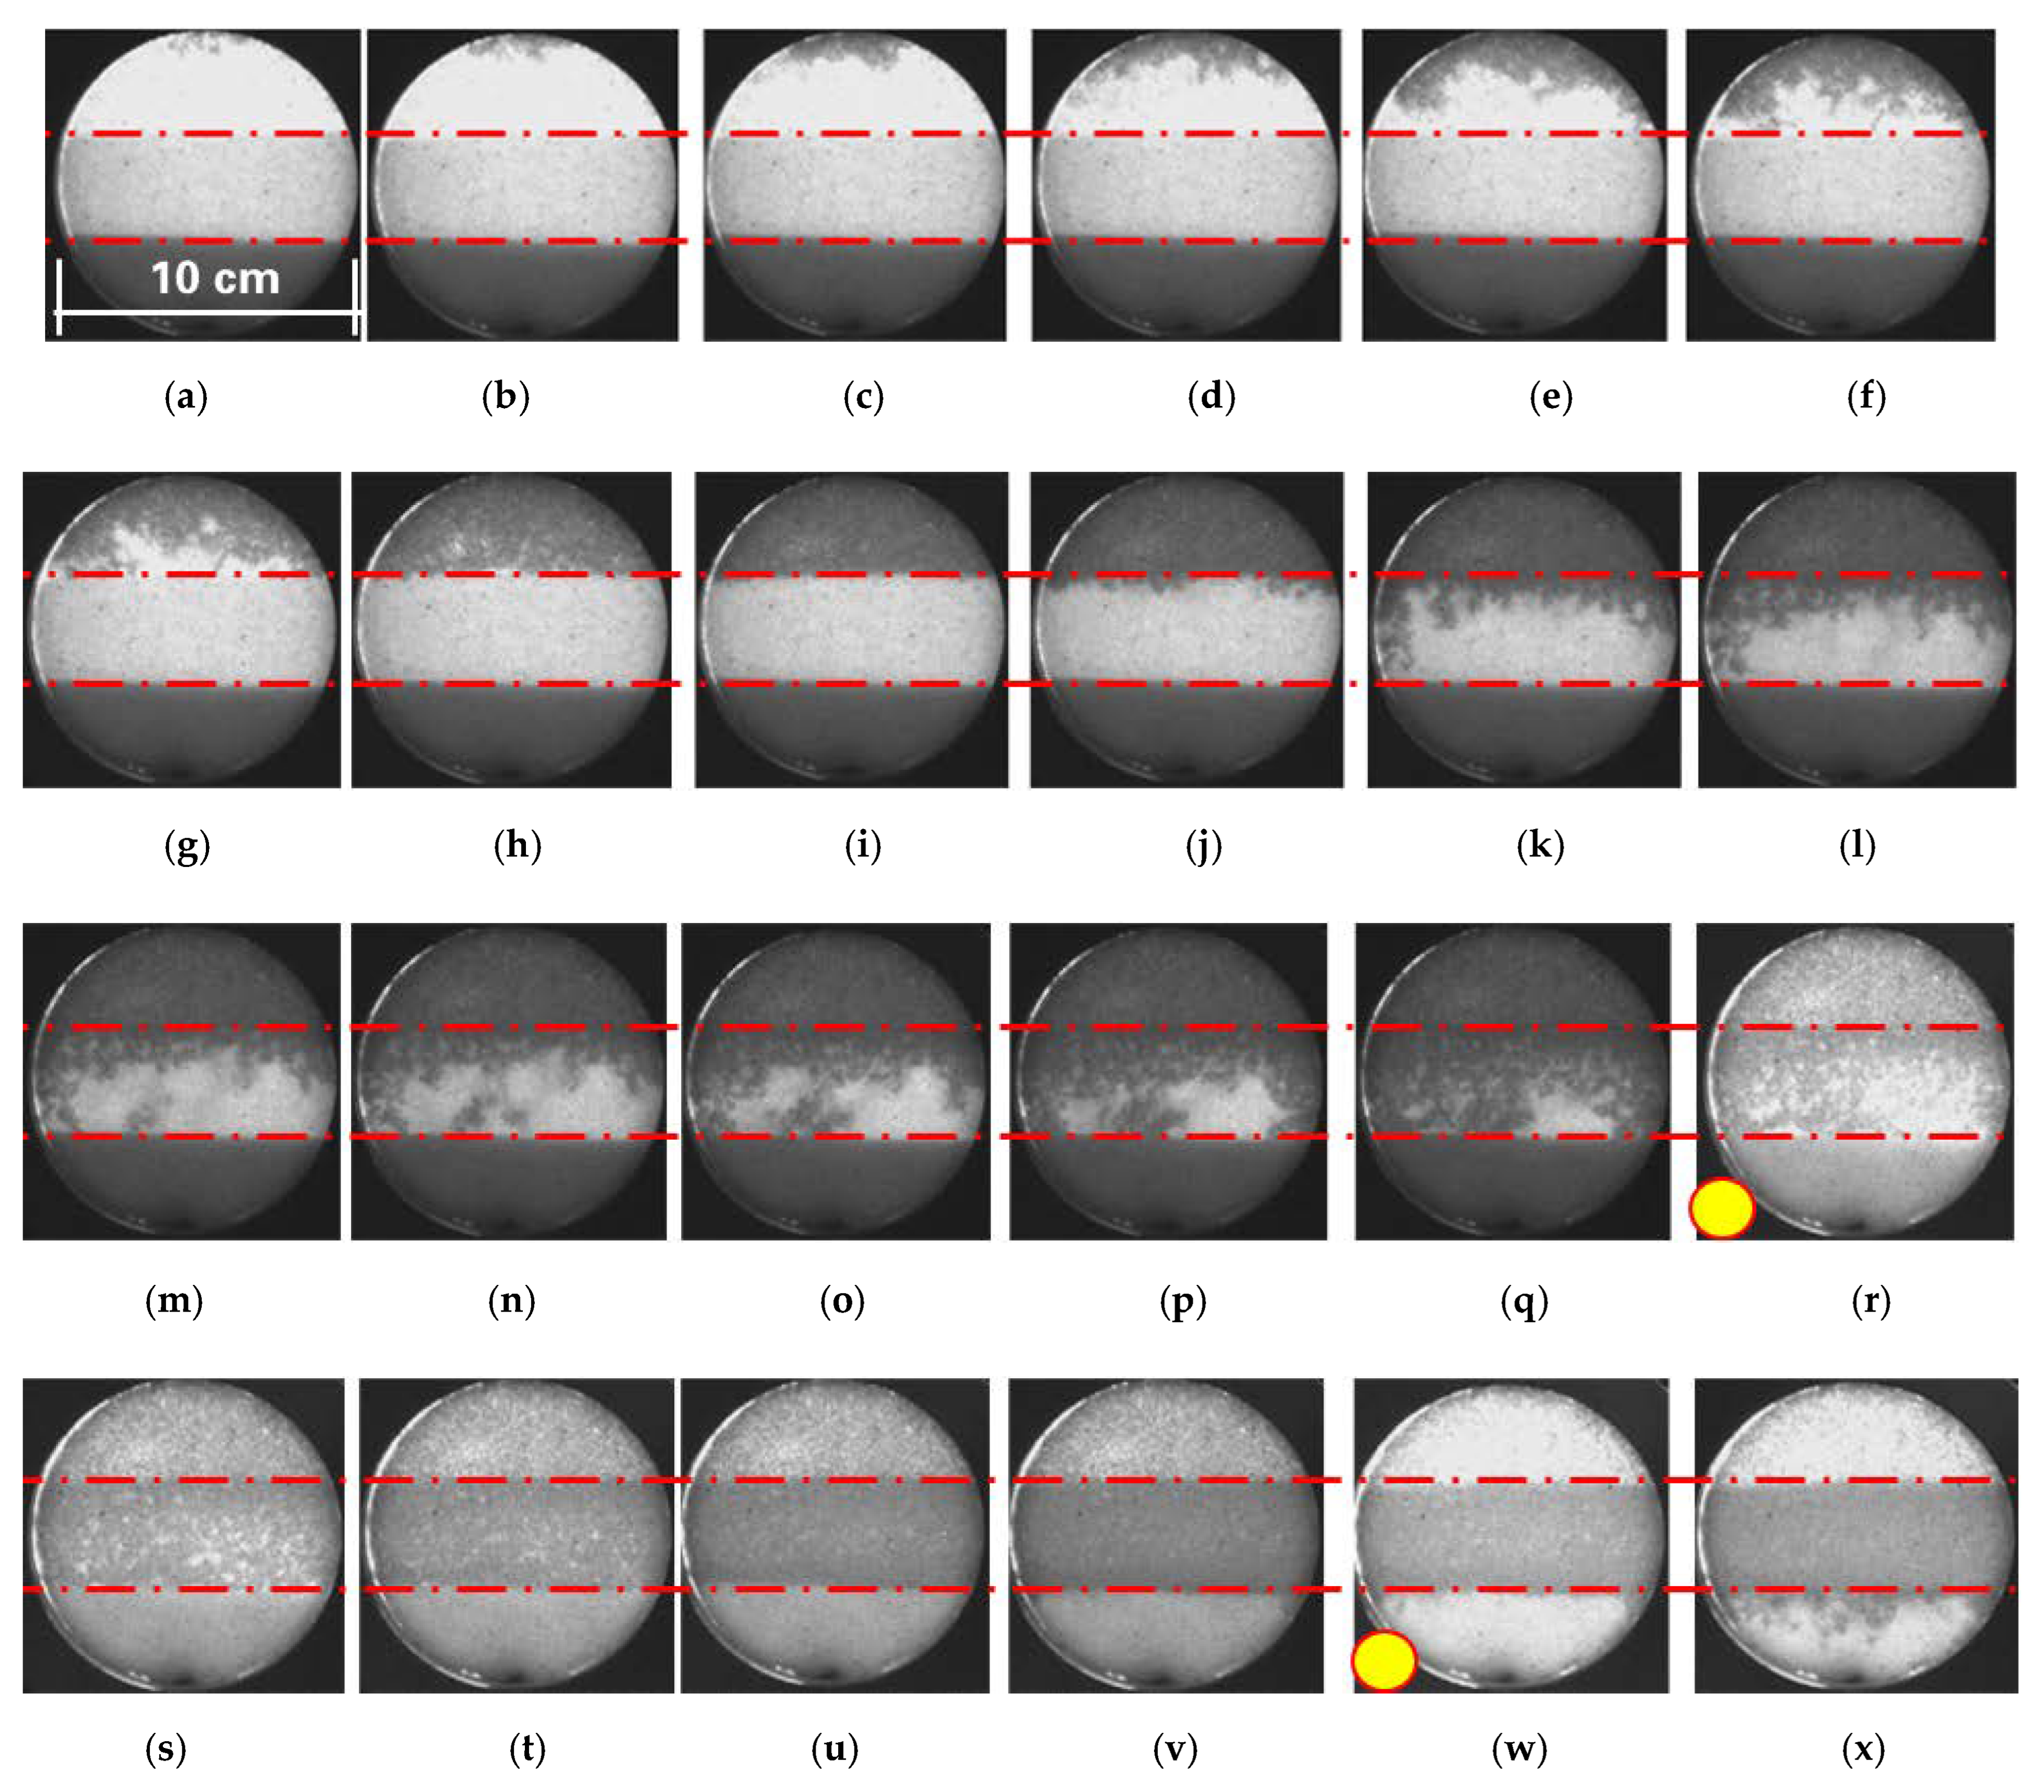
- Free seepage stage in each flow direction of high permeability layer
- (2)
- Self-adjustment stage in high permeability layer
- (3)
- Restart stage in medium permeability layer
- (4)
- Self-adjustment stage in medium permeability layer
- (5)
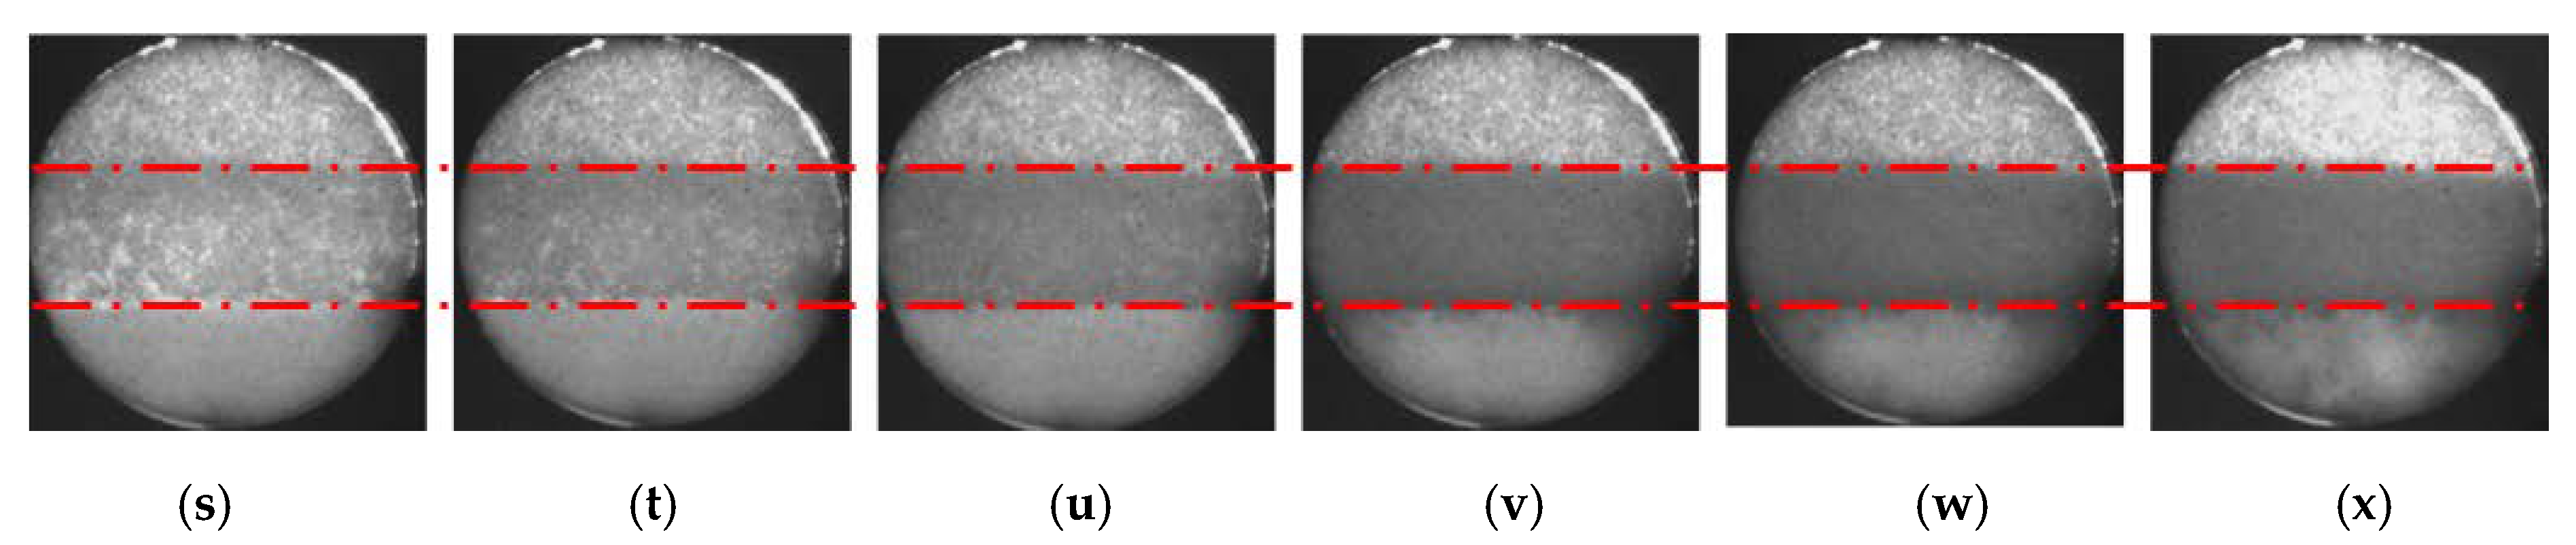
- Sprint stage in low permeability layer
3.3. CO2 Drainage after Increasing Flow Resistance at Output
- (1)
- (2)
- (3)
- (4)
- (5)
- (6)
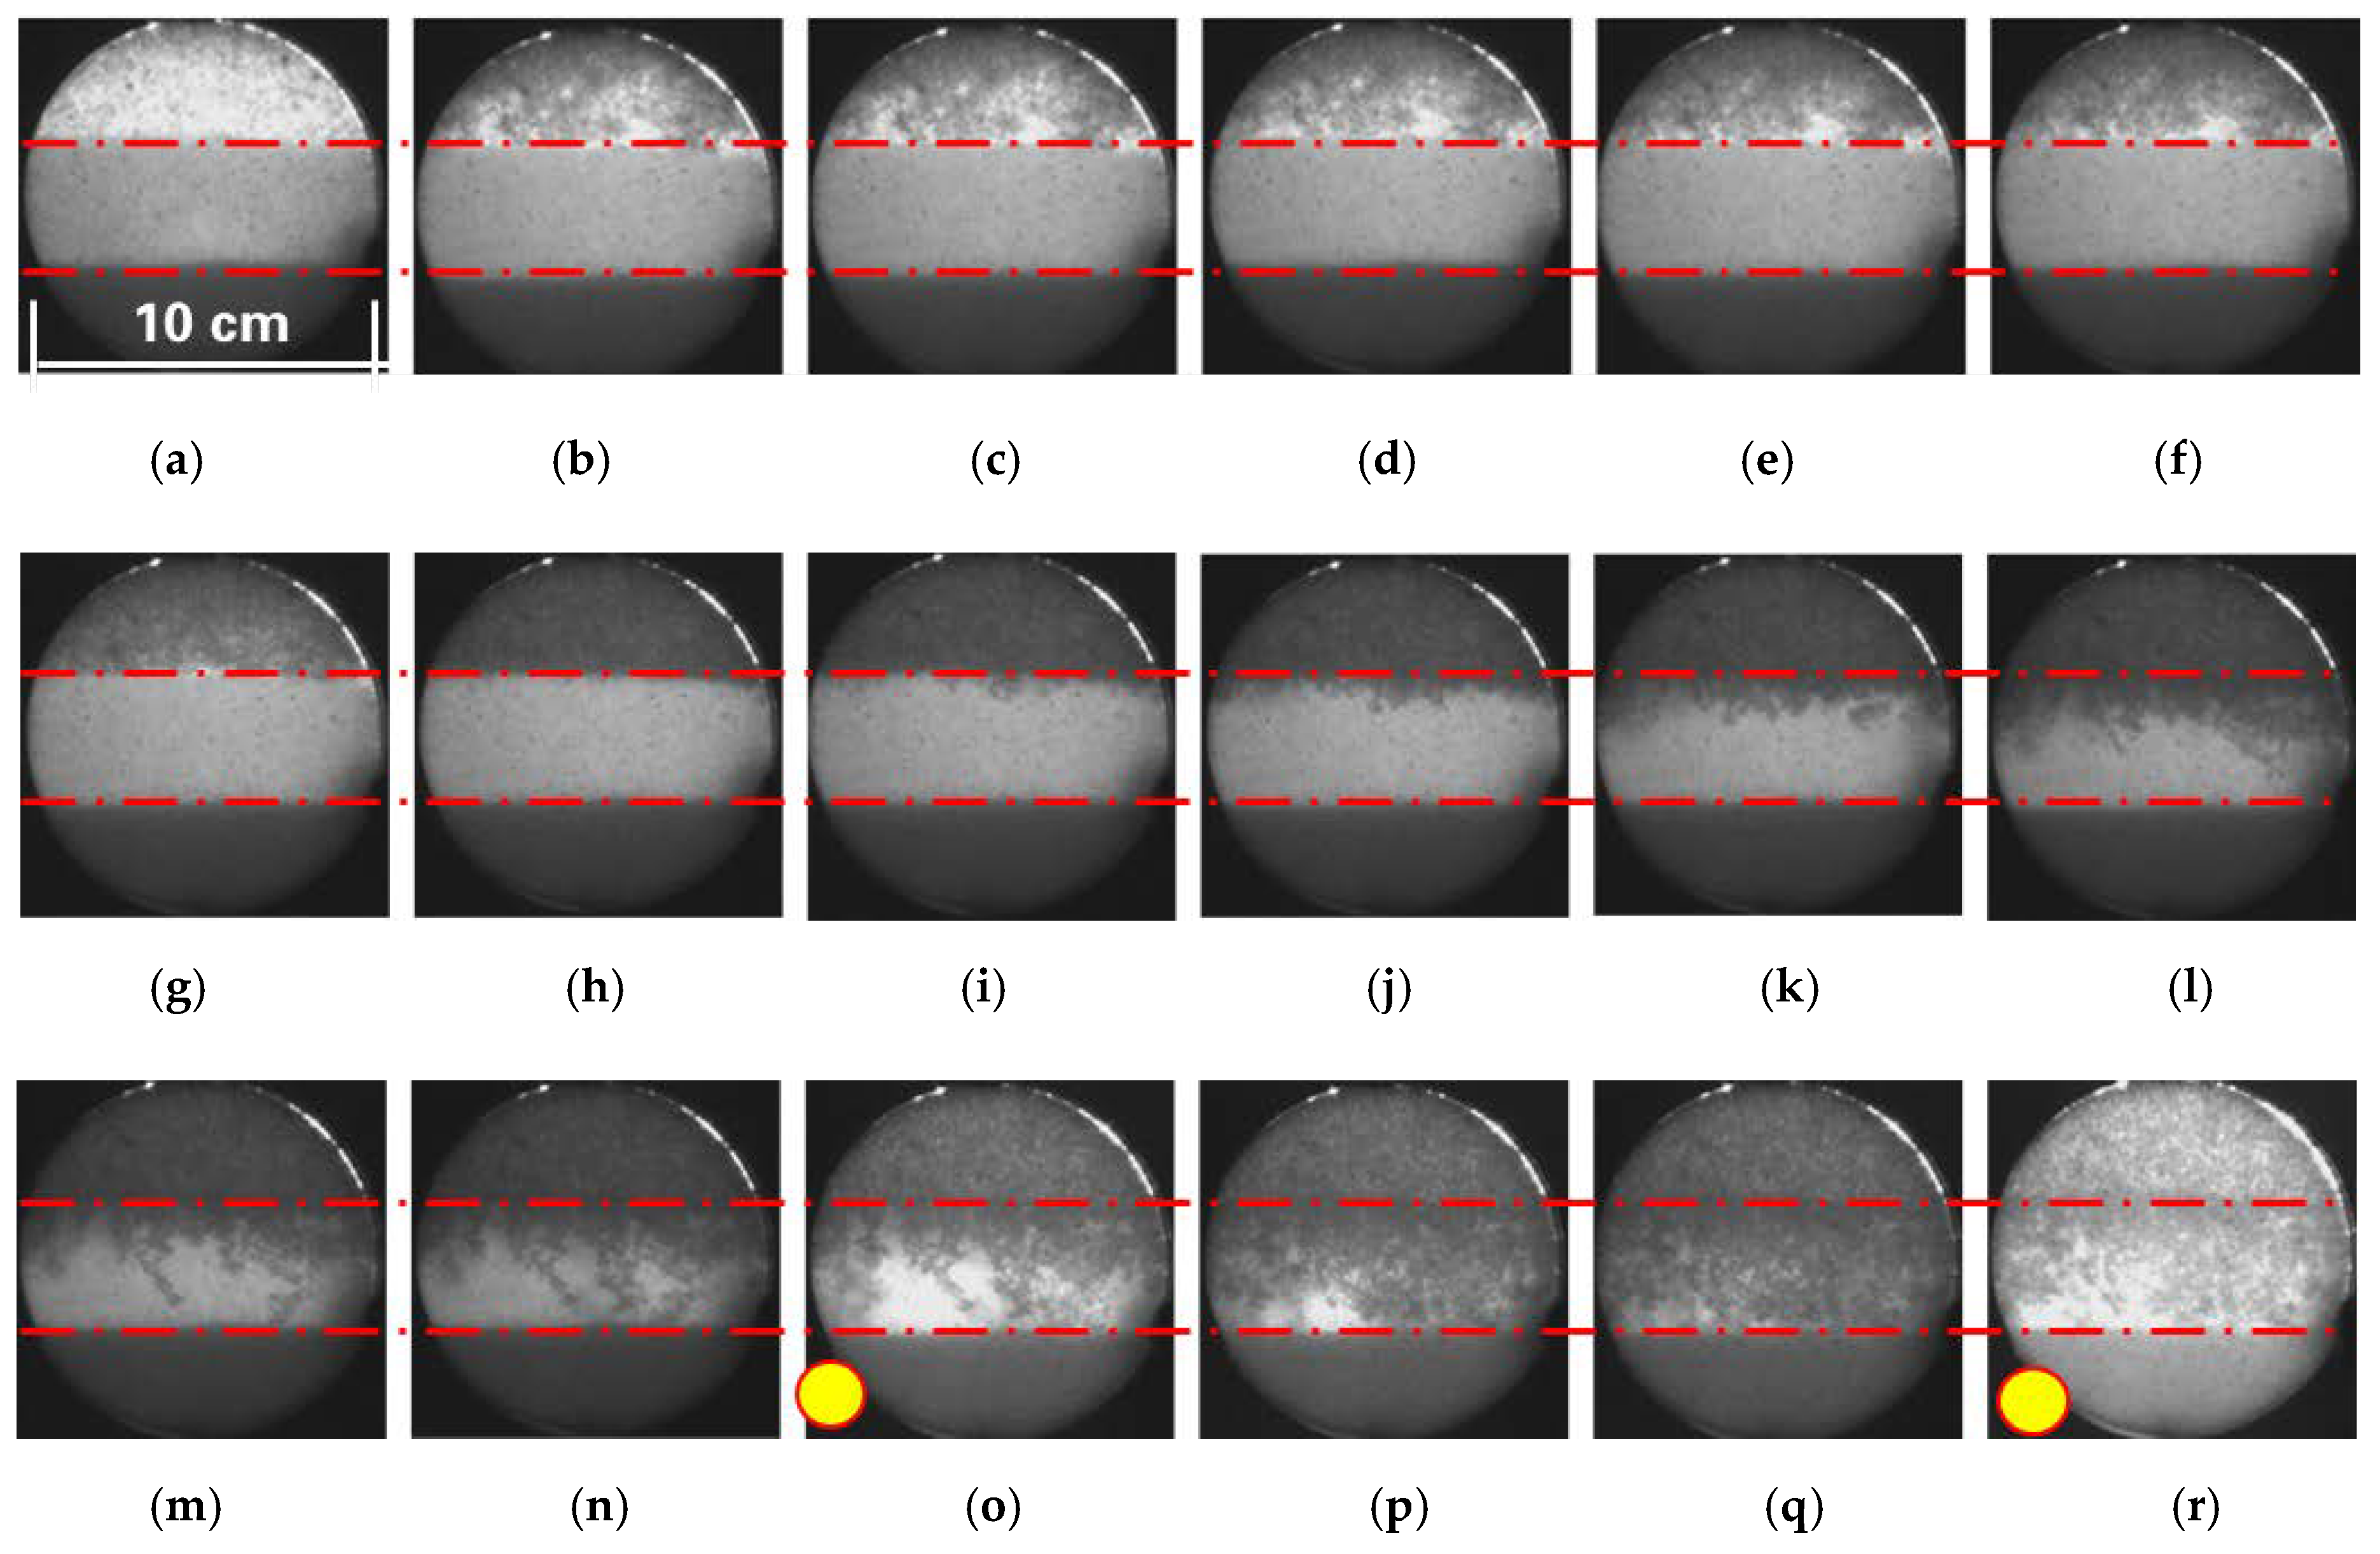
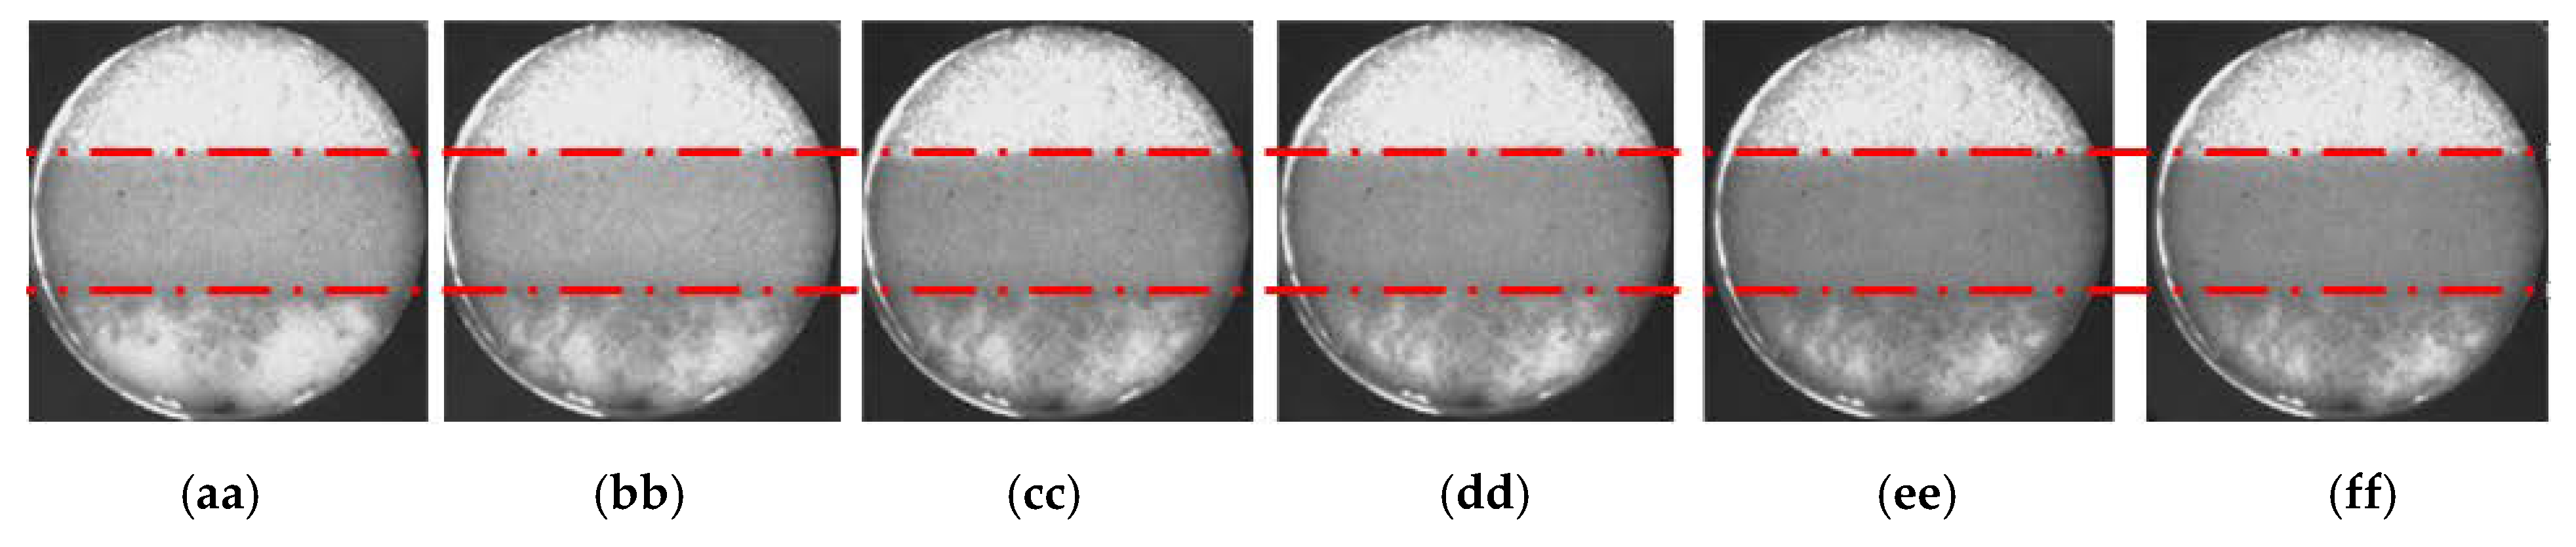
- Self-adjustment continuous oil recovery stage in low permeability layer, which corresponds to images (bb)~(dd) in Figure 8. After CO2 reached the bottom outlet, a similar process happened with that in the high and medium permeability layers. In this stage, self-adjustment of CO2/oil interface happened and oil is produced continuously until the maximum CO2 sweep efficiency is realized in the low permeability layer under this condition.
- (7)
- Continuous oil recovery stage after CO2 breakthrough, which corresponds to images (dd)~(ff) in Figure 8. In this stage, CO2 could still displace some oil after breakthrough.
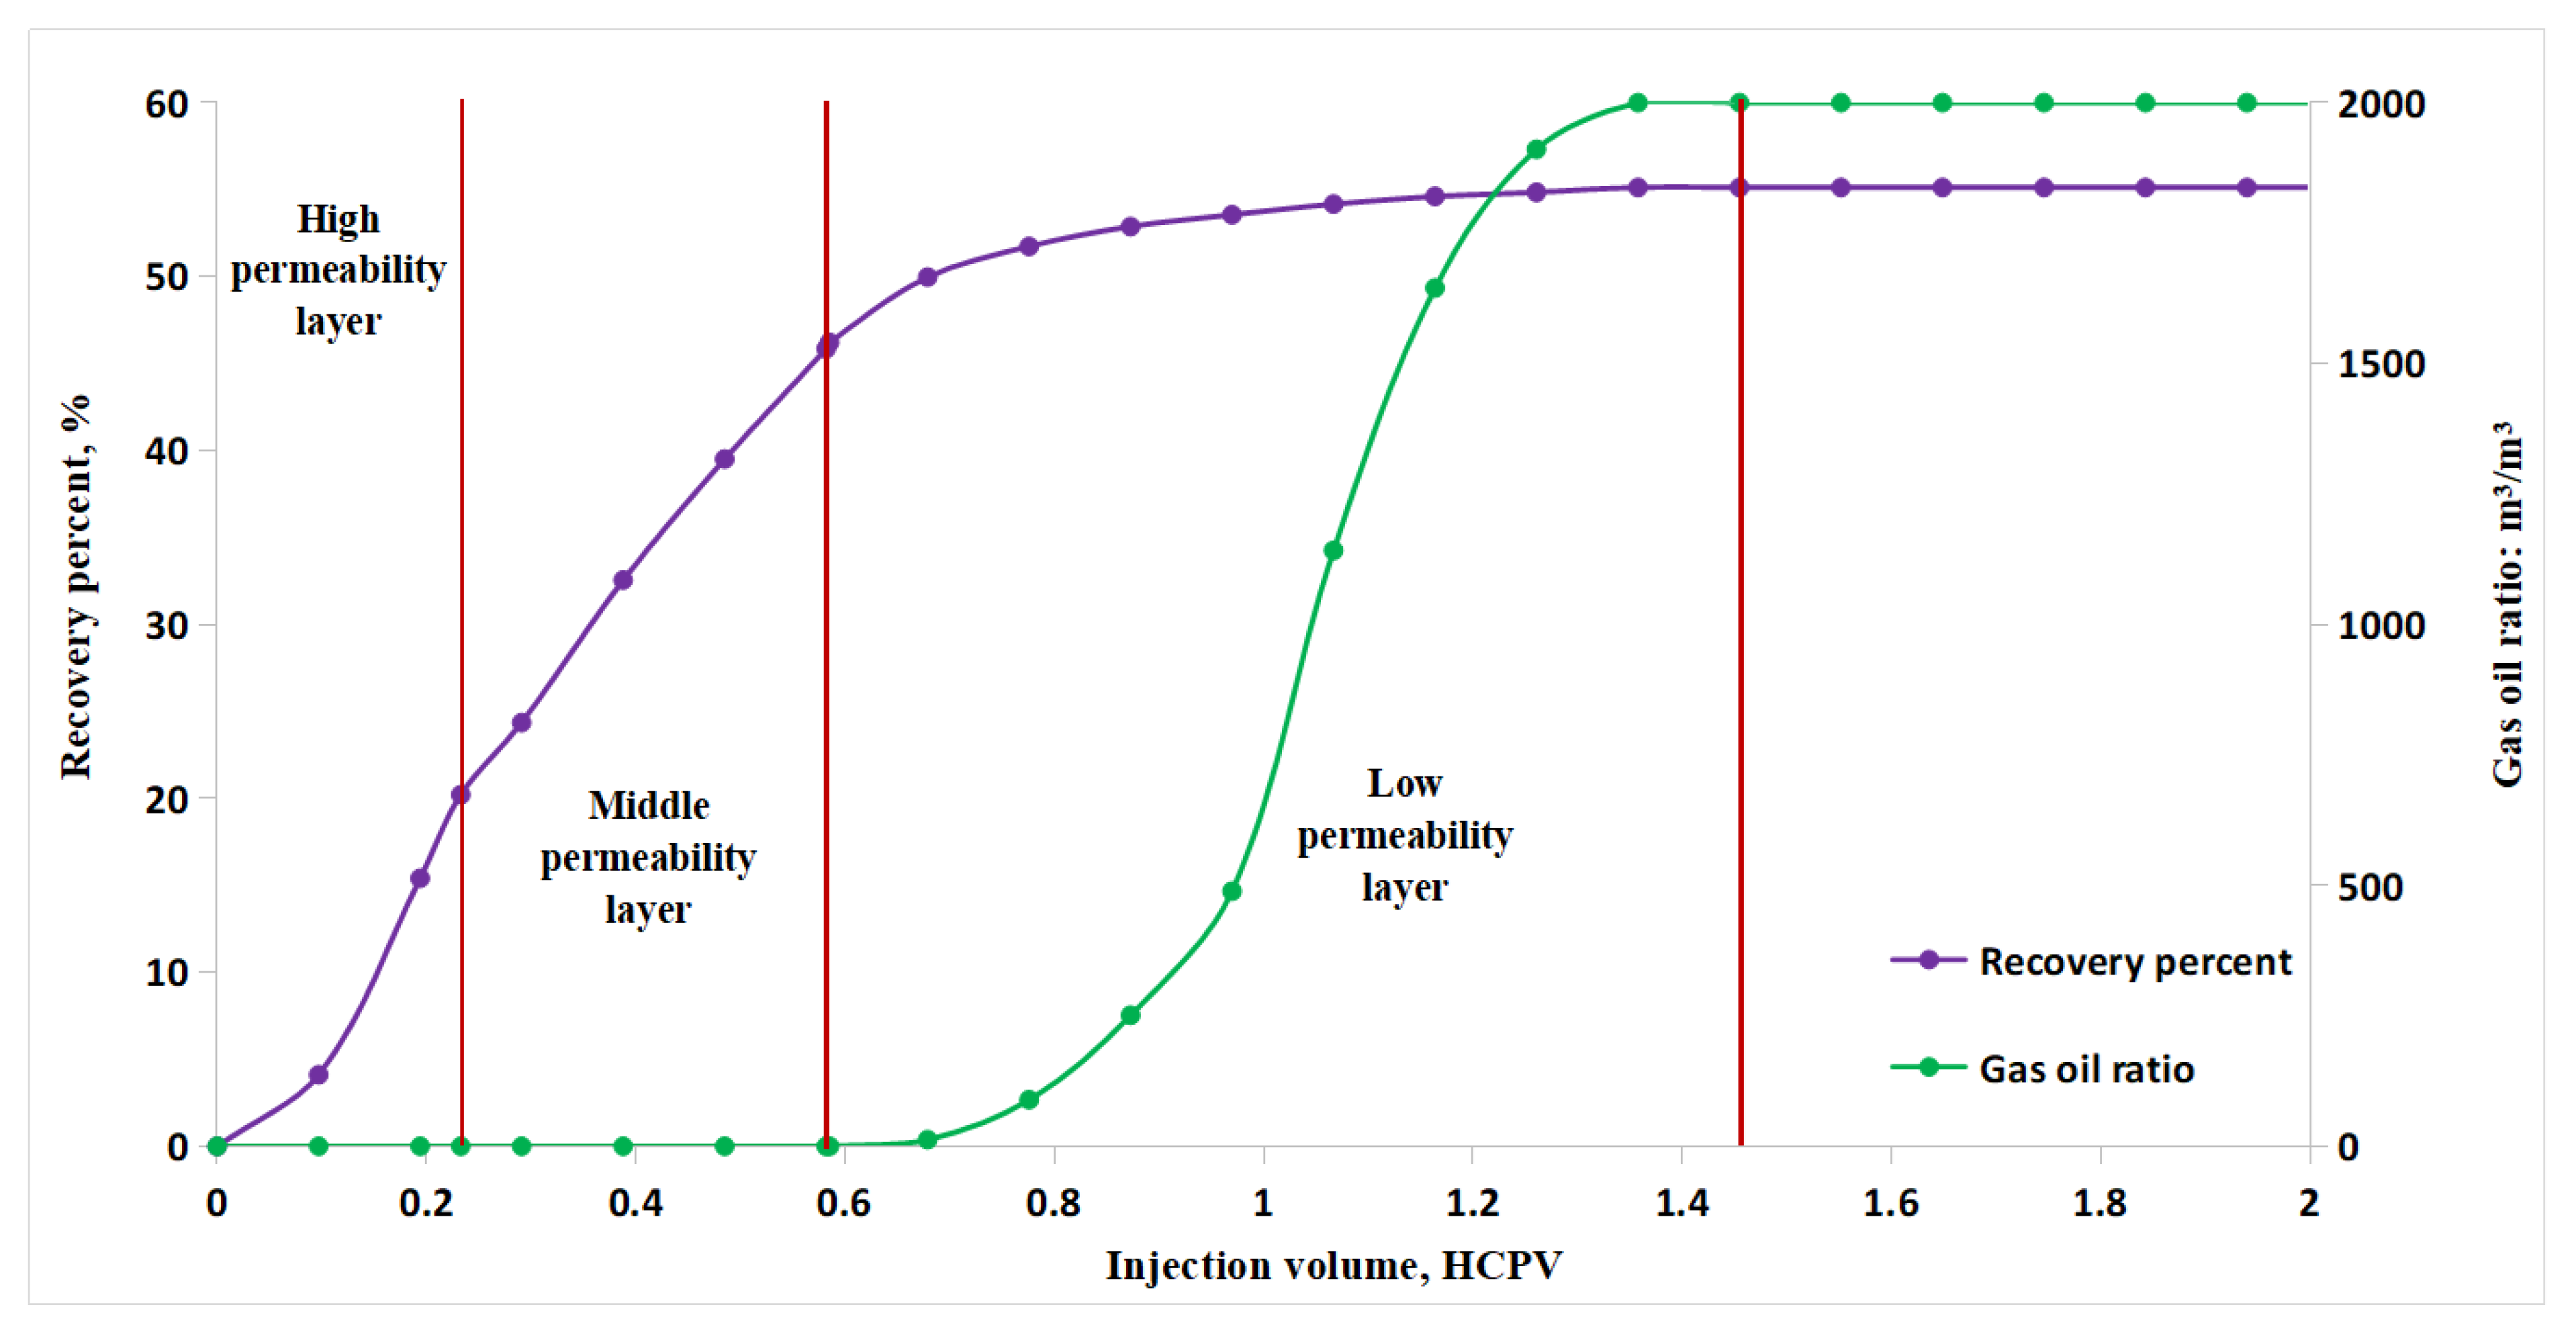
3.4. Comparison of Development Index after Increasing Resistance
4. Discussion
4.1. Theoretic Analysis
- (1)
- Perspective of macroscopic flow
- (2)
- Perspective of microscopic flow
4.2. Enlightenment in Oil Field Development
5. Conclusions
Author Contributions
Funding
Conflicts of Interest
References
- Tang, Y.; Yin, P.; Wang, Y.; Sun, B.; Hou, D. Feasibility Assessment of the CO2 Miscible Flooding Process. J. Southwest Pet. Univ. 2014, 36, 133–138. [Google Scholar] [CrossRef]
- Li, J.; Li, X.; Liu, B.; Jiang, T. Advancement of Oilfield Development Theory of Near-miscible Gas Flooding. Nat. Gas Ind. 2006, 26, 108–110. [Google Scholar] [CrossRef]
- Lei, H.; Gong, C.; Guan, B. New screening method for reservoir by CO2 injection miscible flooding. J. China Univ. Pet. 2008, 32, 72–76. [Google Scholar] [CrossRef]
- Liu, F.; Yue, P.; Wang, Q.; Yu, G.; Zhou, J.; Wang, X.; Fang, Q.; Li, X. Experimental Study of Oil Displacement and Gas Channeling during CO2 Flooding in Ultra—Low Permeability Oil Reservoir. Energies 2022, 15, 5119. [Google Scholar] [CrossRef]
- Yue, P.; Zhang, R.; Sheng, J.J.; Yu, G.; Liu, F. Study on the Influential Factors of CO2 Storage in Low Permeability Reservoir. Energies 2022, 15, 344. [Google Scholar] [CrossRef]
- Koottungal, L. 2014 worldwide EOR survey. Oil Gas J. 2014, 112, 79–91. [Google Scholar]
- Sandrea, R.; Dharod, D. Approach screens reservoir candidates for EOR. Oil Gas J. 2016, 114, 48–51. [Google Scholar]
- Qin, J.; Han, H.; Liu, X. The application and enlightenment of Carbon Dioxide flooding in United State. Pet. Explor. Dev. 2015, 42, 209–216. [Google Scholar] [CrossRef]
- Wang, G.; Zheng, X.; Zhang, Y.; Lv, W.; Wang, F.; Yin, L. A new screening method of low permeability reservoirs suitable for CO2 flooding. Pet. Explor. Dev. 2015, 42, 358–363. [Google Scholar] [CrossRef]
- Hu, Y.; Hao, M.; Chen, G.; Sun, R.; Li, S. Technologies and practice of CO2 flooding and sequestration in China. Pet. Explor. Dev. 2019, 46, 716–727. [Google Scholar] [CrossRef]
- Yang, H.; Lin, L.; Chen, L.; Yu, Y.; Li, D.; Tian, J.; Zhou, W.; He, J. Characteristics of Mineralogy, Lithofacies of Fine-Grained Sediments and Their Relationship with Sedimentary Environment: Example from the Upper Permian Longtan Formation in the Sichuan Basin. Energies 2021, 14, 3662. [Google Scholar] [CrossRef]
- Xu, L.; Li, H. A Modified Multiple-Mixing-Cell Method with Sub-Cells for MMP Determinations. Energies 2021, 14, 7846. [Google Scholar] [CrossRef]
- Jiang, Y.; Yang, J.; Chen, D. Research and application of gravity drainage in steam flooding:an example from the high-dip angle area of Qi-40 block in Liaohe oilfield. Oil Gas Geol. 2012, 33, 938–943. [Google Scholar]
- Tian, H. Experimental Study on Waterflooding Law of High Dip Reservoir. Contemp. Chem. Ind. 2021, 50, 1632–1635. [Google Scholar] [CrossRef]
- Qiao, S.; Geng, W.; Zhang, X.; Tan, J. Key Technology Policy of Natural Gas Gravity Drive-Take Northern Liuzan Block of Nanpu Sag for Example. Oil Forum 2022, 41, 32–38. [Google Scholar] [CrossRef]
- Feng, K.; Mu, L.; Yan, Y.; Wu, Z.; Li, Q.; Zhang, Y. Numerical simulation of the enhanced oil recovery by gas-assisted gravity drainage (GAGD). Pet. Geol. Oilfield Dev. Daqing 2020, 39, 77–86. [Google Scholar] [CrossRef]
- Yang, X.; Wang, R.; Deng, X.; Li, S.; Zhang, H.; Yao, C. Theoretical exploration of water injection gravity flooding oil in ultra-deep fault-controlled fractured-cavity carbonate reservoirs. Pet. Explor. Dev. 2022, 49, 116–124. [Google Scholar] [CrossRef]
- Saikia, B.D.; Rao, D.N. A Single-Well Gas-Assisted Gravity Drainage Enhanced Oil Recovery Process for U.S. Deepwater Gulf of Mexico Operations. Energies 2021, 14, 1743. [Google Scholar] [CrossRef]
- Grattoni, C.A.; Jing, X.D.; Dawe, R.A. Dimensionless groups for three-phase gravity drainage flow in porous media. J. Pet. Sci. Eng. 2001, 29, 53–65. [Google Scholar] [CrossRef]
- Yang, C.; Li, Y.; Han, J.; Xu, X. Quantitative evaluation and screening method for gas assisted gravity drainage reservoir. Acta Pet. Sin. 2013, 34, 938–946. [Google Scholar] [CrossRef]
- Liang, S.; Zhou, W.; Zhang, J. Investigation on Effect Application of the Technology of Crestal Gas Injection for Stable Gravity Flooding. J. Southwest Pet. Univ. 2014, 36, 86–92. [Google Scholar] [CrossRef]
- Zhang, Y.; Wang, K.; Li, H.; Li, L.; Nie, F. Study of numerical simulation for gravity drive of crestal nitrogen injection in gas-cap reservoir. J. China Univ. Pet. 2006, 30, 58–62. [Google Scholar] [CrossRef]
- Ren, S.; Liu, Y.; Zhang, L.; Cui, G.; Gong, Z.; Wang, Y.; Han, B. Gravity assisted gas injection: Assessment model and experimental study. J. China Univ. Pet. 2018, 42, 59–66. [Google Scholar] [CrossRef]


| Layer NO. | Porosity/% | Perm-Plug Method/10−3 μm2 | ≤60 Mesh/% | 60~100 Mesh/% | ≥100 Mesh/% |
|---|---|---|---|---|---|
| 1 | 44.78 | 5455 | 63 | 25 | 12 |
| 2 | 38.62 | 3218 | 47 | 28 | 25 |
| 3 | 35.15 | 1361 | 30 | 35 | 35 |
| Core | 23.54 | 237 | – | – | – |
| Layer Position | Saturated Oil Volume/mL | Saturation Ratio/% | Pore Volume/mL | Single Layer Saturation/% |
|---|---|---|---|---|
| High permeability layer | 10.00 | 33.90 | 10.26 | 97.45 |
| Medium permeability layer | 12.00 | 40.68 | 12.62 | 95.12 |
| Low permeability layer | 7.50 | 25.42 | 8.06 | 93.11 |
| Summary | 29.50 | 100.00 | 30.93 | 95.37 |
| Layer/Stage | HCPV | Total Recovery Degree, % | Stage Recovery Degree, % |
|---|---|---|---|
| High permeability layer | 0.23 | 20.21 | 20.21 |
| Medium permeability layer | 0.59 | 46.22 | 26.01 |
| Low permeability layer | 1.45 | 55.13 | 8.91 |
| Production before gas breakthrough | 0.68 | 49.97 | 49.97 |
| Production after gas breakthrough | 1.45 | 55.13 | 5.16 |
| Layer/Stage | HCPV | Total Recovery Degree, % | Stage Recovery Degree, % |
|---|---|---|---|
| High permeability layer | 0.24 | 21.79 | 21.79 |
| Medium permeability layer | 0.60 | 48.72 | 26.93 |
| Low permeability layer | 1.55 | 67.51 | 18.79 |
| Production before gas breakthrough | 0.78 | 59.81 | 59.81 |
| Production after gas breakthrough | 1.55 | 67.51 | 7.70 |
Publisher’s Note: MDPI stays neutral with regard to jurisdictional claims in published maps and institutional affiliations. |
© 2022 by the authors. Licensee MDPI, Basel, Switzerland. This article is an open access article distributed under the terms and conditions of the Creative Commons Attribution (CC BY) license (https://creativecommons.org/licenses/by/4.0/).
Share and Cite
Han, H.; Chen, X.; Ji, Z.; Li, J.; Lv, W.; Zhang, Q.; Gao, M.; Kang, H. Experimental Characterization of Oil/Gas Interface Self-Adjustment in CO2-Assisted Gravity Drainage for Reverse Rhythm Reservoir. Energies 2022, 15, 5860. https://doi.org/10.3390/en15165860
Han H, Chen X, Ji Z, Li J, Lv W, Zhang Q, Gao M, Kang H. Experimental Characterization of Oil/Gas Interface Self-Adjustment in CO2-Assisted Gravity Drainage for Reverse Rhythm Reservoir. Energies. 2022; 15(16):5860. https://doi.org/10.3390/en15165860
Chicago/Turabian StyleHan, Haishui, Xinglong Chen, Zemin Ji, Junshi Li, Weifeng Lv, Qun Zhang, Ming Gao, and Hao Kang. 2022. "Experimental Characterization of Oil/Gas Interface Self-Adjustment in CO2-Assisted Gravity Drainage for Reverse Rhythm Reservoir" Energies 15, no. 16: 5860. https://doi.org/10.3390/en15165860
APA StyleHan, H., Chen, X., Ji, Z., Li, J., Lv, W., Zhang, Q., Gao, M., & Kang, H. (2022). Experimental Characterization of Oil/Gas Interface Self-Adjustment in CO2-Assisted Gravity Drainage for Reverse Rhythm Reservoir. Energies, 15(16), 5860. https://doi.org/10.3390/en15165860