Abstract
This paper assesses the profitability of battery storage systems (BSS) by focusing on the internal rate of return (IRR) as a profitability measure which offers advantages over other frequently used measures, most notably the net present value (NPV). Furthermore, this study proposes a multi-objective optimisation (MOO) approach to IRR estimation instead of relying on the simple linear optimisation and compares the results to the popular linear optimisation with battery cycle-cost penalty. The analysis is conducted under perfect foresight conditions by considering multiple revenue streams: arbitrage trading in the day-ahead and intraday markets, peak shaving, participating in the primary reserves market, and from photovoltaic (PV) power-generation unit. Data are collected for the German power market for 2017 and 2021. The results show that MOO approach yields similar IRR estimates to the cycle-cost model in 2017. However, higher market volatility and increased electricity prices in 2021 resulted in tangible differences. The analysis shows that, if such conditions are coupled with a low battery capacity price, the MOO method significantly outperforms the cycle-cost model. The effects of battery calendar lifetime and state of charge which decrease profitability are also considered. Nevertheless, a noticeable rise in profitability in 2021 relative to 2017 could provide enough compensation to address the issue of relatively poor viability track record.
Keywords:
battery storage viability; cycle-cost; multi-objective optimisation; profitability measures JEL Classification:
C61; G31; Q40
1. Introduction
1.1. Background and Motivation
The need to address climate change issues has seen an increase in the share of renewable energy sources (RES) in the power sector, which is expected to reach worldwide by 2050 [1]. However, the inherent volatility of their power generation needs to be addressed in order to promote the green transition. This is especially true in the EU, which has set the ambitious goal of reaching carbon neutrality by 2050 [2]. Increasing the flexibility of the power system is seen as a solution to the problem [3]. To that purpose, operation optimisation and economic viability of distributed energy resources (DERs) providing supply- or demand-side flexibility is becoming crucial [4]. The viability of various types of energy storages acting as DERs is therefore frequently examined. Although many commercialised technologies are available, battery storage technology is often in the research focus for a number of reasons, but most importantly due to the fact that benefits of battery storage technologies in the RES integration process are broadly acknowledged [5]. This claim can be further backed up by [6,7], who elaborate in detail on the technical characteristics of batteries which make them suitable to various purposes. In [8], their potential to participate in the reserves market is further pointed out, with [9] stressing the need to further explore and develop the technology for high power applications, while [10] emphasize their ability to support multiple business models.
Apart from research dealing with technical aspects of battery storage system (BSS) operation modelling, their economic viability has been the focus of many research papers. Studies on this topic vary greatly depending on a number of factors. For instance, ref. [11] focus on forecasting while [12] assess profitability from perfect foresight perspective. Refs. [11,13] deal with determining the optimal size of the BSS whereas [12,14,15] test different battery capacities in order to assess sensitivities and identify the break-even points. Refs. [15,16] focus on households as potential BSS clients, unlike [11,12], who base their analysis on data for 50 industrial sites. Furthermore, ref. [14] assess the BSS profitability by considering arbitrage trading in the electricity market and participation in the reserves market. Ref. [12] add peak-shaving as a source of revenue in the analysis and [11] also consider photovoltaic (PV) power sources in the parallel revenue stream setup.
The various different approaches complicate comparison between research and make generalisation of conclusions quite difficult. However, based on the papers addressing the economic viability, it should be possible to clearly draw conclusions regarding the assessment of profitability. While in some cases, such as in [12,14,16], the authors provide clear interpretation of their findings, the differences in methodology used, reported rates and seemingly conflicting conclusions blur the overall picture. For instance, findings in [12] suggest poor profitability, which is also indicated by a low discount rate of applied in the research. Contrary to this [14] report profitability rates up to , whereas profitability in the work of [16] is even higher, in the range from to .
Apart from the more general problem above, our research indicates an additional, more specific problem affecting the estimation of profitability which is related to the battery lifetime assumption. In some instances, such as in [11], the battery lifetime is fixed and equals the battery calendar lifetime. In other studies, such as in [14], the battery cycle lifetime is used, leading to variable project lifetimes depending on battery usage. Sometimes, results for the assumptions are compared, e.g., in [12], to assess the impact of the different assumptions. The difference can prove to be quite significant if the number of battery cycles is not used up evenly over the analysed period and if the profit that battery cycles generate fluctuates greatly. In order to overcome the issue and optimise the battery use a simple method of introducing a variable related to the battery cycle cost is frequently applied, such as in [17,18,19]. However, ref. [20] stresses that the approach may not always lead to optimal battery use.
1.2. Our Approach and Research Objective
In order to mitigate the first problem, we advocate the use of a profitability measure which seems to have been frequently overlooked in the BSS profitability assessment literature. We argue in favour of the internal rate of return (IRR) as a preferred method to assess profitability given the advantages over the popular net present value (NPV) and many other frequently used profitability measures. Namely, unlike the simple payback period method and rates of return on invested capital which disregard the time value of money and fail to take into account the entire project lifetime, the IRR (just as the NPV) takes both into account. In contrast to the NPV, there is no need to make assumptions regarding the discount rate estimation and no need to perform sensitivity analysis to determine the break-even point, since the IRR is the profitability level (which can also be viewed as the discount rate) at which the NPV equals zero. Therefore, we argue that IRR allows easier comparison and generalisation of conclusions regarding the BSS profitability fostering further research on the topic while taking into account many possible contexts of such studies. However, apart from research by [16] and, more recently, ref. [21] it is hard to find additional papers which made use of it.
Regarding the battery lifetime assumption, this research proposes the multi-objective optimisation (MOO) approach to define optimal battery usage and estimate the IRR, instead of relying on the simple linear optimisation or the popular battery linear optimisation with battery cycle-cost penalty (CC). Encouraged by the work of [20] we argue that MOO can outperform the CC approach since under CC the battery is used only when the available benefits outweigh the cost of battery degradation. In our analysis, we apply the MOO to determine the optimal cash flows the BSS generates by the trade-off between the cash flow size and the number of years they are expected to flow in based on the battery cycle lifetime. Without such optimisation the cash flow size could be maximised at the expense of battery lifetime and vice versa, adversely affecting the profitability in both cases.
Therefore, the goal of this paper is to comprehensively assess the BSS profitability in the German power market under perfect foresight conditions. The assessment is based on the IRR as a profitability measure and by comparing the results for competing optimisation methods. We consider multiple revenue streams available to the BSS and related to the arbitrage trading in the day-ahead and intraday markets, participation in the frequency containment reserves (FCR) market as the primary reserves market, peak shaving for 50 industrial sites and power generation from a PV unit.
1.3. Research Contribution
Our research contributes to the existing literature in several aspects. First of all, it applies the IRR as a profitability assessment measure which complements the recent research focused on the economic viability of BSS. Recent papers by [11,12,15] all rely heavily on the NPV method while [14] apply a simple rate of return suffering from the major drawbacks already mentioned. Additionally, by employing the MOO to optimise the BSS cash flow relative to the battery lifetime and, by comparing the obtained estimates to the popular CC approach, this study provides valuable insight regarding the possible improvement in BSS profitability estimation. Indeed, our findings demonstrate, as suggested by [20], that under certain conditions the MOO can outperform the popular CC approach. Specifically, we find that an increase in electricity prices accompanied by their increased volatility and a drop in battery prices presents a combination of factors leading to a strong MOO outperformance.
The paper has the following structure. Section 2 describes the data and methodology and also presents technical assumptions of the BSS. Section 3 reveals research findings by focusing on estimated IRRs in different operational and optimisation settings. Section 4 discusses the findings and concludes the paper by addressing its limitations and by providing the guidelines for future research.
2. Materials and Methods
2.1. Data
This research is performed using the data collected for the German power market in 2017 and 2021. Wholesale electricity prices were obtained from the ENTSO-E webpage (60-min day-ahead prices) and the EPEX-Database (15-min intraday prices). Since the 2021 intraday prices were not available, we ran a stochastic simulation to generate a time-series of intraday prices. Generated intraday prices are a result of corresponding day-ahead prices adjusted for the stochastically simulated spread between day-ahead and intraday prices. This spread was a result of the random number generator assuming the normal distribution and the spread modelled based on the 2017 dataset. More specifically, we recognized spread level as a function of month-of-the-year and corresponding day-ahead price level, while spread volatility (measured as standard deviation) was month-of-the-year dependent.
Table 1 shows that data for 2017 and 2021 represent very different market conditions in the German power market. The descriptive statistic show clearly that price level and volatility of wholesale electricity prices in 2021 is significantly higher than in 2017. The described difference in market conditions plays an important factor which significantly influences the presented findings as shown later in the paper.

Table 1.
Descriptive statistics of wholesale electricity prices in the German power market (€/kWh).
From the ENTSO-E webpage we downloaded the FCR prices for the 2017 (weekly resolution) and 2021 (four-hour resolution). We set the peak power price and the electricity supply fees for the average small- and medium-sized enterprises (SMEs) in Baden-Württemberg. For this research, observed load profiles (15-min resolution) were obtained from [22]. These relate to 50 German industrial plants in 2017 and all of these plants were characterised as SMEs. The PV electricity production potential was acquired from the renewables.ninja website. For the investment (purchase) cost of the operating hardware the following assumptions were initially made: 400 €/kWh plus 400 €/kW as the price for the battery storage, and 1750 €/kW as the price for the PV system.
2.2. Internal Rate of Return (IRR)
This paper is based on the IRR as a key economic metric for assessing the profitability of investment projects. Namely, when deciding whether to invest large amounts of capital, if IRR exceeds the cost of capital (the required minimum rate of return for an investor), the investment project is considered to be efficient from the financial point of view. More specifically, IRR represents the compounded annual profitability rate of a project based on the time-series of cash flows, i.e., IRR confronts expected capital expenditures (cash outflows) and operating benefits (net cash inflows) over the project’s lifetime. Since battery storage purchase represents large capital expenditure for the observed BSS, the level of IRR greatly defines optimal battery size and overall operational setting. Based on the observed historical data for 2017 and 2021, the optimal mix of the BSS business activities (energy savings, revenues from ancillary services, and electricity prices arbitrage trading) resulting in annual net cash flows is estimated for each year separately. This maximal (optimal) level of annual benefits is further assumed as a continuous and constant level of cash flows during all years of operation that will be available to investors. Thus, we define IRR as:
where i is the internal rate of return of BSS, T is the battery lifetime, I is initial investment in battery and are annual net cash flows which are assumed constant for the whole period T. Battery cycle lifetime of 5000 cycles is assumed throughout the analysis. The battery cycle lifetime expressed in a number of years is calculated based on the number of battery cycles used up in the annual net cash flow estimation as a result of optimisation and the maximum number of cycles (5000). Battery calendar lifetime can also be used for battery lifetime and when used in this paper it was assumed to stand at 20 years.
2.3. Technical Assumptions of the Battery Storage System
We refer to the battery storage together with photovoltaics as the battery storage system (BSS) which supplies the energy to the industrial plants. The PV power and the battery storage power is kept at an equal level throughout the analysis. PV can provide energy to industrial plants, charge the battery storage or sell the energy directly to the grid. A battery can charge itself from the PVs or by buying from the grid and can be discharged to meet the demand of industrial plants or to sell the electricity to the grid. It is also possible for the battery to provide ancillary services in the form of FCR. Finally, the industrial plants’ demand can be met by buying directly from the grid. Also, BSS generates revenue by performing peak shaving and arbitrage in day-ahead and intraday markets which are observable in the lower cost of peak power and electricity.
2.3.1. Basic Model Formulation
In the optimisation model the cost function and its components have to be defined first.
In (2) the cost function, which is the objective function of the model, is defined considering the cost of electricity, cost for peak power, and revenues from primary reserves. In (3) the cost of electricity with fees is computed. Since the electricity can be sold back to the grid for a price or , the fees are computed separately only for electricity bought from the grid, and . In the case of selling back to grid, is negative and so are and . Equation (4) defines weekly revenue from primary reserves as the product of the power reserved for providing FCR and the FCR market price. In (5), the cost of peak power is defined as a product of peak power and peak power price. The peak power is defined in (6). Multiplying by 4 is done because of the 15-min resolution.
In (7), capacity to power ratio for providing FCR is defined with factor n. Equations (8) and (9) are constraints on capacity and power reserved for FCR, while (10) to (12) define the remaining energy and charging and discharging capacities.
In (13)–(16) the state of charge of the battery in the latest interval is defined. It relates to charging or discharging from the previous interval. In (17) and (18), binary variable x is used to rule out the concurrent charging and discharging of the battery.
In (19), buying from the grid, discharging previously stored electricity from the battery, or using electricity generated by PV is defined to meet the demand from industrial plants. In (20), the utilization of electricity from PV is defined. It can be stored in the battery, used for the demand of industrial plants, or sold to the grid. In (21) and (22), the electricity traded with the grid is described. Equation (21) nets the purchasing for industrial plants and charging the battery with sale of PV electricity and discharging the battery. Equation (22) defines the purchasing or selling the electricity at the intraday and day-ahead markets.
Equations (23) and (24) define the power of charging and discharging for each interval, taking into account the charging and discharging inefficiencies. In (25) through (28), the binary variable y is used to rule out the simultaneous buying at the one market and selling at the other. Finally, (29) computes annual cycle degradation as total energy that went through the battery. The FCR factor fFCR is used to compute the cycle degradation while providing the FCR.
2.3.2. FCR Market Formulation for 2021
In 2021, FCR market is based on 4-h resolution, so the model needs to be adjusted accordingly. Equations (30) and (31) are added to the model to describe the 4-h resolution.
The hourly dimension is added to all FCR related variables, i.e., (2), (4) and (7) through (12). In Equations (7) through (12), hourly dimension is simply added to variables, becomes and becomes . However, since the FCR market is based on 4-h resolution, only every fourth hour is considered when describing FCR revenue. Therefore, in (2) and (4), is replaced with where is such that and is added under the h sum. In (4), is again replaced with .
2.4. Optimisation Methods
All optimisations were carried out using the General Algebraic Modeling System (GAMS) with CPLEX solver.
2.4.1. Simple Linear Optimisation (without Either Cycle Depletion or Cycle-Cost Constraints)
The first method analysed in this paper is the simple linear optimisation method. In this method, the cost function is minimized under all the constraints from the model defined in the previous subsection. If only the above is considered in the optimisation process, the model in this paper is referred to as the simple linear optimisation model. The results of the optimisation, cost either by using (2) or (34) and are used to calculate cash flow CF and battery cycle lifetime T as:
where is the cost of industrial plants without the BSS and 5000 refers to the battery cycle lifetime. These results are then used in the second step to calculate the IRR under the constant cash flow assumption. It should be noted that all of the methods analysed in the paper involve these two steps, with the second step being the same for all methods.
2.4.2. Linear Optimisation with Battery Cycle-Cost Penalty
As its name suggests, the battery cycle-cost model considers the cost of each battery cycle so that BSS is discouraged from entering trade if it will earn less than the cost of cycle depletion for that trade. Equation (2) then becomes
where is used to calculate energy that will flow through battery and is factor which represents the cost of each battery kWh. The cost emerged from that factor is not incorporated in the final version of the cost variable which is used in the cash flow equation as that charges are not really transacted since the cycle-cost factor is only used as a filter for acceptable trades.
2.4.3. Multi-Objective Optimisation (MOO)
We used the multi-objective optimisation method known as epsilon constraint method presented in [23]. Two objective functions that are optimized are the cost function defined in (2) and the function defined in (29), which computes the annual depletion of battery cycles. This method yields a Pareto optimal front for each battery capacity and power parameter.
Algorithm 1 describes the MOO algorithm steps. First, from minimizing the cost function and the function, solutions for are obtained. They are used in a loop to define the range for from to . For each of the values, constraint on is defined. With that new constraint, cost function is minimized and optimisation results are saved.
| Algorithm 1 MOO algorithm |
| Initialisation: |
| 1: Solve minimizing cost function. |
| 2: Set solution value of as lower point of newly defined range. |
| 3: Solve minimizing function. |
| 4: Set solution value of as upper point of previously defined range. |
| LOOP Process: |
| 5: for to 10 do |
| 6: Compute: |
| Set a new constraint: |
| Solve minimizing cost function. |
| Save optimization results. |
| 7: end for |
| 8: return results for all 10 points |
The MOO algorithm yields higher costs but longer battery lifetime with each step as it has a lower amount of cycles to work with annually due to the constraint. Note that in the first optimisation point , there are no constraints on the battery cycle depletion, therefore those results are equal to the simple linear optimisation approach. The MOO yields lifetime T and for optimal optimisation point as optimisation results.
3. Research Findings
3.1. Performance Comparison of MOO and Simple Linear Optimisation
The results of MOO for c-rates of 0.5 and 0.4 and capacities of 3000 kWh and 4000 kWh, respectively, can be seen in Table 2 as examples. Note that IRR is increasing until optimization points and . For the optimisation points in the specified range, it can be concluded that battery lifetime extension generated by the imposed constraint on the reduction in the number of battery cycles is enough to offset the lower savings (cash flows) incurred by the same constraint. However, if battery calendar lifetime of 20 years is assumed, new results are obtained and denoted by and , where is the lower value of battery calendar lifetime (20 years) or battery cycle lifetime (5000 cycles) and is the internal rate corresponding to the new lifetime .
Table 2.
MOO effects for c-rates 0.4 and 0.5 in 2017.
Results for c-rate of 0.5 and capacities 1000 kWh to 5000 kWh are shown in the Figure 1. Optimisation points from to are presented, where is the optimisation point with the lowest constraint on the reduction in the number of battery cycles (no constraint to be precise), and is the point with the strictest constraint. It can be seen that, for each capacity, IRR is increasing until the decreasing cash flows (generated by the lower savings) are too small and cannot be compensated by longer battery lifetime. Therefore, the improvement in profitability in respect to the simple linear optimisation can be noted by comparing optimisation points in the figure to the which refers to the simple linear optimisation, i.e., optimisation without constraints on the reduction in the number of battery cycles.
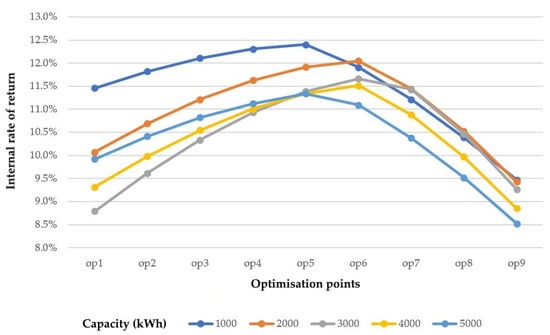
Figure 1.
MOO effects for c-rate of 0.5 and battery capacities 1000–5000 kWh.
The comparison of the simple linear optimisation method and the MOO can easily be made by looking at the Figure A1 and Figure A2 provided in the Appendix A.2, which show that the MOO not only outperforms the simple linear optimisation, but also smooths out the IRR estimates. This is related to the fact that simple linear optimisation enters all profitable trades in the analysed year but doesn’t take into account the battery depletion of the trades, which shortens the battery cycle lifetime.
3.2. Performance Comparison of MOO and CC
We now turn the focus to the differences in performance between the CC and the MOO. Data on profitability for both methods for various c-rates and battery capacities are presented in Table 3 and show that both methods yield very similar results. Additionally, differences in profitability between the MOO and the CC in 2021 are shown in Figure 2.
Table 3.
Performance comparison (profitability measured by IRR) of CC and MOO.
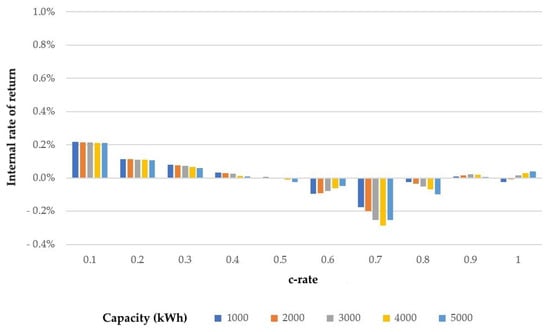
Figure 2.
Difference in profitability between MOO and CC approaches (IRR of CC is subtracted from IRR of MOO) in 2021 and battery capacity price of 400 €/kWh.
One can observe from the Table 3 that the optimal c-rate exists. For both years and analysed methods it is the c-rate of 0.5. Note that profitability is increasing as the battery capacity is decreasing, therefore there is no optimum regarding the battery capacity. It can be seen that in 2017 there are almost no differences in estimated profitability rates. However, the results for 2021 are inconclusive. For lower c-rates MOO seems to yield better results while CC seems to perform better for c-rates in the range between 0.6 and 0.8.
Although the results for MOO and CC are similar, MOO should be more robust to changes in the market conditions (electricity price level and volatility of electricity prices) or lower battery storage cost. The reasoning comes from the methods themselves as the CC attempts to take into account cycle reduction by penalising trades and entering only the trades which are above the cycle-cost threshold. As can be seen from the above results increase in the electricity prices accompanied by greater volatility in 2021 created more favourable conditions for BSS. Apart from a jump in profitability relative to 2017 for both methods, the stated factors also caused the increase in differences in the results of the analysed methods. If the market conditions continued to further develop in favour of the BSS or the battery capacity prices fell, thus creating even more profitable opportunities, the cycle-cost threshold could easily become irrevelant as it could be expected that a large portion of trades would be positioned above it. In that case, a similar problem to the one in simple linear optimisation would occur, the battery would enter too many trades and use up a lot of its lifetime on suboptimal but above-the-limit trades.
Therefore, we further analyse the effect of a drop in price of battery storage capacity in order to test the hypothesised CC weakness and MOO robustness. The results for 2017 and 2021 and a price of 100 €/kWh (instead of 400 €/kWh) are shown in Table 4 (the price of 400 €/kW regarding battery power was kept the same).
Table 4.
Performance comparison (profitability measured by IRR) of CC and MOO for battery capacity price of 100 €/kWh.
Again, the results show decreasing profitability with the increase in battery capacity while the optimal c-rates are 0.4 and 0.5 for 2017 and 2021, respectively (one notable exception being the c-rate 0.3 for 2021 and 5000 kWh). Results for 2017 show that the MOO constantly outperforms the CC but the differences are small, around 0.2–0.3%. However, it can be seen that, in 2021, MOO yields better results with growing outperformance for higher c-rates as depicted in Figure 3. The findings suggest that with higher c-rate it is easier to exploit the market opportunities to a greater extent by relying on the MOO rather than the CC. This can be traced back to the fact that MOO picks the best trades with constraint on and with different constraints for different optimisation points (the best optimisation point is then chosen), while the CC enters all the trades for which contribution to earnings is above the cycle-cost limit, which can hurt overall profitability by decreasing battery cycle lifetime.
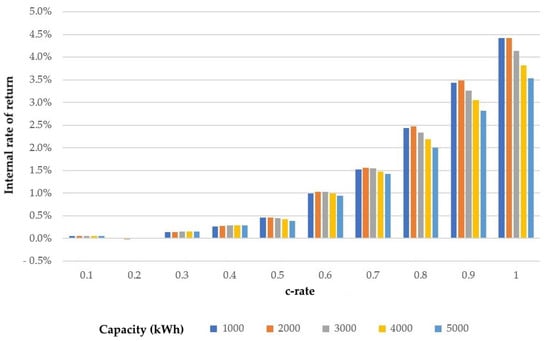
Figure 3.
Difference in profitability between MOO and CC approaches (IRR of CC is subtracted from IRR of MOO) in 2021 and battery capacity price of 100 €/kWh.
Given the current development of market conditions and the advocated clean energy transition, both of the analysed factors under which the CC can yield suboptimal results may prove to play a prominent role in the near future.
3.3. MOO Performance under Real-World Assumptions
Finally, in this research we report the results related to the introduction of real-world assumptions which decrease profitability. For this purpose, the battery capacity price is set back to 400 €/kWh. Performances in both 2017 and 2021 are presented and compared in Table 5.
Table 5.
Introduction of real-world assumptions and decreasing profitability, comparison of 2017 and 2021 MOO performance (c-rate = 0.5).
IRR SoC 0–100 is the IRR obtained with the MOO method, IRR’ SoC 0–100 is the IRR obtained with the MOO under the assumption of calendar lifetime of 20 years and finally (as explained at the beginning of this section when discussing results referring to Table 2, IRR’ SoC 10–90 and IRR’ SoC 20–80 are IRRs obtained with the MOO under the assumption of calendar lifetime of 20 years and restrictions on battery state of charge of 10–90% and 20–80%, respectively. IRR estimates regarding the introduction of the state of charge assumptions were obtained by increasing the battery investment costs so that the battery capacity reported in the table refers to the net battery capacity available.
As should be expected, each new restriction decreases the profitability. Higher profitabilities in 2021 can be observed due to better market conditions for BSS in terms of price level and volatility. The increase is relevant since further reduction in profitability is to be expected in the event that forecasting of model variables is introduced.
4. Discussion and Conclusions
The paper proposes a new approach to BSS profitability assessment. Based on the IRR as a profitability measure, the advocated MOO is compared to simple linear optimisation and to the popular cycle-cost linear optimisation (CC). The conducted analysis demonstrates how MOO is able to outperform the simple linear optimisation and that it also smooths out the IRR estimates. The findings further show that MOO and CC yield similar results, especially in 2017 and with battery capacity price fixed at 400 €/kWh. Nevertheless, the results for 2021 indicate that market conditions leading to higher BSS profitability (related to higher electricity prices and greater volatility) could cause performance deterioration of the CC. We argue that this is due to cycle-cost threshold which can become irrelevant as the large proportion of BSS trades above the imposed limit becomes available under such conditions. We provide evidence supporting this line of reasoning by reporting the results of the analysis with a decreased battery capacity price fixed at 100 €/kWh which further significantly increases the BSS profitability. With this change in inputs the findings show that MOO constantly outperforms CC in 2017, albeit by a small margin (0.2–0.3%). However, in 2021 we provide evidence of strong MOO outperformance showing that the MOO performance is therefore more robust to the changes in factors which increase the BSS profitability. Our research also demonstrates that an optimal c-rate for BSS exists (at or close to ) and that the BSS profitability falls with the increase in battery capacity. Lastly, our analysis reports the size of a drop in BSS profitability when real-world assumptions related to battery calendar lifetime of 20 years and SoC are introduced.
Although there are many papers analysing BSS viability, few papers employ IRR as a profitability measure, complicating direct comparisons with other papers. Furthermore, some papers which seem quite similar in addressing battery usage and other optimisation issues still differ in other ways, e.g., whether the analysis was based on a simulation or real data (and what revenue streams were analysed), whether the analysis was the result of forecasting or perfect foresight conditions, etc. Nevertheless, some comments on various findings are summarized here. Given the perfect foresight setting and the revenue stream analysed the results in this study are probably most comparable to the [12] and corroborate their findings that the BSS profitability is “considerably sensitive to variations in battery price and lifetime”. Also similar in the above aspects is the paper by [14]. Our findings also corroborate their findings regarding the existence of optimal c-rate and increasing profitability with a fall in battery capacity. Papers rarely include the IRR as a profitability measure. One such is [16], who report IRR in the range from to by varying remuneration tariffs and the rate of increase in electricity prices. Such results are similar to the ones obtained in this research, and both papers provide evidence that the BSS performs better in the rising electricity prices environment. Ref. [21] report lower IRR values ( and ) but rely on stochastic modelling rather than on real measurement data. However, in their analysis they advocate the use of MOO in order to optimise the potential trade-off regarding economic and technical aspects of BSS utilisation. Based on this, but also encouraged by the previously mentioned research such as [20,24] in this research we focused on the comparison of MOO and CC profitability estimates.
Practical implications of this study are many, owing mostly to the already highlighted advantages of IRR over other profitability measures, especially the popular NPV. Due to IRR being a relative measure of profitability it is easier to compare the results with other research papers and any discount rate below the obtained IRR must yield a positive NPV. Furthermore, the results in this research are based on optimisation of real measurement data, while real-world assumptions regarding battery SoC, cycle- and calendar-lifetime are also considered. The advocated methodological framework in this paper can therefore make future research more comparable and facilitate focus on specific optimisation problems. This could in turn also foster the green transition by attracting further investment.
Limitations of this research include the analysis being conducted under perfect foresight conditions, the assumption of constant cash flows generated over battery lifetime based on the optimisation related to one year, and the fact that the analysis included only one power market. However, most importantly, even though the research methodology is built around the IRR as a profitability measure it did not address the non-linear nature of IRR estimation. The compared IRR estimates in the analysis were obtained in the two-step process in which the linear optimisation methods are limited to the cash flow estimation (the first step of the process). A much more challenging optimisation method could attempt to estimate the IRR by employing a non-linear optimisation method. This should result in the most accurate IRR estimation and also enable the IRR to be estimated in a single step.
Future work could also apply the proposed methods to examine the BSS profitability by relaxing the perfect foresight assumption. The extent to which a reduction in IRR due to forecasting error can be compensated by higher profitability under more favourable market conditions such as in 2021 would provide a valuable insight. Also, whether MOO or CC yields more robust results when forecasting is considered requires additional testing.
Author Contributions
Conceptualization, J.J. and D.Z.; methodology, D.D. and I.P.; software, J.J. and N.Č.; validation, I.P.; formal analysis, J.J.; resources, D.D., N.Č. and J.J.; data curation, D.D., N.Č. and J.J.; writing—original draft preparation, J.J. and D.Z.; writing—review and editing, J.J., D.Z. and D.D.; visualization, J.J. and D.D; supervision, D.Z. and I.P. All authors have read and agreed to the published version of the manuscript.
Funding
This work was funded by the European Union through the European Regional Development Fund’s Operational Programme Competitiveness and Cohesion 2014–2020 of the Republic of Croatia under project KK.01.1.1.04.0034 “Connected Stationary Battery Energy Storage”.
Institutional Review Board Statement
Not applicable.
Informed Consent Statement
Not applicable.
Data Availability Statement
Not applicable.
Conflicts of Interest
The authors declare no conflict of interest. The funders had no role in the design of the study; in the collection, analyses, or interpretation of data; in the writing of the manuscript; or in the decision to publish the results.
Abbreviations and Nomenclature
Abbreviations
The following abbreviations are used in this manuscript:
| BSS | Battery storage system |
| CC | Linear optimisation with battery cycle-cost penalty |
| FCR | Frequency containment reserve |
| IRR | Internal rate of return |
| MOO | Multi-objective optimisation |
| NPV | Net present value |
| PV | Photovoltaics |
| SoC | State of charge |
Nomenclature
| Sets and indices | |
| Set of weeks, running from 1 to 52 | |
| Set of hours, running from 1 to 168 | |
| Set of quarter-hour periods, running from 1 to 4 | |
| Parameters | |
| FCR cycle degradation factor (kWh/kW) | |
| Cycle-cost factor (€/kWh) | |
| Demand from 50 industrial plants (kWh) | |
| Charging efficiency coefficient | |
| Discharging efficiency coefficient | |
| Fees for supplying electricity (€/kWh) | |
| Peak power price (€/kW) | |
| Day-ahead market price (€/kWh) | |
| Intraday market price (€/kWh) | |
| FCR market price (€/kW) | |
| Utilized PV generation (kWh) | |
| Installed BSS power (kW) | |
| Installed BSS capacity (kWh) | |
| Variables | |
| Cost of purchased electricity (€) | |
| Cost of peak power (€) | |
| Revenue from FCR (€) | |
| Electricity injected from BSS to industrial plants (kWh) | |
| Electricity injected from PV to industrial plants (kWh) | |
| Electricity injected from PV to the grid (kWh) | |
| Electricity injected from PV to BSS (kWh) | |
| Electricity injected from the grid to industrial plants (kWh) | |
| Electricity injected from the grid to BSS (kWh) | |
| Electricity traded in the day-ahead and intraday market (kWh) | |
| Electricity traded in the day-ahead market (kWh) | |
| Electricity traded in the intraday market (kWh) | |
| Power provided for FCR (kW) | |
| Capacity provided for FCR (kWh) | |
| Peak power (kW) | |
| BSS charging power (kW) | |
| BSS discharging power (kW) | |
| BSS state of energy (kWh) | |
| Annual net cash flow (€) | |
| i | Internal rate of return (%) |
| Binary variable for (dis)charging constraints | |
| Binary variable for trading constraints | |
Appendix A
Appendix A.1
Table A1.
Parameters values and description table.
Table A1.
Parameters values and description table.
| Parameter | Description | Value |
|---|---|---|
| Charging efficiency coefficient | ||
| Discharging efficiency coefficient | ||
| Peak power price | €/kW | |
| Fees for supplying electricity | €/kWh | |
| FCR cycle degradation factor | kWh/kW (per week) | |
| Cycle-cost factor | €/kWh | |
| n | Battery FCR power to capacity ratio | 2 kWh/kW |
Appendix A.2
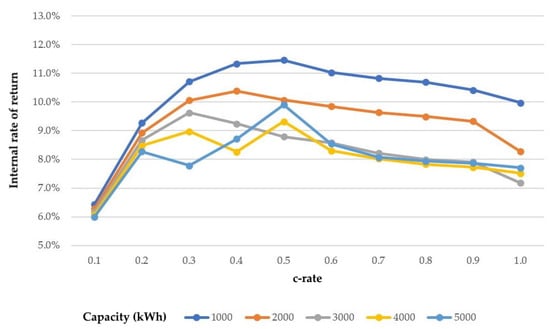
Figure A1.
IRR estimation results for 2017 (simple linear optimisation approach).
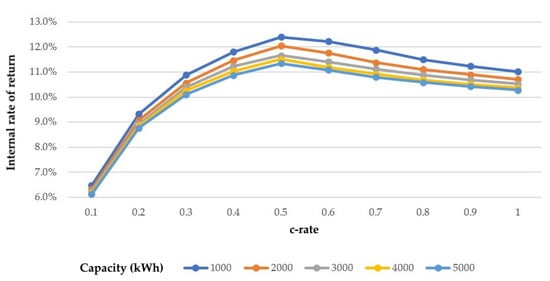
Figure A2.
IRR estimation results for 2017 (MOO approach).
References
- IRENA. Global Energy Transformation: A Roadmap to 2050; Technical Report; International Renewable Energy Agency: Abu Dhabi, United Arab Emirates, 2018. [Google Scholar]
- Commission, E. The European Green Deal. Available online: https://ec.europa.eu/info/strategy/priorities-2019-2024/european-green-deal (accessed on 13 July 2022.).
- Commission, E. Clean Energy for all Europeans; Technical Report; Publications Office of the European Union: Luxembourg, 2019. [Google Scholar]
- IRENA. Innovation Landscape Brief: Aggregators, International Renewable Energy Agency; International Renewable Energy Agency: Abu Dhabi, United Arab Emirates, 2019. [Google Scholar]
- SolarPowerEurope. European Market Outlook For Residential Battery Storage 2020–2024; Technical Report; SolarPower Europe: Brussels, Belgium, 2020. [Google Scholar]
- Šimić, Z.; Topić, D.; Knežević, G.; Pelin, D. Battery energy storage technologies overview. Int. J. Electr. Comput. Eng. Syst. 2021, 12, 53–65. [Google Scholar] [CrossRef]
- Divakaran, A.M.; Hamilton, D.; Manjunatha, K.N.; Minakshi, M. Design, development and thermal analysis of reusable Li-ion battery module for future mobile and stationary applications. Energies 2020, 13, 1477. [Google Scholar] [CrossRef]
- Barbero, M.; Corchero, C.; Casals, L.C.; Igualada, L.; Heredia, F.J. Critical evaluation of European balancing markets to enable the participation of Demand Aggregators. Appl. Energy 2020, 264, 114707. [Google Scholar] [CrossRef]
- Divakaran, A.M.; Minakshi, M.; Bahri, P.A.; Paul, S.; Kumari, P.; Divakaran, A.M.; Manjunatha, K.N. Rational design on materials for developing next generation lithium-ion secondary battery. Prog. Solid State Chem. 2021, 62, 100298. [Google Scholar] [CrossRef]
- Okur, Ö.; Heijnen, P.; Lukszo, Z. Aggregator’s business models in residential and service sectors: A review of operational and financial aspects. Renew. Sustain. Energy Rev. 2021, 139, 110702. [Google Scholar] [CrossRef]
- Čović, N.; Braeuer, F.; Mckenna, R.; Pandžić, H. Optimal PV and Battery Investment of Market-Participating Industry Facilities. IEEE Trans. Power Syst. 2021, 36, 3441–3452. [Google Scholar] [CrossRef]
- Braeuer, F.; Rominger, J.; McKenna, R.; Fichtner, W. Battery storage systems: An economic model-based analysis of parallel revenue streams and general implications for industry. Appl. Energy 2019, 239, 1424–1440. [Google Scholar] [CrossRef]
- Comello, S.; Reichelstein, S. The emergence of cost effective battery storage. Nat. Commun. 2019, 10, 2038. [Google Scholar] [CrossRef] [PubMed]
- Staffell, I.; Rustomji, M. Maximising the value of electricity storage. J. Energy Storage 2016, 8, 212–225. [Google Scholar] [CrossRef]
- D’Adamo, I.; Gastaldi, M.; Morone, P. The impact of a subsidized tax deduction on residential solar photovoltaic-battery energy storage systems. Util. Policy 2022, 75, 101358. [Google Scholar] [CrossRef]
- Mulder, G.; Six, D.; Claessens, B.; Broes, T.; Omar, N.; Mierlo, J.V. The dimensioning of PV-battery systems depending on the incentive and selling price conditions. Appl. Energy 2013, 111, 1126–1135. [Google Scholar] [CrossRef]
- Shi, Y.; Xu, B.; Wang, D.; Zhang, B. Using Battery Storage for Peak Shaving and Frequency Regulation: Joint Optimization for Superlinear Gains. IEEE Trans. Power Syst. 2018, 33, 2882–2894. [Google Scholar] [CrossRef]
- Bordin, C.; Anuta, H.O.; Crossland, A.; Gutierrez, I.L.; Dent, C.J.; Vigo, D. A linear programming approach for battery degradation analysis and optimization in offgrid power systems with solar energy integration. Renew. Energy 2017, 101, 417–430. [Google Scholar] [CrossRef]
- Xu, B.; Zhao, J.; Zheng, T.; Litvinov, E.; Kirschen, D.S. Factoring the Cycle Aging Cost of Batteries Participating in Electricity Markets. IEEE Trans. Power Syst. 2018, 33, 2248–2259. [Google Scholar] [CrossRef]
- He, G.; Chen, Q.; Moutis, P.; Kar, S.; Whitacre, J.F. An intertemporal decision framework for electrochemical energy storage management. Nat. Energy 2018, 3, 404–412. [Google Scholar] [CrossRef]
- Martinez, N.; Tabares, A.; Franco, J.F. Generation of alternative battery allocation proposals in distribution systems by the optimization of different economic metrics within a mathematical model. Energies 2021, 14, 1726. [Google Scholar] [CrossRef]
- Braeuer, F. Load profile data of 50 industrial plants in Germany for one year. Zenodo 2020. [Google Scholar] [CrossRef]
- Soroudi, A. Power System Optimization Modeling in GAMS; Springer International Publishing: Cham, Switzerland, 2017; pp. 58–61. [Google Scholar] [CrossRef]
- Hentunen, A.; Forsström, J.; Mukherjee, V. Advanced Battery Techno-Economics Tool; Technical Report; INVADE: Oslo, Norway, 2018. [Google Scholar]
Publisher’s Note: MDPI stays neutral with regard to jurisdictional claims in published maps and institutional affiliations. |
© 2022 by the authors. Licensee MDPI, Basel, Switzerland. This article is an open access article distributed under the terms and conditions of the Creative Commons Attribution (CC BY) license (https://creativecommons.org/licenses/by/4.0/).