Article

Study of Blockage Effects of Metro Train on Critical Velocity in Sloping Subway Tunnel Fires with Longitudinal Ventilation

College of Civil Engineering, Henan University of Technology, Zhengzhou 450001, China
*
Author to whom correspondence should be addressed.
Energies 2022, 15(15), 5762; https://doi.org/10.3390/en15155762
Submission received: 15 July 2022 / Revised: 4 August 2022 / Accepted: 8 August 2022 / Published: 8 August 2022
(This article belongs to the Special Issue Experiments and Simulations of Combustion Process)

Abstract

:
Critical velocity is very important for smoke control in longitudinally ventilated subway tunnel fires. Numerical investigations are conducted in this paper to study the impacts of metro train blockages on critical velocity in sloping subway tunnel fires by using fire dynamics simulator (FDS) tunnel models validated with the field-experiment data. Moreover, a global model of critical velocity is presented for the blocked zone of a metro train in subway tunnel fires including influencing factors of the blockage ratio and tunnel slope. The results show that the reduction ratio of critical velocity in the blocked zone is less than the metro-train blockage ratio. The correction factor between the critical velocity reduction ratio and metro-train blockage ratio is 0.545. The aerodynamic shadow zone downstream of a subway train blockage has important impacts on the critical velocity. The critical velocity in the unblocked zone of a metro train is higher than that in the blocked zone of a metro train blockage. The reason is that smoke flow is hindered by the metro train blockage in subway tunnel fires. With an increase in the blockage–fire source distance, the critical velocity first decreases and then tends to be constant. The global model presented can accurately predict the critical velocity in a sloping subway tunnel with a train blockage. The results may provide beneficial suggestions for designing ventilation systems for subway tunnels.

1. Introduction

The subway has developed rapidly around the world as an efficient means of urban public transportation. However, fire smoke is a huge threat to passenger safety [1,2]. Toxic smoke gas has been found to be the main cause of death of people in tunnel fire accidents that have occurred in recent decades [3]. Effective subway tunnel ventilation is an important technical means to provide safe conditions and reduce casualties in subway tunnel fires [4]. If the longitudinal ventilation velocity is not large enough, fire-induced smoke will spread in the reverse direction of the ventilation air. This phenomenon is called the smoke back-layering flow in tunnel fires. Critical velocity is defined as the minimum longitudinal ventilation velocity when the smoke back-layering length becomes zero [5]. When designing tunnel ventilation systems, critical velocity is one of the most important design parameters to control smoke in subway tunnel fires. Therefore, the critical velocity in subway tunnel fires should be intensively investigated for its importance.
Since the late 1950s, the critical velocity in tunnel fires has become an active area of study. Thomas [6] first presented a prediction model for critical velocity in tunnel fires according to theoretical analysis based on the Froude number. Previous studies have investigated the influencing factors of critical velocity in tunnel fires, such as the heat release rate [7], pool fire characteristics [8,9], natural ventilation [10], non-axisymmetric cross-section [11], tunnel blockage [12,13,14], and tunnel slope [15,16]. Theoretical analysis, numerical simulation, and experimental study are the three main types of research methods for critical velocity in tunnel fires [13,17,18]. The hydraulic diameter of the tunnel was introduced in the dimensionless prediction model of critical velocity to cope with the problem of different tunnel cross-section forms [19].
Existing studies have investigated the influence of tunnel slope and tunnel blockage on the critical velocity in a tunnel fire. However, studies on the combined effects of tunnel slope and metro train blockage on the critical velocity are insufficient [20]. The blockage impact of a metro train on the critical velocity is a complex problem in sloping subway tunnel fires and needs to be further studied [21]. There are four kinds of main influences of a metro train blockage on the critical velocity. Firstly, a subway train blockage changes the airflow field in a subway tunnel. The ventilation velocity increases in the region near the metro train, owing to the reduction in the ventilation cross sectional area in the subway tunnel [22]. Secondly, there is an aerodynamic shadow zone downstream of the metro train after the horizontal airflow passes around the metro train [23,24]. Thirdly, the metro train hinders the flow of hot smoke and changes the temperature field of the hot smoke plume. Fourthly, the stack effect of the smoke layer in the sloping subway tunnel influences the static pressure difference between the smoke front and the ambient air [25]. Motivated by the above-mentioned facts, this work conducted field validation experiments and numerical simulations to investigate the blockage impacts of a subway train on the critical velocity in sloping subway tunnel fires. This paper aims to discover the reason that a metro train blockage influences the critical velocity in sloping subway tunnel fires. Moreover, a global model of critical velocity will be presented in this paper for the blocked zone of a metro train in sloping subway tunnel fires.

2. Numerical Model and Model Validation

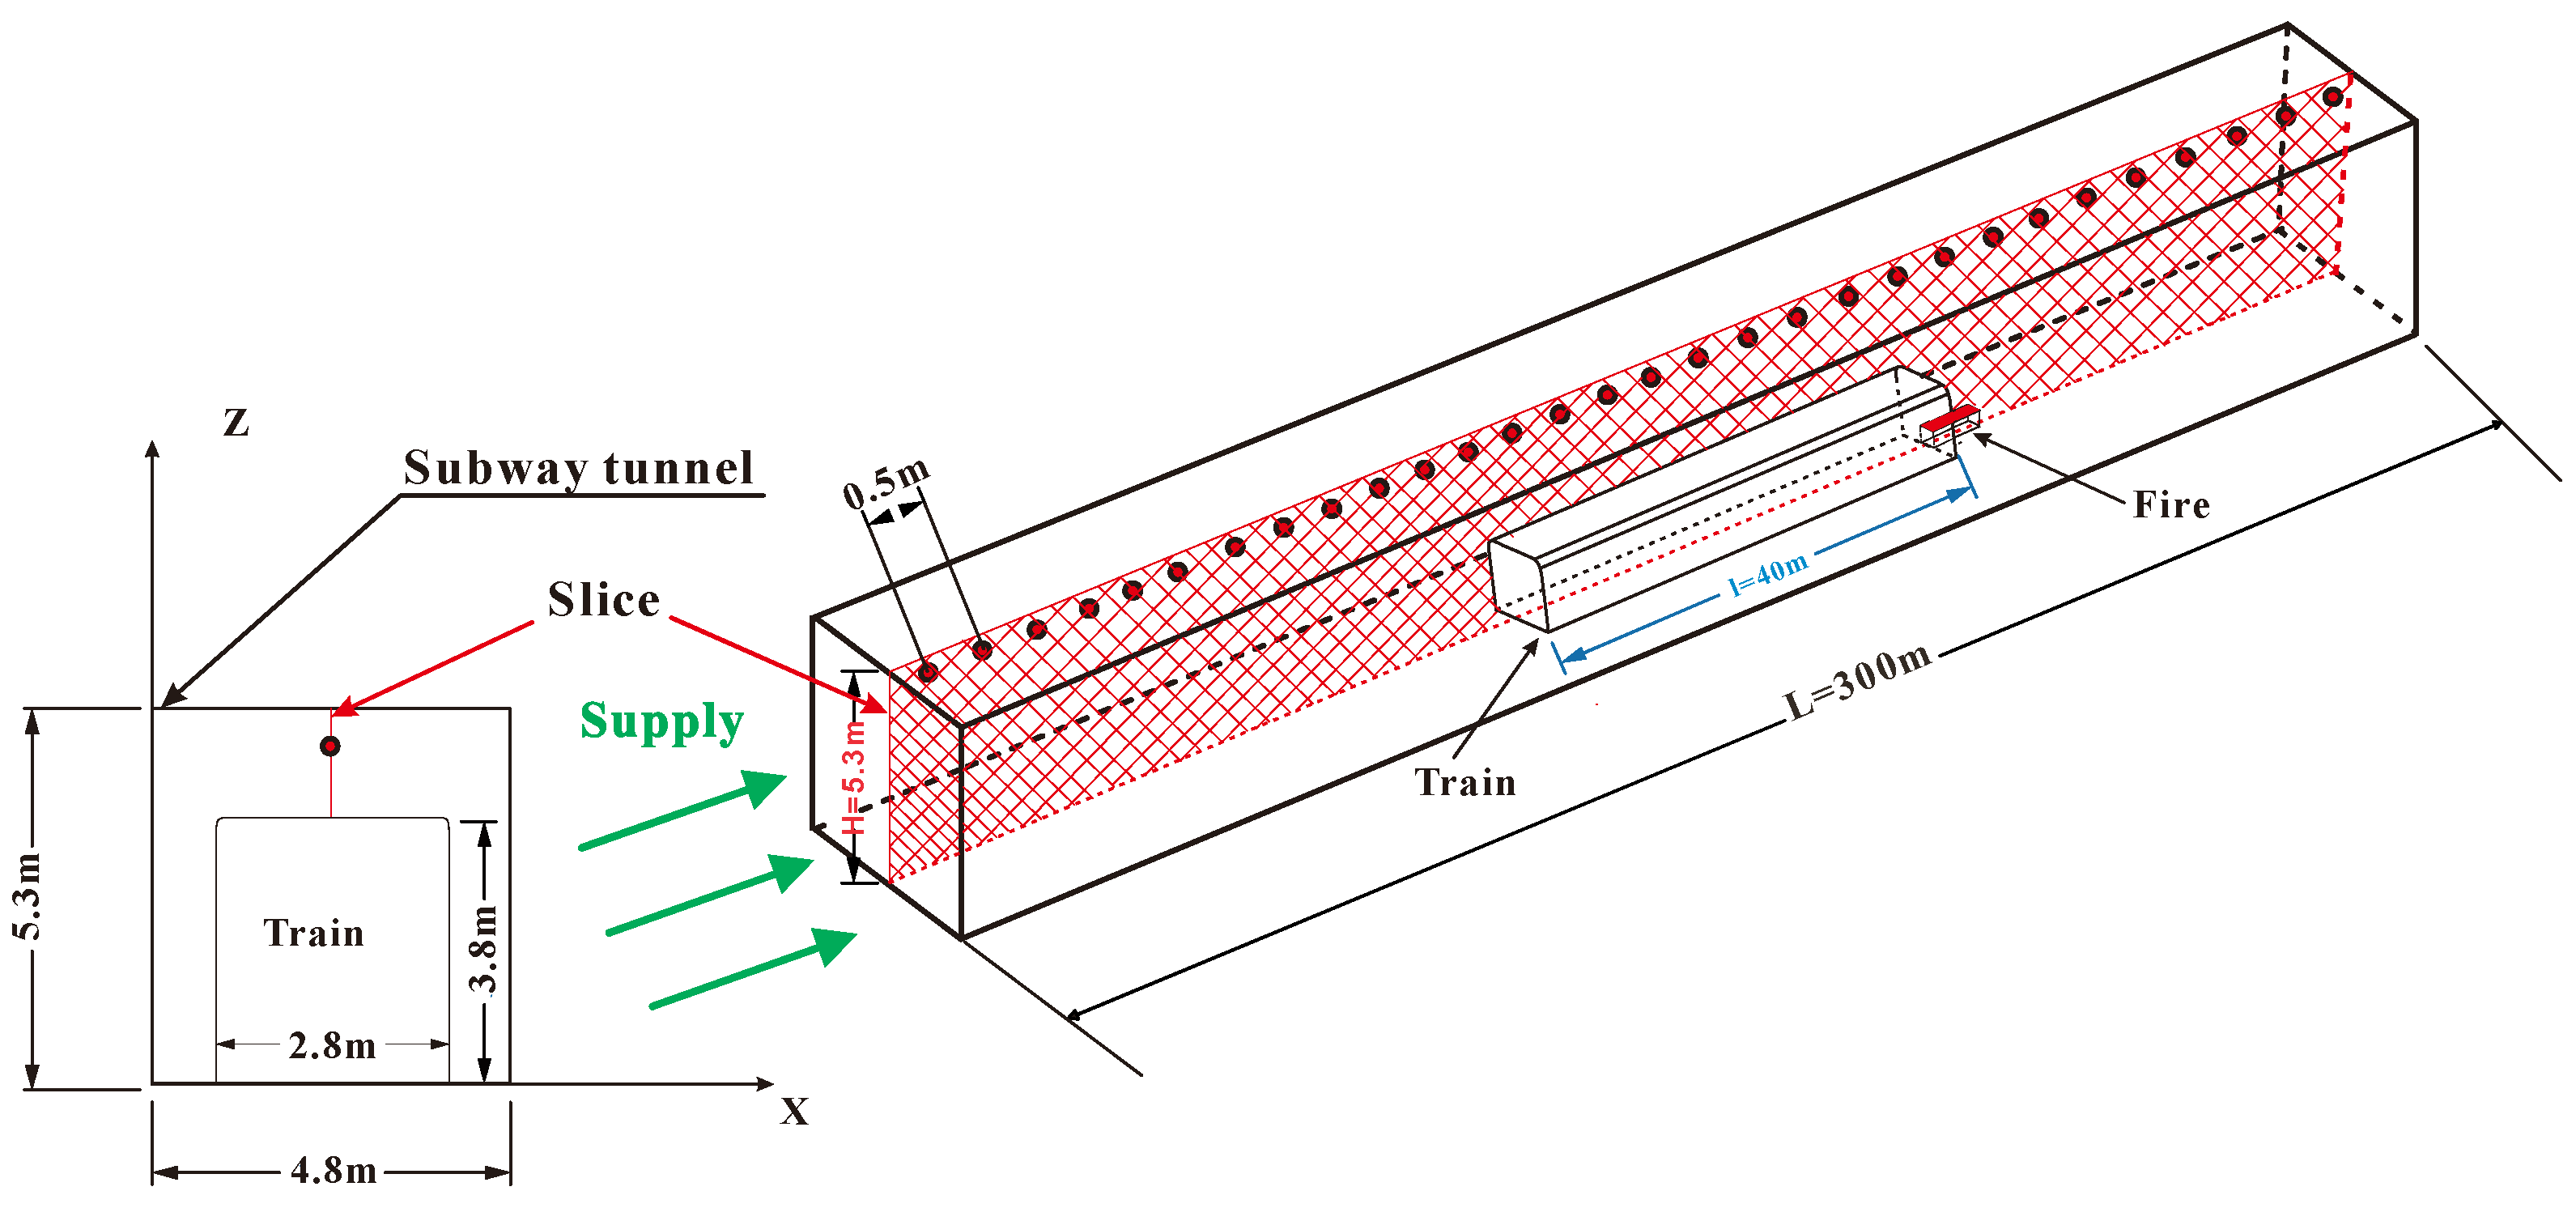
2.1. Numerical Model and Boundary Conditions

The fire dynamics simulator (FDS) has been extensively utilized to study fire and smoke control [5]. In this study, a subway tunnel with dimensions of 4.8 m (width) × 5.3 m (height) × 300 m (length) was built with the FDS to investigate the metro train blockage effects on critical velocity, as shown in Figure 1. One metro train with dimensions of 40 m (length) × 2.8 m (width) × 3.8 m (height) was located 140 m away from the horizontal tunnel entrance. In the model, the bottom point of the tunnel entrance section center-line was the coordinate origin. The blockage length has been found to have little effect on the critical velocity in a longitudinal ventilated tunnel fire [26]. One opening portal of the subway tunnel was used to generate a constant velocity in the metro tunnel. The other portal of the metro tunnel was connected with the ambient environment. The ambient air temperature outside of the tunnel was set as 293.15 K.
A fire source with dimensions of 1 m (length) × 1 m (width) × 0.2 m (height) was set on the ground along the centerline of the metro tunnel. The burning area of the fire source was 1 m2. The surface of the fire was modeled as a burner type, and the fire growth followed a typical α t 2 rule. The heat release rate (HRR) of the fire was set as 5 MW, which is one of the most popular heat release rates in subway tunnel fire studies [5]. The walls, ceiling, and ground of the subway tunnel model were made of 0.3 m thick concrete [27,28,29]. The thermal properties of material CONCRETE in the FDS are specified by the MATL command. The density of the concrete was 2280 kg/m3. The specific heat of the concrete was set as 1.04 kJ/(kg K ). The thermal conductivity coefficient of the concrete was set as 1.8 W/(m K ). The building structure of the tunnel is supposed to be thermally thick and the default one dimensional heat conduction for the solid was adopted [30,31]. The default wall roughness function as well as the velocity condition at the wall surface provided by the FDS was assumed [31,32]. The outside surface of the tunnel walls, ceiling, and ground was assumed to be an adiabatic surface in the FDS [30,33]. The inside surface of the tunnel walls, ceiling, and ground transfer heat with the smoke gas air by using Equations (1)–(3) in the FDS. The heat transfer equation between the smoke gas air and the concrete is based on a combination of natural and forced convection correlations [34]:
q c = h ( T g a s T w )
h = max [ C | T g a s T w | 1 3 , k L N u ]
N u = C 1 + C 2 Re n Pr m
where q c is the heat transfer between the smoke gas air and the concrete (W/m2); h is the convective heat transfer coefficient (W/(m2·K)); T g a s is the temperature of smoke gas air (K); T w is the temperature of the concrete (K); C is an empirical coefficient. In this study, C = 1.31 [34]. k is the thermal conductivity of the gas (W/(m·K)). L is a characteristic length. In this study, L = 1 [34]. N u is the Nusselt number. Re is Reynolds number. Pr is the Prandtl number. In this study, Pr = 0.7 [34]. C 1 , C 2 , n , and m are default constants. In this study, C 1 = 0. C 2 = 0.037; n = 0.8. m = 0.33 [34].
Appropriate mesh sizes are important to ensure the accuracy of prediction results of the FDS [34,35]. The FDS user’s guide suggests determining the mesh size ( δ x ) according to the characteristic fire diameter of the fire source ( D * ) for simulation simplying buoyant plumes [34].
D * = ( Q ρ 0 c p T 0 g ) 2 5
where D * is the characteristic fire diameter of fire source (m); Q is the heat-release rate (kW); δ x is the mesh size (m); g is the gravitational acceleration (m/s2); c p is the thermal capacity of air (kJ/kg K); ρ 0 is the density of ambient air (kg/m3).
The value of δ x is suggested to be 0.1 D * for guaranteeing a reliable operation of the FDS [34,36,37]. Six mesh sizes, 0.143 m, 0.167 m, 0.2 m, 0.25 m, 0.333 m, and 0.483 m, were chosen to conduct simulation cases for examining the mesh independence. Figure 2 displays the predicted temperatures in the vertical direction 10 m downstream from the 5 MW fire source. The predicted temperatures are stable when the mesh size is smaller than 0.2 m. The mesh size of 0.167 m was selected in this paper for numerical investigations. Structured mesh, a large-eddy simulation using a Smagorinsky subgrid-scale turbulence model [31,38], and transient simulation were adopted in this study to numerically investigate the impacts of a metro train blockage on the critical velocity in sloping subway tunnel fires. The number of computational cells was about 1,885,800. A large-eddy simulation is performed by filtering the control equations by choosing a filter width between the large-scale structure and the small-scale structure of the flow field, which in turn divides all variables into large-scale and small-scale quantities. Large-scale quantities are directly simulated to obtain their true structural state, while small-scale quantities are simulated using a subgrid model. Although a large-eddy simulation uses a sub-grid model for the small-scale structures, it is reasonable to use a uniform sub-grid model for the small-scale structures in the flow field because of the isotropic nature of the small-scale structures, while the large-eddy simulation results are more accurate when the appropriate subgrid model is used, and the simulation results are physically realistic for the transient flow field. In FDS software, the time step is dynamically calculated and adjusted at each time step to ensure that the Courant–Friedrichs–Lewy (CFL) condition is satisfied [31,34]. The initial time step is determined according to the mesh size and the characteristic velocity of the flow [34,39]. The default value of the time step is [34]:
5 ( δ x δ y δ z ) 1 3 g H
where, δ x , δ y , and δ z are the minimum mesh size, respectively; H is the height of computational domain.

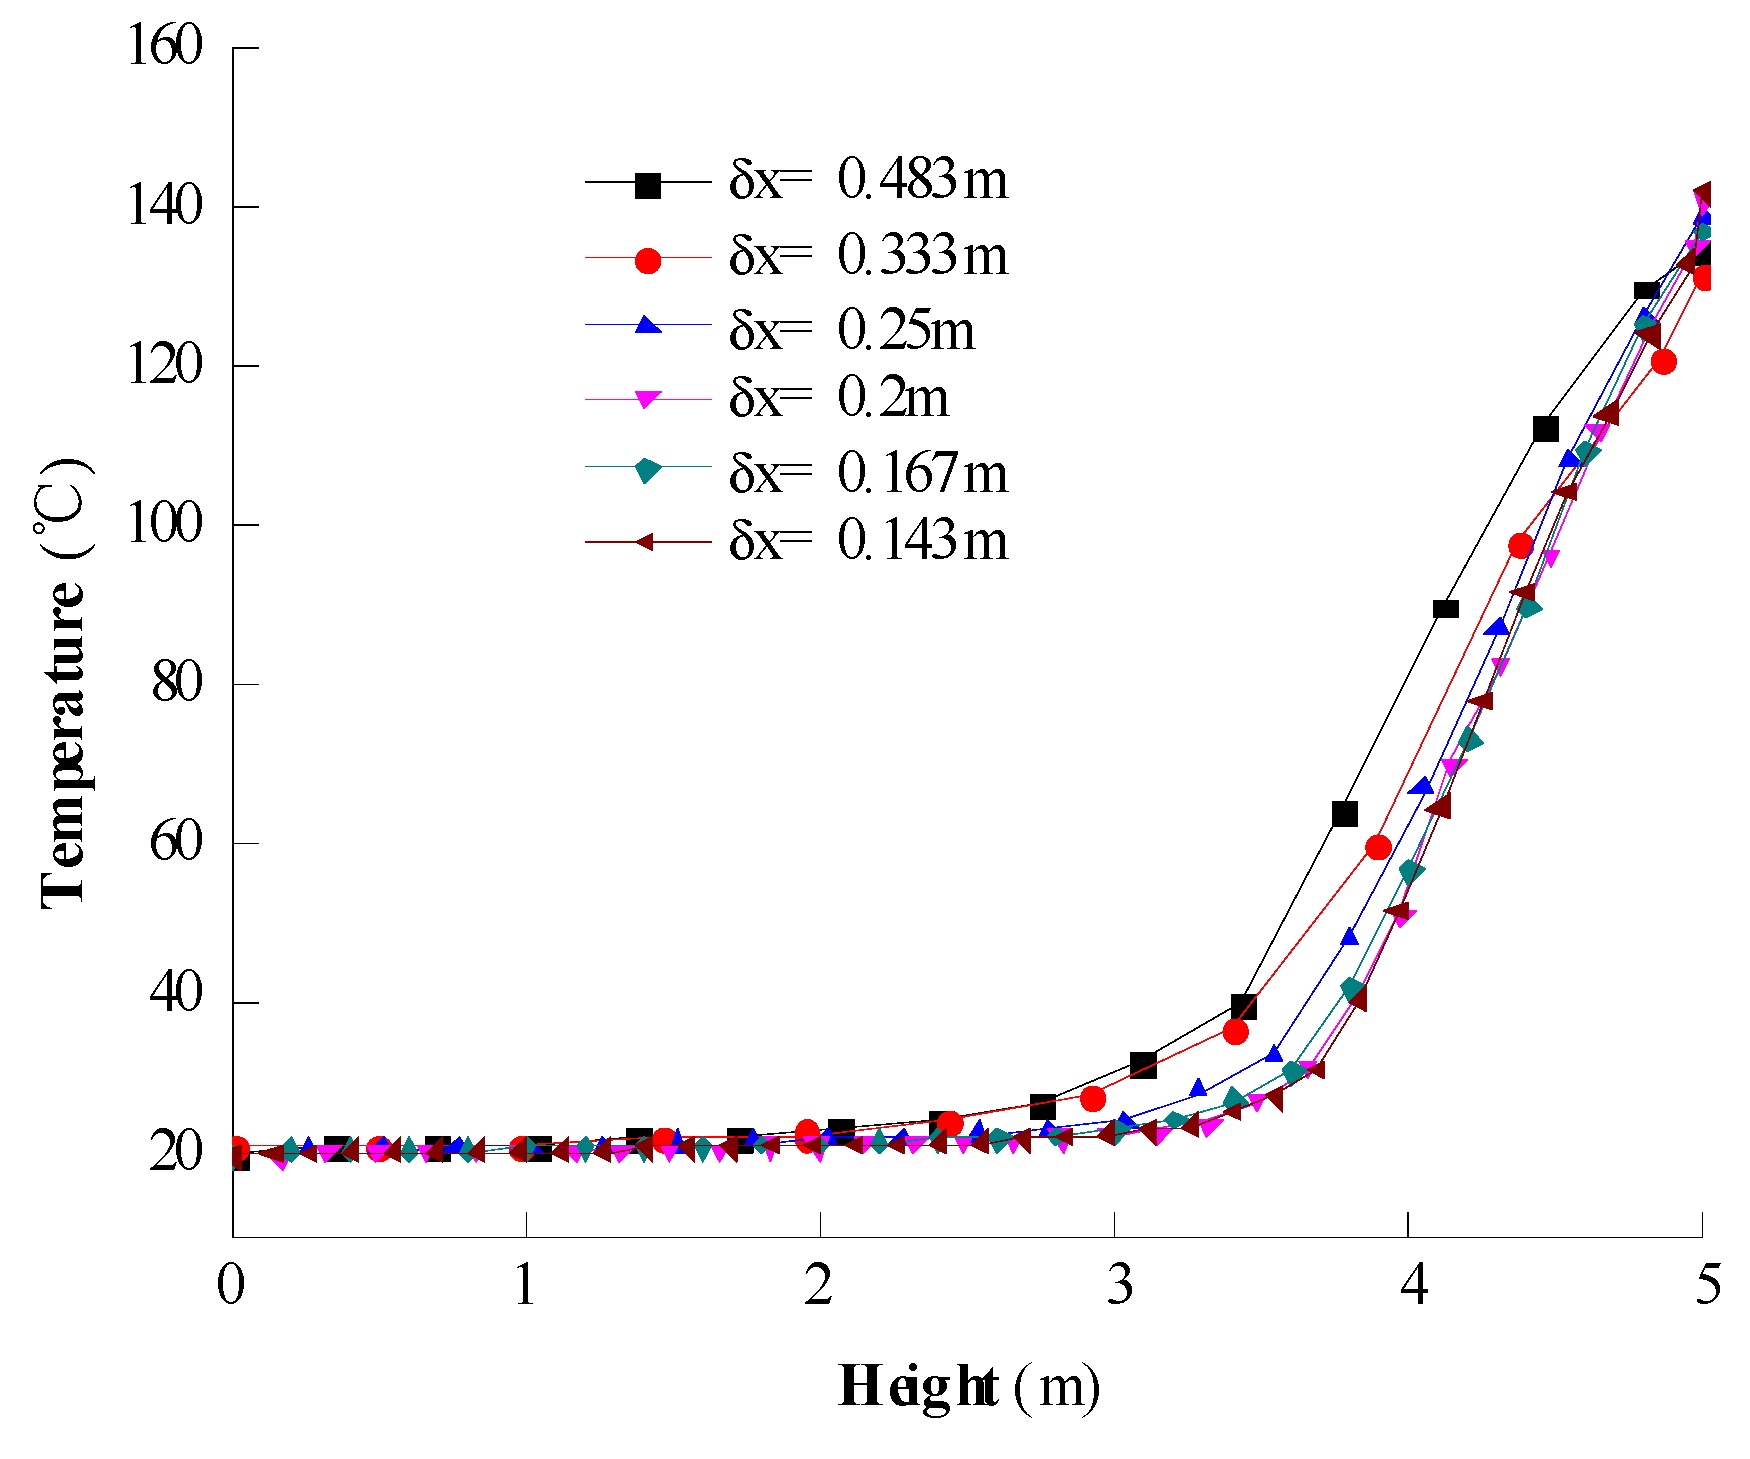
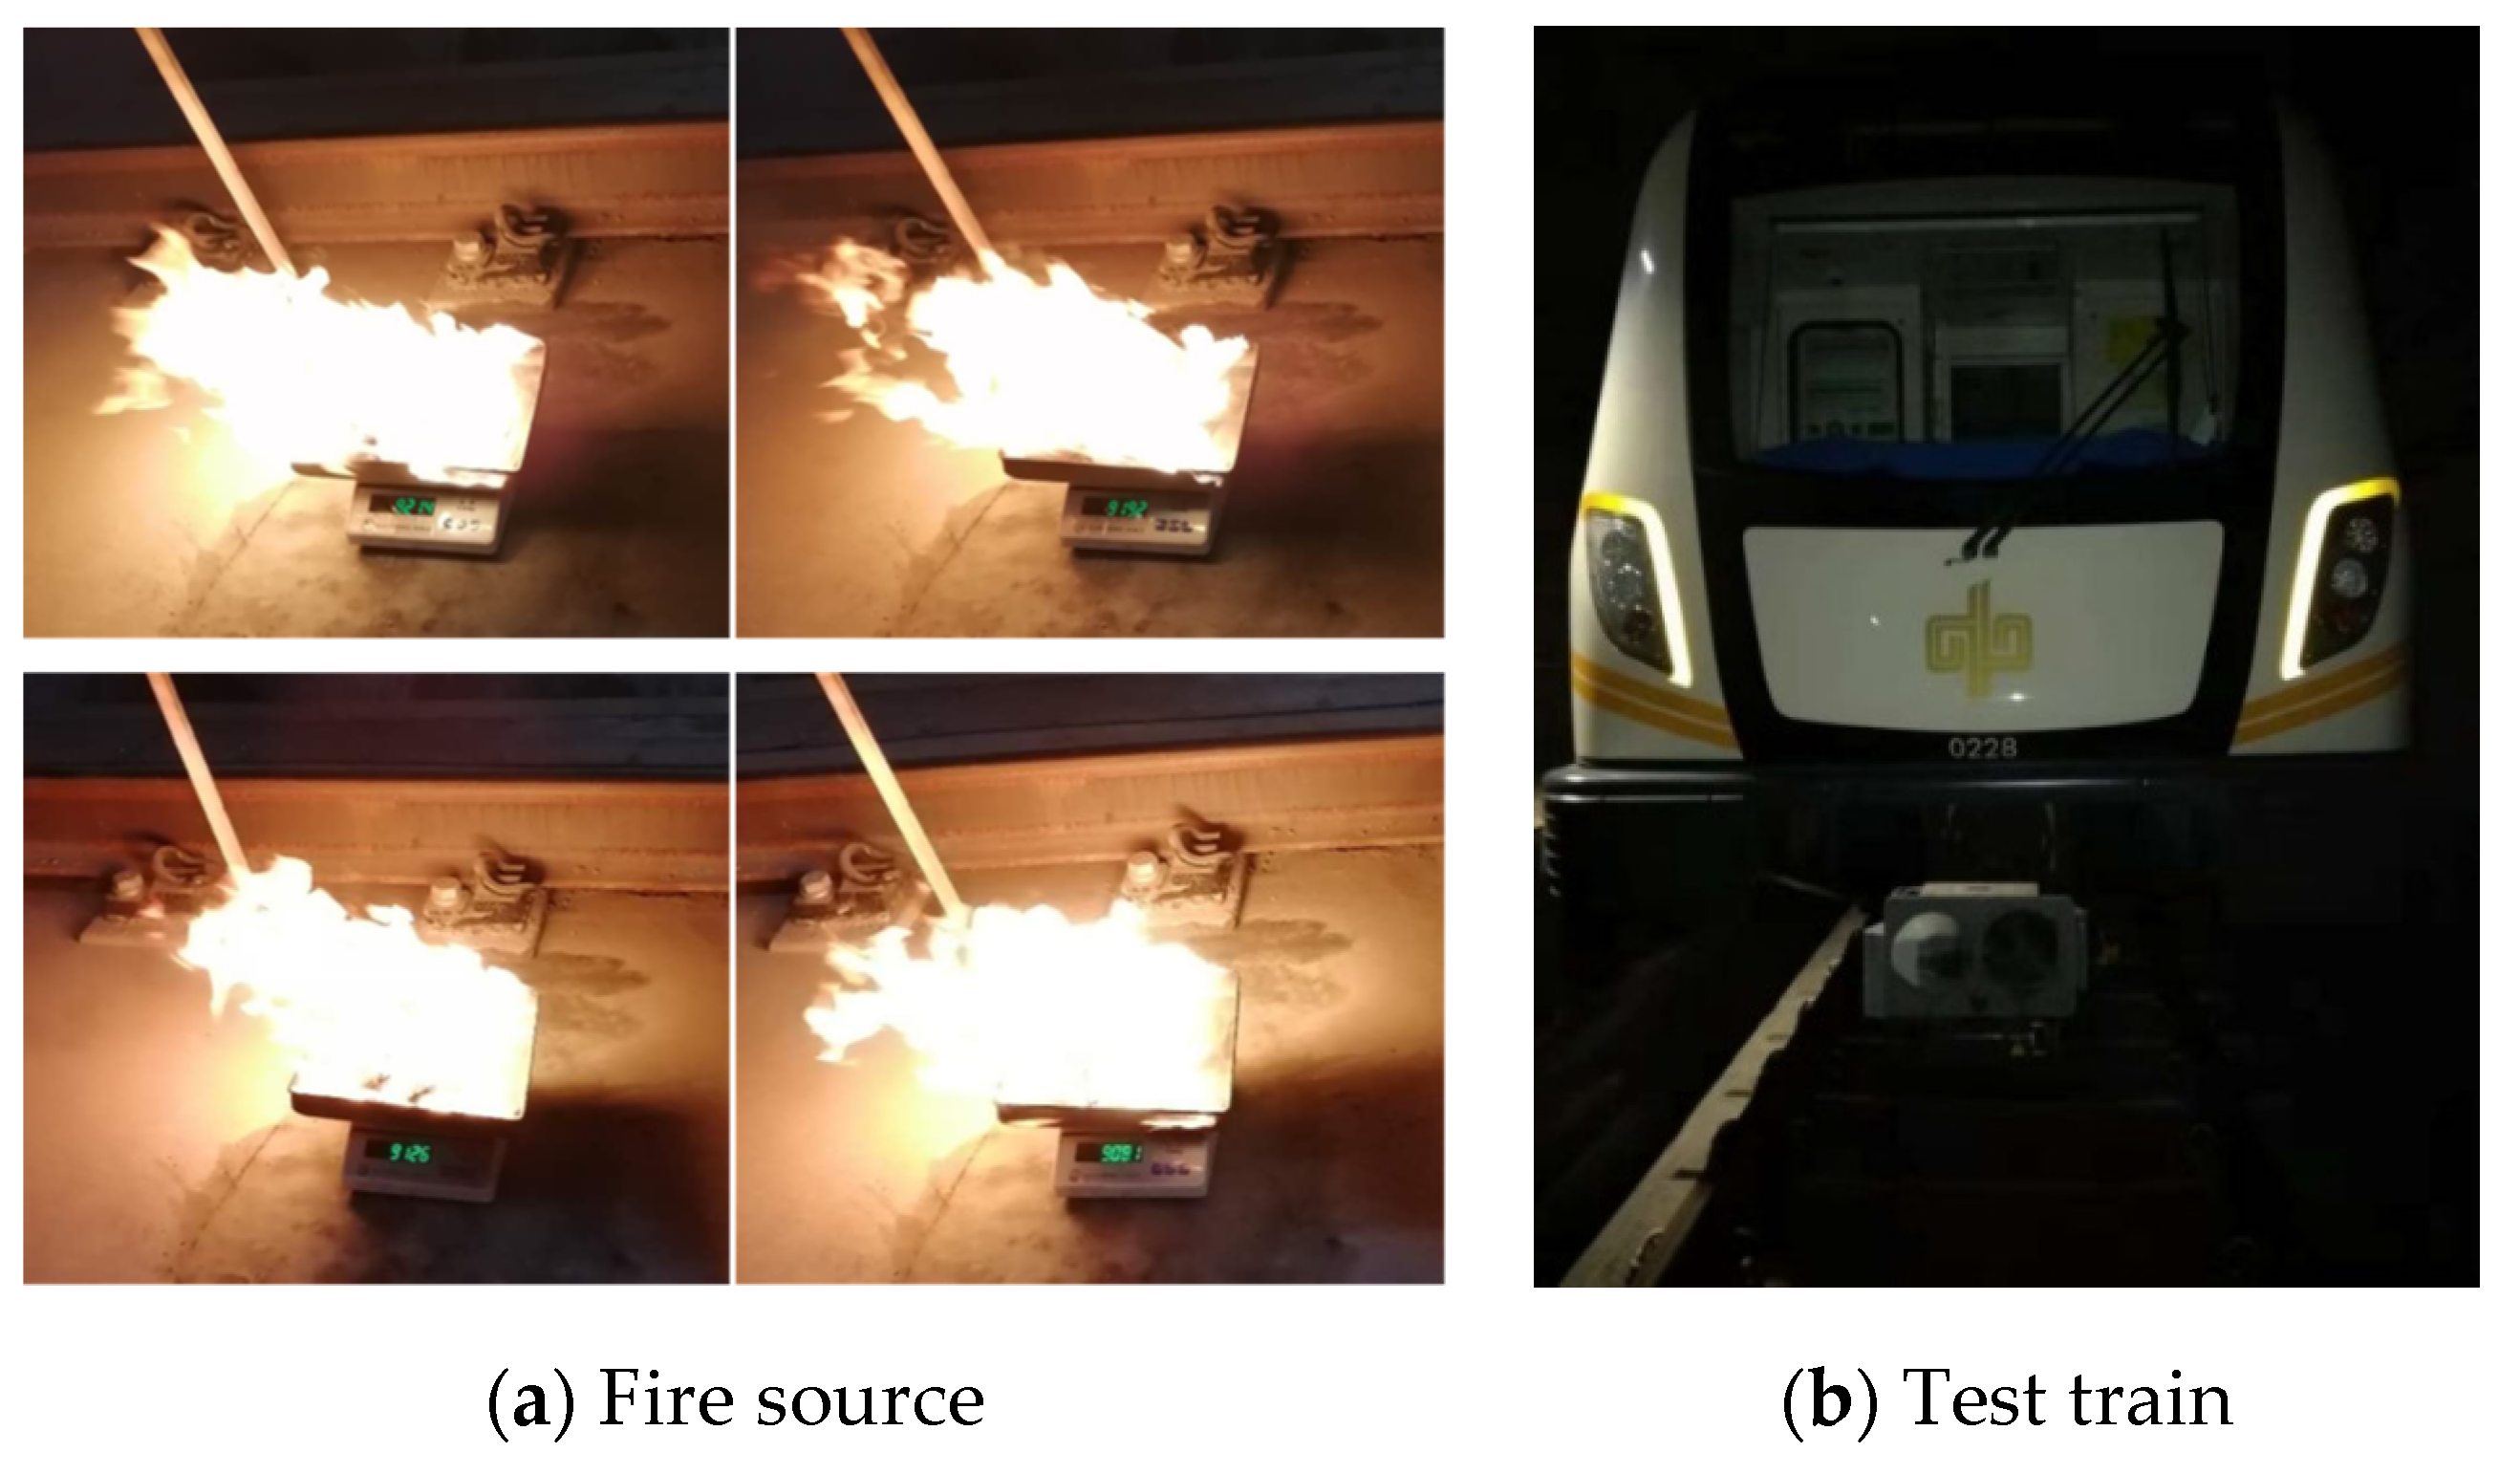
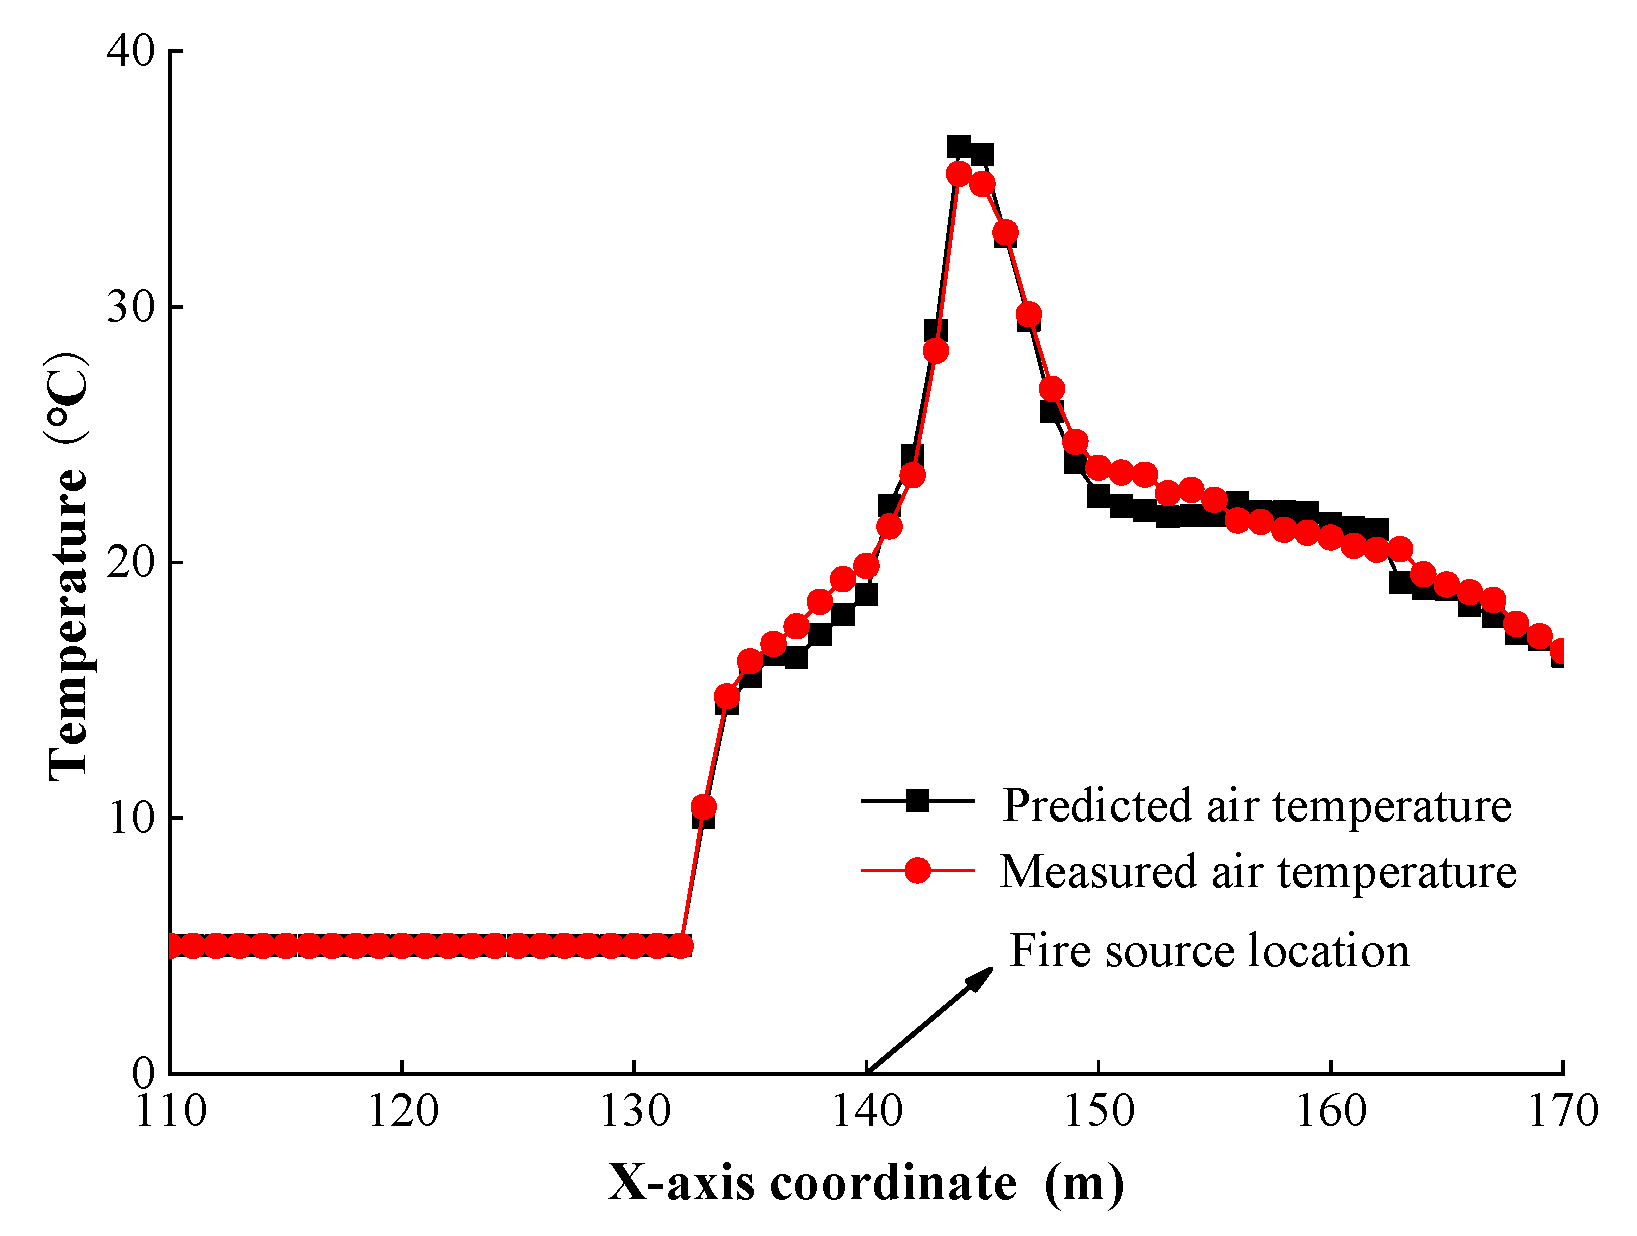
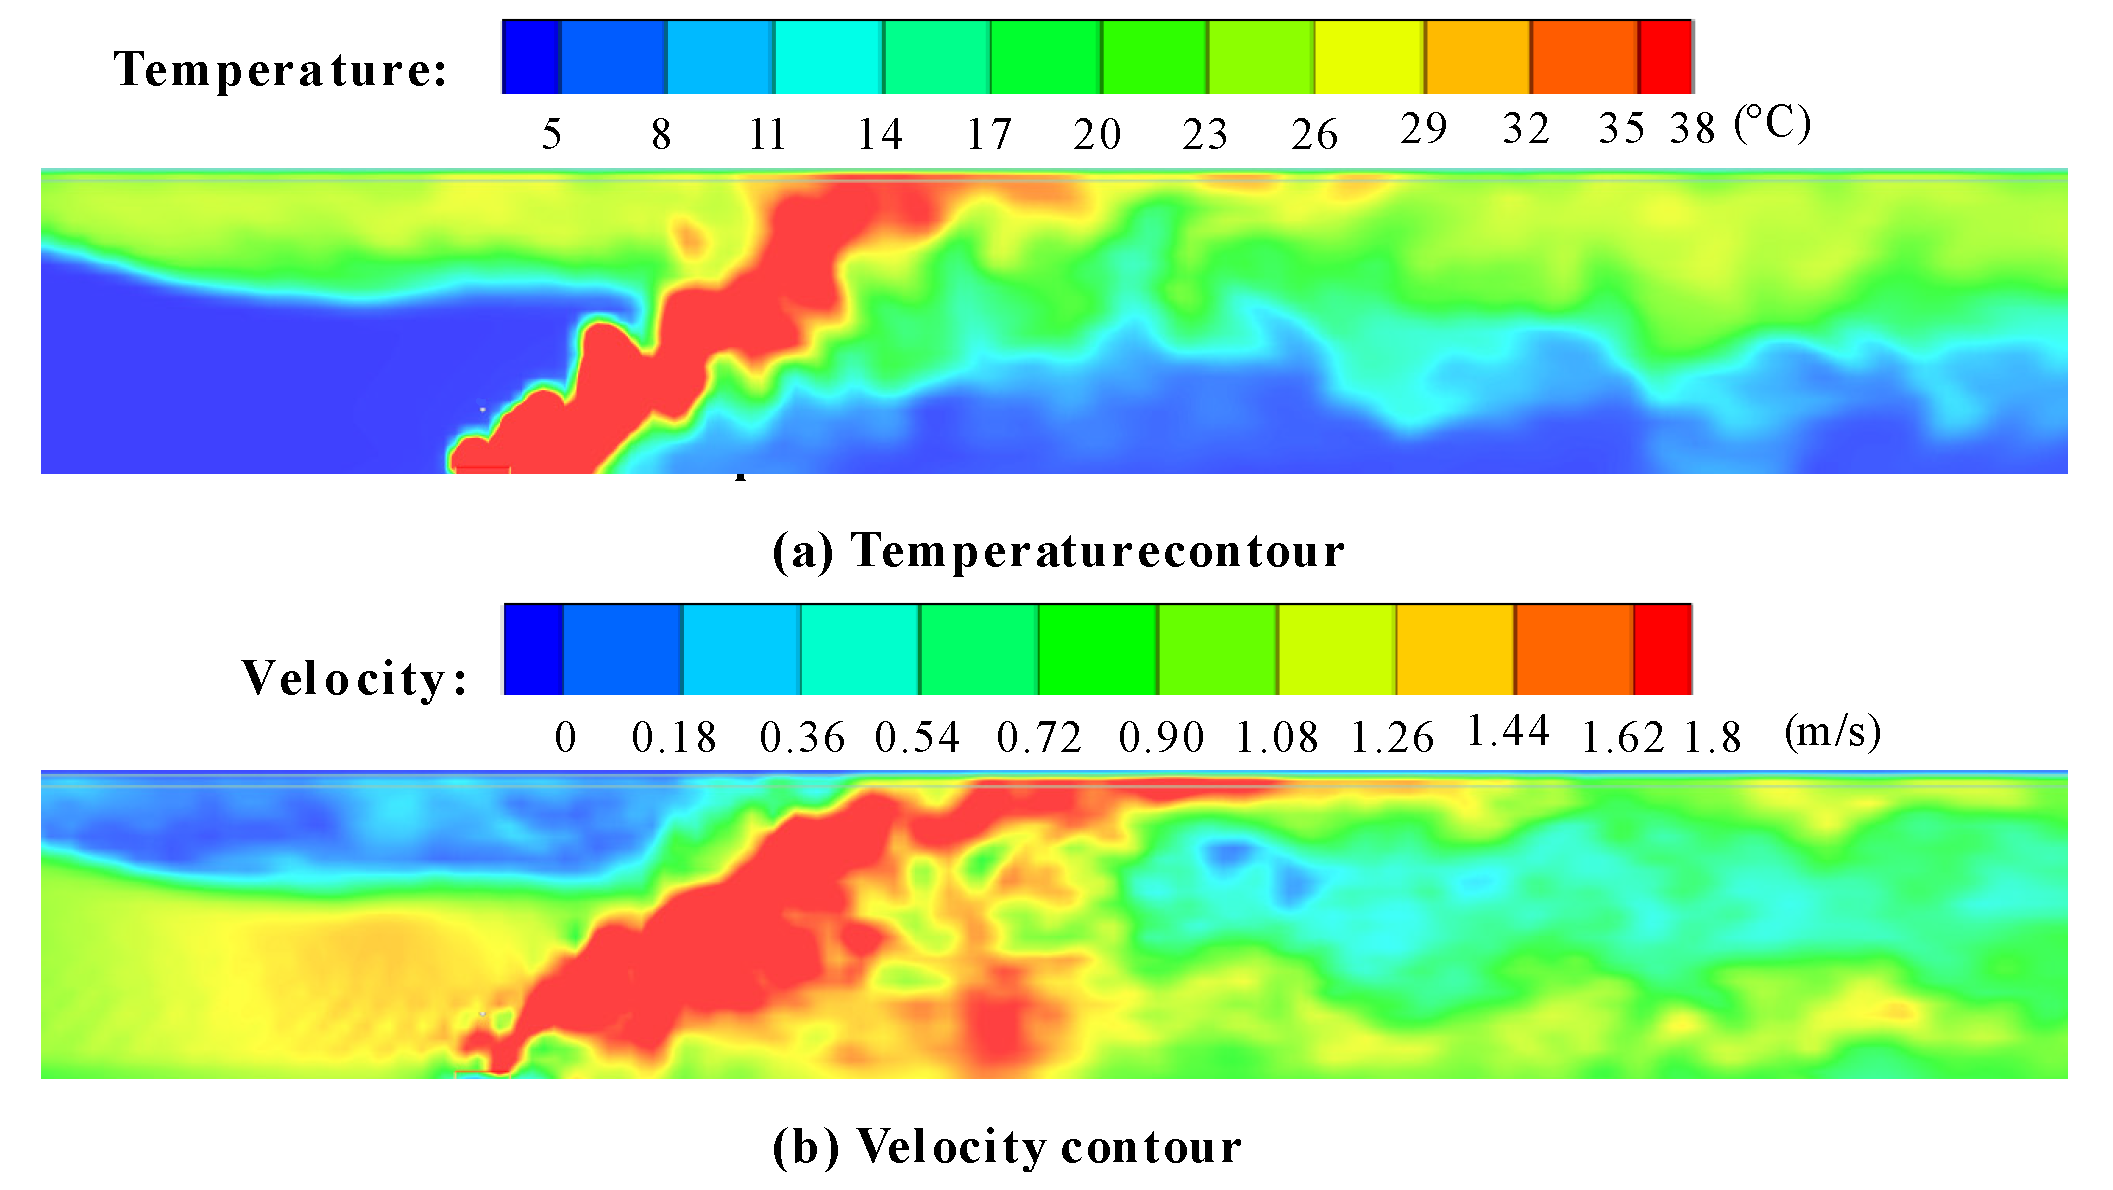
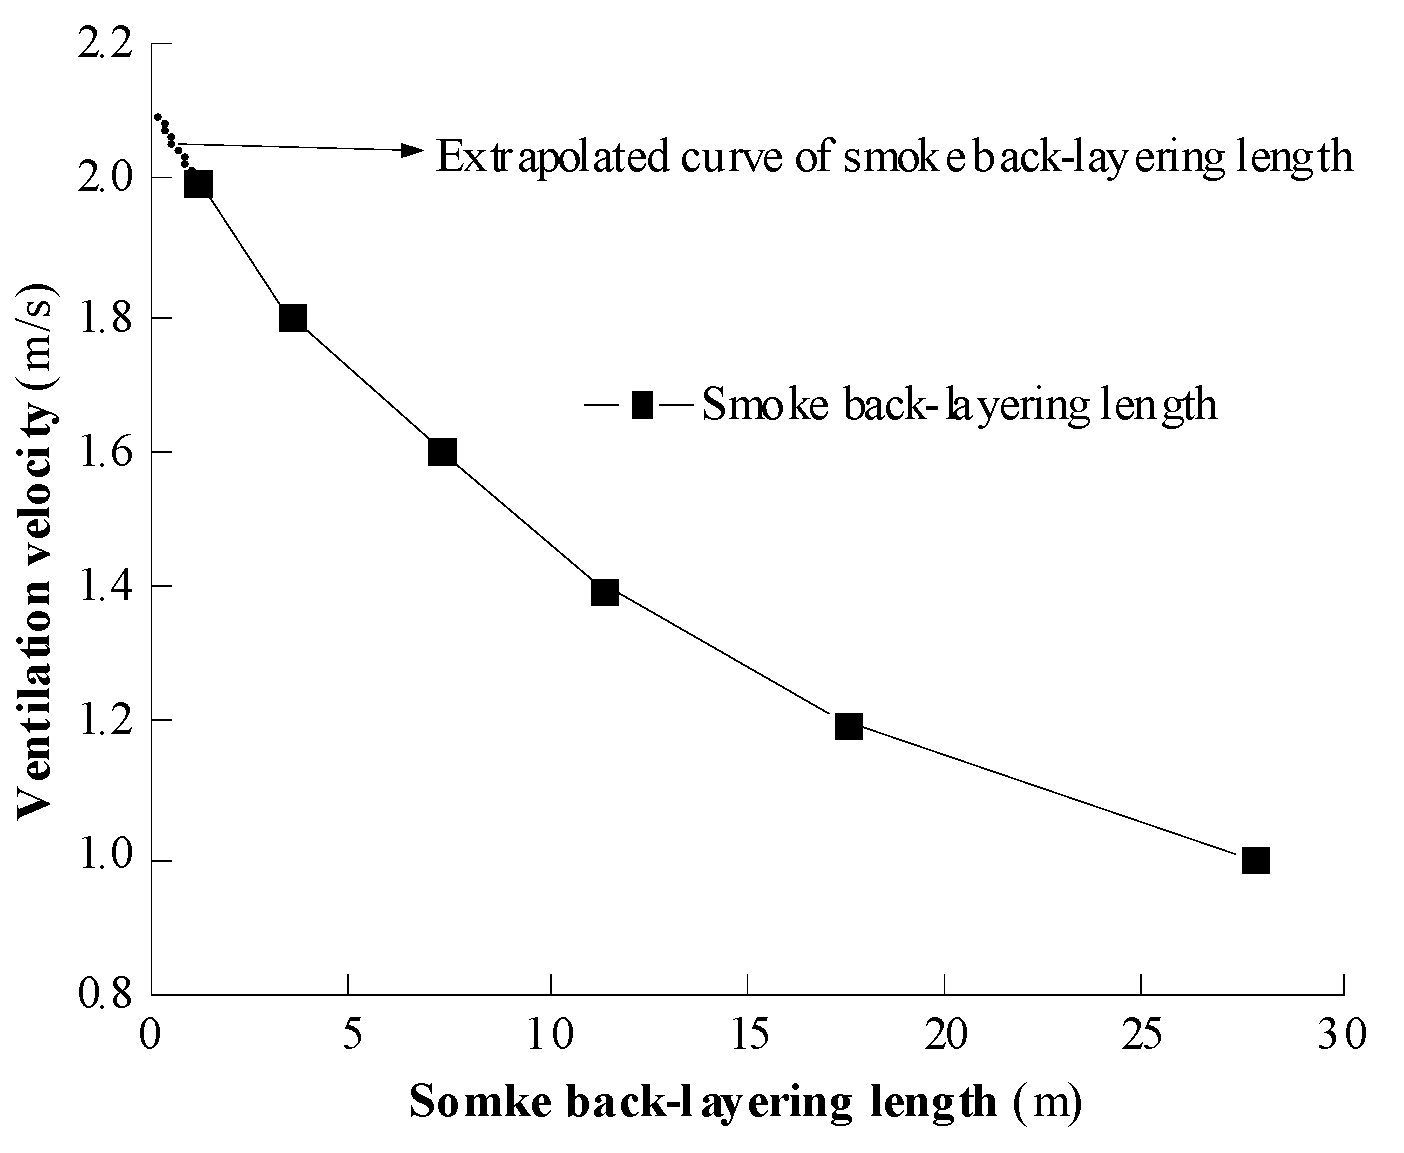
2.2. Model Validation

In order to improve the prediction accuracy of the subway tunnel model, fire validation experiments were conducted in a real subway tunnel. Because bigger heat-release rates of the fire source would destroy tunnel equipment and facilities, fire tests with large heat-release rates are almost impossible in practice. A total of 61 temperature sensors were set 1 m above the floor along the centerline of a real subway tunnel, with the same dimensions as those of the subway tunnel model described in Section 2.1. The mesh size in the zone between 10 m upstream and 10 m downstream of the fire source was 0.04 m. The mesh size in the other zones was 0.16 m in the validation experiment fire. One temperature sensor was set above the fire source, at a 1 m vertical distance from the floor. The horizontal spacing between every two temperature sensors was 1 m. The fire source in the validation experiment was a pan filled with diesel oil. The standard composition of diesel was C12H23, and the combustion products of the fire were 0.1 for CO and 0.09 for soot [40]. The quality of the fire source was measured by using a high-precision electronic balance. In the validation experiment, the HRR of the fire source was calculated to be 352.5 kW by comparing the quality of the fire source before and after combustion. The fire source and the test train in the validation experiment are shown in Figure 3.
The air velocity in the subway tunnel was measured to be 0.65 m/s during the validation experiment period. Figure 4 compares the experimental air temperature with FDS predictions of the smoke gas temperature 1 m above the floor under validation experiment condition. The temperature error between the predicted and measured air temperature values is less than 1.2 °C, and the maximum relative error is 5.5%. The temperature contour and the velocity contour near the fire source in the fire simulation of validation experiment are shown in Figure 5. The fire plume of the fire source and the hot smoke gas was compressed by the upstream incoming airflow to the downstream side of the fire source. The gas temperature on the downstream side of the fire source was higher than that at a 1 m vertical distance from the fire source.

3. Results and Discussions

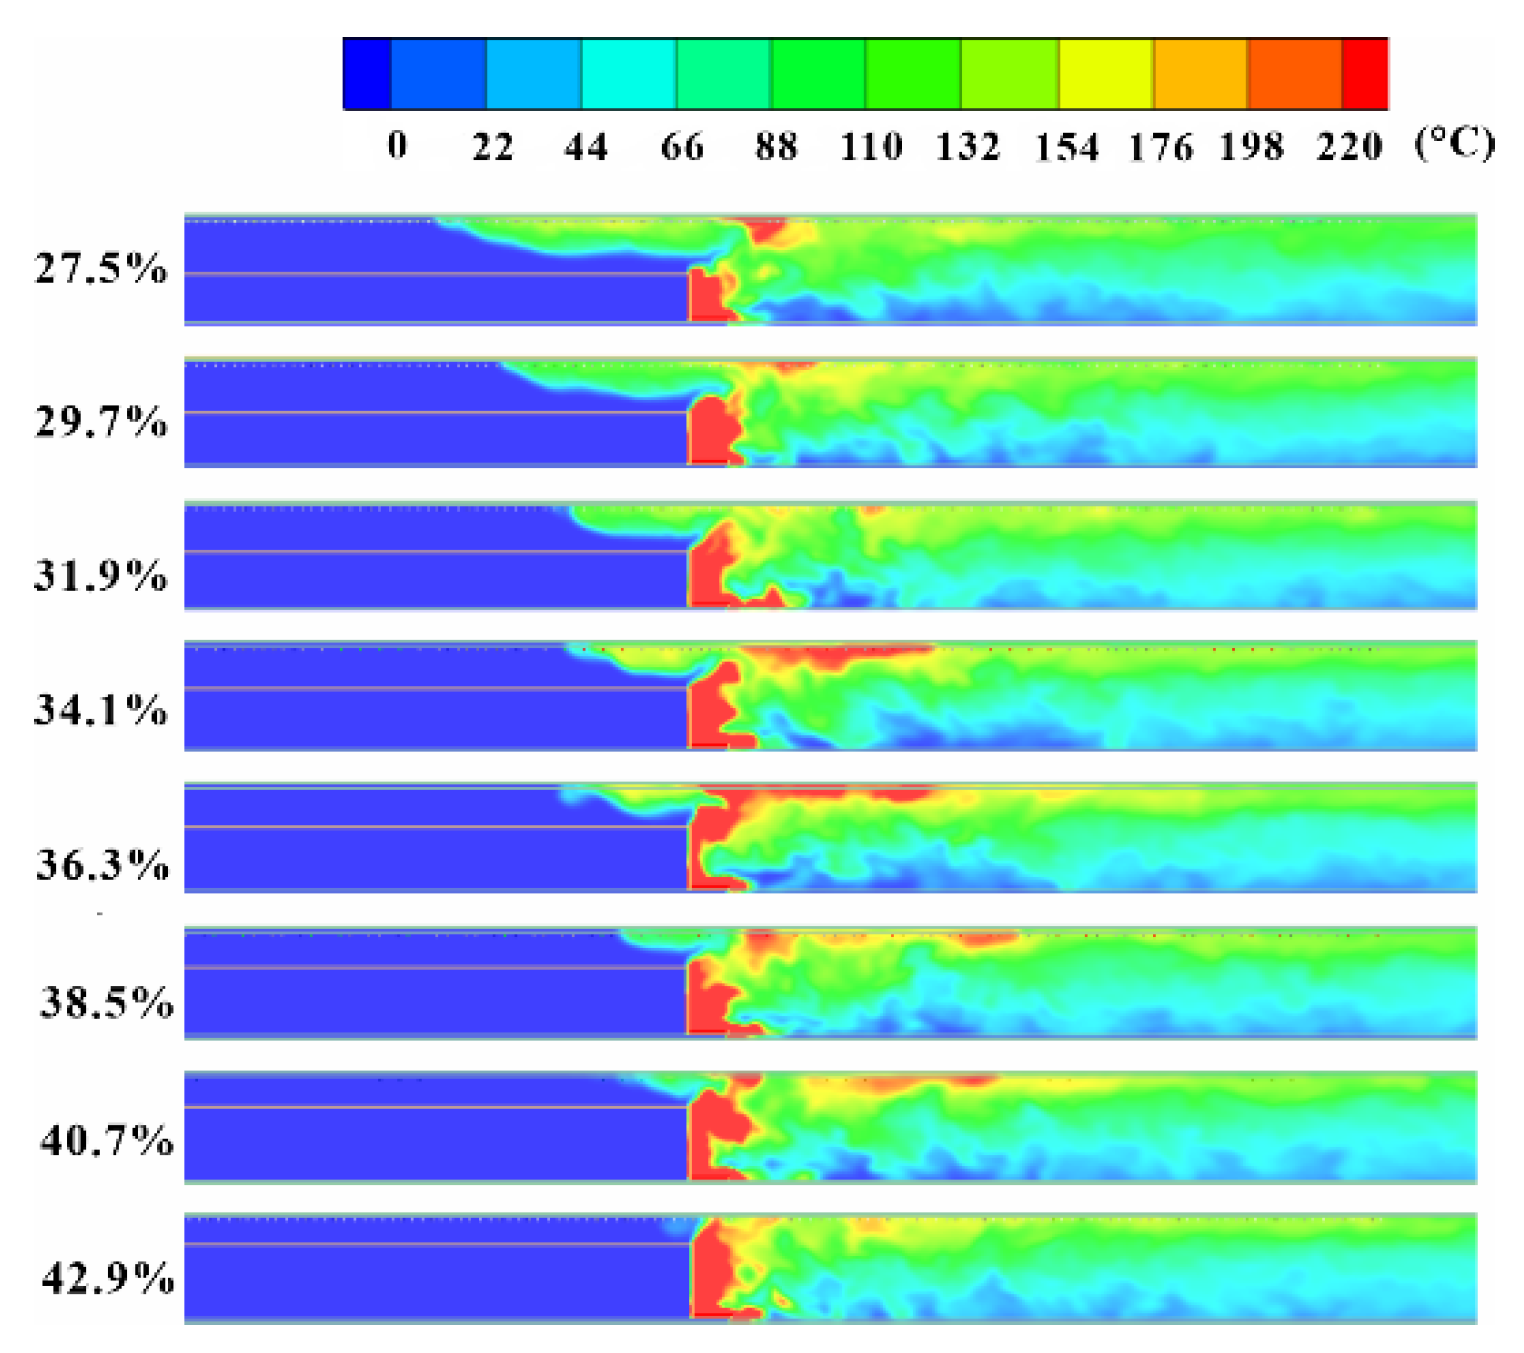
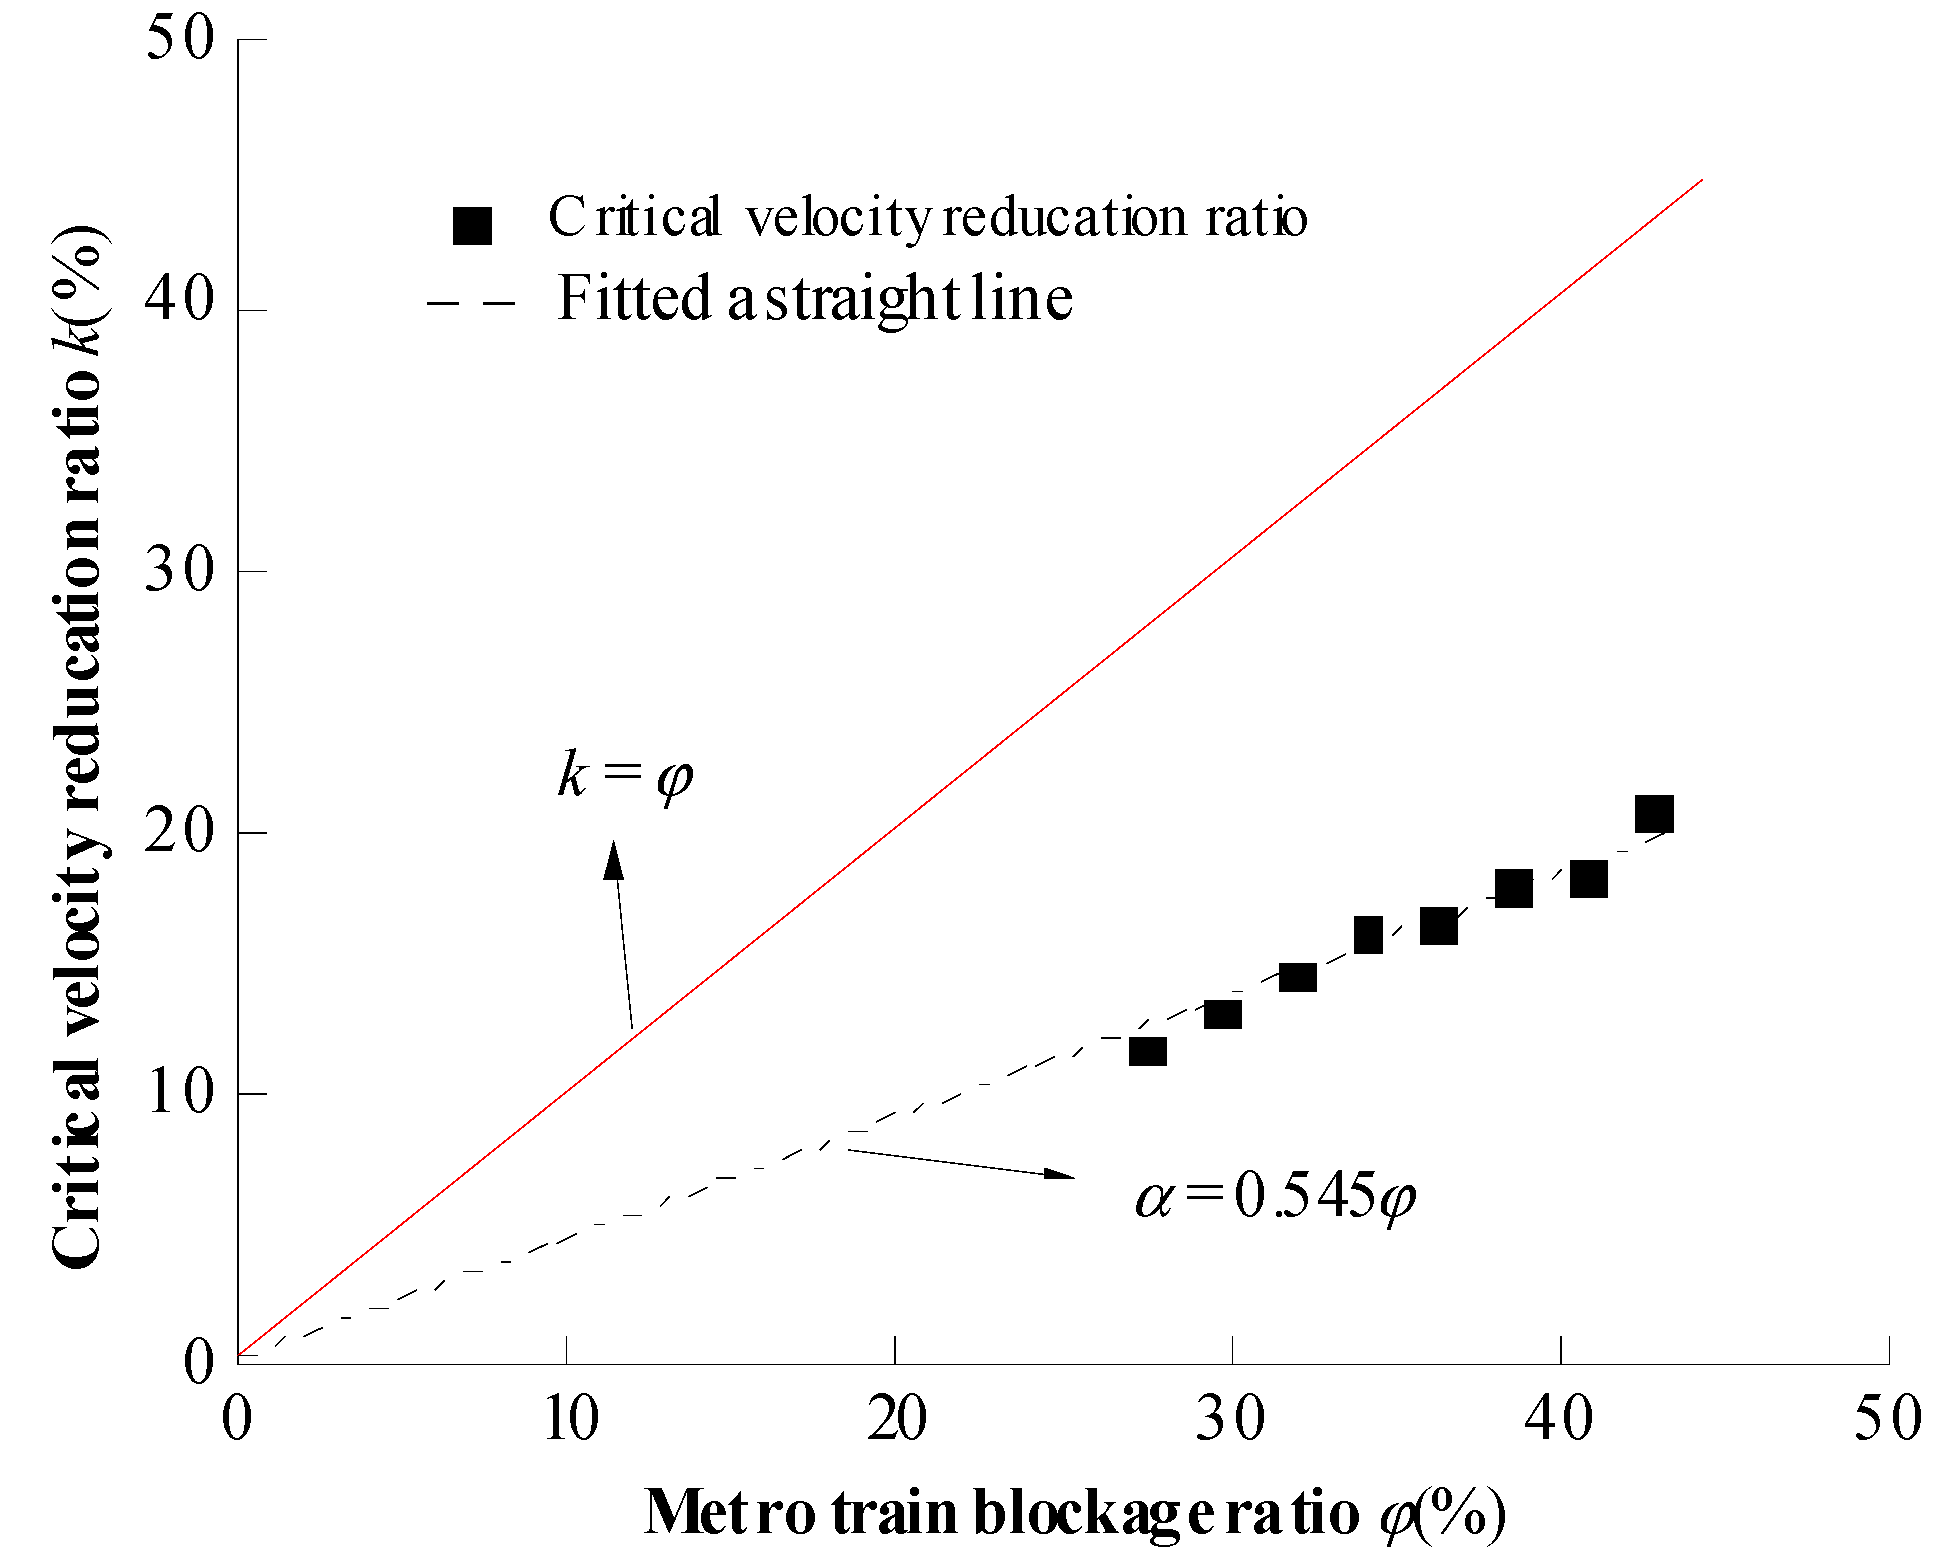
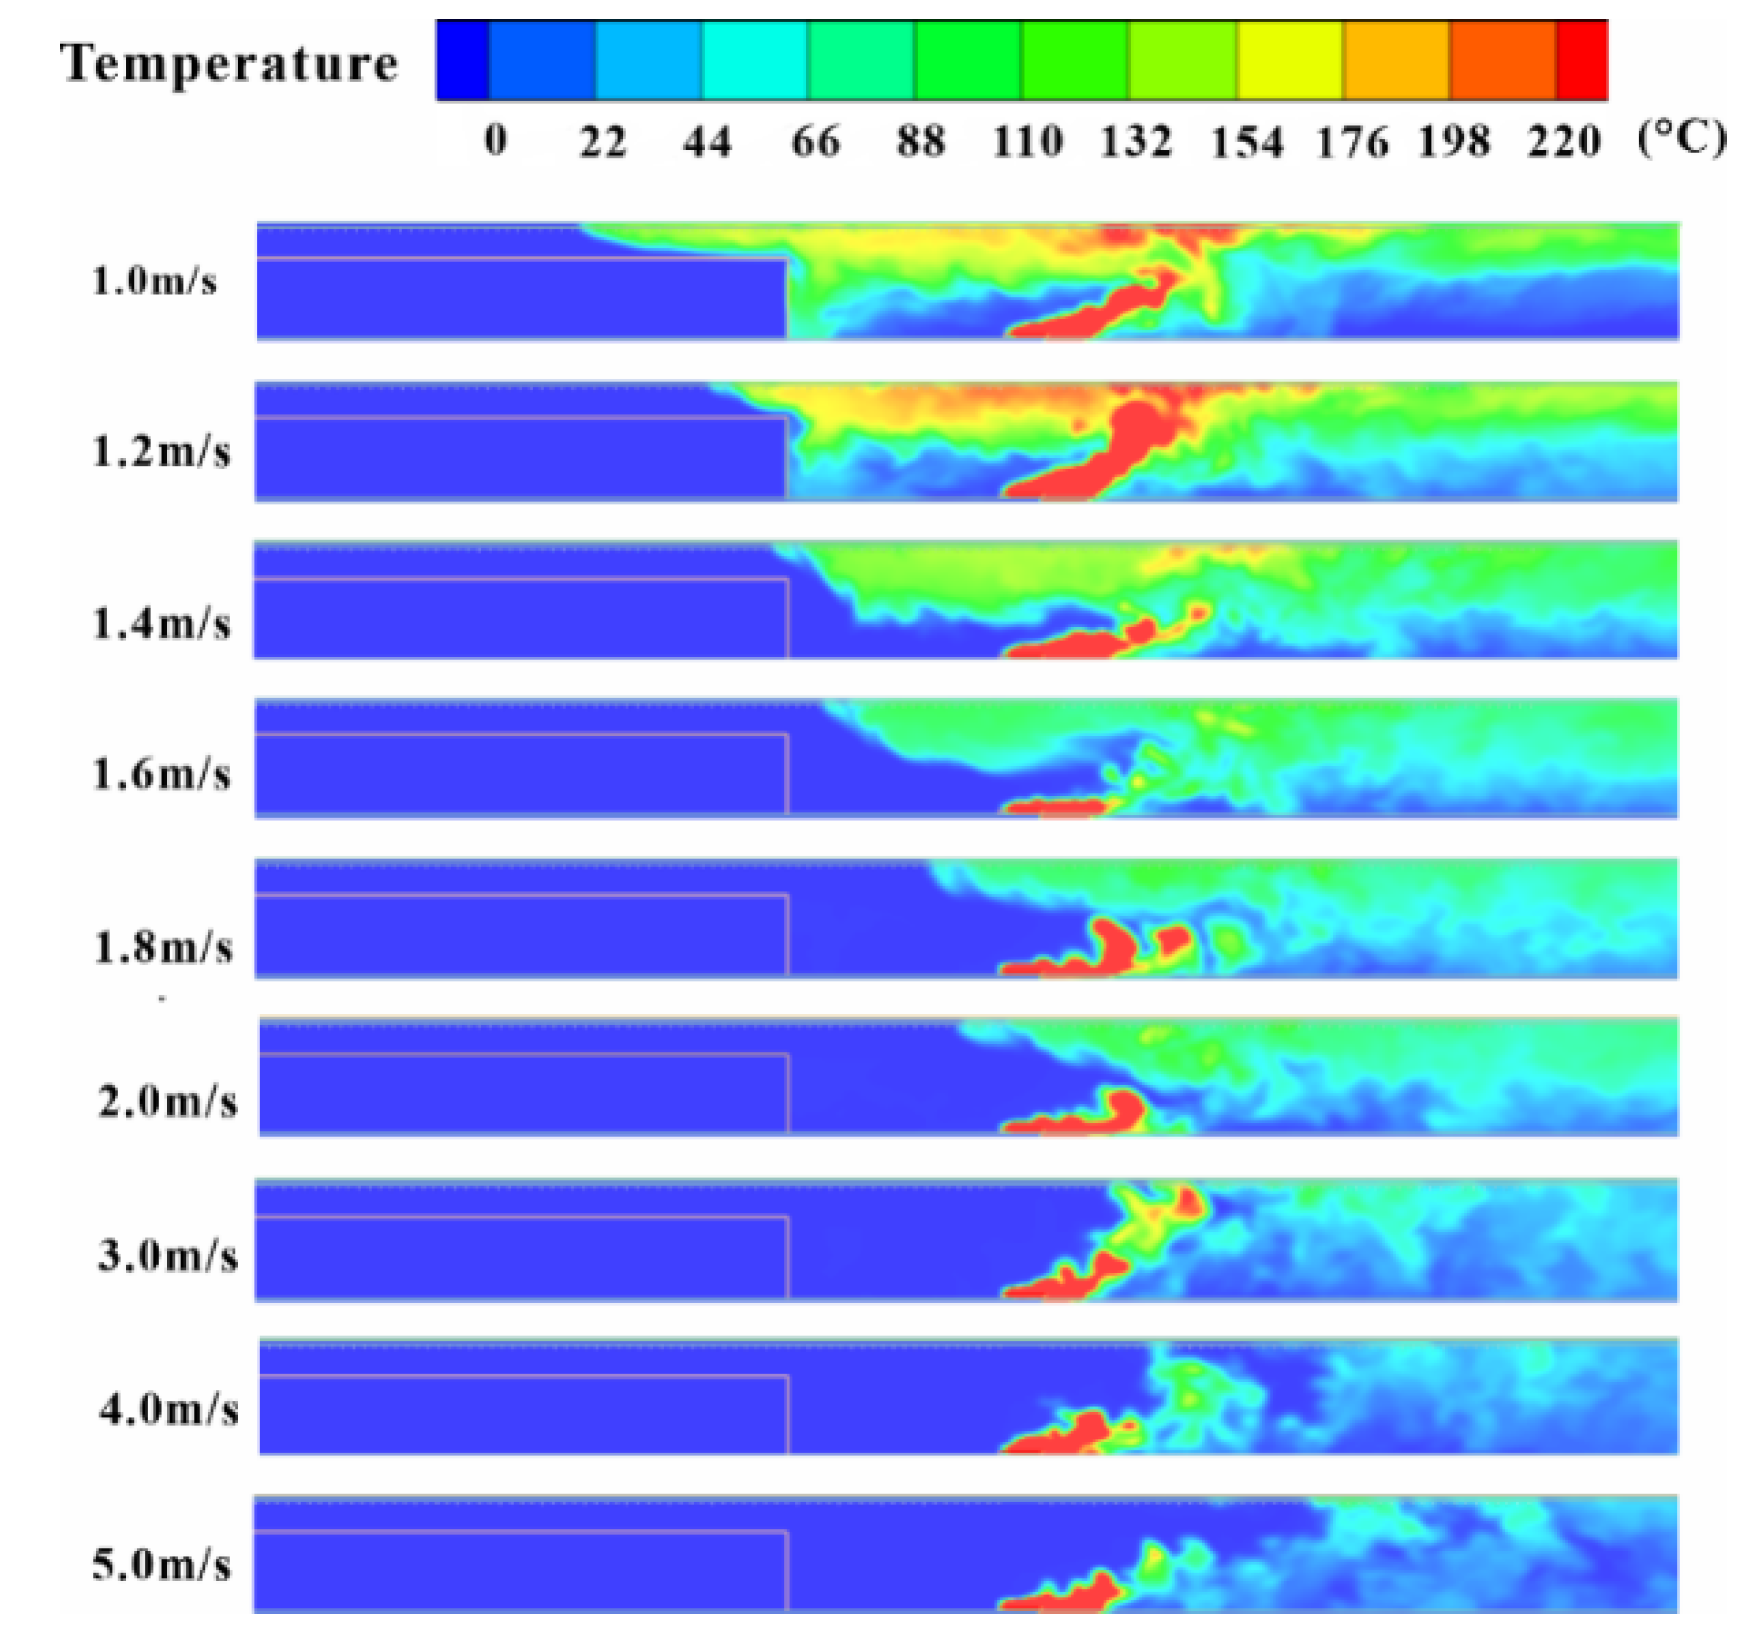
3.1. Critical Velocity in the Blocked Zone of a Metro Train in Subway Tunnel Fires

The FDS subway tunnel model validated with the field experiment data is used to investigate the relationship between the critical velocity and blockage ratio under the boundary conditions described in Section 2.1. A 5 MW fire source was set on the ground along the centerline of the subway tunnel with a 0 m blockage–fire source distance. Different blockage ratios were obtained by changing the height of the train blockage. The heights of the train blockage were set as 2.5 m, 2.7 m, 2.9 m, 3.1 m, 3.3 m, 3.5 m, 3.7 m, and 3.9 m for blockage ratios of 27.5%, 29.7%, 31.9%, 34.1%, 36.3%, 38.5%, 40.7%, and 42.9%, respectively. The critical velocity in a tunnel fire can be determined by using the direct observation method and the extrapolating back-layering length-velocity curve method [22,41]. The observed smoke back-layering lengths decrease with a gradual increase in the longitudinal ventilation velocity in the direct observation method. The longitudinal ventilation velocity is the critical velocity when the smoke back-layering length becomes zero [21]. In the extrapolating back-layering length-velocity curve method, the curve is extended until the smoke back-layering length is equal to zero, and the corresponding longitudinal ventilation velocity is the critical velocity [22,41]. Figure 6 shows the schematic diagram of extrapolating back-layering length-velocity curve method. The critical velocity is determined in this study by comprehensively using the extrapolating back-layering length-velocity curve method and the direct observation method. The smoke back-layering lengths are obtained by testing the change in the longitudinal temperature of the smoke gas above the fire source in a subway tunnel. There exists a steep drop in the position of the hot smoke front above the fire source. The smoke back-layering length is the measured distance between the sharp smoke gas temperature drop and the fire source. Figure 7 presents the temperature contours of a subway tunnel fire for 1.3 m/s longitudinal ventilation velocity with different blockage ratios.
The blockage can impact the critical velocity by affecting the heat radiation from the fire source and the buoyancy-driven smoke-plume shape, apparently. The blockage will prevent some radiation heat from transferring to the hot smoke front. Therefore, the critical velocity with a metro train blockage cannot be determined simply according to the mass conservation of airflow based on the critical velocity without a blockage [42,43]. Figure 8 shows the relationship between the reduction ratio of critical velocity and the metro blockage ratio in this study. The reduction rate of critical velocity is less than the metro blockage ratio. Jiang et al. [22] and Lee and Tsai [14] also found the reduction ratio of critical velocity to be lower than the blockage ratio in small-scale tests. The correction factor between the metro train blockage ratio and the reduction rate of critical velocity was found to be 0.545 by using the regression analysis method.
The simulated critical velocity with a metro train blockage is shown in Figure 9. The critical velocity of the subway tunnel decreases linearly with an increase in the blockage ratio. The simulated critical velocity data are fitted (see Figure 9). The relationship between the critical velocity and the metro train blockage ratio in subway tunnel fires can be obtained by modifying the Li model [2].
V c r * = ( 1 0.545 φ ) 0.81 Q * 1 / 3
where V c r * is the dimensionless critical velocity with a metro train blockage, Q * is the dimensionless heat release rate, and φ is the metro train blockage ratio.
The FDS subway tunnel model validated with the field experiment data is used to investigate the relationship between the critical velocity and the tunnel slope under the boundary conditions described in Section 2.1. The uphill-sloping subway tunnel models (positive tunnel slope) were obtained by rotating the horizontal subway tunnel models counterclockwise. The downhill-sloping subway tunnel models (negative tunnel slope) were obtained by rotating the horizontal subway tunnel models clockwise. Overall, 20 simulations with various tunnel slopes were carried out to investigate the effects of the tunnel slope on the critical velocity with a blockage. Slopes of 0.5%, 1%, 1.5%, 2%, 2.5%, 3%, 3.5%, 4%, 4.5%, and 5% were studied in both an uphill and downhill subway tunnel.
Figure 10 shows comparisons of variation in V c r , θ * / V c r , 0 * for different tunnel slopes. On comparing tunnel slopes of 0.5%, 1%, 1.5%, 2%, 2.5%, 3%, 3.5%, 4%, 4.5%, and 5%, the simulated critical velocities for a downhill-sloping subway tunnel are found to be bigger than those of a horizontal subway tunnel [2]. The critical velocity increases with a decrease in the tunnel slope in an uphill-sloping subway tunnel with a train blockage inside. Contrarily, on comparing tunnel slopes of 0.5%, 1%, 1.5%, 2%, 2.5%, 3%, 3.5%, 4%, 4.5%, and 5%, the simulated critical velocities for an uphill-sloping subway tunnel are found to be smaller than those of a horizontal subway tunnel. The critical velocity decreases with a decrease in the tunnel slope in a downhill-sloping subway tunnel with a train blockage inside. On the basis of theoretical analysis and simulated critical velocities, a non-dimensional model is proposed in this paper to address the relationship between the critical velocity and the inclination angle.
V c r , θ * / V c r , 0 * = 1 3.67 tan θ
where θ is tunnel slope in degrees, V c r , θ * is the dimensionless critical velocity of the sloping tunnel with slope θ , and V c r , 0 * is the dimensionless critical velocity of the horizontal tunnel.
The critical velocity of the horizontal subway tunnel can be determined by Equation (6). On substituting Equation (7) into Equation (6), we obtain Equation (8), which can predict the critical velocity in the sloping subway tunnel fire with a metro train blockage inside. In order to verify the prediction accuracy of Equation (8), we have simulated the critical velocity in subway tunnels with widths of 3.5 m, and 4.2 m and heat release rates of 3 MW, and 7.5 MW. Table 1 compares the simulated and predicted critical velocities of Equation (8). The predicted critical velocities of Equation (8) agree well with the simulated critical velocities, which indicates that the critical velocity prediction model presented has a high prediction accuracy.
V c r , θ * = ( 1 0.545 φ ) ( 1 3.67 tan θ ) 0.81 Q * 1 / 3

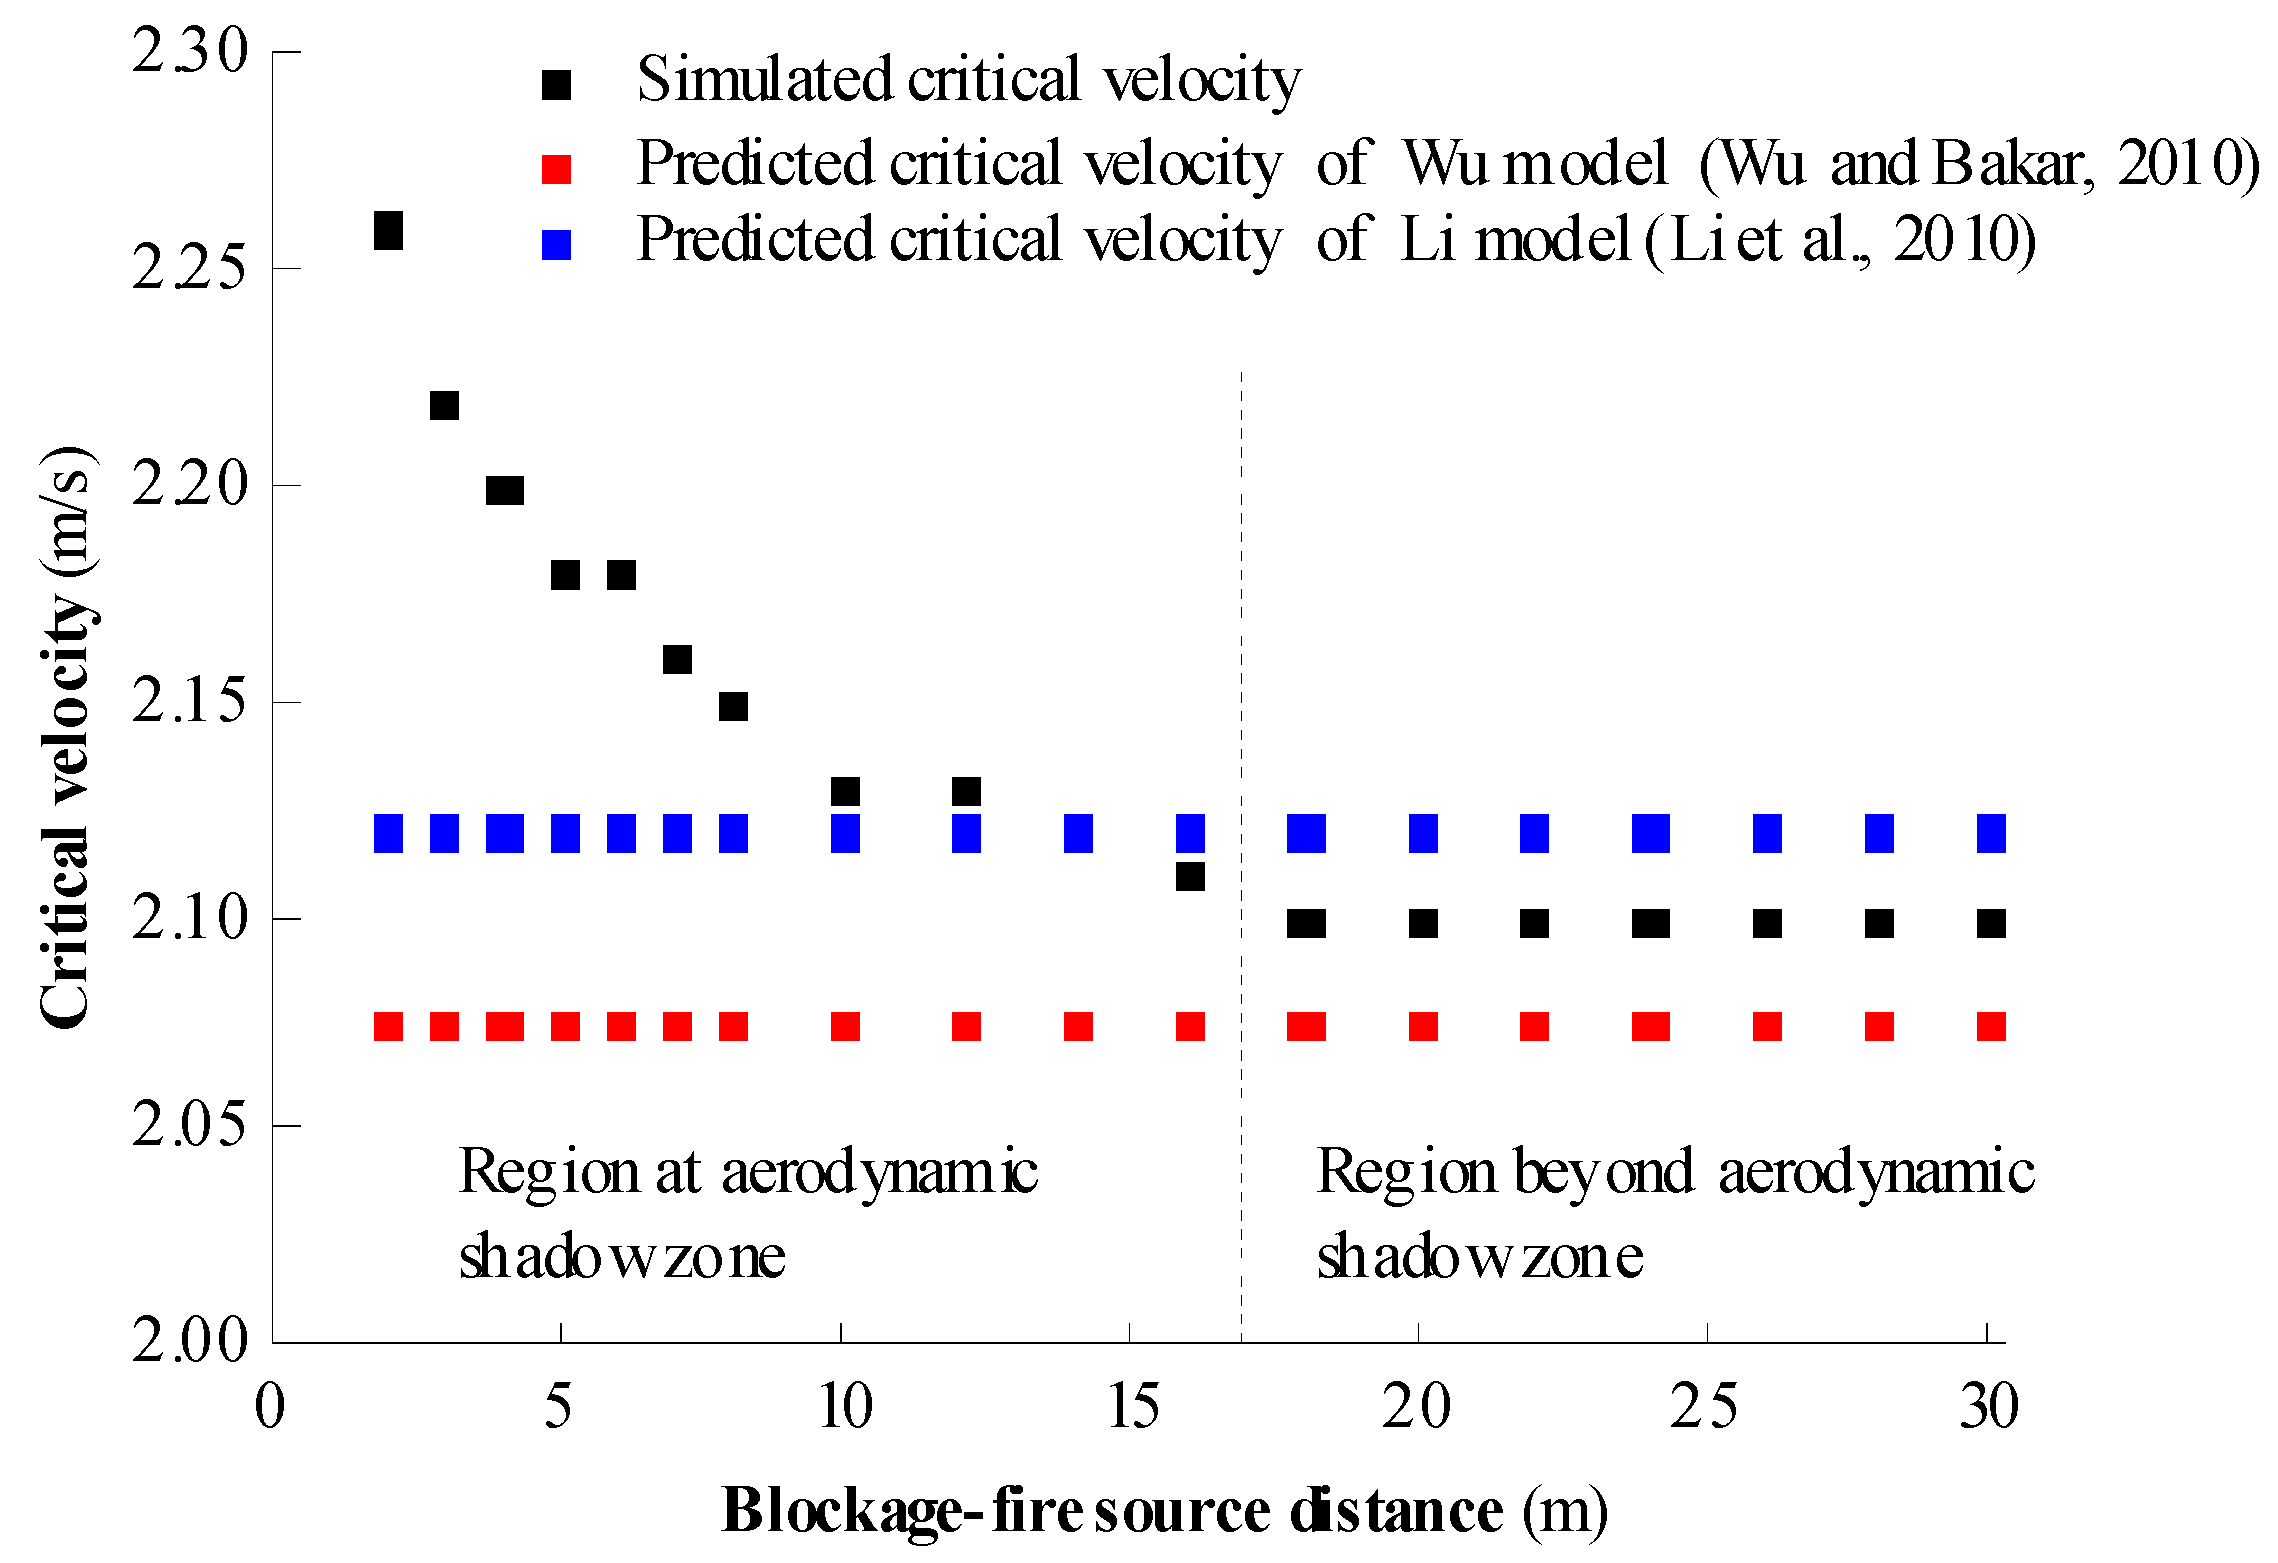
3.2. Critical Velocity in the Unblocked Zones of a Metro Train in Subway Tunnel Fires

The FDS subway tunnel model validated by the field experiment data is used to investigate the critical velocity in unblocked zones of a metro train in subway tunnel fires under the boundary conditions described in Section 2.1. Figure 11 shows the comparisons of the measured critical velocities in Tang’s experiments [17] and the simulated critical velocities under the same boundary conditions. The simulated critical velocity agrees well with the measured critical velocities in Tang’s experiments, which indicates that the FDS subway tunnel model in this study has a high prediction accuracy.
Table 2 shows the predicted smoke back-layering lengths and critical velocities for a downstream fire source at different blockage–fire source distances. Airflow velocity distributions in the aerodynamic shadow zone downstream of a metro train blockage are related to the blockage–fire source distance, the metro train, and the longitudinal velocity. According to the blockage–fire source distance, the region downstream of the metro train can be divided into two location regions: the location region at the aerodynamic shadow zone downstream of the metro train, and the location region beyond the aerodynamic shadow zone. These two location regions have different critical velocities in subway tunnel fires. We will discuss the changes in critical velocities and their reasons next.
Figure 12 presents the airflow velocity contours of a subway tunnel fire with different blockage–fire source distances. There is an aerodynamic shadow zone downstream of the metro train after the horizontal airflow passes around the metro train. The length of the aerodynamic shadow zone will decrease because of buoyancy smoke from the subway fire [44], as shown in Figure 11. The lengths of the aerodynamic shadow zone are determined by the blockage ratio, the fire source position, and the longitudinal ventilation velocity.
For the fire source in the region of the aerodynamic shadow zone downstream of the metro train blockage (e.g., 2 m, 3 m, 6 m, 7 m, 8 m, 10 m, 12 m, 14 m, and 16 m), the ventilation airflow will find it much harder to reach the fire than the no blockage case. Figure 13 shows the temperature contour for a 10 m blockage–fire source distance with different longitudinal ventilation velocities. The critical velocity with a subway train blockage is higher than that without a subway train blockage. However, with an increase in the blockage–fire source distance, the critical velocity first decreases and then tends to be constant. The decrease in the critical velocity is caused by the local recirculation airflow near the fire source, which is similar to the research results in Meng et al. [45] and Tang et al. [17]. They found that the smoke back-layering length decreases with an increase in the blockage–fire source distance. The recirculation airflow in the aerodynamic shadow zone behind the metro train should be considered when analyzing the effects of a metro train blockage.
For the fire source in the region beyond the aerodynamic shadow zone downstream of the metro train blockage (e.g., 18 m, 20 m, 22 m, 24 m, 26 m, 28 m, and 30 m), the critical velocity tends to be constant, similar to that without a blockage. Figure 14 compares the simulated critical velocities with the predictions of the Wu model [19] and the Li model [2]. When the fire source is set at the aerodynamic shadow zone behind the metro train blockage, both the Wu model and the Li model fail to forecast the critical velocity accurately. When the fire source is in the location region beyond the aerodynamic shadow zone downstream of the metro train blockage, the simulated critical velocity in this study agrees well with the predictions of the Wu model and the Li model without blockage, because the recirculation airflow in the aerodynamic shadow zone downstream of metro train cannot approach the fire source. The metro train blockage has almost no influence on the critical velocity when the fire source is in the location region beyond the aerodynamic shadow zone downstream of the metro train blockage. When the fire source exists at the upstream side of metro train blockage, the effect of the metro train blockage on critical velocity is similar to the case with a downstream fire source [21]. A metro train blockage will hinder the exhaust smoke along with longitudinal ventilation because of the reduced cross-sectional area [46]. The blockage effect of a metro train will decrease the smoke extract rate and cause smoke to accumulate in the upper zone of the tunnel [13,22].

4. Conclusions

The impacts of a metro train blockage on the critical velocity in a sloping subway tunnel fire have been studied in this paper by using the numerical simulation method. A global model has been developed to predict the critical velocity in the blocked zone of a metro train in subway tunnel fires by considering the influencing factors of the blockage ratio and the tunnel slope. To analyze the reliability of the numerical results, the results of this study are compared with the results of existing research. The main conclusions are as follows:
(1) The critical velocity in the blocked zone of a metro train decreases linearly with an increase in the metro train blockage ratio. The reduction ratio of the critical velocity is smaller than the metro train blockage ratio. The correction factor of the critical velocity reduction ratio and the metro train blockage ratio is found to be 0.545.
(2) A global model of the critical velocity is proposed for the blocked zone of a metro train in subway tunnel fires including the influencing factors of the blockage ratio and tunnel slope. The predictions of the global model can fit well with the numerical results.
(3) The critical velocity in the unblocked zone of a metro train is higher than that without a subway train blockage. The reason is that smoke flow is hindered by the metro train blockage in subway tunnel fires. With an increase in the blockage–fire source distance, the critical velocity first decreases and then tends to be constant.
The present numerical simulations investigated the impacts of a metro train blockage on the critical velocity in a sloping subway tunnel fire. There are difficulties in controlling ventilation velocity, obtaining stable large heat-release rate, and accurately measuring the ventilation velocities in the full-scale subway tunnel fire tests. Therefore, the number of full-scale subway tunnel fire tests in this study is small. Future studies should conduct more full-scale subway tunnel fire tests to investigate complex cases of blockage effects.

Author Contributions

H.W.: writing—original draft, conceptualization, methodology, investigation. H.G.: data curation, conceptualization, supervision, formal analysis, validation, writing—review and editing. All authors have read and agreed to the published version of the manuscript.

Funding

The research work presented in this paper is financially supported by Cultivation Programme for Young Backbone Teachers of Henan University of Technology (No. 21420069), and Innovative Funds Plan of Henan University of Technology (No. 2020ZKCJ05, 2020ZKCJ022).

Institutional Review Board Statement

The study did not require ethical approval.

Informed Consent Statement

Informed consent was obtained from all subjects involved in the study.

Data Availability Statement

Not applicable.

Conflicts of Interest

The authors declare no conflict of interest.

References

  1. Król, A.; Król, M. Study on hot gases flow in case of fire in a road tunnel. Energies 2018, 11, 590. [Google Scholar] [CrossRef] [Green Version]
  2. Li, Y.Z.; Lei, B.; Ingason, H. Study of critical velocity and backlayering length in longitudinally ventilated tunnel fires. Fire Saf. J. 2010, 45, 361–370. [Google Scholar] [CrossRef]
  3. Razus, D.; Giurcan, V.; Movileanu, C.; Mitu, M. Nitric oxide generation in N2-Diluted H2–N2O flames: A computational study. Processes 2022, 10, 1032. [Google Scholar] [CrossRef]
  4. Mitu, M.; Movileanu, C.; Giurcan, V. Deflagration characteristics of N2-Diluted CH4-N2O mixtures in the course of the incipient stage of flame propagation. Energies 2021, 14, 5918. [Google Scholar] [CrossRef]
  5. Weng, M.C.; Lu, X.L.; Liu, F.; Shi, X.P.; Yu, L.X. Prediction of backlayering length and critical velocity in metro tunnel fires. Tunn. Undergr. Space Technol. 2015, 47, 64–72. [Google Scholar] [CrossRef]
  6. Thomas, P.H. The Movement of Buoyant Fluid against a Stream and Venting of Underground Fire; Fire Research Note, No.351.; Fire Research Station: Watford, London, UK, 1958. [Google Scholar]
  7. Ye, K.; Zhou, X.; Yang, L.; Tang, X.; Zheng, Y.; Cao, B.; Peng, Y.; Liu, H.; Ni, Y. A multi-scale analysis of the fire problems in an urban utility tunnel. Energies 2019, 12, 1976. [Google Scholar] [CrossRef] [Green Version]
  8. Giurcan, V.; Mitu, M.; Movileanu, C.; Razus, D.; Oancea, D. Propagation Velocity of Flames in Inert-Diluted Stoichiometric Propane-Air Mixtures: Pressure and Temperature Dependence. Processes 2021, 9, 997. [Google Scholar] [CrossRef]
  9. Giurcan, V.; Razus, D.; Mitu, M.; Oancea, D. Numerical study of the laminar flame propagation in ethane-air mixtures. Open Chem. 2014, 12, 391–402. [Google Scholar] [CrossRef]
  10. Yan, G.F.; Wang, M.N.; Yu, L.; Duan, R.Y.; Xia, P.X. Effects of ambient pressure on smoke movement patterns in vertical shafts in tunnel fires with natural ventilation systems. Build. Simul. 2020, 13, 931–941. [Google Scholar] [CrossRef]
  11. Park, Y.; Lee, Y.; Na, J.; Ryou, H.S. Numerical study on the effect of tunnel aspect ratio on evacuation with unsteady heat release rate due to fire in the case of two vehicles. Energies 2019, 12, 133. [Google Scholar] [CrossRef] [Green Version]
  12. Zhang, X.C.; Zhang, Z.Y.; Tao, H.W. A numerical study on critical velocity and back-layering length with trains’ blockage in longitudinally ventilated tunnel fires. Tunn. Undergr. Space Technol. 2021, 116, 104093. [Google Scholar] [CrossRef]
  13. Zhang, S.G.; Cheng, X.D.; Yao, Y.Z.; Zhu, K.; Li, K.Y.; Lu, S.; Zhang, R.F.; Zhang, H.P. An experimental investigation on blockage effect of metro train on the smoke back-layering in subway tunnel fires. Appl. Therm. Eng. 2016, 99, 214–223. [Google Scholar] [CrossRef]
  14. Lee, Y.P.; Tsai, K.C. Effect of vehicular blockage on critical ventilation velocity and tunnel fire behavior in longitudinally ventilated tunnels. Fire Saf. J. 2012, 53, 35–42. [Google Scholar] [CrossRef]
  15. Yi, L.; Xu, Q.Q.; Xu, Z.S.; Wu, Z.D. An experimental study on critical velocity in sloping tunnel with longitudinal ventilation under fire. Tunn. Undergr. Space Technol. 2014, 43, 198–203. [Google Scholar] [CrossRef]
  16. Weng, M.C.; Lu, X.L.; Liu, F.; Du, C.X. Study on the critical velocity in a sloping tunnel fire under longitudinal ventilation. Appl. Therm. Eng. 2016, 94, 422–434. [Google Scholar] [CrossRef]
  17. Oka, Y.; Atkinson, G.T. Control of smoke flow in tunnel fires. Fire Saf. J. 1995, 25, 305–322. [Google Scholar] [CrossRef]
  18. Tang, W.; Hu, L.H.; Chen, L.F. Effect of blockage-fire distance on buoyancy driven back-layering length and critical velocity in a tunnel: An experimental investigation and global correlations. Appl. Therm. Eng. 2013, 60, 7–14. [Google Scholar] [CrossRef]
  19. Wu, Y.; Bakar, M.A. Control of smoke flow in tunnel fires using longitudinal ventilation systems–a study of the critical velocity. Fire Saf. J. 2010, 35, 363–390. [Google Scholar] [CrossRef]
  20. Shafee, S.; Yozgatligil, A. An analysis of tunnel fire characteristics under the effects of vehicular blockage and tunnel inclination. Tunn. Undergr. Space Technol. 2018, 79, 274–285. [Google Scholar] [CrossRef]
  21. Altay, M.; Surmen, A. Effect of the relative positions of vehicular blockage on the smoke flow behaviour in a scaled tunnel. Fuel 2019, 255, 115694. [Google Scholar] [CrossRef]
  22. Jiang, X.P.; Zhang, H.X.; Jing, A. Effect of blockage ratio on critical velocity in tunnel model fire tests. Tunn. Undergr. Space Technol. 2018, 82, 84–591. [Google Scholar] [CrossRef]
  23. Tang, F.; Cao, Z.L.; Chen, Q.; Meng, N.; Wang, Q.; Fan, C.G. Effect of blockage-heat source distance on maximum temperature of buoyancy-induced smoke flow beneath ceiling in a longitudinal ventilated tunnel. Int. J. Heat Mass Tran. 2017, 109, 683–688. [Google Scholar] [CrossRef]
  24. Tang, F.; Li, L.J.; Mei, F.Z.; Dong, M.S. Thermal smoke back-layering flow length with ceiling extraction at upstream side of fire source in a longitudinal ventilated tunnel. Appl. Therm. Eng. 2016, 106, 125–130. [Google Scholar] [CrossRef]
  25. Chow, W.K.; Gao, Y.; Zhao, J.H.; Dang, J.F.; Chow, C.L.; Miao, L. Smoke movement in tilted tunnel fires with longitudinal ventilation. Fire Saf. J. 2015, 75, 14–22. [Google Scholar] [CrossRef]
  26. Luo, J.L.; Xu, Z.S.; Li, F.L.; Zhao, J.M. Effect of vehicular blocking scene on smoke spread in the longitudinal ventilated tunnel fire. Case Stud. Therm. 2019, 14, 100495. [Google Scholar] [CrossRef]
  27. Tang, Z.; Gao, K.; Shan, Y.; Zhu, C.; Liu, Z.; Liu, Z. Study of the fire behavior of multilayer cables in a mine tunnel. Energies 2022, 15, 2059. [Google Scholar] [CrossRef]
  28. Kong, J.; Xu, Z.S.; You, W.J.; Wang, B.l.; Liang, Y.; Chen, T. Study of smoke back-layering length with different longitudinal fire locations in inclined tunnels under natural ventilation. Tunn. Undergr. Space Technol. 2021, 107, 103663. [Google Scholar] [CrossRef]
  29. Weng, M.C.; Yu, L.X.; Liu, F.; Nielsen, P.V. Full-scale experiment and CFD simulation on smoke movement and smoke control in a metro tunnel with one opening portal. Tunn. Undergr. Space Technol. 2014, 42, 96–104. [Google Scholar] [CrossRef]
  30. Zhang, S.; Yang, H.; Yao, Y.Z.; Zhu, K.; Zhou, Y.; Cheng, X.D. Numerical investigation of back-layering length and critical velocity in curved subway tunnels with different turning radius. Fire Technol. 2017, 53, 1765–1793. [Google Scholar] [CrossRef]
  31. Gannouni, S.; Maad, R.B. Numerical study of the effect of blockage on critical velocity and backlayering length in longitudinally ventilated tunnel fires. Tunn. Undergr. Space Technol. 2015, 48, 147–155. [Google Scholar] [CrossRef]
  32. Król, A.; Król, M. Some Tips on numerical modeling of airflow and fires in road tunnels. Energies 2021, 14, 2366. [Google Scholar] [CrossRef]
  33. Craig, M.; Asim, T. Numerical Investigations on the propagation of fire in a railway carriage. Energies 2020, 13, 4999. [Google Scholar] [CrossRef]
  34. McGrattan, K.; McDermott, R.; Hostikka, S.; Floyd, J. Fire Dynamics Simulator (Version 6) User’s Guide; NIST Special Publication 1019-6; National Institute of Standards and Technology: Gaithersburg, MD, USA, 2013. [Google Scholar]
  35. Huang, Y.B.; Li, Y.F.; Li, J.M.; Li, J.X.; Wu, K.; Zhu, K.; Li, H.H. Modelling and experimental investigation of critical velocity and driving force for preventing smoke backlayering in a branched tunnel fire. Tunn. Undergr. Space Technol. 2020, 99, 103388. [Google Scholar] [CrossRef]
  36. Blanchard, E.; Morlon, R.; Parent, G.; Fromy, P.; Boulet, P.; Borgiallo, D. Experimental study of the interaction between water sprays and smoke layer. Fire Technol. 2018, 54, 479–501. [Google Scholar] [CrossRef]
  37. Ji, J.; Guo, F.Y.; Gao, Z.H.; Zhu, J.P.; Sun, J.H. Numerical investigation on the effect of ambient pressure on smoke movement and temperature distribution in tunnel fires. Appl. Therm. Eng. 2017, 118, 663–669. [Google Scholar] [CrossRef]
  38. Gao, P.Z.; Liu, S.L.; Chow, W.K.; Fong, N.K. Large eddy simulations for studying tunnel smoke ventilation. Tunn. Undergr. Space Technol. 2004, 19, 577–586. [Google Scholar] [CrossRef]
  39. Hu, L.H.; Tang, F.; Yang, D.; Liu, S.; Huo, R. Longitudinal distributions of CO concentration and difference with temperature field in a tunnel fire smoke flow. Int. J. Heat Mass Tran. 2010, 53, 2844–2855. [Google Scholar] [CrossRef]
  40. Zisis, T.; Vasilopoulos, K.; Sarris, I. Numerical simulation of a fire accident in a longitudinally ventilated railway tunnel and tenability analysis. Appl. Sci. 2022, 12, 5667. [Google Scholar] [CrossRef]
  41. Fan, C.; Zhang, L.; Jiao, S.; Yang, Z.; Li, M.; Liu, X. Smoke spread characteristics inside a tunnel with natural ventilation under a strong environmental wind. Tunn. Undergr. Space Technol. 2018, 82, 99–110. [Google Scholar] [CrossRef]
  42. Li, L.; Cheng, X.; Cui, Y.; Li, S.; Zhang, H. Effect of blockage ratio on critical velocity in tunnel fires. J. Fire Sci. 2012, 30, 413–427. [Google Scholar] [CrossRef]
  43. Li, Y.Z.; Ingason, H. Effect of cross section on critical velocity in longitudinally ventilated tunnel fires. Fire Saf. J. 2017, 91, 303–311. [Google Scholar] [CrossRef]
  44. Olvera, H.A.; Choudhuri, A.R.; Li, W.W. Effects of plume buoyancy and momentum on the near-wake flow structure and dispersion behind an idealized building. J. Wind. Eng. Ind. Aerodyn. 2008, 96, 209–228. [Google Scholar] [CrossRef]
  45. Meng, N.; Yang, W.Y.; Xin, L.; Li, X.; Liu, B.B.; Jin, X.N. Experimental study on backlayering length of thermal smoke flow in a longitudinally ventilated tunnel with blockage at upstream of fire source. Tunn. Undergr. Space Technol. 2018, 82, 315–324. [Google Scholar] [CrossRef]
  46. Vega, M.G.; Díaz, K.M.; Oro, J.M.; Tajadura, R.B.; Morros, C.S. Numerical 3D simulation of a longitudinal ventilation system: Memorial tunnel case. Tunn. Undergr. Space Technol. 2008, 23, 539–551. [Google Scholar] [CrossRef]
Figure 1. Subway tunnel model diagram.
Energies 15 05762 g001
Figure 2. Mesh-size independent test.
Energies 15 05762 g002
Figure 3. Test setup for model validation.
Energies 15 05762 g003
Figure 4. Predicted and measured air temperatures 1 m above the floor along the centerline.
Energies 15 05762 g004
Figure 5. Temperature contour and velocity contour near the fire source.
Energies 15 05762 g005
Figure 6. Schematic diagram of extrapolating back-layering length-velocity curve method.
Energies 15 05762 g006
Figure 7. Temperature contour of a subway tunnel with different blockage ratios.
Energies 15 05762 g007
Figure 8. Relationship between the reduction ratio of critical velocity and metro blockage ratio.
Energies 15 05762 g008
Figure 9. Simulated critical velocities at different blockage ratios.
Energies 15 05762 g009
Figure 10. Comparison of the variation of V c r , θ * / V c r , 0 * with different tunnel slopes.
Energies 15 05762 g010
Figure 11. Comparison of experimental critical velocity and simulated critical velocity.
Energies 15 05762 g011
Figure 12. Velocity contours of different blockage–fire source distances.
Energies 15 05762 g012
Figure 13. Temperature contours of different longitudinal ventilation velocities.
Energies 15 05762 g013
Figure 14. Comparisons of simulated critical velocities with predictions of existing models [2,19].
Energies 15 05762 g014
Table 1. Simulated and predicted critical velocities of Equation (8).
Tunnel Width (m)HRR (MW)Slope (%)Critical Velocity of Equation (8) (m/s)Simulated Critical Velocity (m/s)Relative Error (%)
3.5301.641.682.44
3.53−51.951.981.54
3.5331.461.513.42
3.57.502.162.222.78
3.57.5−31.931.91−1.04
3.57.542.482.542.42
4.2301.641.58−3.66
4.2331.401.453.57
4.23−31.831.914.37
4.27.502.162.12−1.85
4.27.551.771.833.39
4.27.5−12.242.281.79
Table 2. Critical velocities for different blockage–fire source distances.
No.Blockage-Fire Distance (m)Smoke Back-Layering Length (m) (Ventilation Velocity (m/s))Critical Velocity (m/s)
1~524.0 (1.4), 1.7 (1.6), 1.5 (1.8), 1.0 (2), 0.6 (2.2)2.26
6~1033.5 (1.4), 2.6 (1.6), 2.1 (1.8), 0.9 (2), 0.1 (2.2)2.22
11~1544.6 (1.4), 3.3 (1.6), 2.2 (1.8), 0.8 (2), 0.2 (2.1)2.20
16~2055.2 (1.4), 3.7 (1.6), 2.3 (1.8), 0.9 (2), 0.3 (2.1)2.18
21~2566.5 (1.4), 4.5 (1.6), 2.2 (1.8), 1.2 (2), 0.2 (2.2)2.18
26~3077.4 (1.4), 5.5 (1.6), 2.6 (1.8), 1.2 (2), 0 (2.2)2.16
31~3588.5 (1.4), 6.3 (1.6), 3.3 (1.8), 1.3 (2), 0.1 (2.1)2.15
36~401010.7 (1.4), 8.3 (1.6), 3.5 (1.8), 1.3 (2), 0.2 (2.1)2.14
41~451212.4 (1.4), 8 (1.6), 5.8 (1.8), 1.4 (2), 0.5 (2.05)2.13
46~501414.6 (1.4), 12.1 (1.6), 7.6 (1.8), 0.9 (2), 0.3 (2.1)2.12
51~551615.7 (1.4), 13.8 (1.6), 8.9 (1.8), 1.4 (2), 0.3 (2.1)2.11
56~601817.4 (1.4), 15.9 (1.6), 8.9 (1.8), 1.9 (2), 0.3 (2.1)2.1
61~652019.3 (1.4), 17.4 (1.6), 11.8 (1.8), 1.2 (2), 0.5 (2.05)2.1
66~702221.5 (1.4), 19.1 (1.6), 13.6 (1.8), 2.1 (2), 0.2 (2.1)2.1
71~752423.4 (1.4), 21.9 (1.6), 14.9 (1.8), 1.6 (2), 0.5 (2.05)2.1
76~802625.5 (1.4), 23.5 (1.6), 15.0 (1.8), 1.5 (2), 0.4 (2.05)2.1
81~852827.3 (1.4), 25 (1.6), 16 (1.8), 1.5 (2), 0.6 (2.05)2.1
96~903029.4 (1.4), 26.5 (1.6), 16.6 (1.8), 1.7 (2), 0.3 (2.05)2.1
Publisher’s Note: MDPI stays neutral with regard to jurisdictional claims in published maps and institutional affiliations.

