The heat storage capacity of the phase change reservoir refers to the sensible heat storage capacity and latent heat storage capacity of the water and phase change module. To analyze the heat storage performance of the reservoir in underground engineering, the heat storage capacity per volume and the guaranteed efficiency coefficient of the reservoir were proposed in previous research [
31] to measure its heat storage performance. The per volume heat storage of the reservoir is:
where
refers to the heat storage capacity per volume of the reservoir, in kJ/m
3;
V refers to the effective heat storage volume of the reservoir, in m
3, and its value is 1.86 m
3 under experimental conditions;
refers to the specific heat capacity of water, in kJ/kg.K;
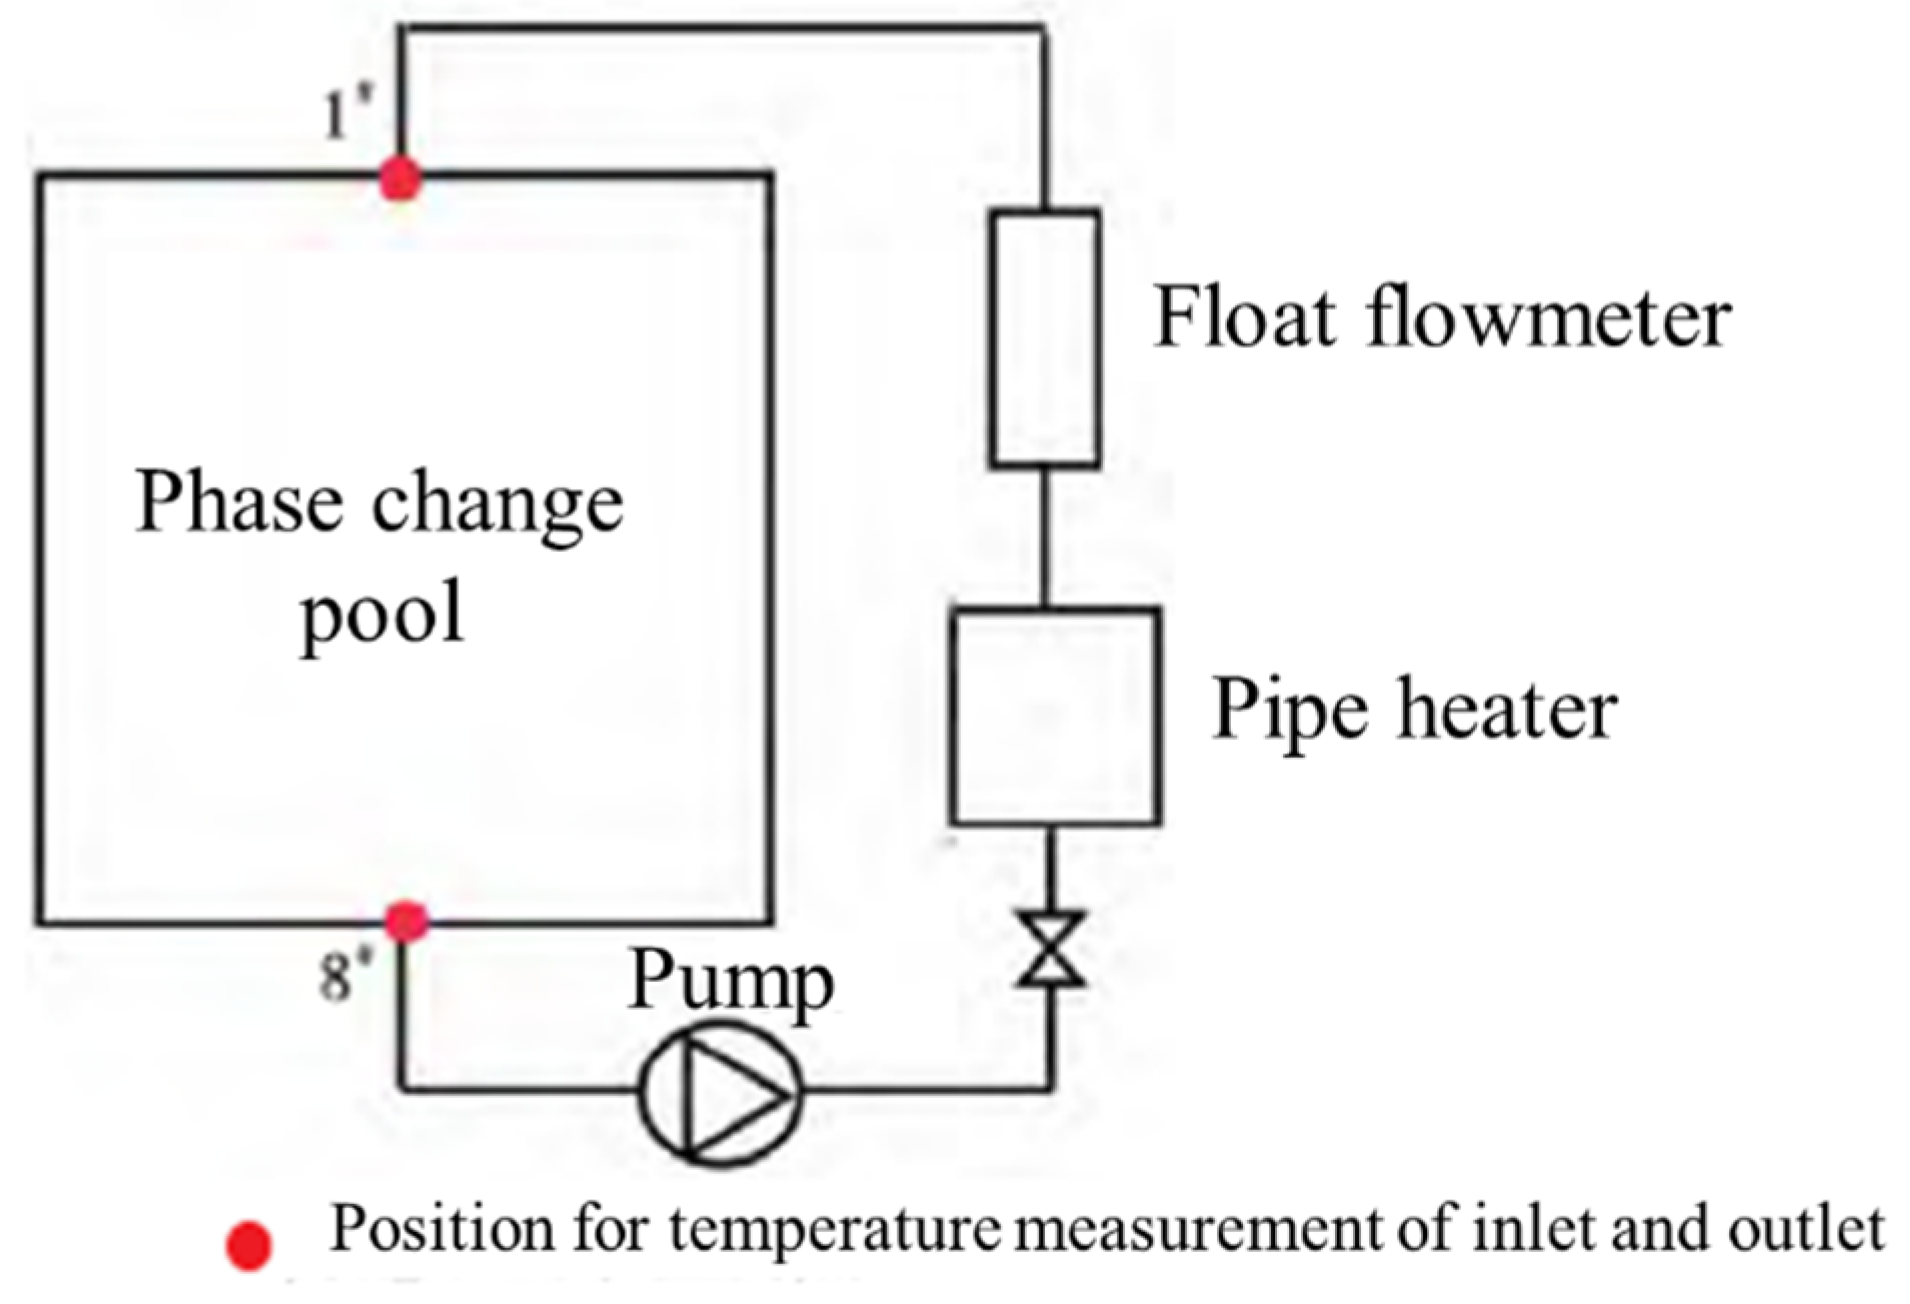
refers to the cooling water flow of the reservoir, in kg/s;
refers to the inlet temperature of the cooling water of the reservoir, in °C;
refers to the cooling water outlet temperature of the reservoir, in °C.
The guaranteed efficiency coefficient of the phase change reservoir defined based on outlet temperature is:
where
is the guaranteed efficiency coefficient of the reservoir;
is the duration from the initial temperature
to the upper limit of the operating temperature
of the air-conditioning system when the phase change heat storage module is added to the air-conditioning reservoir, in h;
is the duration from the initial temperature
to the upper limit of the operating temperature
of the air-conditioning system when no phase change heat storage module is added to the reservoir, in h.
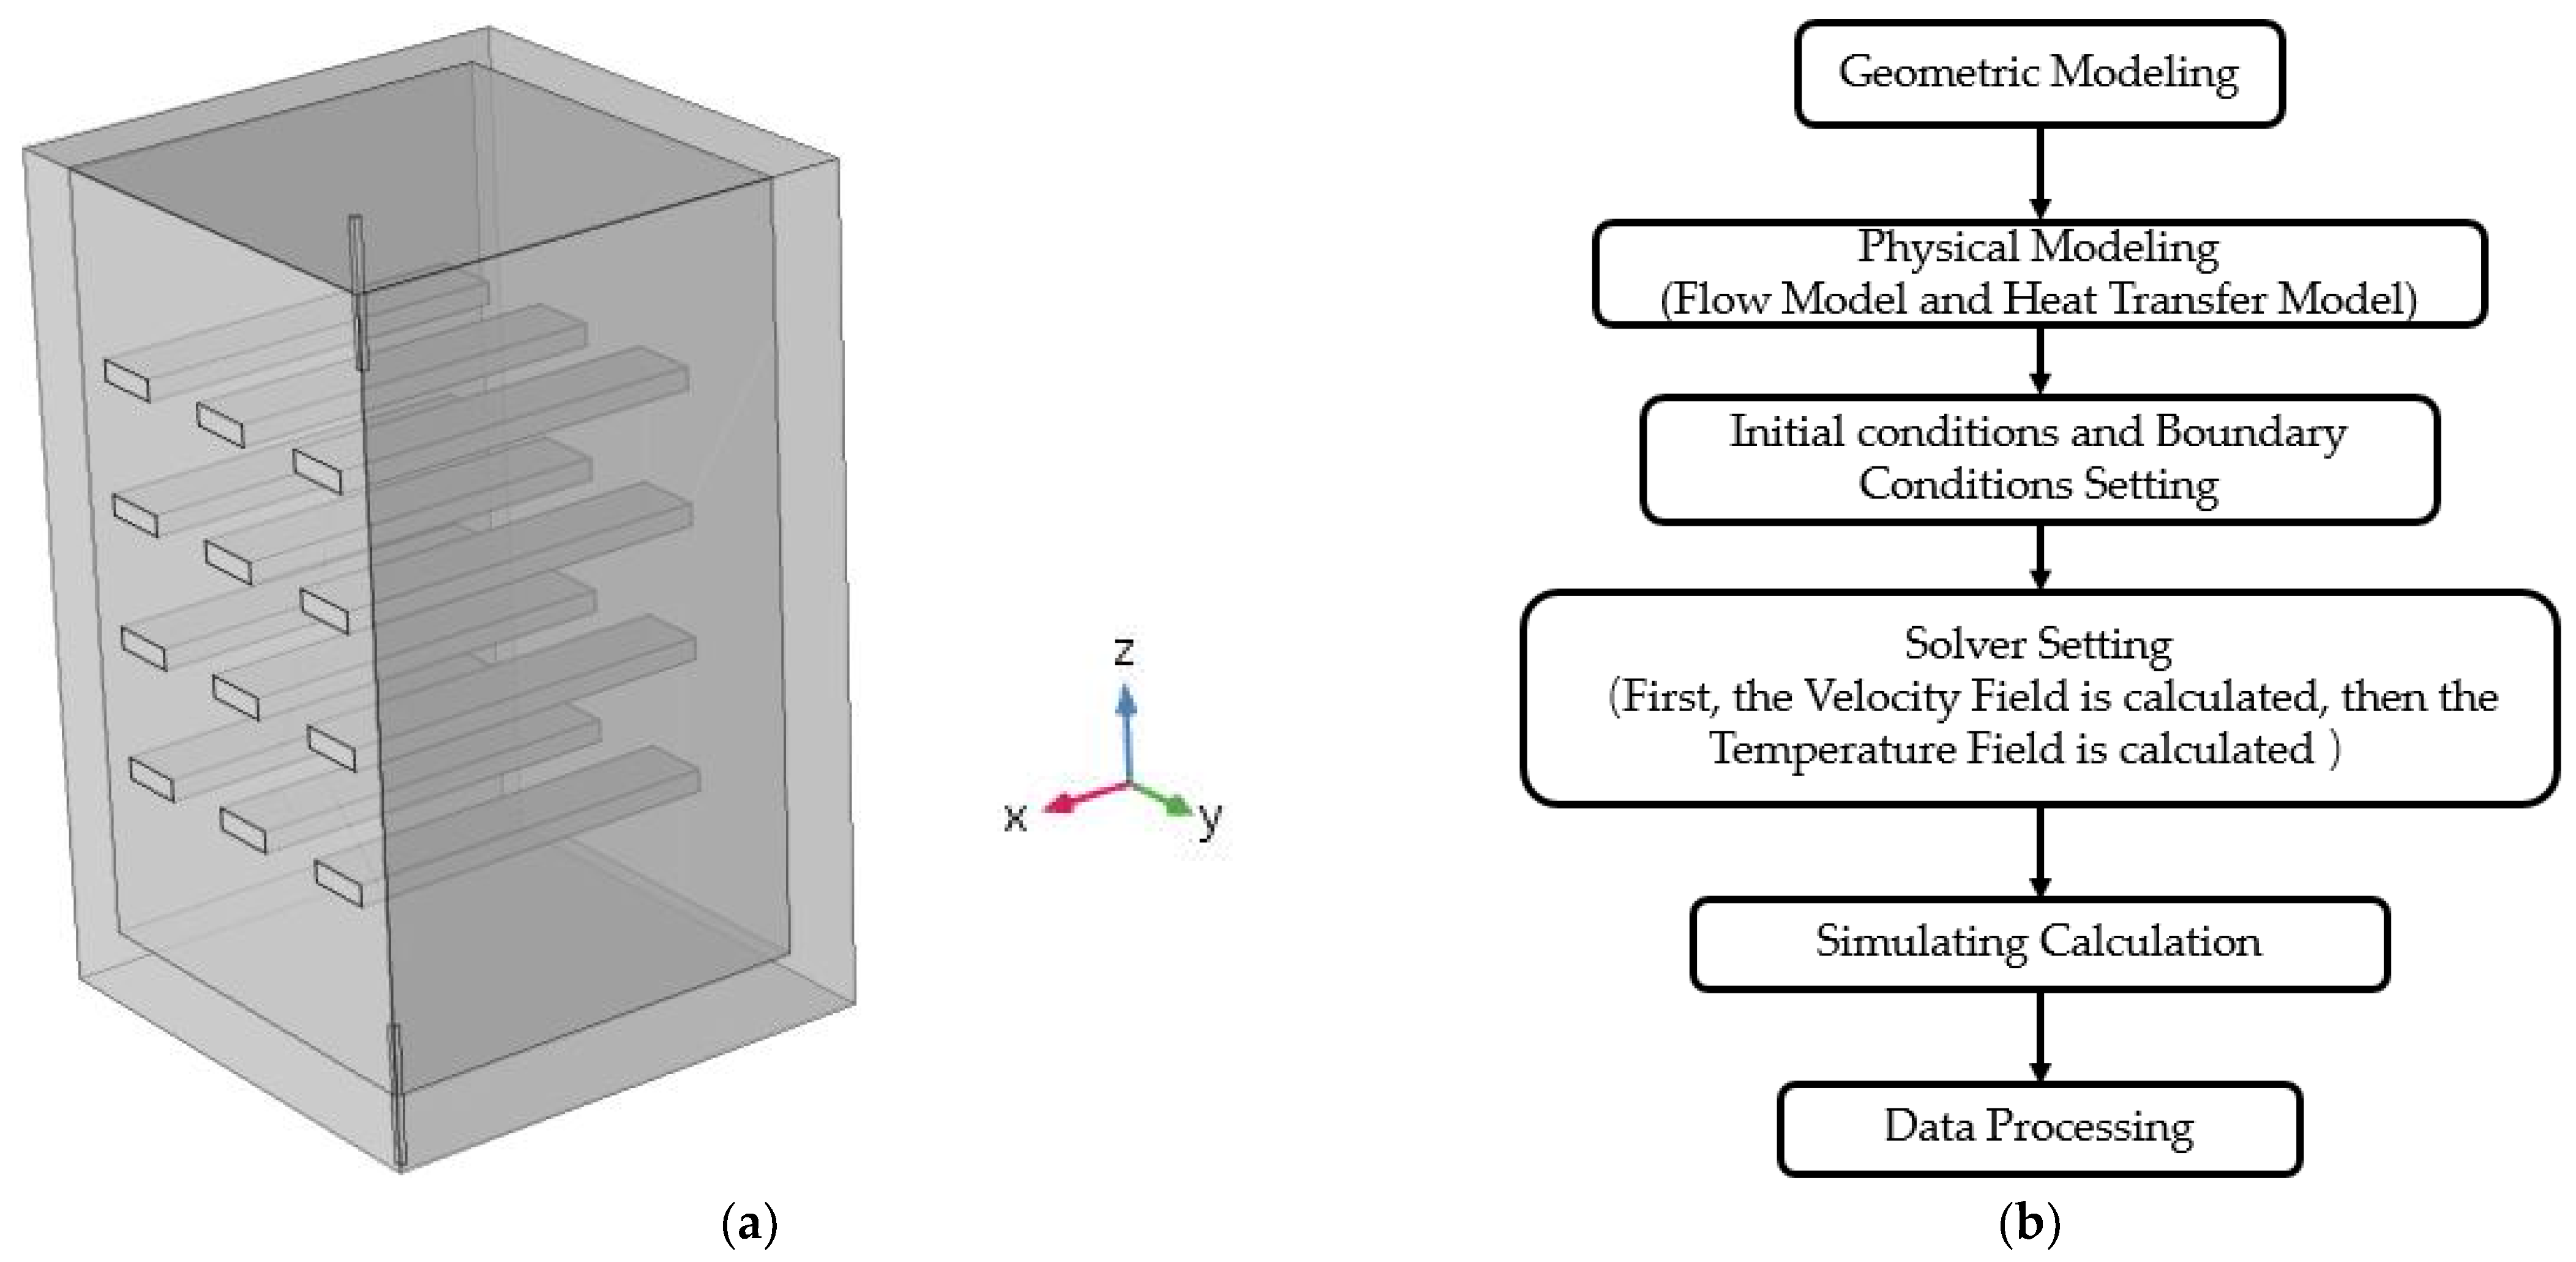
According to the evaluation indexes of the heat storage performance in the underground engineering phase change reservoir proposed above, and taking the phase change heat storage pool system and phase change heat storage module as the research object, the numerical model was established based on the COMSOL Multiphysics software platform. The effects of the PCM properties, the structure size of the phase change heat storage module and water distribution mode on the operation, performance and efficiency of phase change heat storage system in underground engineering were analyzed.
5.1. Influence of Physical Properties of PCMs on Heat Storage Performance of Water Reservoir
Among the physical properties of PCM, the phase change temperature, latent heat value and thermal conductivity of PCM undoubtedly have the greatest influence on the heat storage performance of the system. The influences of these three factors on the heat storage of the system are analyzed in detail below.
Table 3 shows the analysis conditions of the influence of the properties of PCMs. To analyze the influence of these three different physical parameters on the heat storage performance of the reservoir, the physical properties of the different materials selected in the numerical calculation are shown in
Table 3, and can be divided into three working conditions representing the change in phase change temperature, latent heat value and thermal conductivity, respectively.
5.1.1. Influence of Phase Change Temperature Value of PCM on Heat Storage Performance of Water Reservoir
The phase change temperature of PCMs should be compatible with the system’s operating conditions. The temperature of the reservoir’s cooling water operation interval is between 21 °C and 35 °C. Considering the fact that PCMs can achieve a phase change to store energy, there must be a temperature gap between the cooling water and the phase change heat storage module for a heat transfer. In that case, the temperature suitable for underground engineering of the phase change temperature range of PCMs should be 21 °C < tm < 35 °C.
Taking
ΔT = 2, the heat storage of the reservoir in underground engineering with a phase change temperature between 21 °C and 33 °C is analyzed.
Figure 7 shows the influence of different phase change temperatures on the outlet temperature of the reservoir. As evident in
Figure 7, the variation in the outlet water temperature of the reservoir presents three stages.
The first stage is the heat storage stage dominated by sensible heat. At this stage, because the cooling water of the reservoir and the temperature difference between the phase change heat storage module is small, the phase change heat storage module’s internal temperature is below the melting temperature of PCMs. At this time, the condensing heat which was brought into the cooling reservoir is stored in the form of the sensible heat of cooling water and the phase change heat storage module. The outlet temperature of the first stage has a higher slope and faster temperature rise compared with that of the second stage. In the second stage, as the heat storage progresses, the temperature of the module gradually increases. When it reaches the melting temperature of the PCM, latent heat storage begins to play a role in the melting of the PCM. The slope of the exit temperature rise curve at the second stage is significantly lower than that of the first stage. Finally, in the third stage, as the PCM is melted, the heat is again stored in the form of the sensible heat of the cooling water and phase change heat storage module. The slope of the outlet temperature rise curve rises again until the outlet temperature reaches the upper limit of the system’s operating temperature. This can also be seen in
Figure 7 that with the increase of the melting temperature of the PCM, the outlet temperature begins to rise in the second stage, that is, the initial time of phase change heat storage in the phase change modules is gradually delayed.
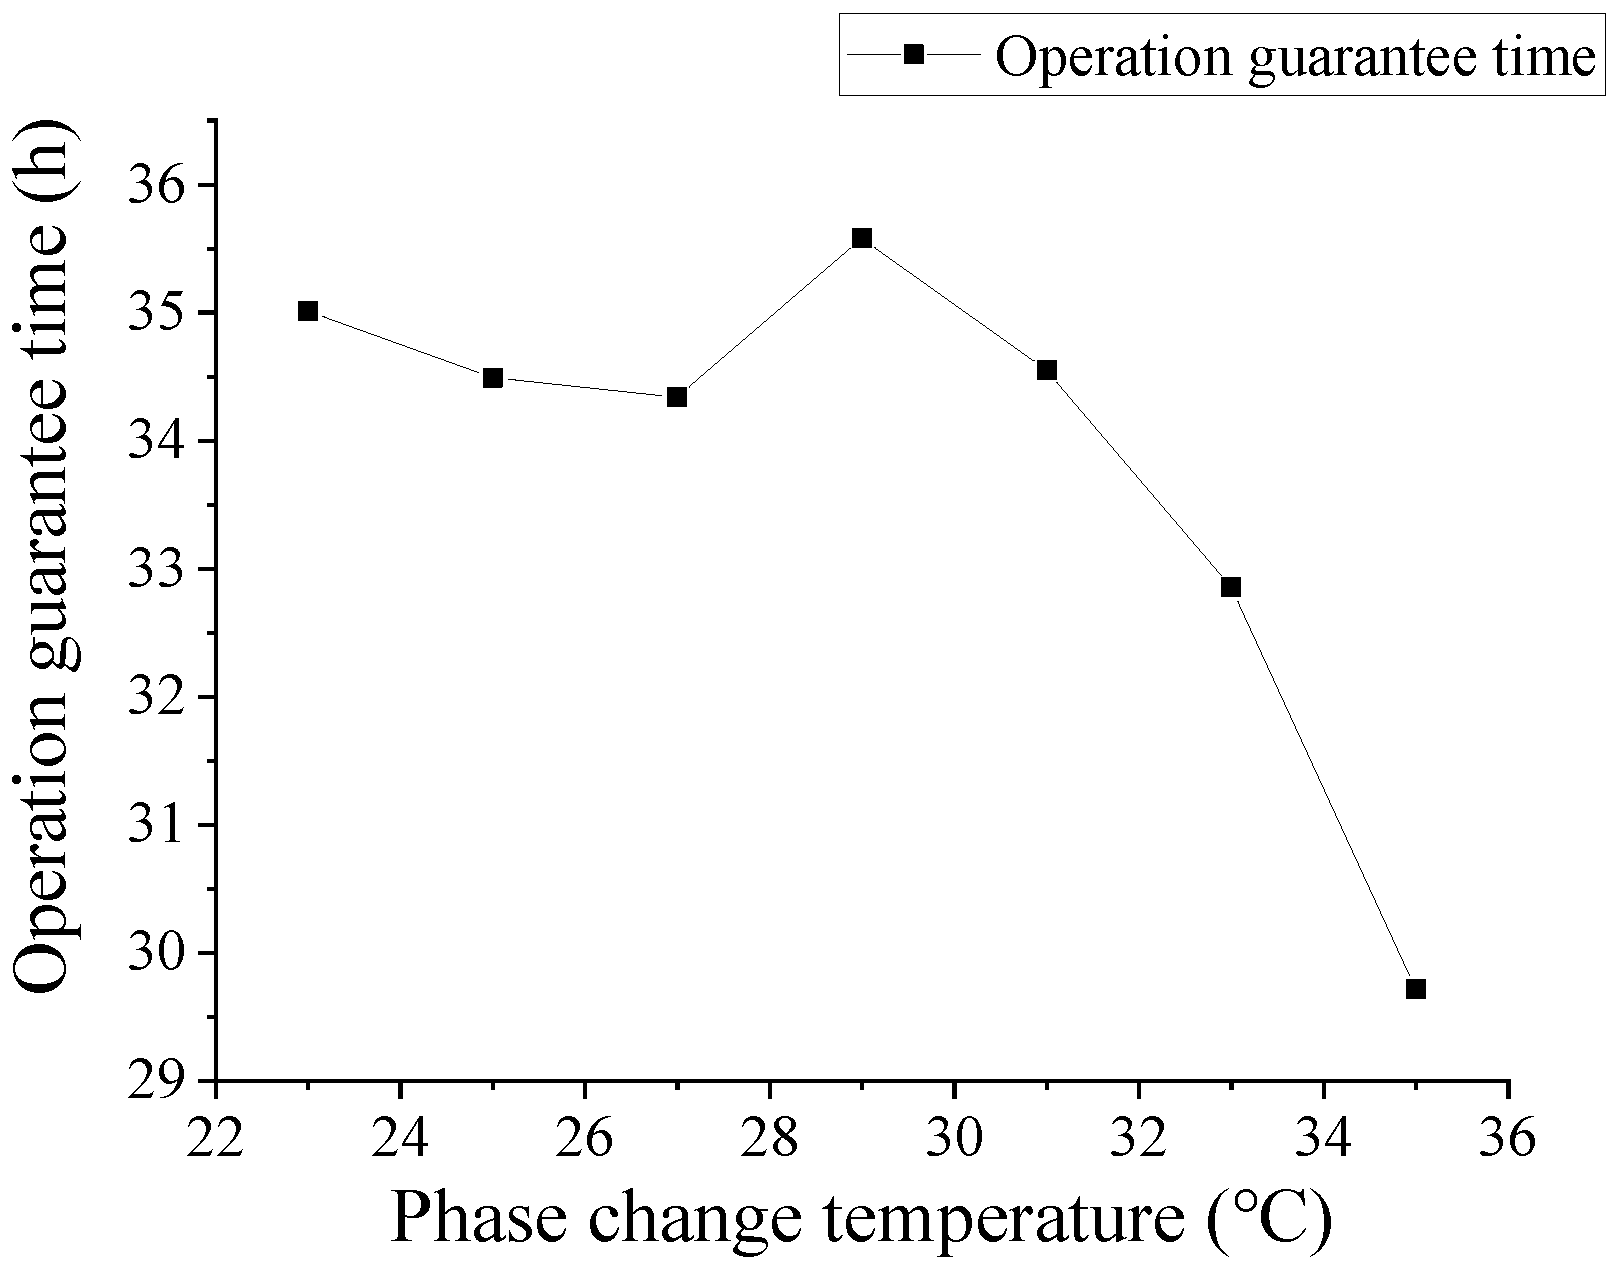
Figure 8 shows the analysis of the influence of the phase change temperature on the guaranteed operation time of the reservoir. The analysis shows that, when using the material whose phase change temperature is 33 °C, the guaranteed operation time is significantly less than that of other working conditions. Combined with the change in liquid phase ratio of the phase change module in
Figure 9, it can be seen that the reason for this phenomenon is that when the outlet temperature of the heat storage reservoir reaches the upper limit operation temperature
, the module whose phase change temperature is 33 °C has not completely melted and its liquid phase ratio is 46.5%. The heat storage reservoir with PCMs at phase change temperatures of 23 °C, 25 °C, 27 °C, 29 °C and 31 °C completely melted before the outlet temperature reaches the
. The latent heat of the phase change has been fully utilized. There is little difference between the guaranteed operation capacities of the reservoir with phase change temperatures 23 °C and 31 °C. Considering that there was a temperature difference of 2 °C between 31 °C and 33 °C, the phase change temperature was set as 32 °C for the simulation study. The calculated guaranteed operation time is 31.5 h. When the outlet temperature of the reservoir reaches
, the liquid phase ratio is 60.88%. The PCM with the phase change temperature of 32 °C does not complete the phase change when the outlet temperature of the heat storage reservoir reaches
. The latent heat of the phase change is not fully released, thus reducing its guaranteed capacity.
It can be seen from the above analysis that, under the simulated working conditions, the phase change temperature of the selected material should be more than 4 °C lower than the upper limit of the outlet temperature, which ensures that the PCM can be completely melted and the latent heat can be fully released before the outlet temperature of the reservoir reaches (35 °C).
Further analysis shows that the lower the melting temperature of PCM is, the earlier the phase change heat storage module starts the phase change and completes the heat storage. This seems to be favorable for heat storage. However, combined with the analysis of the heat discharge process of the reservoir, the lower the phase change temperature is, the lower the temperature of the external heat transfer medium required by the solidification and heat release is. When the temperature of the external heat transfer medium is higher, a large amount of phase change stored heat cannot be released, which will inevitably affect the recycling efficiency of the reservoir. This should be considered in practical engineering applications.
Table 4 is the analysis of the influence of different phase change temperatures on the heat storage performance of the reservoir, where the working condition “0” is the simulation of the heat storage process of the reservoir without the phase change heat storage module. It can be seen from
Table 4 that the phase change temperature selection of PCMs has a great influence on the heat storage performance of the reservoir. When the phase transition temperature is between 21 °C and 35 °C, the heat storage capacity per volume
and the guaranteed efficiency coefficient
are both the highest at 29 °C. Only the phase change temperature suitable for the design condition can give full play to the heat storage efficiency. However, under working condition 6, due to the excessively high phase change temperature, the melt rate of the PCM is low within the variation range of the system-designed operating temperature. This results in its heat storage capacity per volume
and the guaranteed heat storage efficiency coefficient
being significantly lower than other conditions.
5.1.2. Influence of Latent Heat Value of PCM on Heat Storage Performance of Water Reservoir
Considering that the latent heat value of the phase change of existing low-temperature PCMs is mostly between 100 kJ/kg and 250 kJ/kg [
34,
35], take
ΔL = 50 kJ/kg. The heat storage of the phase change reservoir in underground engineering is analyzed under that condition.
Figure 10 shows the influence of different latent heat values of phase change on the outlet temperature of the reservoir.
Combining
Figure 7 and
Figure 10, it can be seen that similar to the influence of different phase transition temperatures on the outlet temperature of the reservoir, The outlet temperature of the reservoir under different latent heat values also presents three stages: the first stage of heat storage is dominated by sensible heat; the second stage of heat storage is dominated by latent heat from the changing phase; and the third stage of heat storage is dominated by sensible heat. The slope change stage of the temperature rise curve is the same.
The difference is that the outlet temperature rise and the slope of the reservoir at the first stage are the same under different latent heat values. The reason is that the first stage is the sensible heat storage stage. Apart from the latent heat value of the phase change, all phase change heat storage modules have the same physical parameters.
Further analysis shows that, in the second stage of latent heat storage, with the increase in the latent heat value of the phase change, the outlet temperature of the reservoir presents two significant changes: one is that the slope of the temperature rise curve of the outlet temperature decreases, and the other is that the duration of the phase change heat storage phase increases. The reason for the first phenomenon is that the latent heat value of the phase change increases, which increases the heat storage of PCMs. Nevertheless, the condensing of the heat load into the reservoir is constant, so the heat storage of the water body in the reservoir decreases and the temperature of the water body slowly rises. The reason for the second phenomenon can be seen in
Figure 11. The PCMs with different latent heat values have the same phase change temperature, so they all being the phase change at the same moment. The higher the latent heat value of phase change is, then the more the phase change time is delayed, and the longer the time required to complete phase change is. Thus, the duration of the phase change heat storage stage of the reservoir is longer.
By analyzing the outlet temperature of the reservoir at the third stage, with the increase in the latent heat value of the phase change, the time required for the outlet temperature to reach the set limit temperature gradually increases. The main reason is that, as the latent heat value of the phase change increases, the heat storage capacity of the reservoir is enhanced. In that case, it can guarantee the improvement in the operation time of the air-conditioning unit. Therefore, the higher the latent heat value of the phase change is, the more favorable it is to the system energy storage. PCM with high latent heat should be selected as far as possible in the heat storage system of the reservoir.
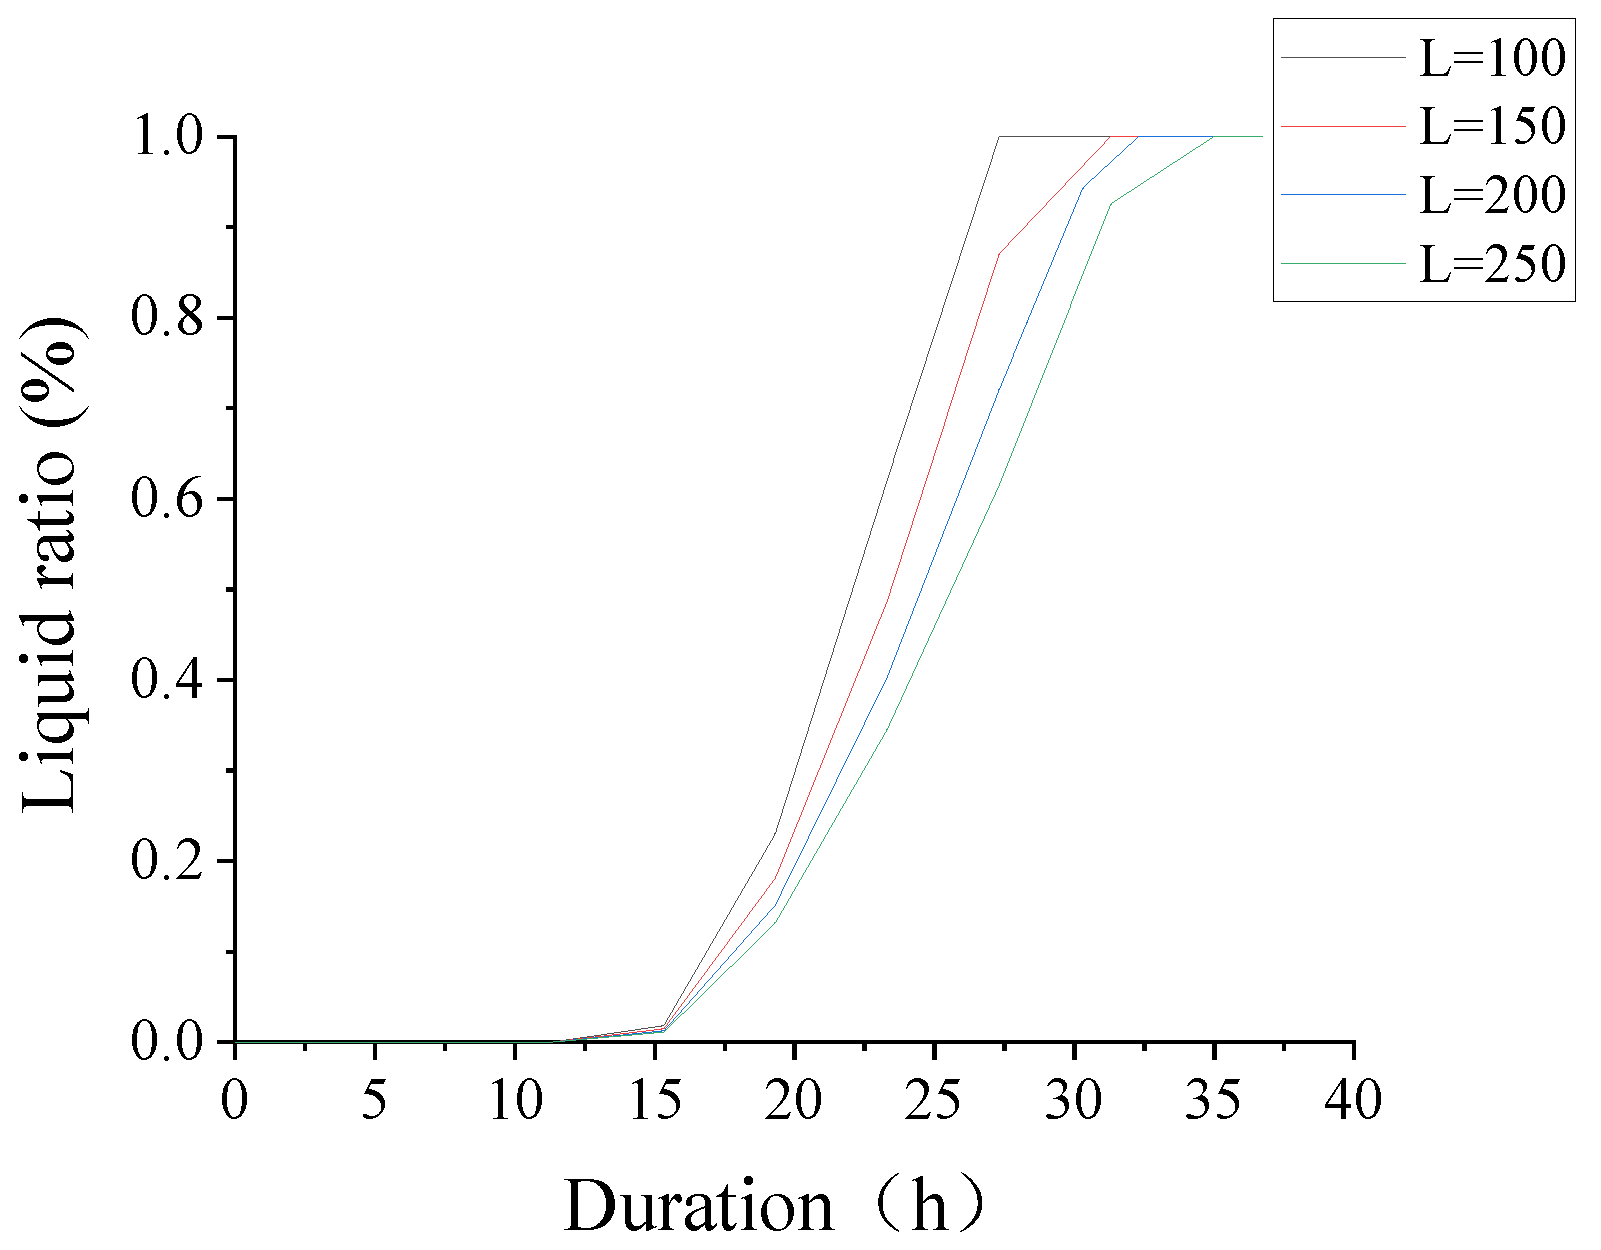
Figure 12 shows the guaranteed reservoir operation time under different latent heat values of phase change which increases with the increase in the latent heat value. Further analysis shows that, under simulated conditions, the slope increases more when the latent heat value increases from 100 kJ/kg to 200 kJ/kg than when the latent heat value increases from 200 kJ/kg to 250 kJ/kg. That is, with the further increase in the latent heat value, its influence on the guaranteed operation time of the reservoir decreases. In consideration of the reparability and economy of PCM with a high latent heat value, the availability and price of PCM should also be considered in practical engineering design. In a practical application, the PCM with a latent heat value of 200 kJ/kg has more types and a wider selection range than PCM with a latent heat value of 250 kJ/kg.
Table 5 shows the analysis of the influence of different latent heat values on the heat storage performance of the reservoir, wherein the working condition “0” refers to the heat storage process without a phase change heat storage module. As can be seen in
Table 5, the latent heat value of the PCM has great influence on the heat storage performance of the reservoir. The heat storage capacity per volume
and guaranteed heat storage efficiency coefficient
increase with the increase in latent heat value of PCMs.
5.1.3. Influence of Thermal Conductivity of PCMs on Heat Storage Performance of the Reservoir
The value Δλ = 0.3 is taken to analyze the influence of PCMs with thermal conductivity between 0.2 W/m·K and 1.1 W/m·K on the heat storage performance of the reservoir in underground engineering.
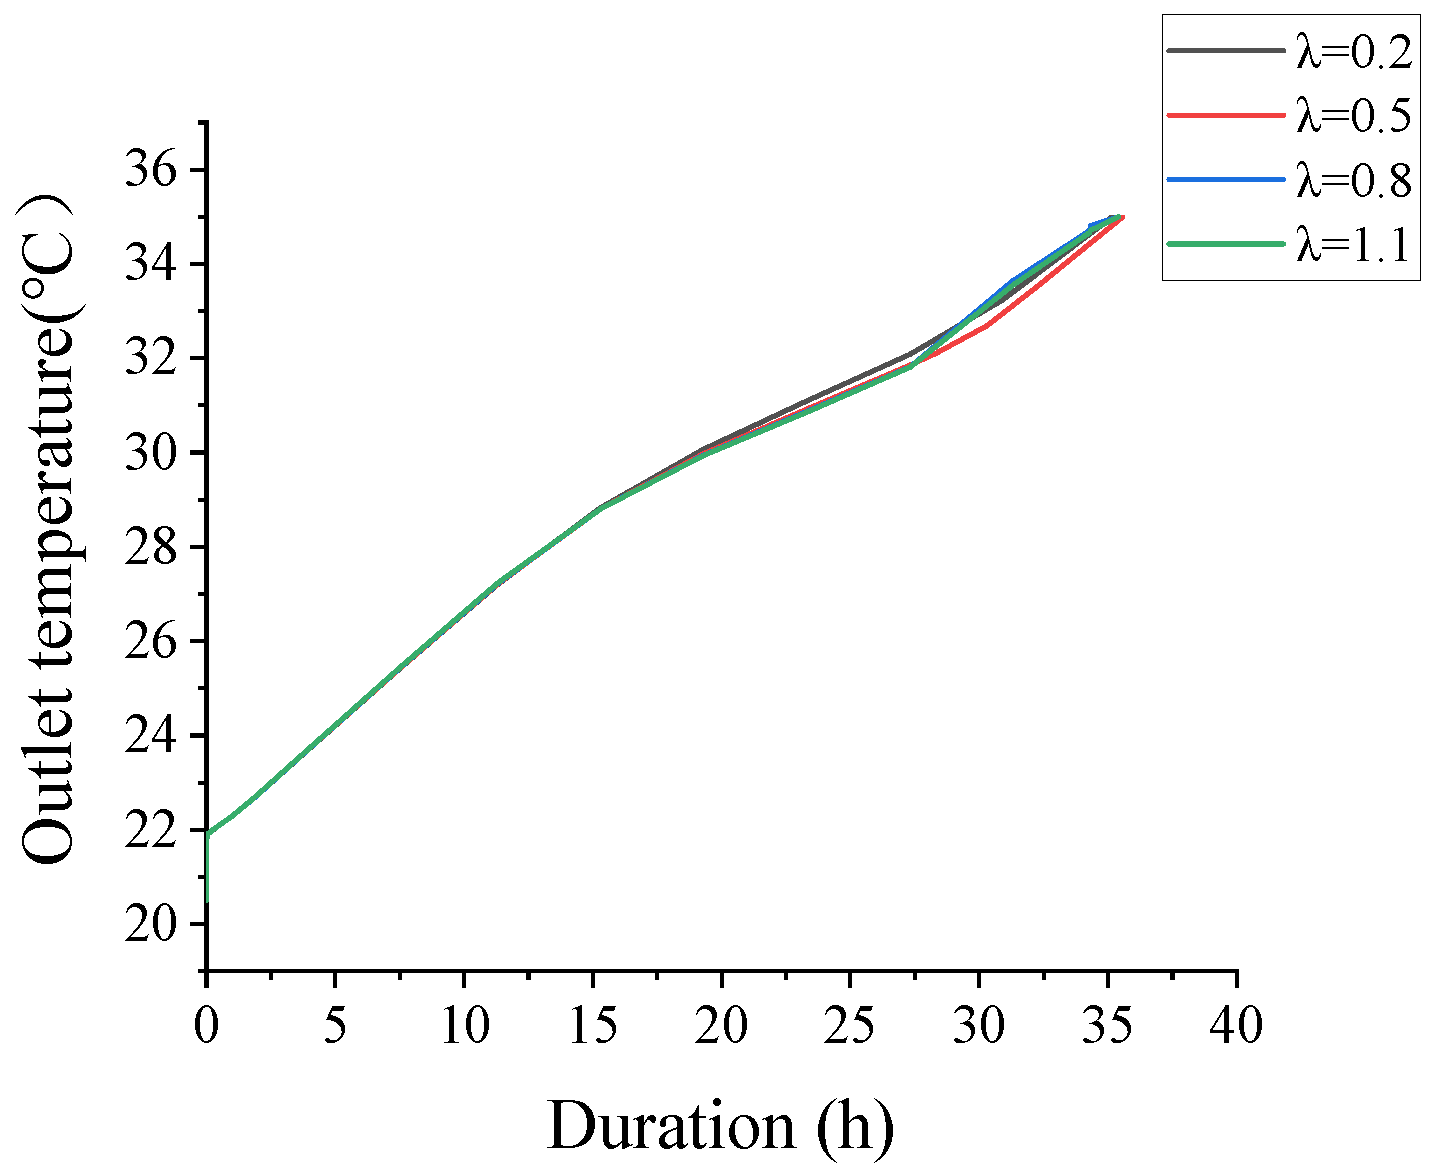
Figure 13 shows the influence of different thermal conductivity values on the outlet temperature of the reservoir. In
Figure 10 and
Figure 13, it can be seen that under the working conditions of different thermal conductivity values, the temperature change at the outlet of the reservoir generally presents three stages: the first stage of heat storage is dominated by sensible heat; the second stage of heat storage is dominated by latent heat; and the third stage of heat storage is dominated by sensible heat. The slope change at each stage of the temperature rise curve is the same as the previous.
It can be seen from
Figure 13 that the thermal conductivity has no obvious effect on the outlet temperature of the reservoir, and the four curves almost coincide. However, in the phase change heat storage stage, when the thermal conductivity is 0.2 W/m·K, the slope of the temperature rise in the second stage is higher than under other conditions. The duration of the second stage is longer than under other conditions. The reason is that, when the thermal conductivity value is lower, the melting rate of PCM is slower and the melting duration is longer. As can be seen from the previous analysis, the outlet temperature of the reservoir is significantly affected by the latent heat value and phase change temperature value of the PCM. The influence of thermal conductivity on the heat storage performance of the reservoir is the same under four working conditions in this section. Under the same latent heat value and phase change temperature, changing the thermal conductivity of PCM has little influence on the outlet temperature.
Figure 14 shows the influence of different thermal conductivity on the melting rate of PCMs. As can be seen from
Figure 14, the difference in the liquid-phase ratio curves increases as the thermal conductivity value increases from 0.2 W/m·K to 1.1 W/m·K. The higher the thermal conductivity value is, the higher the slope of the liquid–phase ratio curve is. This indicates that the melting rate of the PCM is faster, and the time required to complete the melting is shorter. The difference in the curves gradually decreases when λ > 0.5 W/m·K. The two liquid–phase curves with thermal conductivity values of 0.8 W/m·K and 1.1 W/m·K partially coincide after λ > 0.5 W/m·K. This indicates that, when the thermal conductivity value of PCM is low, the effect of improving the thermal conductivity to enhance the performance of the system is more obvious. When the thermal conductivity of the PCM increases to a certain extent, further increasing the thermal conductivity value will not have a significant effect on the phase change. The thermal conductivity value of PCMs in practical applications is generally very low, such as the use of paraffin wax in this study. According to the above analysis, the thermal conductivity of PCMs must be improved to make the phase change heat storage system run efficiently.
Figure 15 shows the influence of different thermal conductivity values on the guaranteed operation time of the reservoir. As can be seen from
Figure 15, the guaranteed operation time of the reservoir is the same with different thermal conductivities. This indicates that the thermal conductivity has no obvious influence on the total heat storage of the reservoir. However, increasing the thermal conductivity value can increase the melting rate of PCMs. In that case, it is feasible to enhance the heat transfer and can be considered in practical application. Under experimental conditions, when λ is 0.5 W/m·K, its thermal conductivity has little difference from that when its value is 0.8 W/m·K and 1.1 W/m·K. Compared with the high thermal conductivity value, it is easier to add graphite and other materials into the PCM to increase the thermal conductivity to 0.5 W/m·K. The heat storage of the system will change little due to the addition of fewer other substances. This can also avoid the possibility of reducing the heat storage capacity of the device when too many high thermal conductivity materials are added to the pure PCM.
Table 6 shows the analysis of the influence of different thermal conductivities on the heat storage performance of the reservoir, in which working condition “0” refers to the heat storage process of the reservoir without the phase change heat storage module. It can be seen from
Table 6 that the heat storage capacity per volume
and guaranteed heat storage efficiency coefficients
of the reservoirs with different thermal conductivity are the same. This means that the thermal conductivity value of PCM has little influence on the heat storage performance of the reservoir.
5.2. Influence of the Geometric Size of Phase Change Heat Storage Module on Heat Storage Performance of the Reservoir
On the premise of not changing the effective volume of the phase change heat storage module, which also refers to the content of PCMs in the module, the geometric size of the phase change heat storage module is changed to analyze the influence of the structural size of the module on the heat storage performance of the reservoir and the module. The geometric size simulation schemes of the phase change heat storage module are designed, as shown in
Table 7.
The heat storage process of the reservoir with different shapes of the modules was numerically simulated, and the influence of the shape on the heat storage performance of the reservoir was compared and analyzed. The aim was to determine the reasonable packaging and layout of PCMs. In each scheme, only the section size of the module was changed, and the length remains unchanged. The physical properties of PCMs are shown in
Table 3.
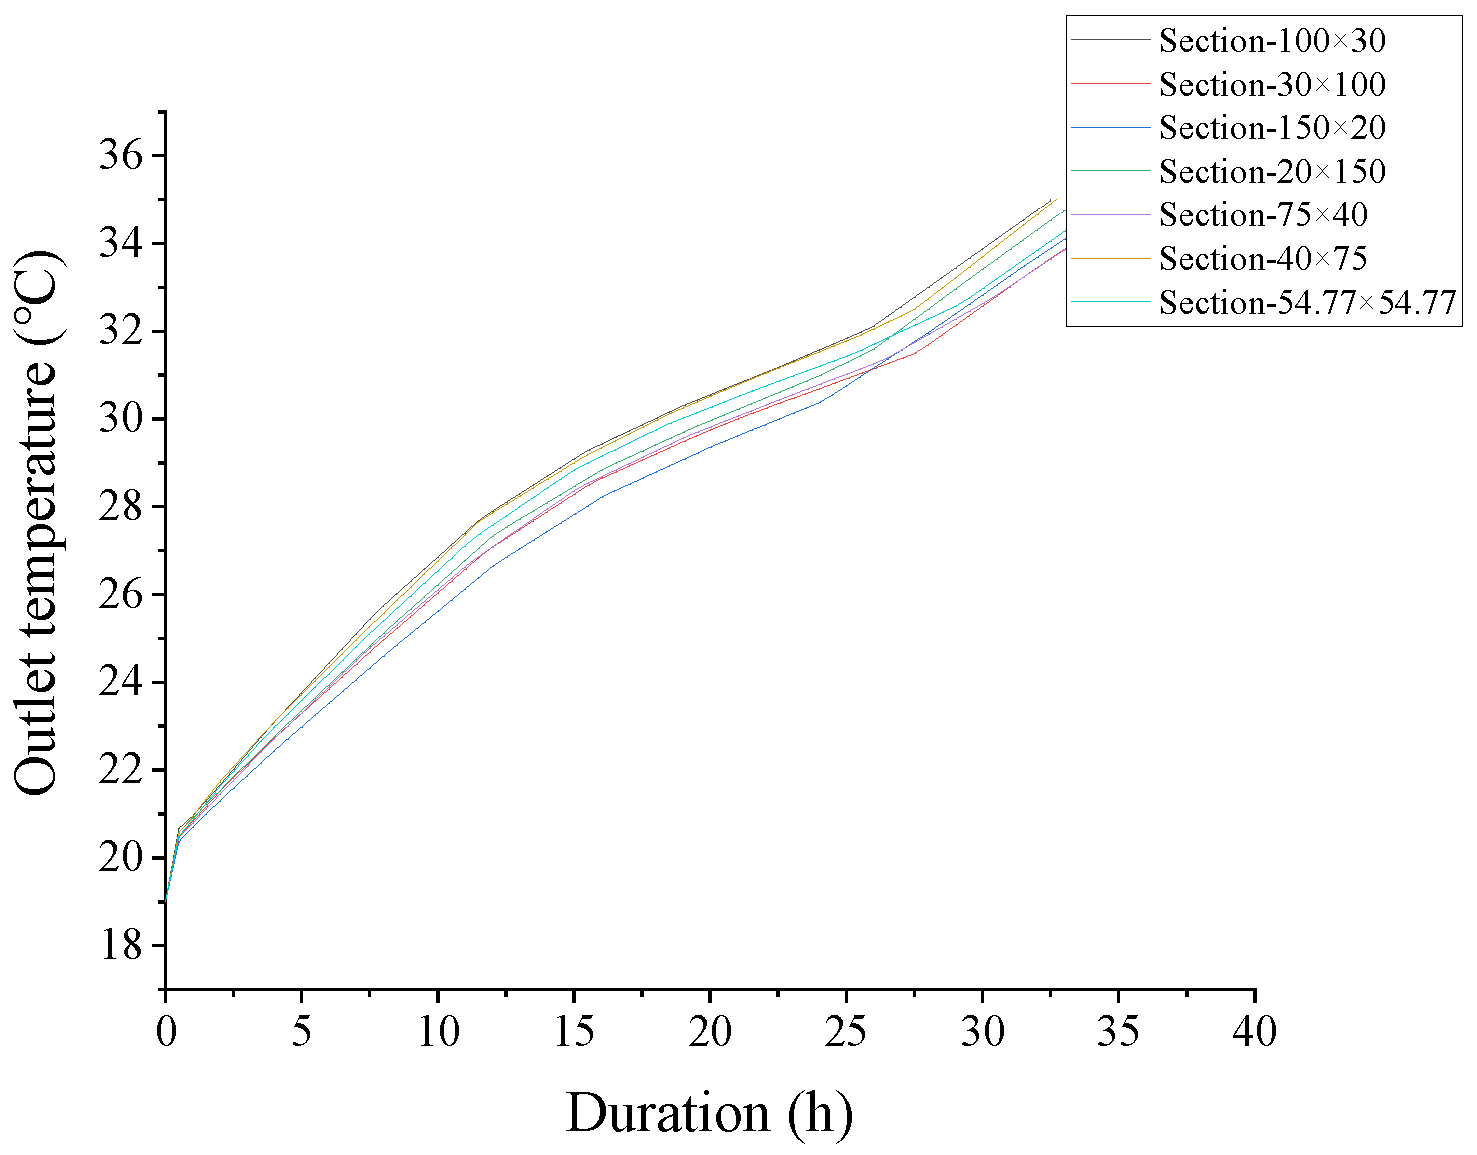
Figure 16 shows the influence of geometric dimensions of the phase change heat storage module on the outlet temperature of the reservoir. It can be seen from
Figure 16 that different geometric dimensions of the modules have a certain influence on the outlet temperature of the reservoir.
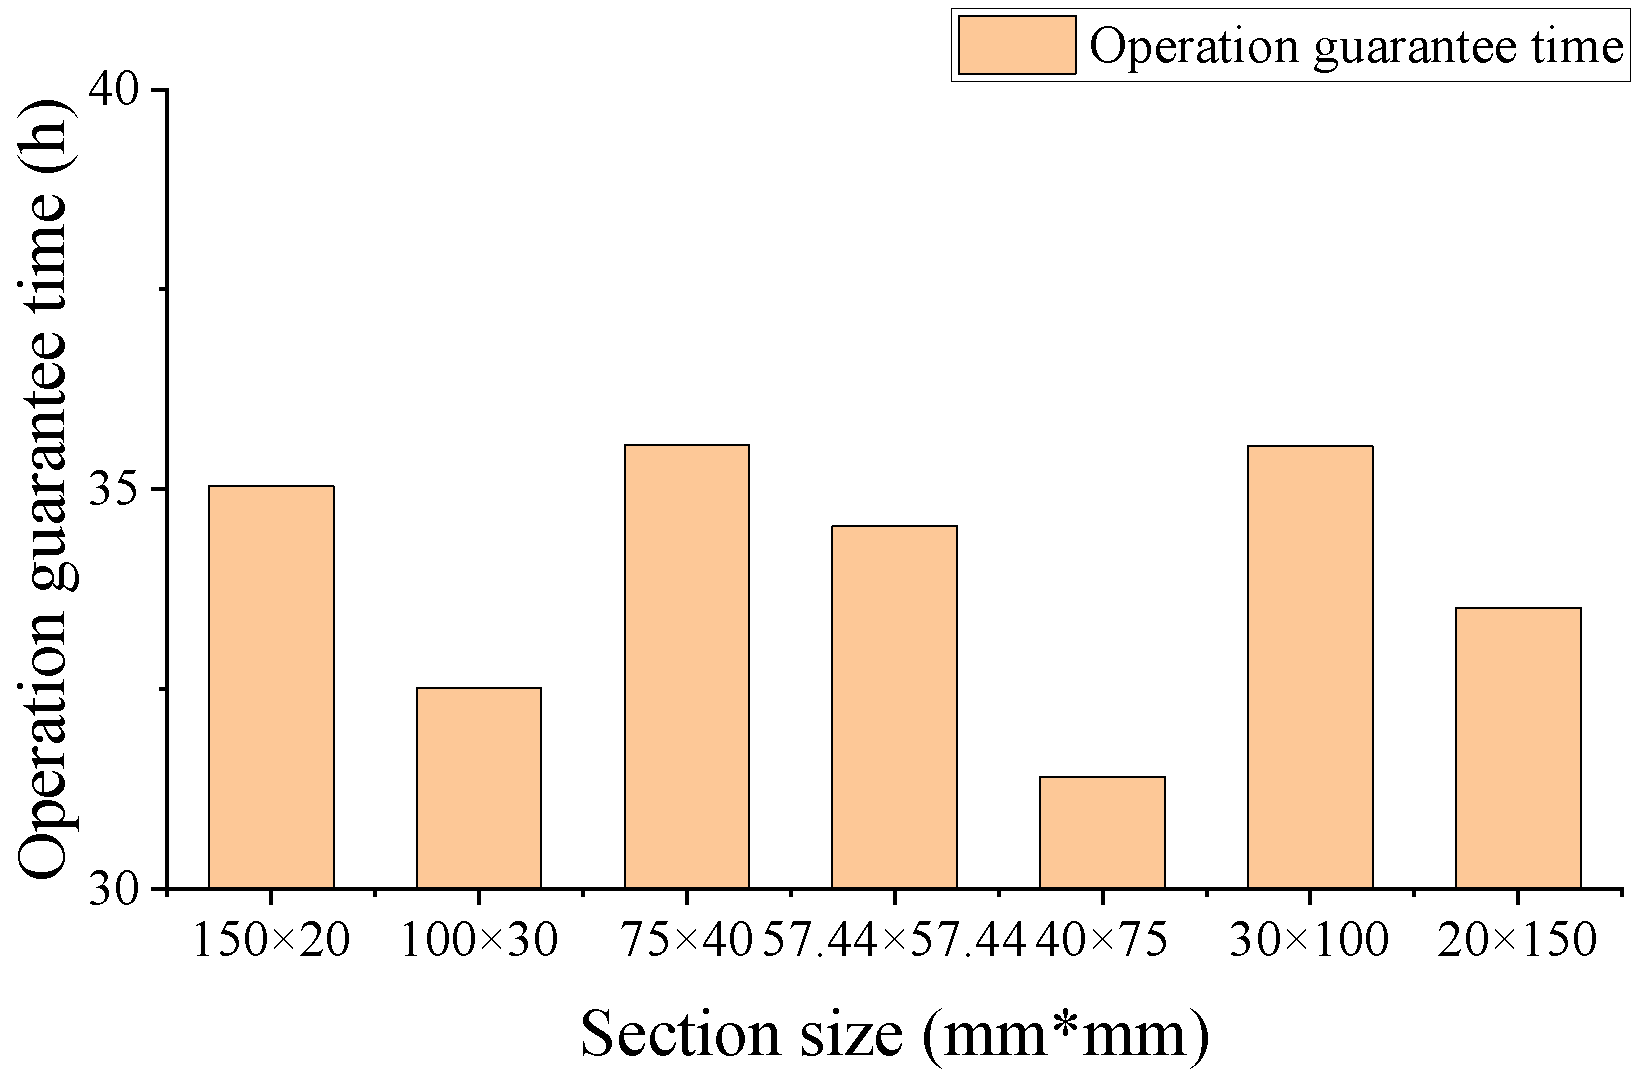
Figure 17 shows the simulated influence of the geometric dimensions of the module on the operation guaranteed time of the reservoir. According to the simulation calculation results, the order of a guaranteed operation time from long to short is: 75 mm × 40 mm, 30 mm × 100 mm, 150 mm × 20 mm, 57.44 mm × 57.44 mm, 20 mm × 150 mm, 40 mm × 75 mm and 100 mm × 30 mm.
Further analysis of the numerical model shows that the calculation grid needs to be redivided every time the geometric size of the module is changed. This is different from studying the change in the physical properties of PCMs. At the same time, affected by the step size of the simulation calculation, even though the external heating power input by the model is the same, there are still some calculation errors between working conditions, which are reflected in certain errors in the heat storage calculated by the water body, reservoir surface and phase change heat storage module. This will result in different calculated heat storage power. The calculated heat storage and calculated heat storage power values corresponding to the geometric dimensions of different phase change heat storage modules are shown in
Table 8. The results in the table are the values obtained by simulating the 40 h duration.
As shown in
Table 8, the heat storage power obtained by simulation calculation has certain errors under different conditions of the phase change heat storage module size. When the cross-section size change has little influence on the inlet and outlet water temperature, the difference in the guaranteed system operation time caused by this error may be greater than the change caused by actual different sizes. For example, in the numerical calculation, the guaranteed operation time is the longest when the section size of the module is 75 mm × 40 mm. However,
Table 8 shows that its calculated heat storage power is the lowest. As such, the influence of the section size on the guaranteed operation time cannot be scientifically evaluated. Therefore, when the calculated heat storage power is different, it is not advisable to judge the influence of the change of the module’s section size on the operation effect of the system based on the guaranteed operation time.
To avoid the effect of different calculated heat storage quantities of the reservoir on the efficiency, an improvement indicator appears to evaluate the heat storage performance of the underground air-conditioning reservoir. This indicator is ε, which refers to the slope of the temperature rise per unit load of the reservoir. It is defined as the ratio between the slope of the outlet temperature change with time and the heat storage power after the phase change heat storage reservoir runs for a period of time. Its calculation formula is:
where
is the slope of temperature rise per unit load of heat storage reservoir; and
is calculated heat storage power, kW.
In the same heating time, the lower the slope of temperature rise per unit load of the reservoir is, the slower the temperature rise at the outlet of the reservoir is, the longer it takes to reach the upper temperature of system operation and the stronger the guaranteed capacity of the reservoir is.
Table 9 shows the slope of temperature rise per unit load of reservoir corresponding to the geometric dimensions of different phase change heat storage modules. As can be seen from
Table 9, the slope of the temperature rise per unit load of the reservoir
does not change much under the different geometric dimensions of the module. The results show that the change in the module geometry has no obvious effect on the heat storage performance of the reservoir.
Further analysis shows that the module with a cross-section size of 150 mm × 20 mm has the minimum
value.
Figure 18 shows the
y–z section flow field distribution at the inlet center of the reservoir under different sizes of modules. To intuitively display the flow field distribution in the reservoir, the display range of the velocity field cloud map is 0–0.15 m/s, and the actual inlet flow rate is 0.55 m/s (the same below).
By
Figure 18b, section size 150 mm × 20 mm of the module has a more distinct phenomenon that shunts a high-temperature cooling water inflow from the reservoir entrance than other sizes. The water mixing effect is better and the heat exchange area is the largest. Under this section size of 150 mm × 20 mm, the slope value
of the temperature rise per unit load is smaller than that of other section sizes. In practical engineering applications, the size of the module should increase the heat exchange area as much as possible and promote the full mixing of heat.
5.3. Influence of Water Distribution Mode on Heat Storage Performance of Reservoir
As can be seen from the analysis of the influence of the size of the module on the heat storage performance of the reservoir, the change in the flow field in the reservoir has an impact on it. In this study, the influence of different water distribution modes on the heat storage performance of the reservoir was discussed. Different water distribution schemes were designed for the reservoir, as shown in
Table 10.
The heat storage process of the reservoir under different water distribution modes was numerically simulated. The influence on the heat storage performance of the reservoir was comparatively analyzed. The aim was to determine the optimal water inlet and outlet layout. The physical properties of PCMs selected in the research are shown in
Table 3. A 1/4 model of the reservoir with different water distribution modes is shown in
Figure 19.
Figure 20 shows the influence of the water distribution modes on the outlet temperature of the reservoir. It can be seen from
Figure 20 that the different water distribution modes have a great influence on the outlet temperature of the reservoir. The analysis shows that, among all water distribution modes, the optimal mode is the four-inlets–one-outlet water distribution mode. Under this circumstance, the duration required for the outlet water temperature to reach the upper operating temperature of the system is 40.2 h. In the case of the three-inlets–three-outlets-a water distribution mode, the duration required for the outlet water temperature to reach the upper operating temperature of the air-conditioning system is 28.7 h, which is the most unfavorable mode.
Figure 21 shows the influence of the simulated water distribution modes on a reservoir guaranteed operation time. According to the simulation results, the order of the guaranteed operation times from longest to shortest is four-inlets–one-outlet; four-inlets–four-outlets; two-inlets–two-outlets-b; two-inlets–two-outlets-a; three-inlets–three-outlets-b; one-inlet–one-outlet; and three-inlets–three-outlets-a.
Further analysis of the numerical model shows that there are still some calculation errors between the different water distribution modes, which is the same as in the study of the geometric size change of the phase change heat storage module. This refers to the fact that there are errors when calculating the heat storage quantity by the water, the surface and the phase change heat storage module. This leads to the difference in calculating the heat storage power. Different heat storage quantities and their power are calculated by various water distributions, which can be seen in
Table 11. The calculated heat storage and e power values of each working condition in the table are the values obtained by simulating for 40 h.
As shown in
Table 11, under different conditions of water distribution, the heat storage power obtained by the simulation calculation also has certain errors, and the fluctuation range is larger than the error value under the different conditions of the geometric size change of phase transition module. Due to the existence of the error, the conclusion of the influence the water distribution mode on the guaranteed operation time cannot be scientifically drawn. For example, in the above analysis, the four-inlets–one-outlet water distribution mode has the longest guaranteed operation time. Nevertheless, its calculated heat storage power is the lowest according to
Table 11. The three-inlets–three-outlets-a water distribution mode is the most unfavorable, but its calculated heat storage power is the highest. Therefore, when the calculated heat storage power values are different, it is not advisable to judge the influence of water distribution modes according to the guaranteed operation time.
To avoid the influence of different heat storage quantities on the evaluation of the guaranteed capacity of the reservoir, the slope of temperature rise per unit load of the reservoir was also used as an evaluation index to investigate the influence of the water distribution mode on the system operation.
Table 12 shows the slope of temperature rise per unit load of reservoirs corresponding to different water distribution modes. It can be seen from
Table 12 that the slope of temperature rise per unit load
of the reservoir varies greatly under different water distribution modes. This indicates that the change in water distribution mode has an obvious influence on the heat storage performance.
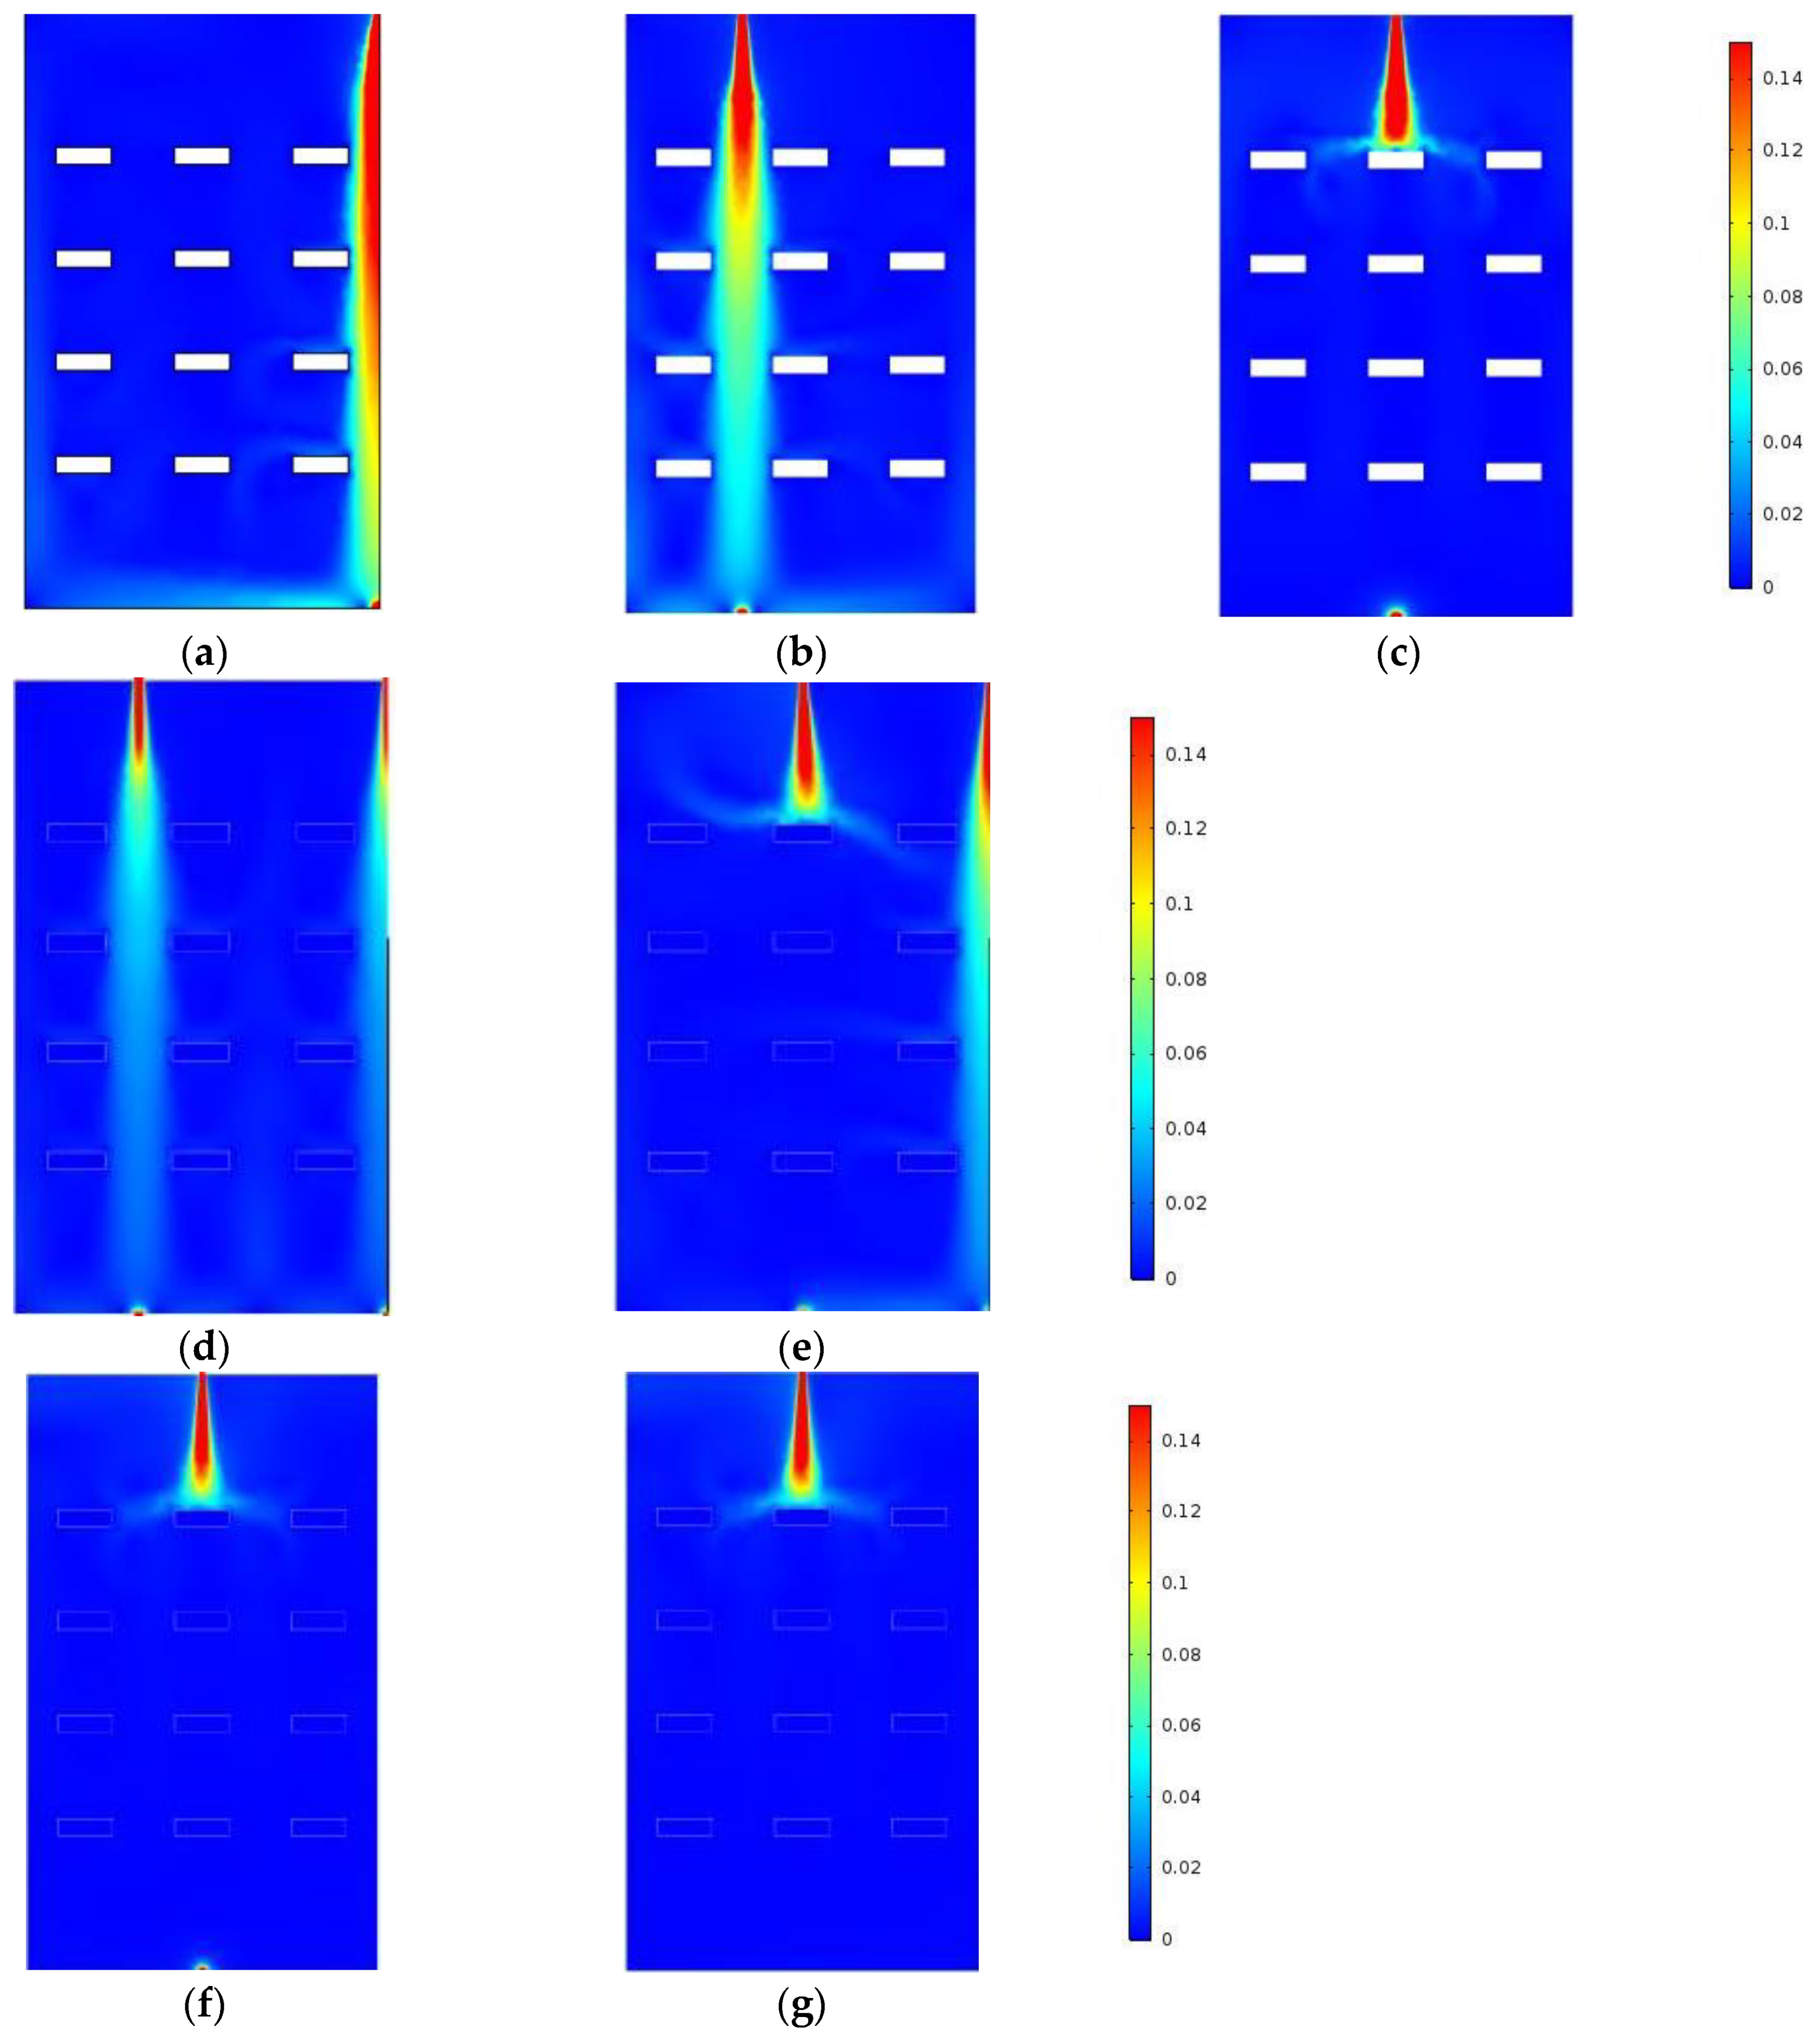
Figure 22 and
Figure 23, respectively, show the flow field and temperature distribution of the
y–z section air-conditioning reservoir at the inlet center under different water distribution modes. The analysis shows that the flow field and temperature distribution in the reservoir differ greatly under different water distribution modes. In
Figure 22a,b,d, the modes whose temperature rise slope is high are one-inlet–one-outlet, two-inlets–two-outlets-a and three-inlets–three-outlets-a. After the fluid enters the reservoir from the inlet, the water flows downward along the gap of the module. The flow velocity on the inlet and outlet channel of the reservoir is high, and the flow retention area in the reservoir is large. Corresponding to
Figure 23a,b,d, the temperature in the inlet and outlet passage of the reservoir is high, and the temperature distribution in the reservoir is not uniform. As a result, when the outlet temperature has reached its limitation, the temperature in most areas of the reservoir has not reached the upper limit of the system, and the heat storage effect of the reservoir is not good. As shown in
Figure 23d, especially under the conditions of three-inlets–three-outlets-a, due to the influence of the flow field in this arrangement, there is an obvious thermal short circuit phenomenon between the exits. Heat accumulates at the outlet, causing the outlet temperature to be significantly higher than that of the area outside the inlet and outlet passage. Thus, the slope value of the temperature rise per unit load is large, and the guaranteed operation capacity of the reservoir is poor.
By
Figure 22c,e,f, the modes whose temperature rise slope is low are two-inlets–two-outlets-b, three-inlets–three-outlets-b and four-inlets–four-outlets. After the fluid enters the reservoir from the inlet, the water flow scours the phase change heat storage module, and the water flow is strongly disturbed. The flow field in the reservoir is evenly distributed, and no high-speed passage is formed between the inlet and outlet. Corresponding to
Figure 23c,e,f, the quantity of heat quickly spreads around. The temperature field in the reservoir is evenly distributed, and there is no obvious temperature difference between the outlet of the reservoir and the surrounding water. This means that the slope value of the temperature rise per unit load is small, and the guaranteed reservoir operation capacity is good.
As shown in
Figure 22e, under the distribution of three-inlets–three-outlets-b, the inlet and outlet located in the middle failed to flush the phase change heat storage module. The thermal short circuit still exists in the middle inlet and outlet channel, as shown in
Figure 23e. Therefore, with the comparison between two-inlets–two-outlets-b and four-inlets– four-outlets, the slope of the temperature rise per unit load of three-inlets–three-outlets-b is slightly larger, and the reservoir guaranteed operation capacity is slightly poor. Compared with two-inlets–two-outlets-b, the four-inlets–four-outlets water distribution mode has a more uniform water distribution, larger area of scouring phase change heat storage module, more obvious flow disturbance and more significant heat diffusion. The slope value of temperature rise per unit load is smaller, and the guaranteed reservoir operation capacity is better.
To further investigate the influence of the outlet change on the heat storage performance of the reservoir, four-inlets–four-outlets-and four-inlets–one-outlet were compared. It can be seen from
Figure 22f,g that the flow field distribution in the reservoir is consistent. The corresponding temperature field distribution in the reservoir is also basically consistent, as shown in
Figure 23f,g. Meanwhile, it can be seen from
Table 10 that the slope of temperature rise per unit load
of the reservoir is the same. In the case of the reservoir layout of four inlets, there is no significant difference between the one outlet and four outlets.
To sum up, the water distribution modes of the reservoir show obvious disturbances in the water body, which affect the heat exchange and the overall heat storage effect. Therefore, in the upper-to-lower mode of water distribution, the thermal short circuit between the inlet and outlet should be avoided. The layout position of the phase change heat storage module in the reservoir should be fully utilized to enhance the water flow disturbance so that the inlet water flow can exchange heat with the water in the reservoir as soon as possible. Under the modeling conditions established in this research, it is necessary to make the water flow directly scour the module, instead of arranging the water inlet and outlet towards the gap between them. In addition to the above conditions, the uniform water distribution mode with multiple inlets is more conducive to enhancing the heat storage capacity of the reservoir and improving the guaranteed operation time of the system.


