Article

Synthesis and Mechanical Properties of Polyacrylamide Gel Doped with Graphene Oxide

1
State Key Laboratory of Heavy Oil Processing at Karamay, China University of Petroleum-Beijing at Karamay, Karamay 834000, China
2
Xinjiang Uygur Autonomous Region Product Quality Supervision and Inspection Institute, Urumqi 830000, China
3
Institute of Unconventional Oil and Gas Science and Technology, China University of Petroleum, Beijing 102200, China
4
School of Information Engineering, China University of Geosciences, Beijing 100083, China
*
Authors to whom correspondence should be addressed.
These authors contributed equally to this work and share first authorship.
Energies 2022, 15(15), 5714; https://doi.org/10.3390/en15155714
Submission received: 27 May 2022 / Revised: 28 July 2022 / Accepted: 2 August 2022 / Published: 5 August 2022
(This article belongs to the Topic Enhanced Oil Recovery Technologies)

Abstract

:
Polyacrylamide (PAM)/polyethyleneimine (PEI) gels doped with graphene oxide (GO) were prepared. Their structure and properties were systematically studied by X-ray diffraction (XRD), Fourier transition infrared spectrum (FT-IR), Raman spectroscopy, scanning electron microscopy (SEM), differential scanning calorimetry (DSC), and rheological experiments. The results showed that the graphene oxide (GO) nanosheets were significantly involved in the cross-linking reaction between the main agent (PAM) and the cross-linker (PEI), serving as multi-functional cross-linker and effective reinforcing nanofillers. Increasing the main agent and cross-linker content, the strength of gels was enhanced effectively. The GO could effectively adjust the strength and the gelation time to exhibit characteristics of weak gel, thanks to the improved three-dimensional honeycombed structure with controllable pore size. The DSC confirmed that the PAM/PEI/GO gel exhibited excellent thermal stability and did not dehydrate above 170 °C. This work provides theoretical support for further optimization of polyacrylamide gel used in ultra-deep and high-temperature reservoirs for water control.

1. Introduction

After years of water-driving development, low-permeability reservoirs are generally in high water cut or excessive water cut stages [1,2,3], and the oil recovery is decreasing in the middle and late periods of oilfield exploitation. As a kind of chemical method for water control, polyacrylamide polymer gel mainly expands the flow profile of crude oil by blocking the water flow channel and preventing the water from blocking the oil flow channel, so as to further improve oil recovery. It has the characteristics of being controllable, with easy injection and strong selectivity to high aquifer, and is widely used in oil field exploitation [4,5,6]. However, conventional polyacrylamide gels have insufficient thermal stability (<150 °C) and their strength is too high and difficult to control. This limits their application in ultra-deep (5300~7000 m) and high-temperature (>150 °C) reservoirs, which need weak and high temperature-resistant gels because it is difficult for the strong gel to reach deep places to achieve the effect of water control [7]. Therefore, it is of great significance to develop a polyacrylamide gel with moderate strength and high temperature resistance for enhancing oil recovery in ultra-deep reservoirs.
Extensive research has been performed on polyacrylamide gels to address this problem. Cross-linkers are essential for improving the thermal stability of polyacrylamide gels and can be divided into two main categories, namely, organic cross-linking systems, such as phenolic resin, polyethylene imine (PEI), hydroquinone (HQ), and hexamethylenetetramine (HMTA) [6,7,8], and inorganic cross-linked systems, such as Cr(III), Al(III), and Zr(IV) [9,10,11]. Inorganic cross-linking systems are complexed with the carboxyl group on the polyacrylamide, while organic cross-linking systems mainly react with the amide group on the polyacrylamide molecule [7], cross-linking to generate a three-dimensional network structure insoluble in water. Although most organic and inorganic polyacrylamide gels have excellent thermal stability at 140 °C, and some gels have good cyclic compression performance with elongation at break up to 1000% and compressive strength up to 0–2 MPa, their temperature resistance is generally less than 150 °C, and their high strength makes them difficult to inject into deeper Wells [12,13,14,15]. They are mainly used in low-temperature reservoirs with shallow depth and have poor performance for water control in high-temperature deep wells.
In recent years, in order to further improve the thermal stability and strength of gels, grafting copolymers of natural polysaccharides and synthetic polymers (namely starch-grafted polymers) and the modification of nanoparticles have been used to obtain gels with better physical properties. Graft copolymerization of natural and functional synthetic polymers can alter the structure of natural polymers, making them suitable for a variety of applications, such as flocculants in mature reservoirs, controlled drug releases, and oil extraction treatments. Because the polyacrylamide chain attaches to the rigid polysaccharide main chain and reacts with different cross-linking agents to form a three-dimensional (3D) hydrophilic network hydrogel, the grafted polymers have superior physical properties such as high thermal stability and shear stability [16,17,18]. In addition, some researchers have introduced nanoparticles into hydrogels to improve the performance of hydrogels. Compared with starch-grafted polymers, the introduction of nanoparticles can further improve the thermal stability and mechanical strength of hydrogels, as well as higher ductility and elasticity, which can adapt to most complex reservoir environments to a certain extent [19,20,21,22]. Shamlooh et al. [23] studied the effects of different nano-SiO2 sizes (8, 20, 50 and 85 nm) and concentrations (0.1–2.0 wt. %) on the stability and viscoelasticity of polyacrylamide (PAM) cross-linked with polyethylene imine (PEI) at 130 °C. They found that by adding 2 wt.% of 50 nm SiO2 to the polymer-based solution, the gel strength increased by more than 300%. Although starch-grafted polymers and nanoparticles modified hydrogels can maintain good thermal stability at 170 °C, their strength is too high to be regulated, and their applicability to water control in deep and ultra-deep wells where weak gel is needed is poor.
Recently, graphene oxide (GO) as a kind of nanoparticle has attracted great attention from researchers due to its excellent mechanical properties. GO is a derivative of graphene. Its two-dimensional monolayer contains a large number of hydrophilic hydroxyl and epoxy groups (Figure 1). It is easy to peel off and disperse stably into monolayer sheets in aqueous solution, which is conducive to the preparation of nano-composite hydrogels with excellent mechanical properties [22]. In addition, the large surface area and functional groups provide many active sites for GO modification, which makes it easy to access functional groups with specific functions to regulate its physical and chemical properties, and then modify the rheological properties of polyacrylamide gel [24,25,26]. Sun et al. [27] prepared a GO–polyacrylamide composite scaffold with adjustable stiffness. Dong et al. [28] studied the preparation and adsorption performance of GO–polyacrylamide composite aerogel. The results showed that under the same experimental conditions, the larger the amount of aerogel, the longer the adsorption time, and the better the adsorption performance. The adsorption effect of aerogel was the best under acidic conditions, and the temperature had little effect on the adsorption. Fathinejad et al. [29] studied the synthesis and swelling behavior of hydrogel nanocomposites based on acrylamide, GO, and PAMINE, and the results obtained from water absorption and swelling value in buffer solution showed that the hydrogel synthesized by doping GO has high water absorption capacity. Yan et al. [30] prepared a compound double cross-linked hydrogel of gelatin/polyacrylamide/GO/N, N′-methyl-bis-acrylamide. They found that the swelling rate of the hydrogel decreased by about 60%, the yield stress increased by nearly two times, and the energy dissipation capacity increased. In addition, GO will block the movement of the gelatin molecular chain to a certain extent, so that the self-recovery ability of gel decreases, indicating that the introduction of GO can adjust the strength of hydrogel to a certain extent. Although researchers have carried out some studies on the synthesis and properties of GO hydrogel, these results were all obtained at low temperature (<80 °C), and its high-temperature stability is not clear yet. In addition, polyethylene imine (PEI) is a green and environmentally friendly cross-linker in an organic cross-linking system, which produces less pollution and can form a stable hydrogel with acrylamide in a wide temperature range. It has good comprehensive suitability in oil fields and is one of the hot spots of cross-linker research today [31,32]. However, studies on hydrogels prepared by using PEI as cross-linker and GO as nanoparticles are very limited, and their applicability under reservoir conditions is not clear.
Therefore, in order to better understand the influence of GO on the mechanical properties and thermal stability of PAM/PEI gel system, a novel, composite, cross-linked polyacrylamide gel (PAM/PEI/GO) with long-term thermal stability for water control in high-temperature and ultra-deep reservoirs at 160 °C is developed in this study. X-ray diffraction (XRD), infrared spectrum (FT-IR), and Raman spectroscopy were used to evaluate characteristic group changes of GO nanosheets in the gel matrix. The rheological properties of the composite gels were studied by measuring their viscoelasticity, creep recovery, and yield stress, and the changes in the three-dimensional network structure and thermal stability were studied by scanning electron microscopy (SEM) and differential thermal analysis (DSC).

2. Experimental Section

2.1. Materials

Polyacrylamide (PAM) (number average molecular weight: 50,000) and polyethyleneimine (PEI) (number average molecular weight: 10,000), both analytical purities, were purchased from Yi’en Chemical Technology Co. Ltd., Shanghai, China; aqueous graphene oxide (GO) solution (2 mg/mL), whose TEM picture is shown in Figure 2, was purchased from Suzhou Tanfeng Graphene Technology Co. Ltd., Suzhou, China. All concentrations reported in this paper are on a weight basis.

2.2. Experimental Apparatus

The magnetic stirrer (Model SH-3) and the electric blast dryer (101 type) were both supplied by Beijing Yongguangming Medical Instrument Co. Ltd., Beijing, China. The CNC ultrasonic cleaner (KQ2200DE) and the electronic balance (JJ124BC type) were purchased from Kunshan Ultrasonic Instrument Co. and Changshu Shuangjie Testing Instrument Factory, respectively. The field emission environmental scanning electron microscope (SEM, Quanta 200 F, FEI Co., Hillsboro, OR, USA) was used for the morphological observations test. Fourier transform infrared spectroscopy (FT-IR) (Perkin Elmer Spectrum100), Raman spectroscopy (Takram P50C0R10 Raman spectrometer), and XRD patterns (EQUINOX 3000, INEL, France) were used for the structure characterization.

2.3. Preparation of PAM/PEI/GO Hydrogels

Graphite oxide was prepared via the modified Hummers method [33]. The synthesis of the PAM/PEI/GO gels was as follows. Briefly, 20 mL aqueous GO solution was firstly added to 200 mL neutral deionized water drop by drop with stirring at a constant speed; then, the diluted GO solution was ultrasonically dispersed for 1 h. Successively, PAM and PEI with certain concentrations were slowly added into the GO solution at 60 °C under N2 protection and stirred for 30 min to produce a homogeneous gelant solution. Finally, approximately 50 mL of the produced gelant solution was moved into a glass tube in which the air had been replaced by N2 and sealed. The cross-linking reaction was initiated when the sealed glass tube was placed in an 80 °C oven and lasted for about 48 h. PAM/PEI gels were also synthesized by the same procedure without GO nanosheets. The concentrations of PAM, GO, and cross-linker PEI that were investigated are listed in Table 1. The concentrations of PAM, PEI, and GO in this study were determined by referring to previous work [23,29,30]. We tried from low concentrations to high concentrations and choose a concentration range in which the mechanical properties of synthesized gels change obviously to investigate in this study. The cross-linking mechanism of PAM with PEI and flowchart of GO-doped PAM gel are shown in Figure 3 and Figure 4, respectively. The nitrogen in the amide group on PAM, which is negatively charged, attacks the carbon in the methylene group on PEI, which is positively charged, resulting in a nucleophilic substitution reaction between the amide groups and the methylene group. By undergoing the cross-linking reaction, polyacrylamide can form a 3D network structure, which in turn forms a gel. After incorporating with GO, the hydroxyl groups on GO nanosheets form covalent bonds with carboxyl groups on polyacrylamide through an esterification reaction, which loads the gel molecules onto GO nanosheets, forming a 3D network structure with GO as a kind of cross-linker.

2.4. Gel Rheological Property Evaluation Experiment

The rheological properties of hydrogels were measured by the HAAKE MARS600 version rheometer (HAAKE, Germany). The measurement sensor was equipped with a parallel-plate geometry (PP20) with a gap of 1 mm. The sample was cut into uniform sizes with a diameter of 10 mm and a height of 7 mm. Initially, the measurements were set up in a stress oscillation scan model with a stress range of 0 to 250 Pa and a shear frequency of 0.5 Hz to obtain a linear viscoelastic range, followed by frequency scan tests at a fixed frequency of 0.5 Hz to achieve elastic modulus or storage modulus (G’) and viscous modulus or loss modulus (G’’) curves as a function of time. All the tests were carried out at 30 °C.
(1) Viscoelasticity
The elastic properties of the viscoelastic fluids were characterized by the storage modulus G’, and the viscous properties by the loss modulus G’’. The experiments were carried out at 30 °C for strain scanning of the samples, and the linear viscoelastic properties were selected at a shear stress of 5 Pa and an oscillation frequency of 0.10 to 5.00 Hz; then, the viscoelastic change curves were obtained by oscillation frequency sweep conducted on different systems.
(2) Yield stress
The yield stress of the sample was tested at 30 °C by control stress (CS) scanning mode in the stress range of 0 to 1000 Pa. When the applied stress of the gel between the rotor and the plate was close to the yield stress of the gel itself, the gel started to follow the rotation of the rotor and produced a certain shear rate, and the critical applied stress was the yield stress of the gel. The yield stress was a characterization of the solid strength of the sample and related to the sample composition, homogeneity, and gel formation state.
(3) Creeping reversion properties
Creep is a phenomenon in which the strain of a material changes with time under the condition of constant applied stress. It is caused by the realignment of the molecular structure of the material, and when the applied stress is removed, the material deformation partially returns to its starting state.
The creep–recovery curve of the sample was tested at 30 °C using the control stress (CS) measurement mode. In r = J/t, r is the dependent variable related to time and J is the creep compliance, which is the time-dependent material constant. At a given stress, the higher the compliance of the sample was, the easier the sample was deformed. In the test phase, constant shear stress of 300 Pa was applied to the sample in the time range from 0 to 90 s, called the creep phase, and the shear stress was reduced to 0 in the time range from 90 to 180 s, called the recovery phase; thus, the ability of the gel to recover after deformation was measured.

2.5. Scanning Electron Microscopy

(1) To observe the microstructure of hydrogel and distribution morphology of nanographene oxide, quanta 200F scanning electron microscopy (SEM) (FEI Company) was utilized, choosing annular gaseous secondary electron detector (GSED) at a low-vacuum model. Then, 0.10 mL gel sample was placed into one of the three grooves on the copper cylinder and frozen totally with liquid nitrogen for 10 min, and the copper cylinder loading frozen gel was put into the sample chamber. The observation proceeded with the ice on the surface of the sample slowly sublimating.
(2) Cross-sections of samples were investigated by scanning electron microscopy using the same instrument or the Hitachi SU8010 cold field emission scanning electron microscope, with the sample frozen with liquid nitrogen and vacuum dried, and the cross-section of gel was gold plated and to be observed later in the sample chamber.

2.6. Transmission Electron Microscopy

Transmission electron microscopy (TEM) of the sample was characterized by an FEI F20 transmission electron microscope with an informal resolution of 0.2 nm. A drop of GO sample was spread onto a micro-mesh placed on a filter, and then the micro-screen containing the sample was placed under an infrared searchlight for 10 min. The sample was allowed to dry completely on the surface of the sieve and was observed in the sample chamber.

2.7. Structure Characterization

The structural properties of GO and hydrogels were analyzed by Fourier transform infrared spectroscopy (FT-IR) (Perkin Elmer Spectrum100, a resolution of 4.0 cm−1). Aqueous hydrogels were frozen at −20 °C, and then dried under vacuum at −10 °C for two days using a FreeZone Triad Freeze Dry System. XRD patterns were performed on an EQUINOX 3000 XRD (INEL) with Cu-Kα radiation over a 2θ range of 5–30° with a scanning rate of 4°/min. Raman spectroscopy was carried out on Takram P50C0R10 Raman spectrometer at an excitation wavelength of 532 nm from 400 to 3500 cm−1.

2.8. DSC Analysis

Differential scanning calorimetry (DSC) analysis was performed using the STA409PC (NETZSCH, German) simultaneous thermal analyzer. The thermal stability curve of the gel in the temperature range of 0 to 400 °C was measured at 10 °C/min under a nitrogen source of 60 mL/min.

3. Results and Discussion

3.1. Structural Characterization

The appearance pictures of GO-doped polyacrylamide gels formed by 2.0 wt.% main agent (PAM), 0.1 wt.% cross-linker (PEI), and different concentrations of GO at 70 °C are shown in Figure 5. It can be seen from Figure 5 that the black GO powder dispersed in the gels, and with increasing of GO concentration, the polyacrylamide gel shows a darker black color.
Figure 6 presents the structural characterization of the GO and GO-doped PAM gel by using XRD, FT-IR, and Raman spectroscopy technologies. It can be seen from the XRD results in Figure 6a that GO exhibits one prominent peak at 26.48°, and the gels with 0.08 wt.% GO and 0.16 wt.% GO have no obvious sharp peaks, indicating that GO nanosheets had been significantly exfoliated in the gel. As described before [34], the FT-IR spectrum of GO (red curve in Figure 6b) shows the existence of -OH stretching band at 3200–3400 cm−1. Polyacrylamide gel without GO is characterized for comparison, and its main characteristic groups are identified by a yellow curve. The absorption bands at 1621, 1515, 1234, and 3278 cm−1 are assigned to the amide I vibration (C=O), amide II bending vibration (N-H), and amide III, with the formation of C-O (1165 and 1067 cm−1) and N-H stretching, respectively. After GO doped into the polyacrylamide gel, the peaks within the range of 1600–1000 cm−1 gradually disappear with the increasing GO content. This is attributed to the formation of ammonium carboxylate complexes between the carboxyl groups on the GO nanosheets and the amino-functional groups in polyacrylamide. The characteristics of amide I vibration and amide II bending vibration from polyacrylamide dominate the gel studied, covering the characteristics of C=C vibration from GO.
In Figure 6c, two major peaks at 1354 and 1587 cm−1 can be observed for GO, corresponding to the D band and G band, respectively. The neat polyacrylamide gel also exhibits these two peaks at 1344 and 1599 cm−1. Furthermore, the structural defects of graphene are usually characterized by the intensity of the D band to the G band (ID/IG), and the decrease in ID/IG values indicates a reduction of sp3 C in graphene. One can see from Figure 6c that the value of ID/IG decreases from 0.853 for GO to 0.807 for the PAM/PEI/GO gel, indicating that a small amount of GO has been partially reduced into graphene in the PAM/PEI/GO gel. A similar phenomenon was also observed by Yan et al. [30].

3.2. Rheological Properties of the Gels

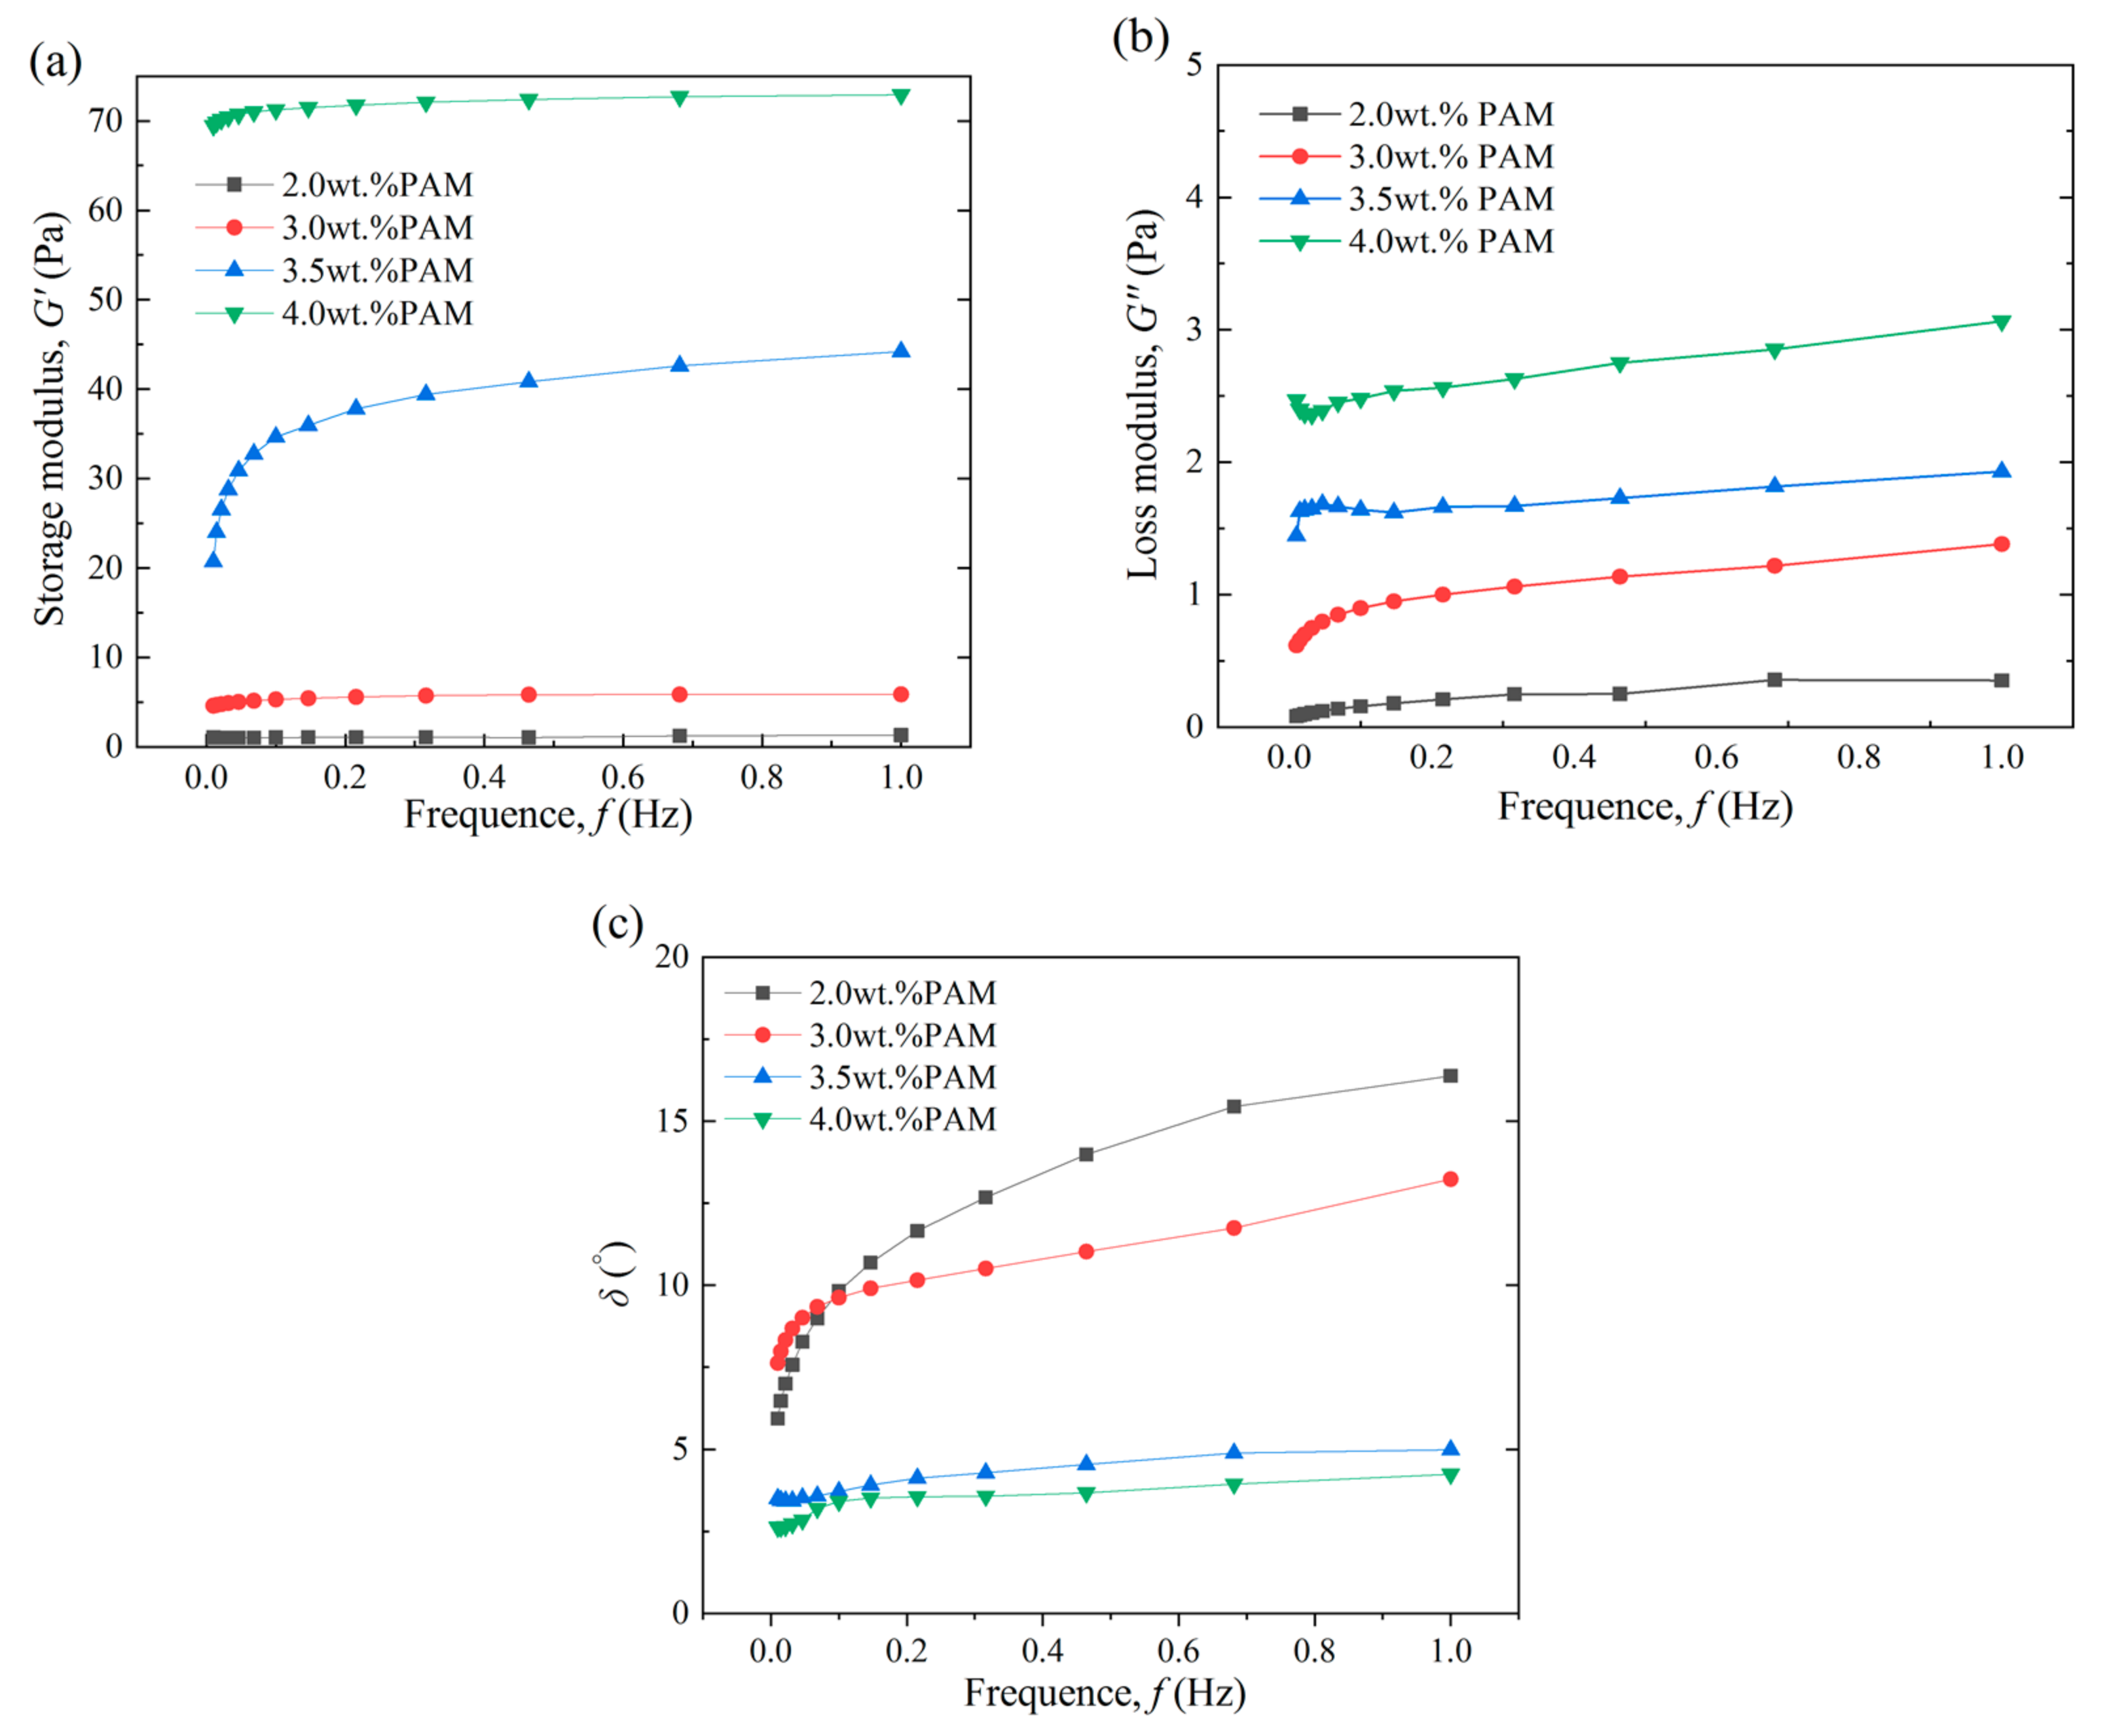
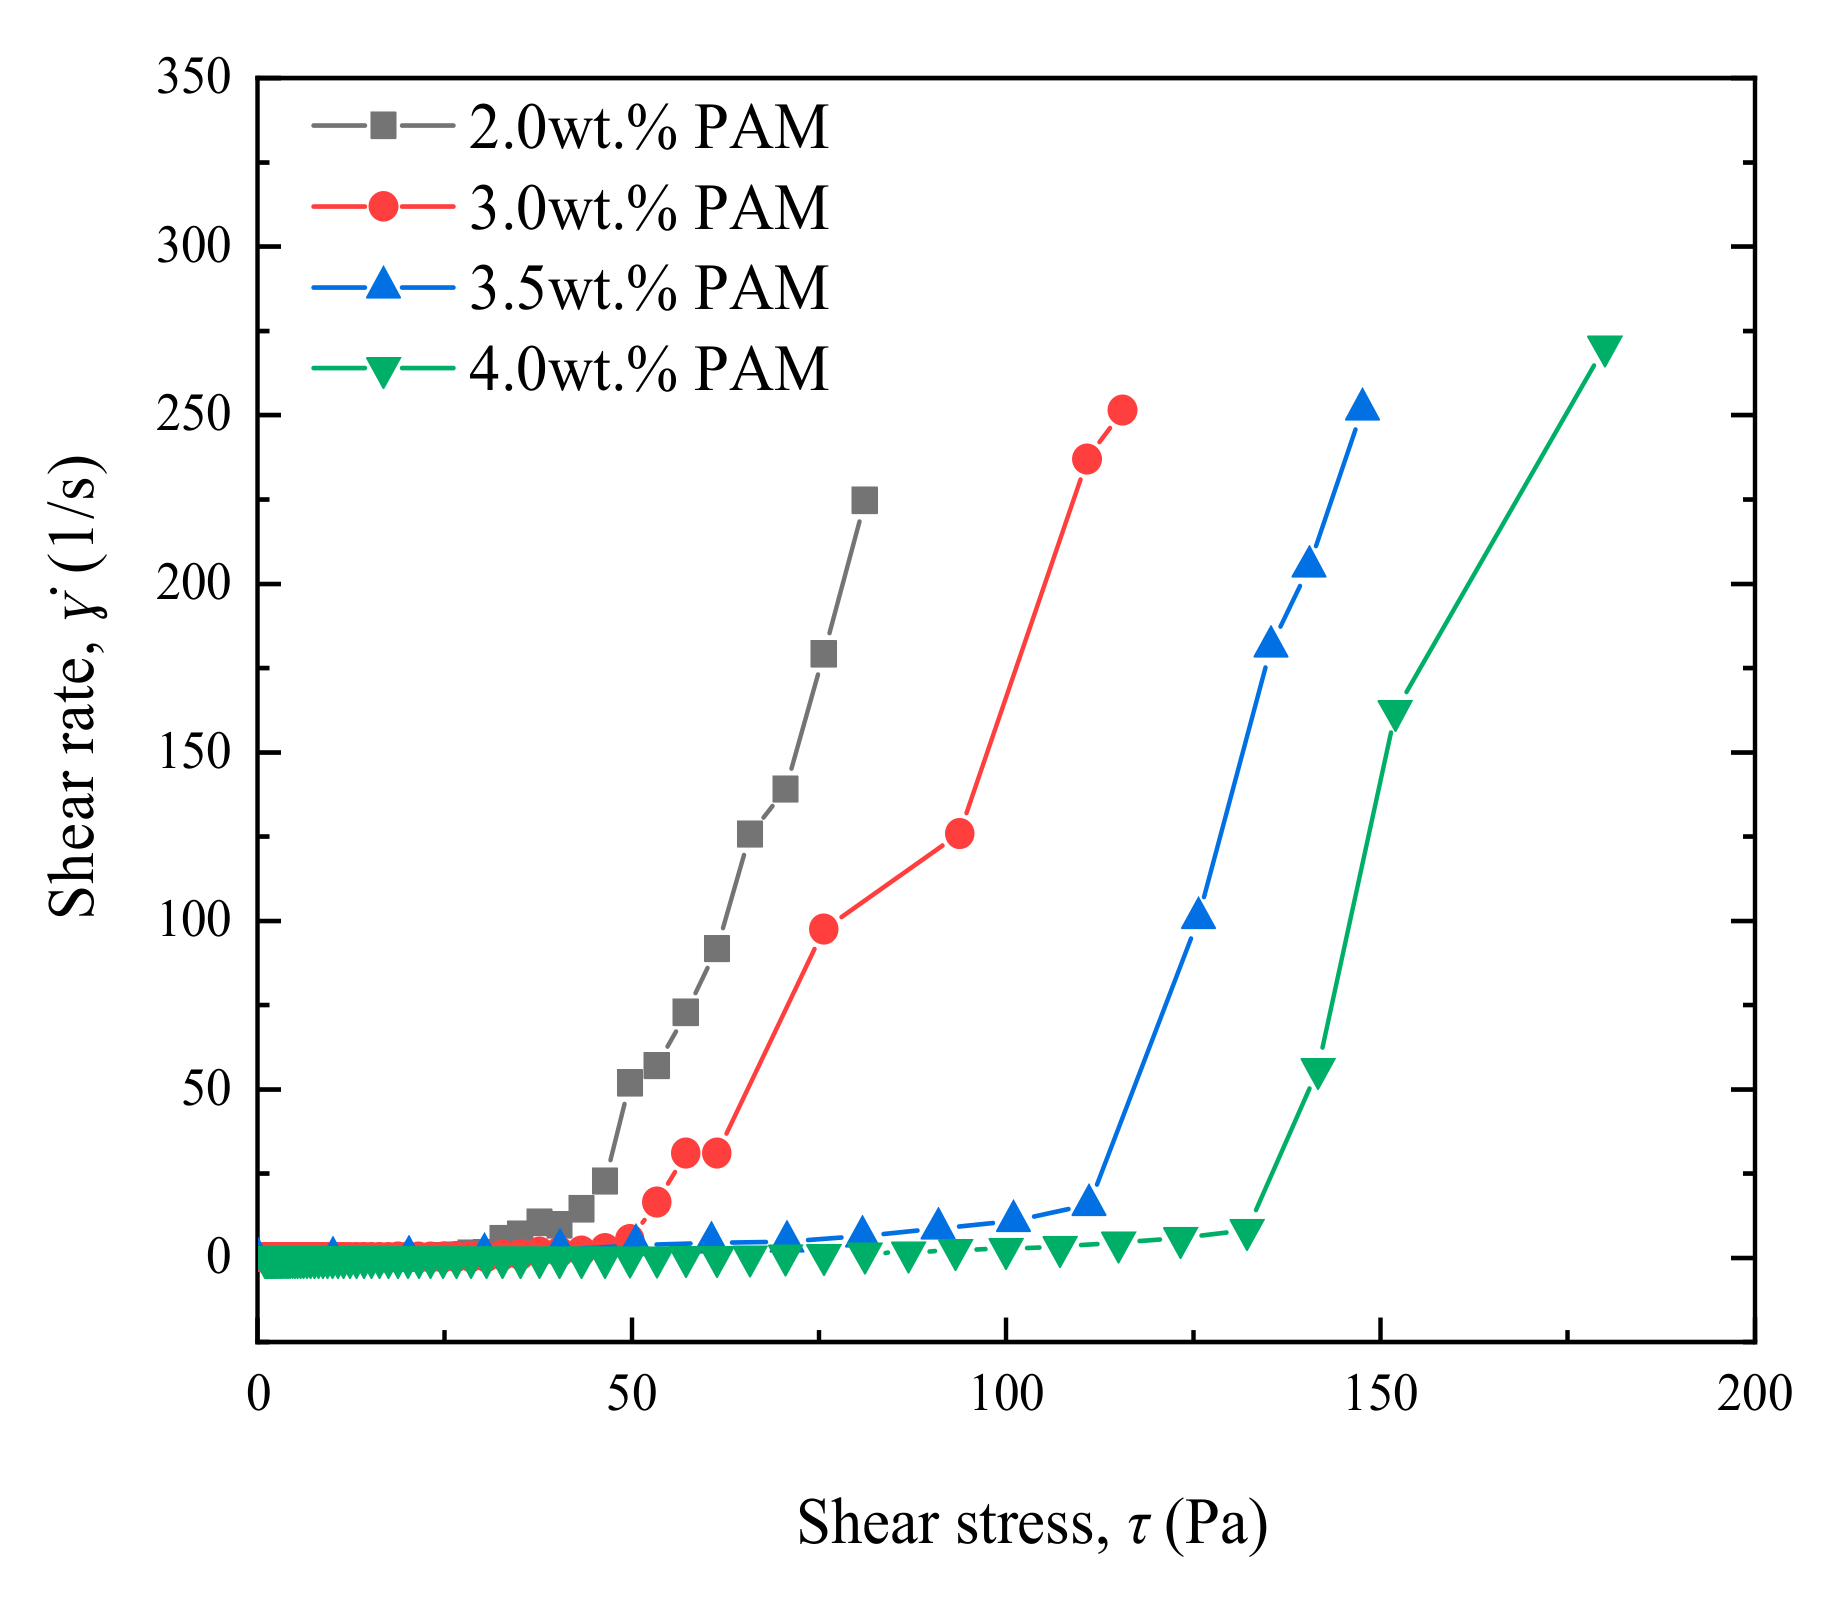
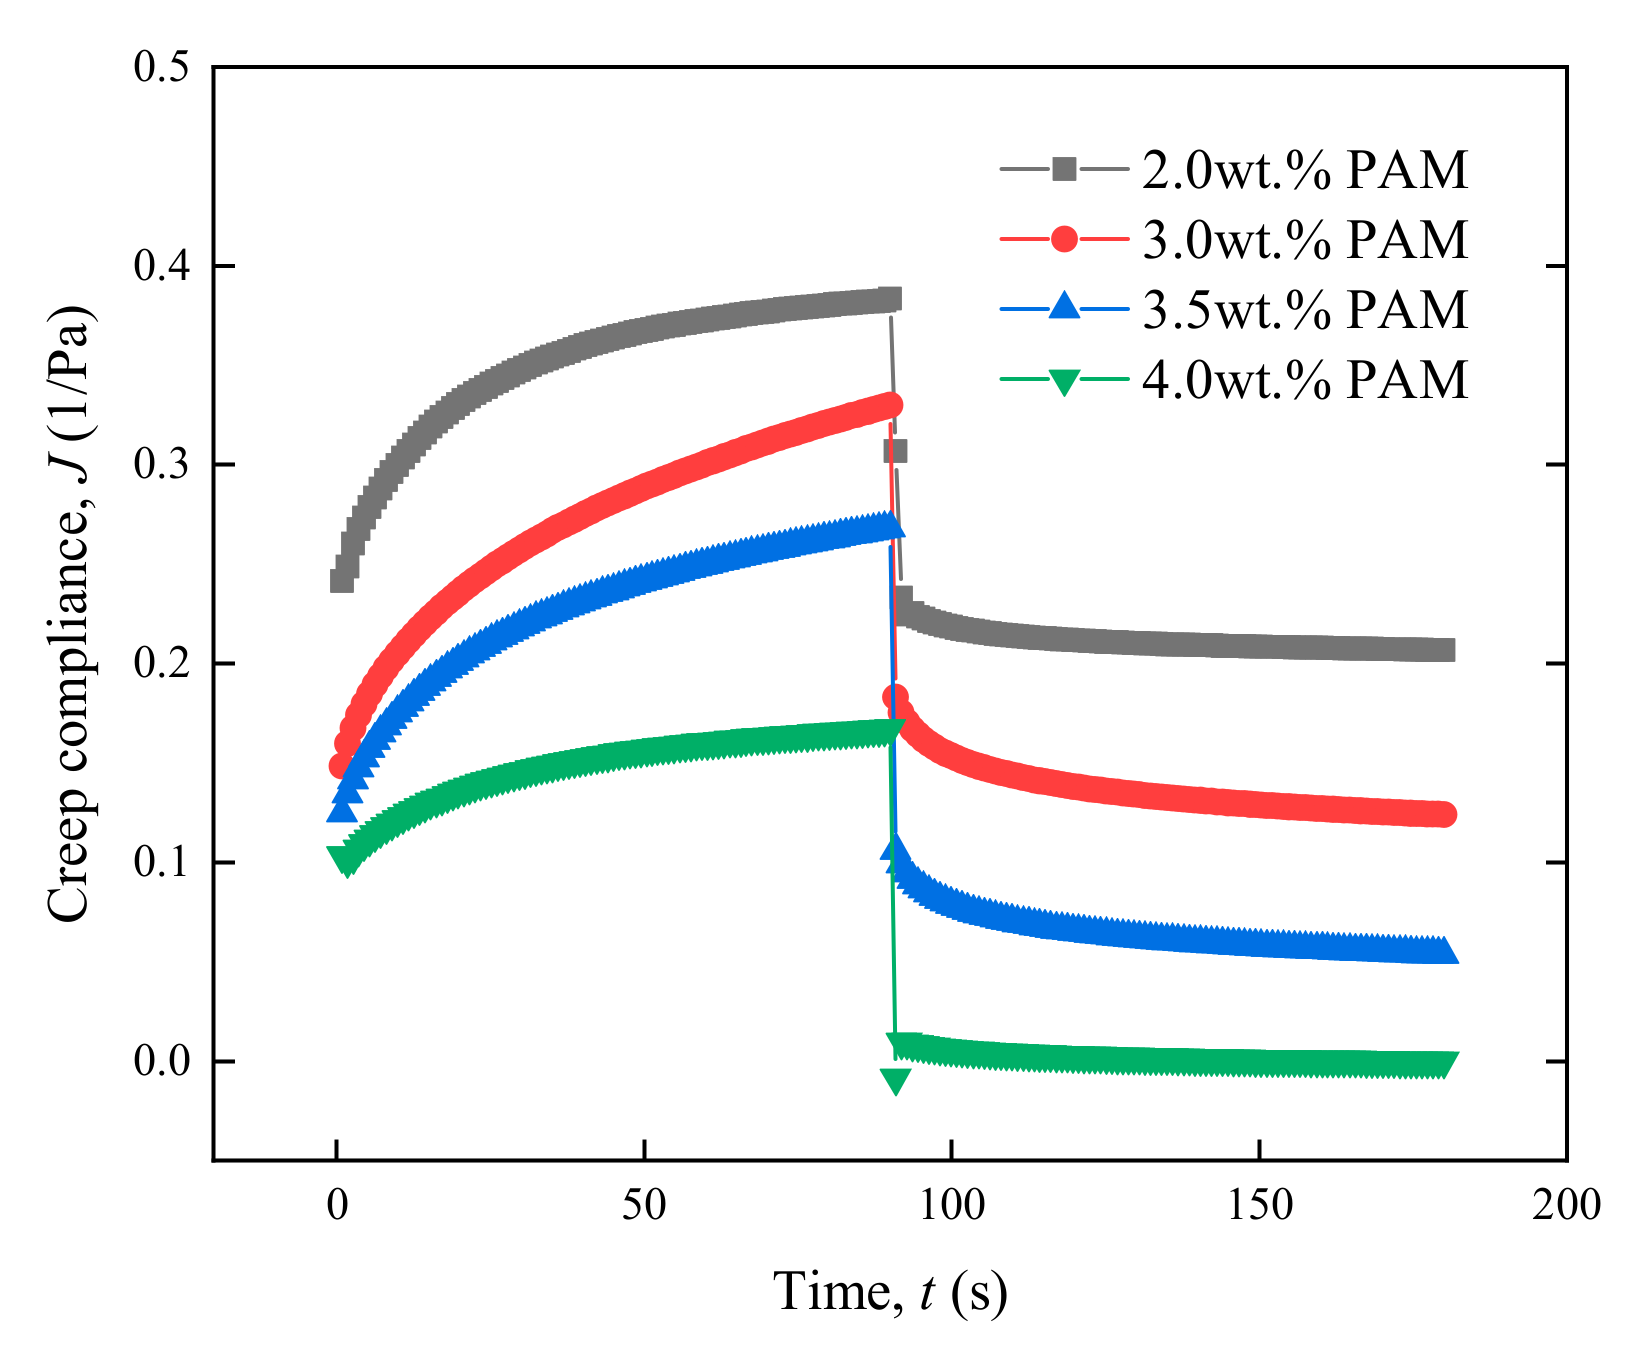
3.2.1. Effect of the Main Agent Concentration

(1) Viscoelasticity
Viscosity characterizes the flow properties of a given fluid, and elasticity characterizes how the fluid reacts to stresses. Rheological tests were performed with a rheometer (Rheostress 600, ThermoHaake) to study the viscoelastic behavior of the hydrogels with different concentrations of the main agent (PAM), as well as to better characterize and evaluate the stability of the polyacrylamide gels with GO. Several key viscoelastic parameters associated with the elastic and viscous characteristics of the gels were measured, including storage or elastic modulus (G′), loss or viscous modulus (G″), and damping factor (tan δ, δ is the phase angle). These viscoelastic parameters are associated with the formation of three-dimensional structures of the gels. During the experiment, oscillatory shear stress varying by sinusoidal time was applied to the gel.
Τ = τ 0 sin ω t
where τ 0 is the amplitude of the oscillatory shear stress, ω is the period of oscillation, ω = 2πf, and the measurement of the time-dependent strain is γ .
γ = γ 0 sin ω t γ
where γ 0 is the amplitude of the oscillatory shear strain.
G * = τ 0 γ 0
G = G * cos δ
G = G * sin δ
δ = arctan G / G
where G * is the absolute dynamic modulus. If δ = 0°, the gel is a purely elastic gel. When δ = 90°, it should be a purely viscous gel; when 0° < δ < 90°, it should be a viscoelastic gel [33,34]. If δ < 45°, the storage modulus is larger than the loss modulus and the gel is an elastic-based viscoelastic gel. Conversely, if δ > 45°, the loss modulus is larger than the storage modulus, and the gel is a viscous or predominantly viscoelastic gel.
The viscoelastic curves of the gels with fixed 0.2 wt.% cross-linker (PEI), 0.1 wt.% GO, and varying polymer concentrations of 2.0 wt.%, 3.0 wt.%, 3.5 wt.%, and 4.0 wt.% are shown in Figure 7. One can see from Figure 7a,b that with the increase in shear frequency, the storage and loss modulus increase first and then change slightly, and the storage modulus, which is always greater than the loss modulus, increases with the concentration of PAM. Meanwhile, the relationship between the phase angle δ and shear frequencies in Figure 7c shows that the δ is always lower than 45°, illustrating the gel is an elastic-based viscoelastic gel, and the δ decreases with the concentration of PAM, indicating that stronger gel can be obtained with high concentrations of PAM. The average number of polymer monomers between branched points and cross-linking efficiency increase with the increasing polymer content, which is the main body for cross-linking reactions, resulting in a more densely spatial 3D network structure [35], and thus, the strength is enhanced. In addition, the larger elasticity and stronger toughness can lead to a greater intensity when the gel glued to the formation rock porous medium, which will also make it more stable and not easily destroyed [31,32].
(2) Yield stress
The yield stress curves of the gels with different concentrations of the main agent (PAM), 0.2 wt.% cross-linker (PEI), and 0.1 wt.% GO are shown in Figure 8. It can be seen that the yield stress of the gels tends to enhance when increasing the main agent concentration. At low yield stresses, the gels exhibit an obvious shear rate (γ) plateau, and with an increasing shear rate, the yield stress tends to be a constant value, indicating that the gels start to flow as a kind of fluid. The yield stresses of the gels doped with GO were measured to be 75 Pa, 100 Pa, 150 Pa, and 175 Pa for the polyacrylamide concentrations of 2.0 wt.%, 3.0 wt.%, 3.5 wt.%, and 4.0 wt.%, respectively. The gels could flow only when the applied yield stress was greater than these values. As the polyacrylamide concentration increased, the cross-linking sites between the main agent and the cross-linker multiplied, enabling better formation of complete gels and enhancing their strength and stability.
(3) Creep recovery characteristic
Creep recovery is also known as creep reversion. After a certain load is applied to a material to cause creep, the strain of the material in the opposite direction of creep extension decreases with time (t) after this load is removed. The creep-reversion performance curves of the gels prepared with different concentrations of the main agent (PAM), 0.2 wt.% cross-linker (PEI), and 0.1 wt.% GO are shown in Figure 9. It can be seen from Figure 9 that in the creep stage (0–90 s), the compliance of gel tends to be higher with a lower concentration of main agent PAM, as well as the degree of deformation. Some of the deformation during the creep stage was recovered due to the elastic properties of the gel itself after unloading the applied external force, and some of them were lost due to the flow of the gel. The concentration change of the main agent affects the storage (elastic) and loss modulus of the gel; thus, the recovery degree of gel is greatly influenced by the concentration of the main agent. In addition, in the recovery stage (90–180 s), the recoverable portion of gel increases in proportion during the creep–recovery process with the increasing concentration of the main agent, indicating that the effect of the main agent concentration on the recovery degree and elastic modulus of gels is consistent.

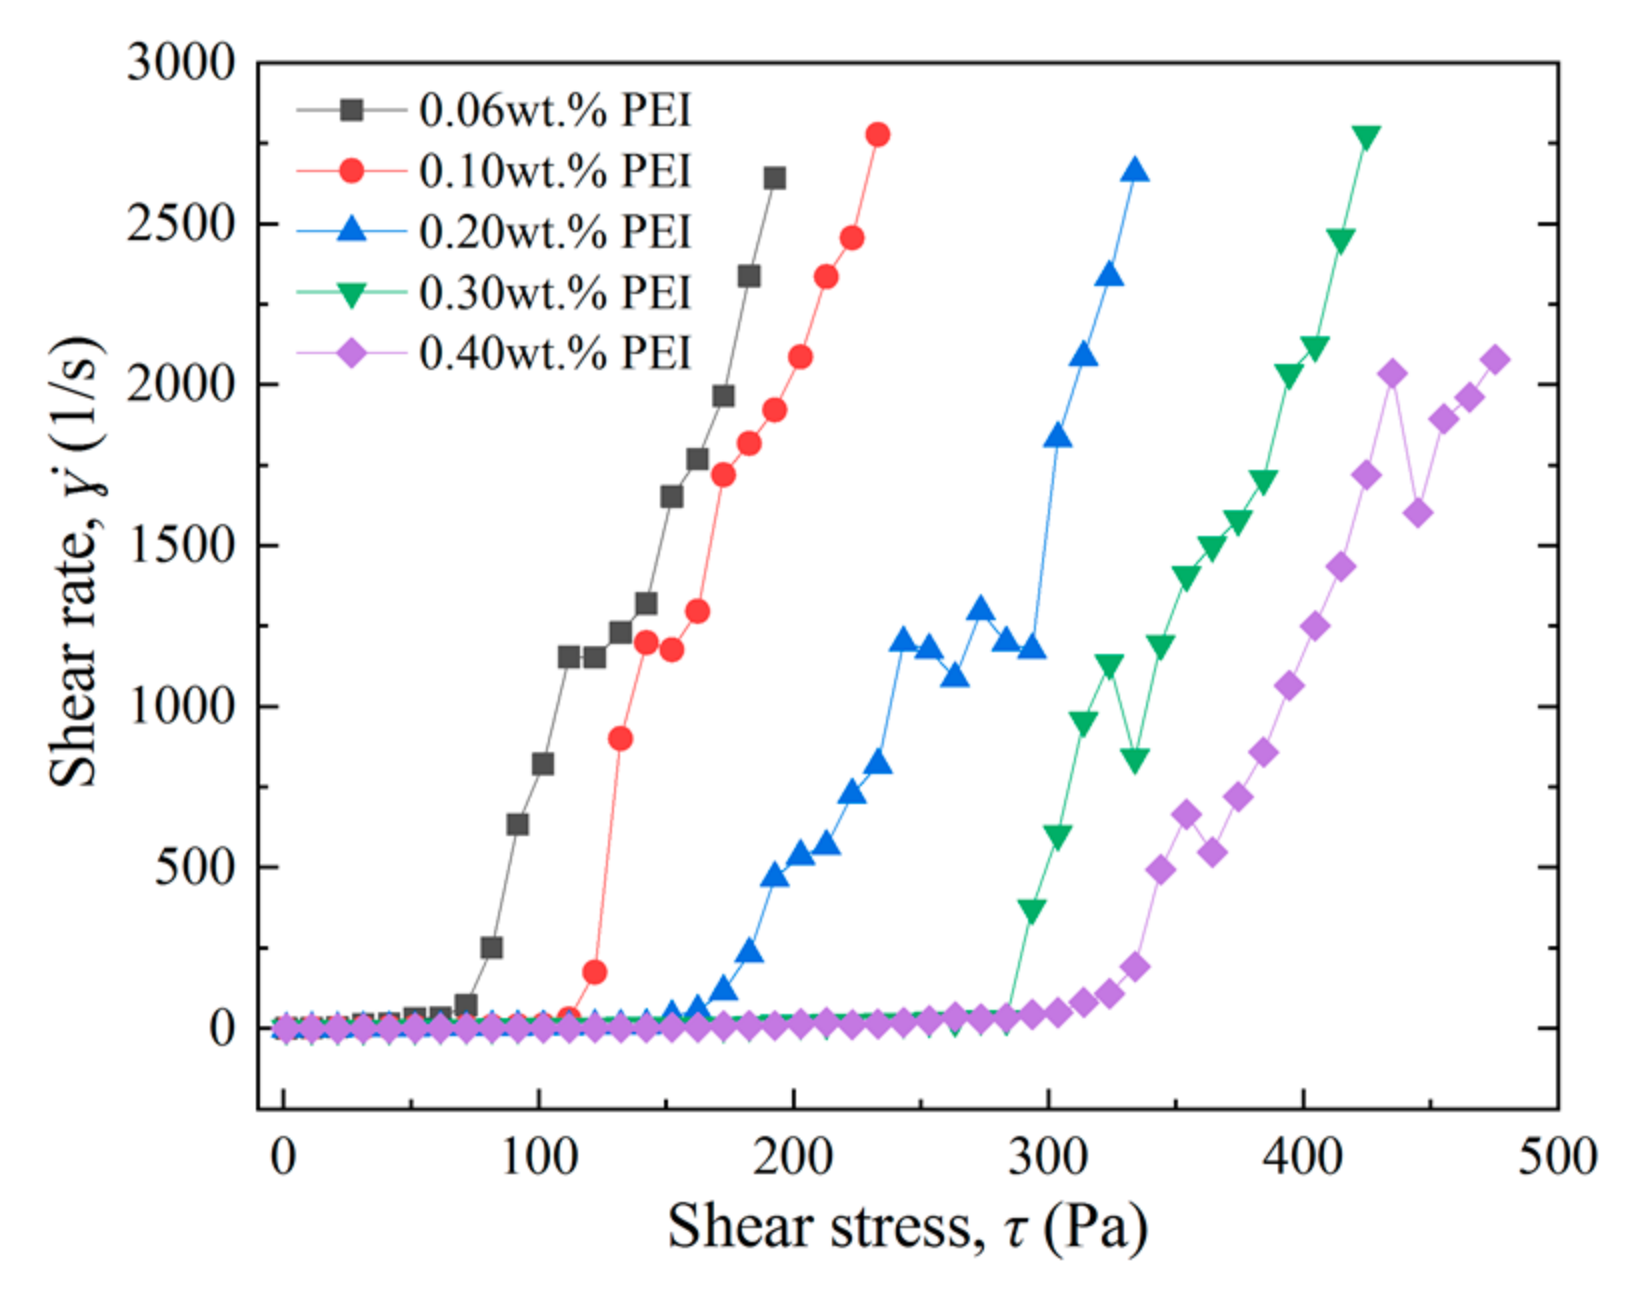
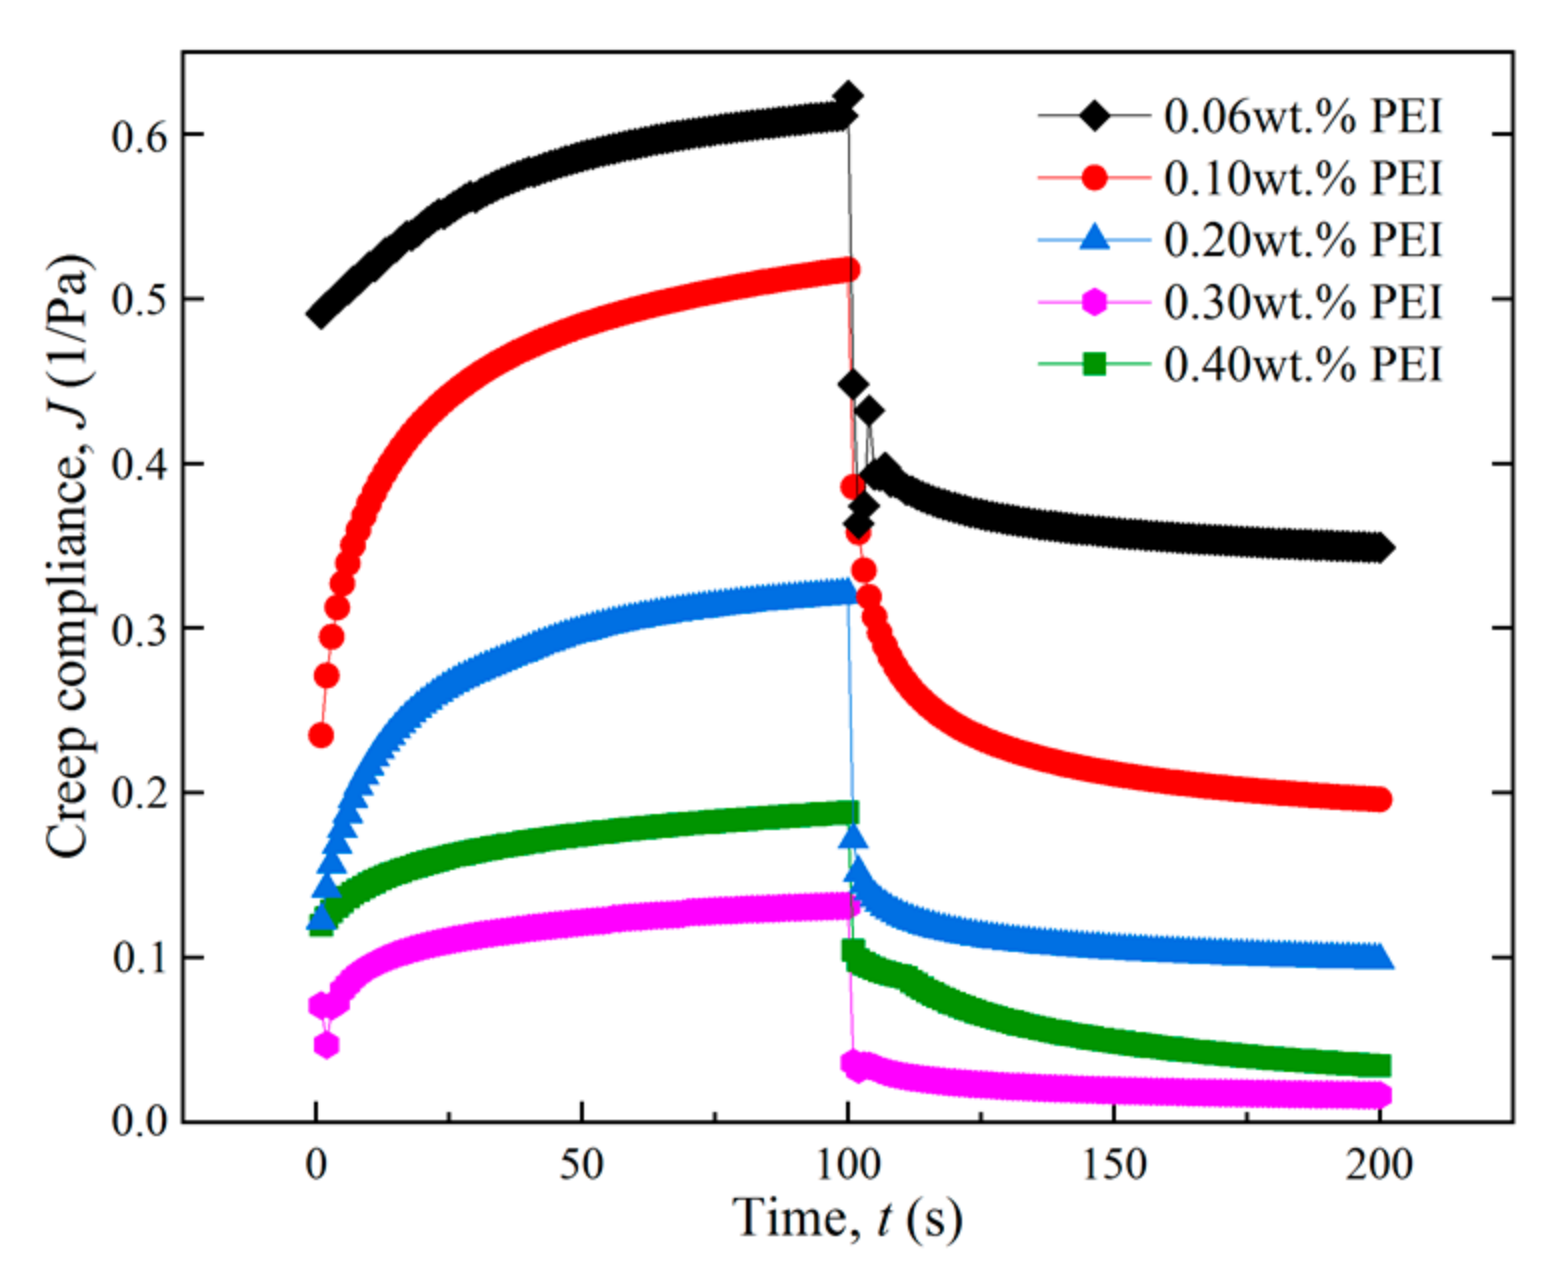
3.2.2. Effect of Cross-Linker Concentration

(1) Viscoelasticity
As the gel with 3.0 wt.% PAM exhibits moderate mechanical properties, the effects of different concentration of cross-linker (PEI) on the viscoelasticity of gels were investigated with fixed concentrations of 3.0 wt.% PAM and 0.1 wt.% GO, as shown in Figure 10. One can see from Figure 10a,b that with the increase in shear frequency, both the storage and loss modulus increase first and then change slightly. The storage modulus, which is always greater than the loss modulus, increases with the concentration of PEI when the concentration of PEI lower than 0.3 wt.%, and when the concentration of PEI is higher than 0.3 wt.%, both the storage and loss modulus decrease, indicating that an optimal value exists for the amount of cross-linker. Meanwhile, the relationship between the phase angle δ and shear frequencies in Figure 10c shows that the δ is always lower than 45°, illustrating the gel was an elastic-based viscoelastic gel, and the δ decreases to the lowest value when the concentration of PEI is 0.3 wt.%, indicating that the strongest 3D network of gel was obtained.
When the concentration of cross-linker is relatively low (<0.3 wt.%), it is not conducive to the formation of monolithic gel due to the few cross-linking points, resulting in a lower strength of the gel. With the increasing concentration of cross-linker (0.3 wt.%), the cross-linker reacts with the main agent sufficiently, which is conducive to the formation of monolithic gel; thus, the strength of gel is relatively high. However, when the concentration of cross-linker is too high (>0.3 wt.%), excessive cross-linking agents tend to react with carboxyl groups on the side chains of polymer molecules, resulting in excessive cross-linking density and reduced average molecular weight of the chains between cross-linking points. This leads to dehydration of the gel, destruction of its integrity, and reduction in gel strength [35].
(2) Yield stress
The yield stress curves of the gels with different contents of cross-linker PEI (Figure 11) show that with the increase in shear rate, the yield stress approached a fixed value. At certain shear stress, the yield stress enhanced gradually with the increase in cross-linker content, indicating that stronger gel can be obtained with high concentrations of PEI. The cross-linking sites between the main agent and cross-linker of the gel increased with increasing concentration of cross-linker, and the gel strength then enhanced, as well as the external force required for the corresponding flow. Therefore, the yield stress of the gel enhanced accordingly with the increasing concentration of cross-linker.
(3) Creep recovery characteristics
The creep–recovery performance curves of the gels prepared with different contents of cross-linker (PEI) (Figure 12) show that, in the creep stage (t < 90 s), the creep compliance (J) of the gel decreased with the increase in the cross-linker concentration, revealing that the deformation occurred with difficulty under external force with high concentrations of cross-linker. In the recovery stage of stress unloading (t > 90 s), the proportion of the elastic reversion part of gel increased with the increasing concentration of cross-linker and reached the highest value at the concentration of 0.3 wt.%, which meant that the proportion of loss due to flow during the deformation recovery tended to decrease, suggesting that the gel has better deformation recovery performance and more obvious elastic characteristics. This is consistent with the change trend of the elastic modulus of the gel. During the formation of polyacrylamide gel, the number of cross-linking points in the polyacrylamide chain segments increased with the increasing cross-linker concentration, and thus, polyacrylamide could contact more cross-linking points, forming a more compact gel system, which was less likely to be deformed under external force, resulting a better creep–recovery performance.

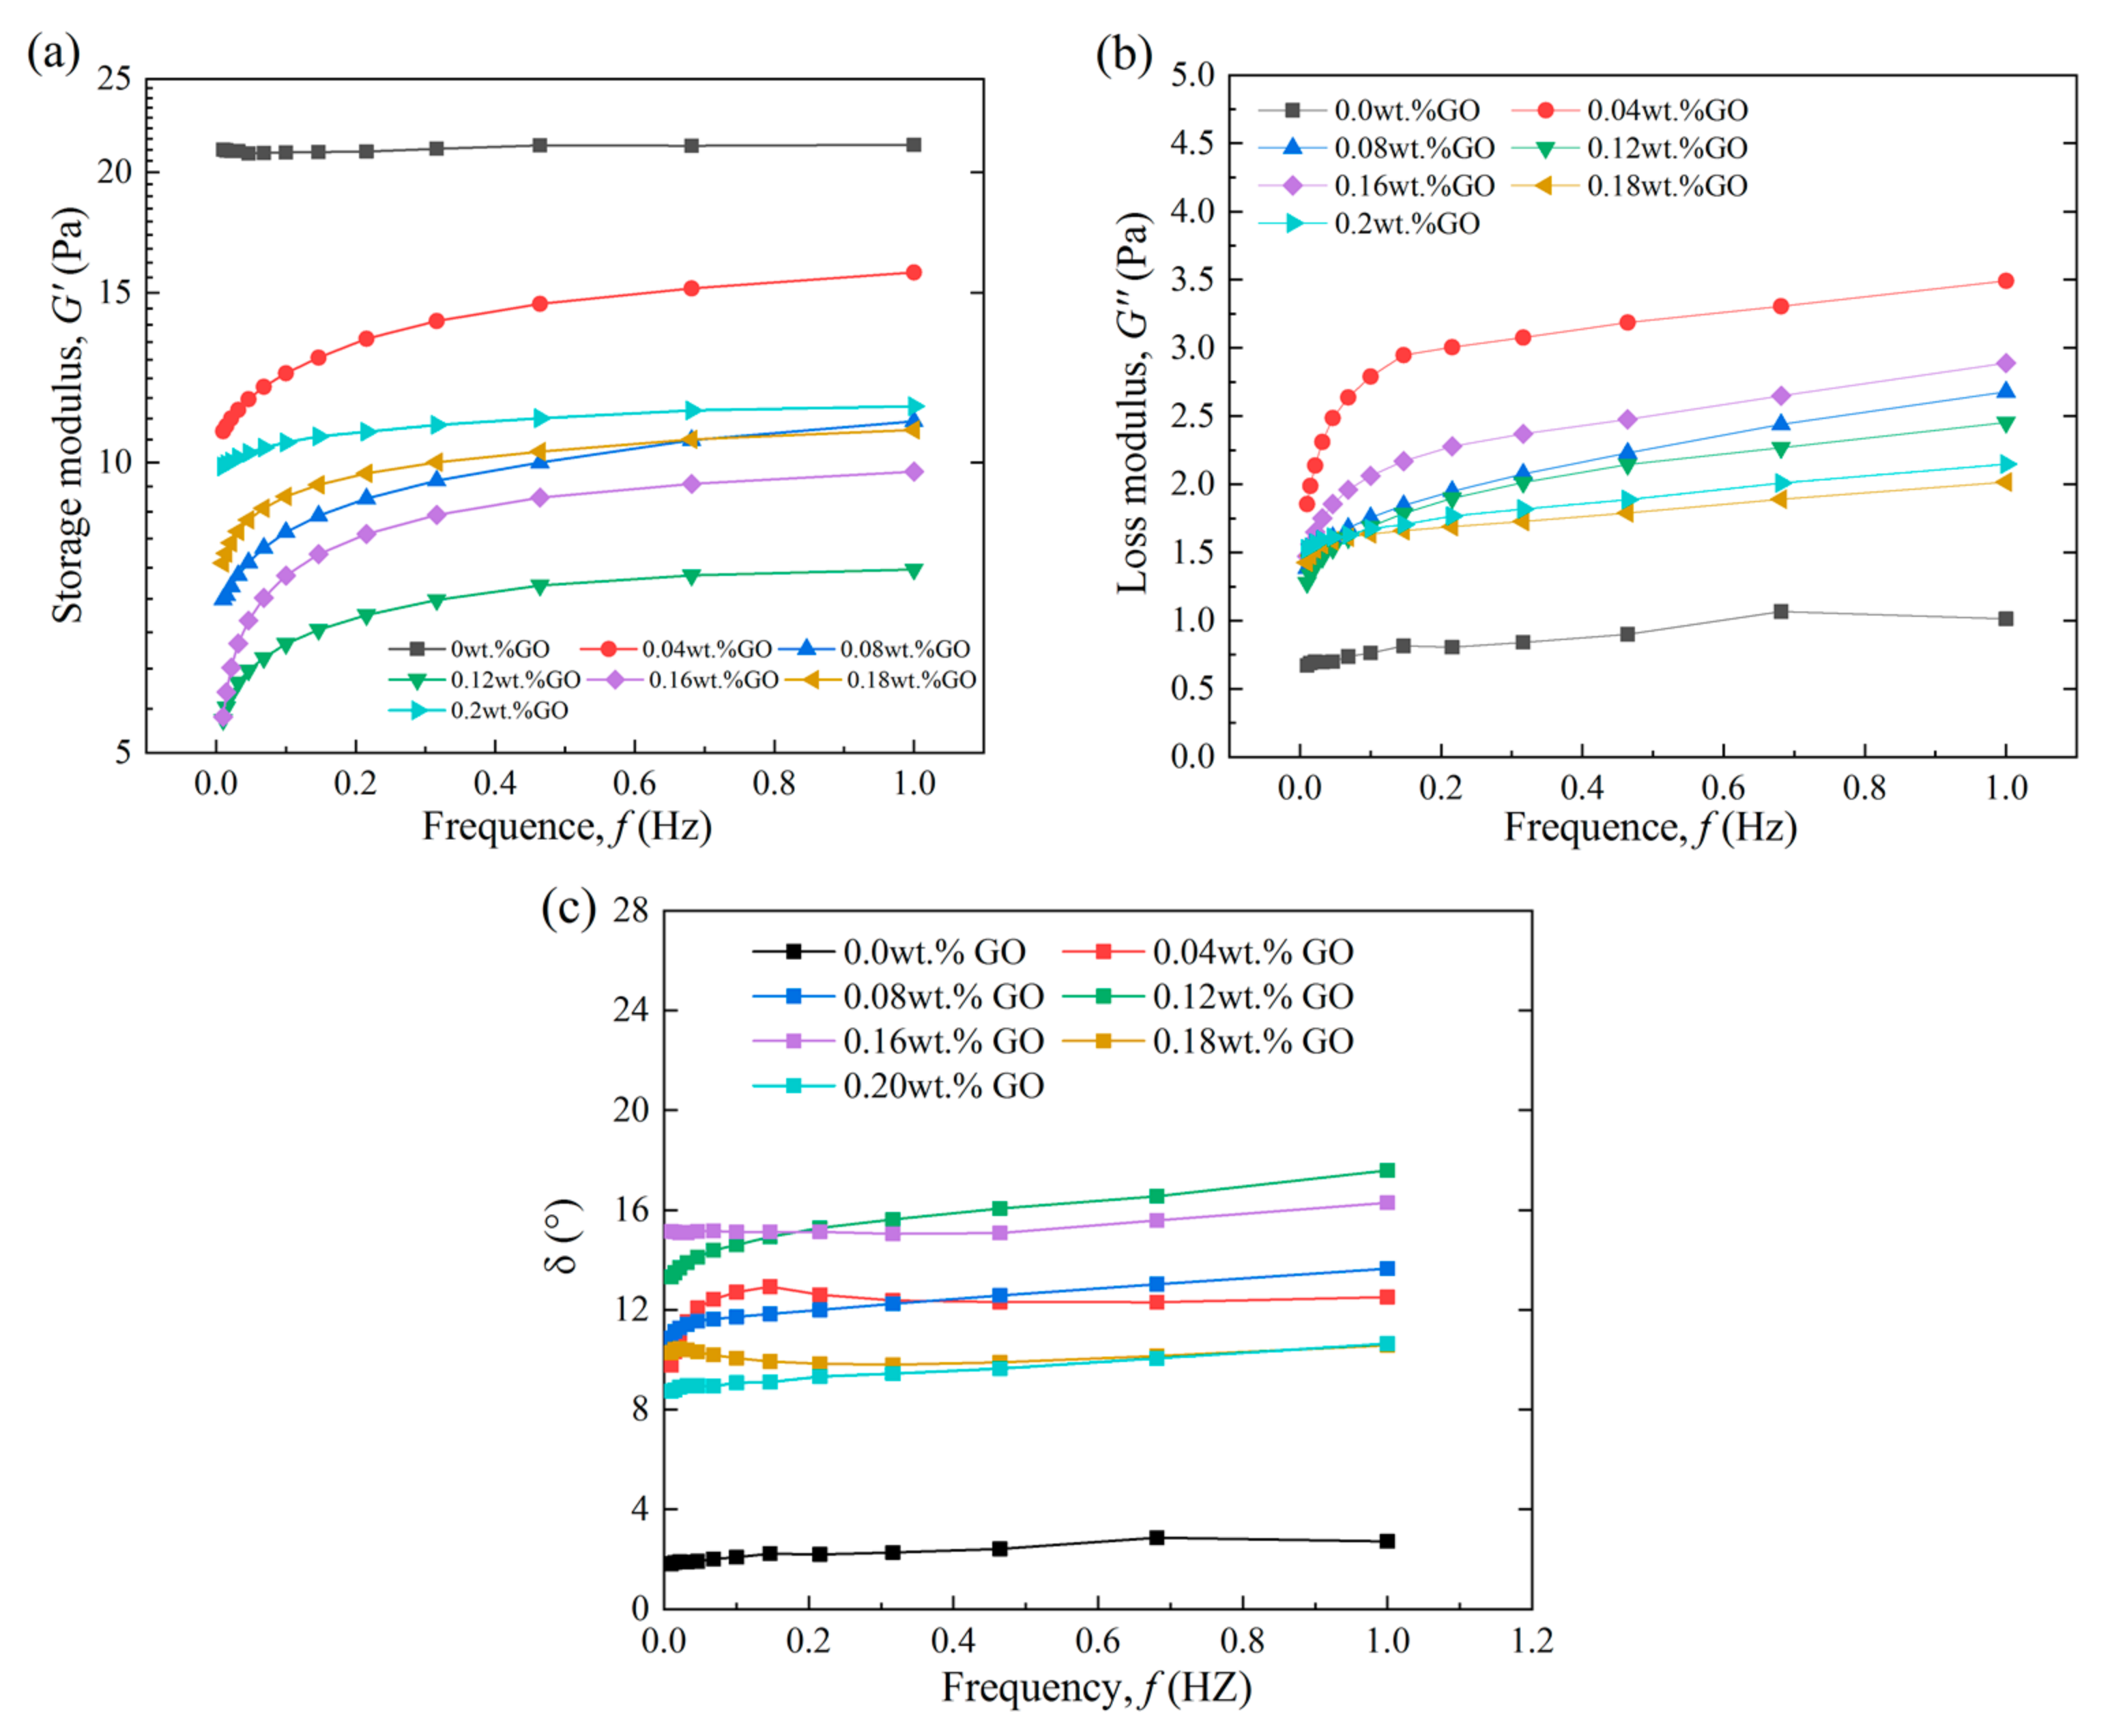
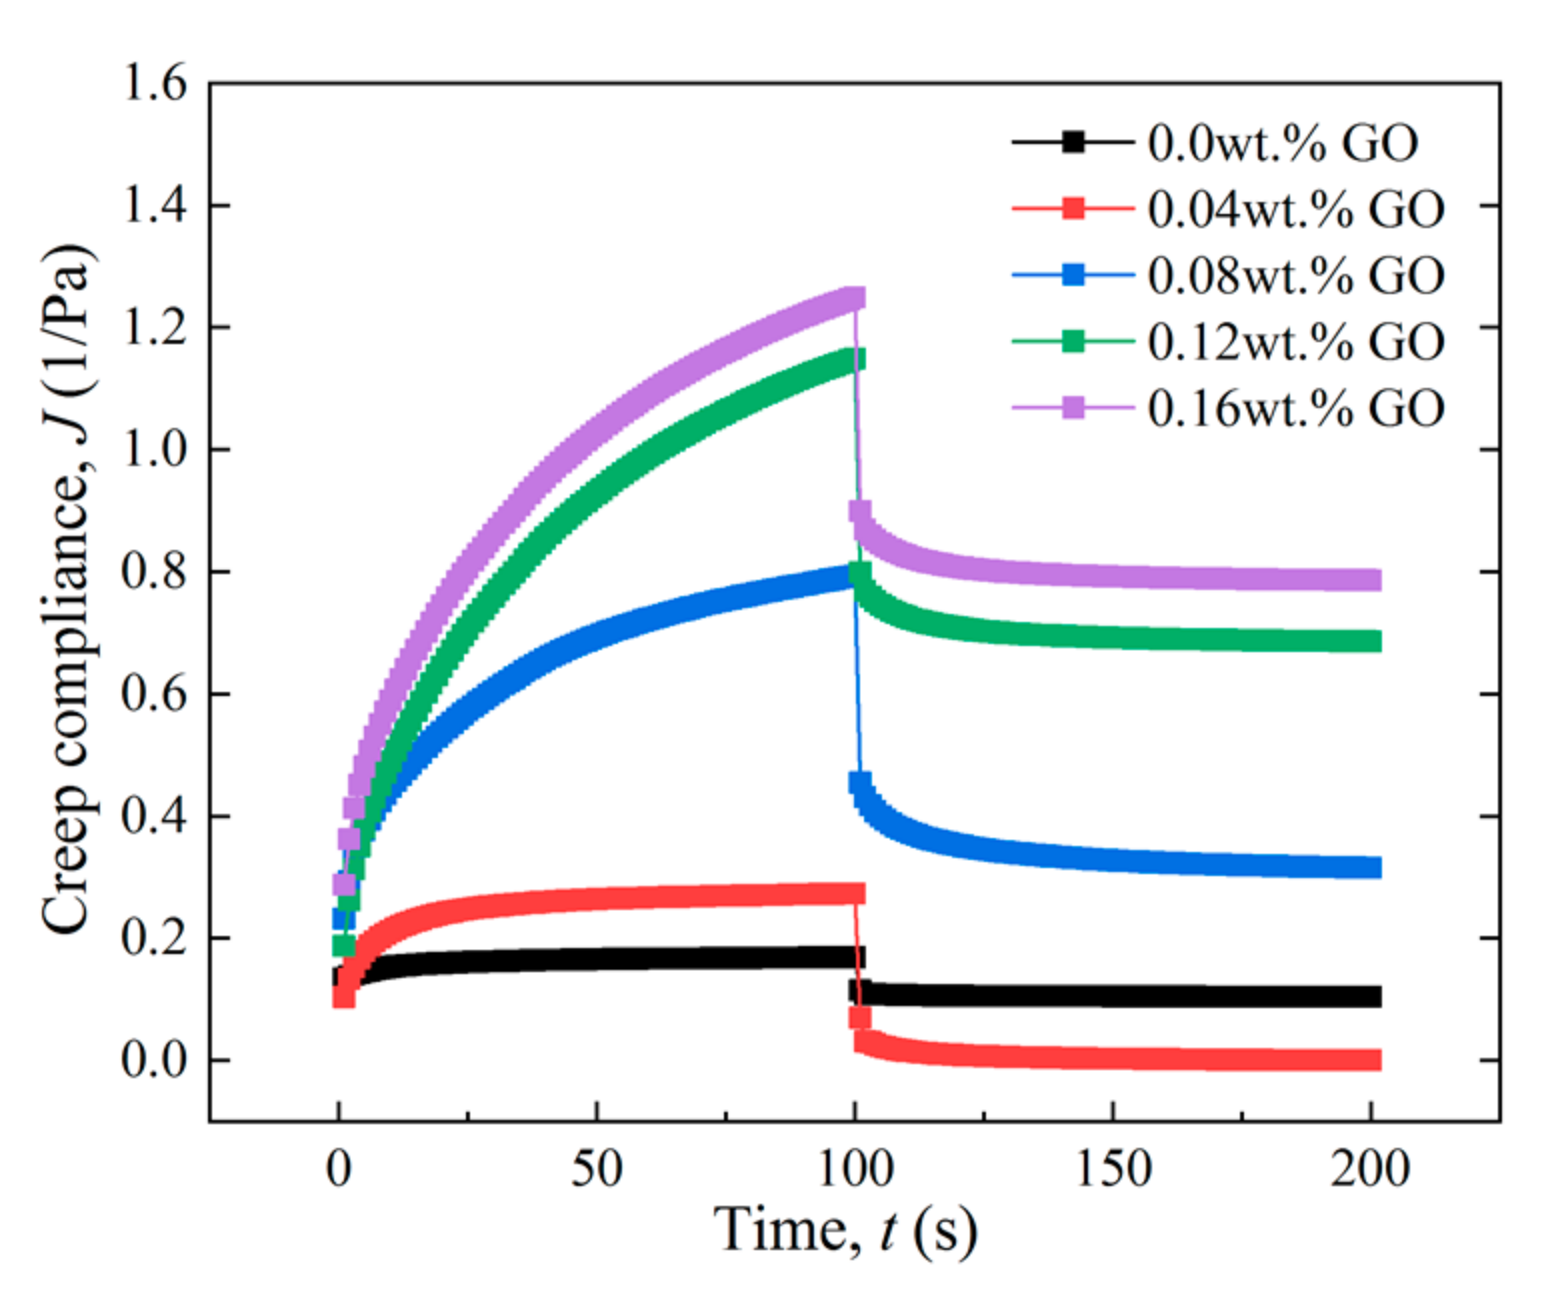
3.2.3. Effect of GO Concentration

(1) Viscoelasticity
The viscoelastic measurement curves of the gels with different concentrations of GO (Figure 13) show that the GO greatly changed the viscoelasticity of the gels. At low concentrations of GO (<0.12 wt.%), the elastic (storage) modulus G’ of the gels decrease with increasing GO concentration and reach the lowest value when the GO concentration is 0.12 wt.%, as shown in Figure 13a. As the GO concentration continues to increase (>0.12 wt.%), the elastic modulus G’ of the gels gradually increases in turn, and is always higher than their viscous (loss) modulus G”, illustrating that the gel with GO was an elastic-based viscoelastic gel. The trend of phase angle δ as shown in Figure 13c is similar to that of viscoelasticity, increasing with the GO concentration and reaching the highest value at a GO concentration of 0.12 wt.%, indicating that the addition of GO weakened the elastic behavior of the gel and the strength could reach the lowest value at a certain GO concentration.
The reason for this phenomenon can be attributed to the interaction between GO and the 3D network structure of the PAM gel system. The sheet-like GO filled the polyacrylamide molecular chain preferentially at low concentrations, resulting in a more brittle molecular backbone and lower toughness of the gels, which was manifested as the decrease in the macroscopic strength of their 3D network structure. With the increasing GO concentration, the GO sheets agglomerated to be larger particles, which played the supporting role between two adjacent chain segments of the 3D network structure; thus, the strength of the gel increased in turn at high GO concentrations. However, it should be noted that the elastic modulus was still lower than that of the polymer gel without GO, even when the GO concentration reached 0.20 wt.%, which is still too low relative to the whole gel system.
(2) Yield stress
The yield stress curves of the gels prepared with different contents of GO (Figure 14) show that with the contents of PEI and polyacrylamide fixed, the yield stress of the gel gradually decreases with the increase in GO content in a certain range, indicating a weaker structure. This might be due to the aggregation of GO and a lower cross-linking density, as discussed by Piao and Chen [24]. In their research, the cross-links between GO nanosheets and polymer molecules tended to be less effective with a relatively high GO content due to increased aggregation of GO sheets, leading to a weaker gel.
(3) Creep recovery characteristics
The creep–recovery performance curves of the with different contents of GO (Figure 15) show that in the creep stage (0–100 s), the creep compliance (J) of the gel without GO is the lowest, indicating that it deformed with the most difficulty. With the increasing GO concentration, the creep compliance (J) increases gradually, indicating that it is easier to deform under external stress for gels with GO than those without GO. In the recovery stage of stress unloading (t > 100 s), the proportion of the elastic recovery part of gel decreases obviously with the increasing GO concentration, revealing that the proportion of loss due to flow during the deformation recovery tends to increase, suggesting that the gel has worse deformation recovery performance and even less obvious elastic characteristics at high GO concentration. This is slightly different from the viscoelastic measurement results, where the strength of gels decreased first and then increased after reaching the lowest value at a certain GO concentration, 0.12 wt.%. It can be inferred that the GO with high concentrations (>0.12 wt.% in this study) could improve the strength of gels, but also reduce their toughness, resulting in a weak resistance to deformation, namely a stronger stiffness.
Figure 16 exhibits the relationship between the gelation time and the GO concentration. One can see that the gelation time increases with the increasing GO concentration, indicating that the GO particles are involved in the cross-linking reaction between the main agent (polyacrylamide) and the cross-linker (PEI), which can also be proved by the structural characterization of gels with and without GO. All in all, both the weaker strength and longer gelation time of polyacrylamide gel after adding GO meet the requirements of production profile adjustment for deep reservoirs, suggesting that it is possible for GO nanosheets as a kind of functional cross-linker to adjust the mechanical properties of polyacrylamide gel for water control in ultra-deep reservoirs.

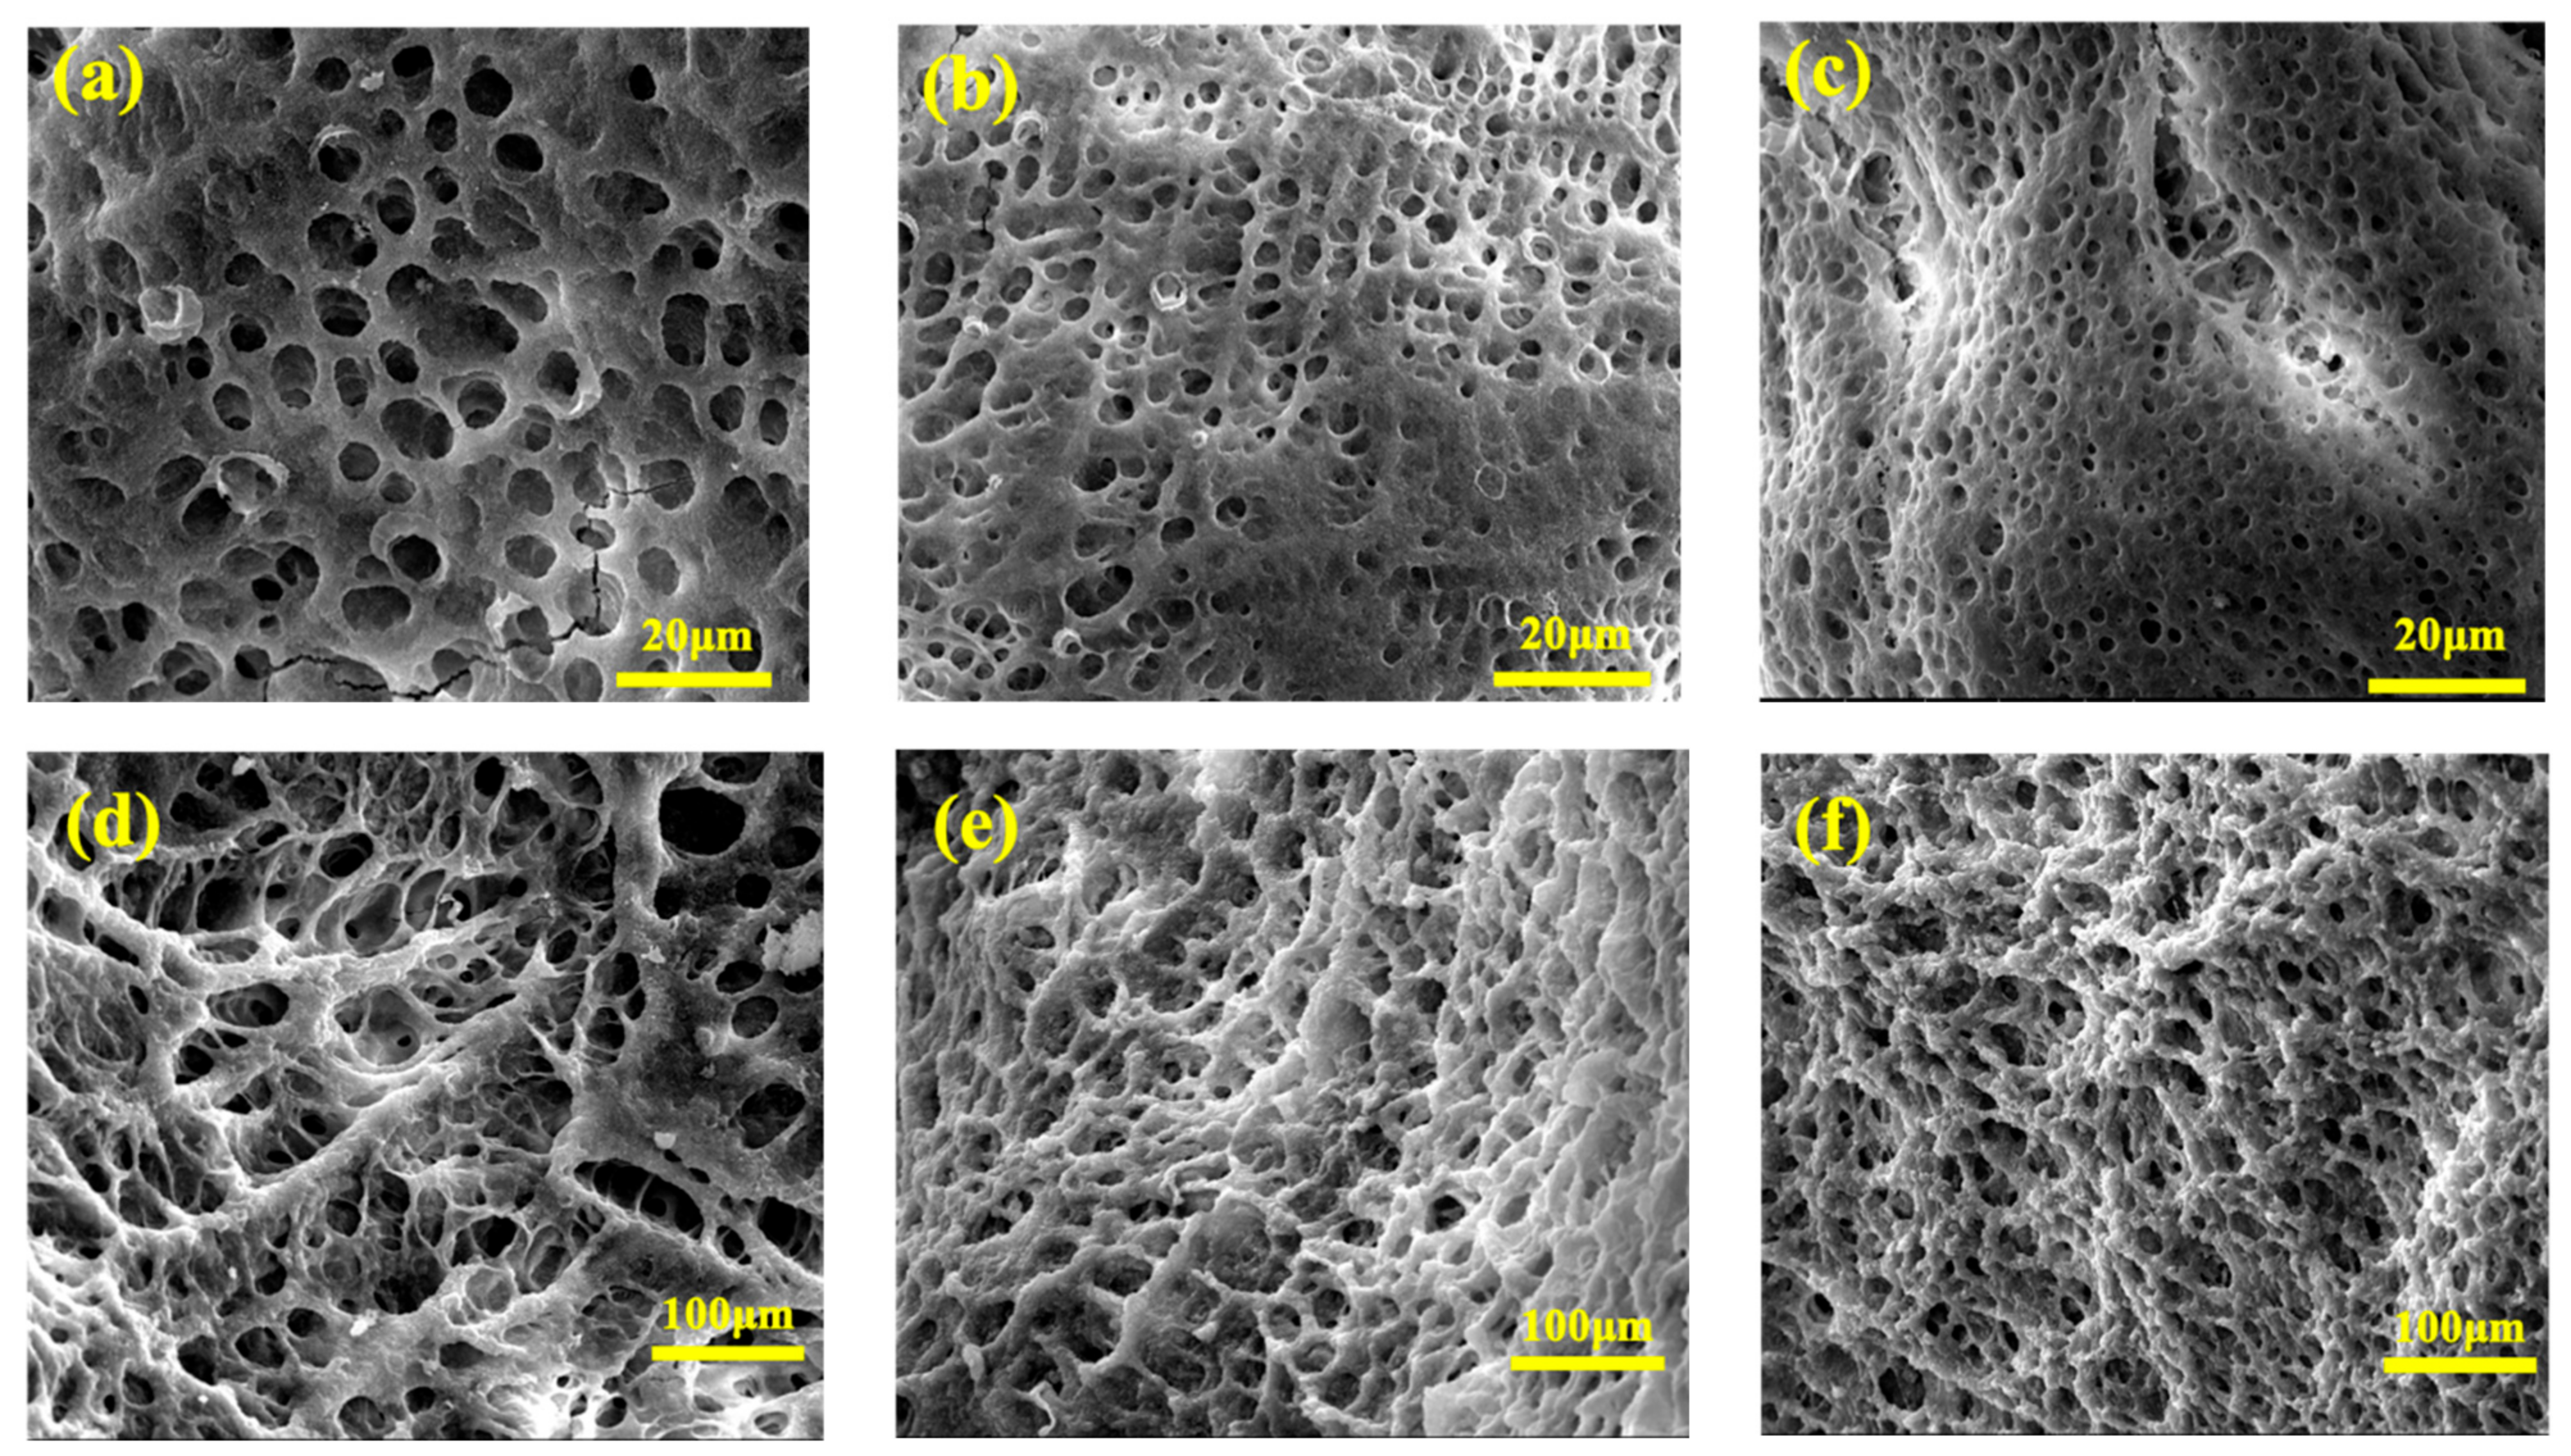
3.3. The Microstructure of the Gels

The interior morphologies of the GO-doped polyacrylamide nanocomposite hydrogels were investigated by SEM. The neat polyacrylamide hydrogel displays a porous structure with a pore size of 2.43 ± 0.26–9.74 ± 0.37 μm when the concentration of PAM ranges from 2.0 wt.% to 4.0 wt.% and the concentration of PEI is fixed at 0.1 wt.% (Figure 17a–c). The pore size of gels tends to be smaller with higher concentrations of PAM, indicating a much denser 3D network structure. It can be seen from Figure 17d–f that with the increasing concentration of PEI, the 3D network structure of gels also becomes denser because of more sufficient cross-linking reactions, indicating that it is conducive to the formation of monolithic gel with more cross-linking points, which is consistent with their rheological properties.
After incorporation of GO, the polyacrylamide hydrogel is double cross-linked by both PEI and GO and becomes stiffer. It can be seen from Figure 18a–c that a honeycombed structure with larger pore size for PAM-GO hydrogel (18.4 ± 7.19 μm for 0.06 wt.% GO (Figure 18a)) is observed, suggesting that the GO nanosheets hinder the cross-linking reaction between PAM and PEI, resulting in a looser 3D network structure. With the increasing GO concentration, the pore size decreases and becomes uneven and shallower (Figure 18b,c). A wider distribution of pore sizes suggests that GO is not well distributed in localized areas of the hydrogel network. The gels with 0.08 wt.% GO and 0.12 wt.% GO have smaller average pore sizes of 14.55 ± 5.21 μm and 6.08 ± 2.14 μm, respectively. When the GO concentration is low, the GO filled inside the polyacrylamide molecular chain randomly (Figure 18d), while with a high concentration of GO, GO sheets agglomerate to be larger particles and distribute better, resulting in a denser 3D network structure (Figure 18e,f), consistent with the rheological results that GO nanosheets serve as multi-functional cross-linkers.

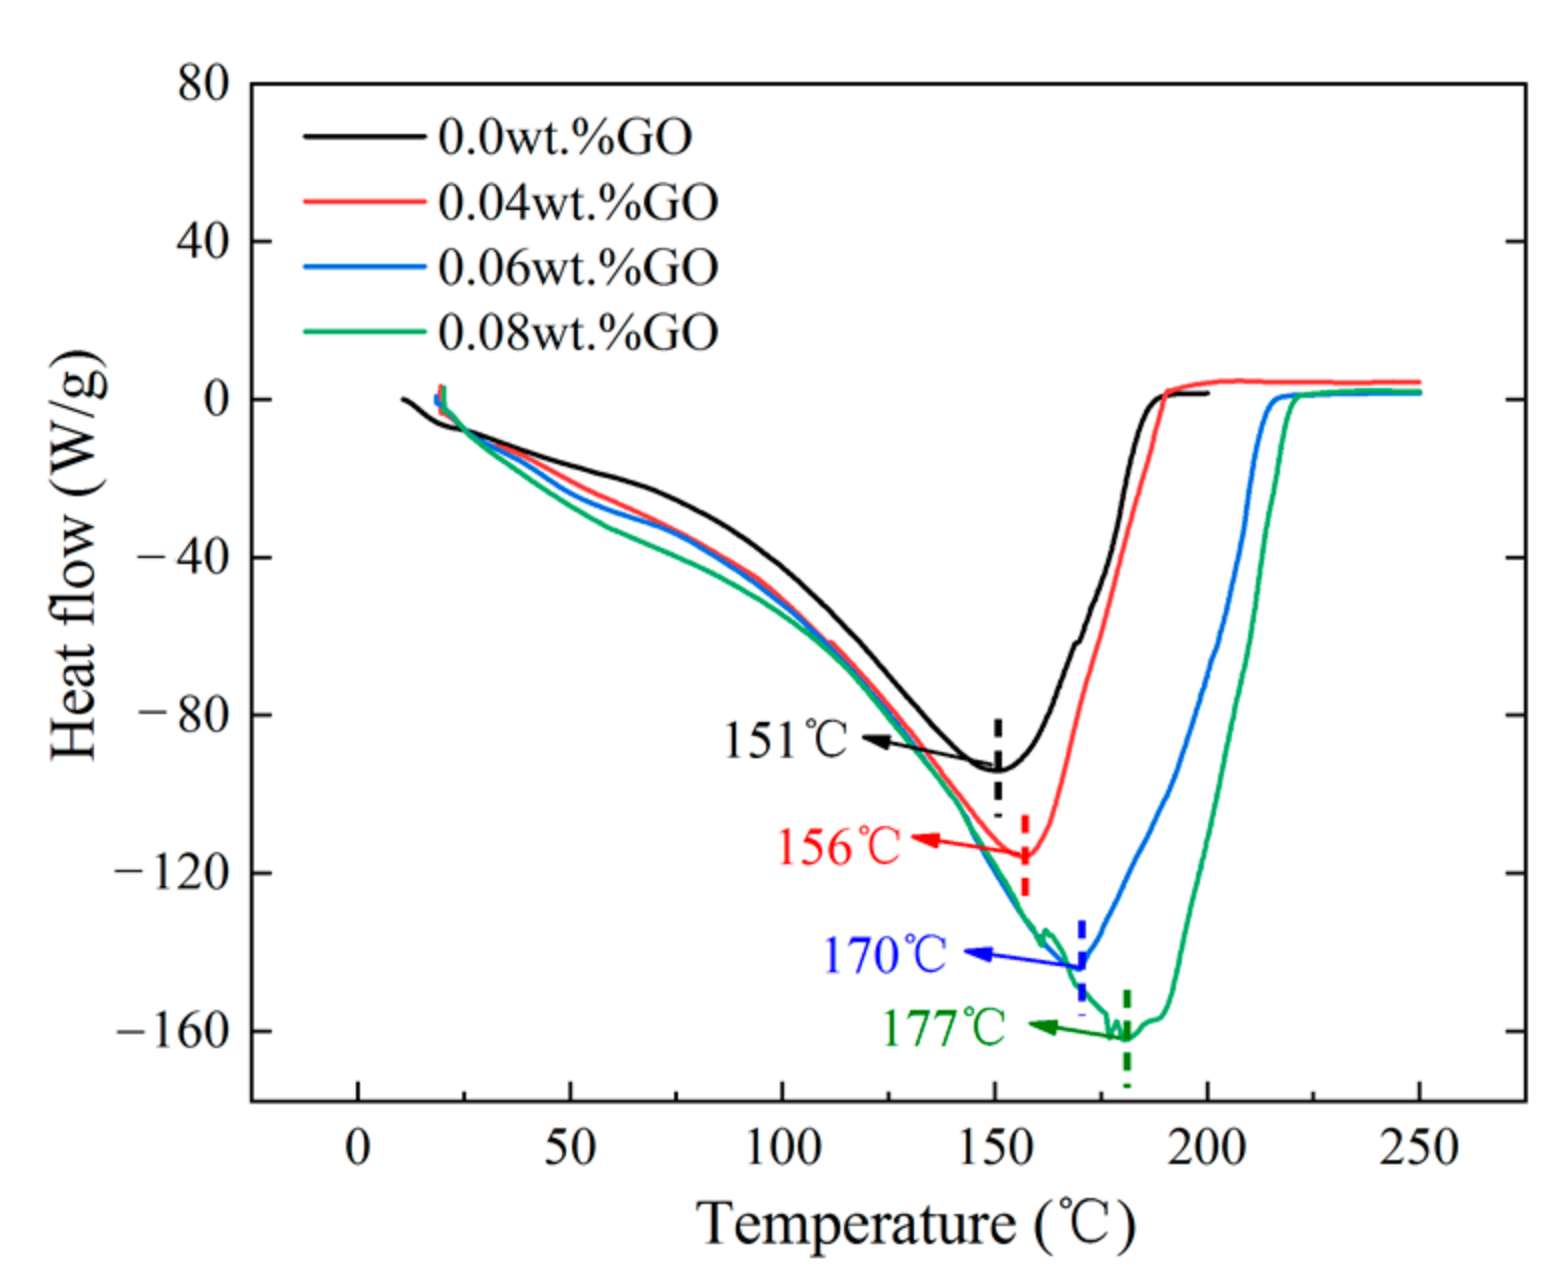
3.4. Thermal Stability of the Gels

The thermal stability of the composite gel system was studied by DSC measurement. Figure 19 displays the DSC thermograms of gel systems formed by different contents of GO. The temperature transition points are different when the gel systems are formed by different contents of GO. The decline in the curves before the transition points is due to the evaporation of a small amount of water. At temperatures higher than the transition point, the four curves show an increasing trend. The transition points of the gels without GO are 151 °C, and the gels are completely dehydrated above 187 °C. For gels with 0.04 wt.% GO, 0.06 wt.% GO, and 0.08 wt.% GO, the transition points of the gels increase to 156 °C, 170 °C, and 177 °C, and the gels are completely dehydrated above 190 °C, 216 °C, and 221 °C, respectively. From these findings, one can conclude that the molecular bond strength of the polyacrylamide gel formed with GO is stronger than that of those systems formed without GO thanks to the hydroxyl and carboxyl groups on GO nanosheets (Figure 1); this phenomenon is more obvious with a higher GO content. The carboxyl group on GO formed intermolecular hydrogen bonds with the amide group in polyacrylamide, forming a 3D network structure with high strength to control the water molecules in the gel system. Meanwhile, the GO surface contained a large number of hydrophilic hydroxyl groups with strong polarity, which tend to form hydrogen bonds with water molecules, which also have strong polarity, further enhancing the binding force of the gel with 3D network structure to water molecules and improving its water locking ability. Due to the enhanced intermolecular forces, the polyacrylamide gel exhibits significantly improved thermal stability. Considering that the temperature of most reservoirs is lower than 160 °C [7,8], the polyacrylamide gels with GO have the potential to be used for water control in high-temperature reservoirs.

4. Conclusions

PAM-GO nanocomposite hydrogels have been successfully synthesized using PEI as a cross-linking agent. The hydrogels with varying amounts of PAM, GO, and PEI display improved mechanical strength, stiffness, and toughness, which is ascribed to the 3D network structure and the contribution of GO sheets as multifunctional cross-linkers and effective reinforcing nanofillers. Rheological testing showed that the strength and toughness of polyacrylamide gel increased with increasing content of the main agent (PAM). An optimal value exists for the amount of cross-linker PEI (0.3 wt.%) to obtain the strongest and toughest gel. With increasing GO content (0–0.2 wt.%), the stiffness decreased gradually, and the strength decreased first and then increased at 0.12 wt.%, but was always lower than those without GO, which exhibited characteristics of weak gel. On the other hand, the interactions between PAM and GO nanosheets may hinder the movement of the PAM molecular chain, resulting in a reduction in self-recovery performance of PAM/PEI/GO gels. The gelation time increased with the increasing GO concentration. A honeycombed structure was observed after adding GO nanosheets in the polyacrylamide gel, and the pore size of the 3D network structure tended to be larger compared to those without GO. With the increasing GO content, the pore size decreased and became uneven and shallower. The gels with 0.06 wt.% GO, 0.08 wt.% GO, and 0.12 wt.% GO have average pore sizes of 18.4 ± 7.19 μm, 14.55 ± 5.21 μm, and 6.08 ± 2.14 μm, respectively. DSC showed that the molecular bond strength of the polyacrylamide gel formed with GO is stronger than without GO thanks to the hydroxyl and carboxyl groups on GO nanosheets, further enhancing the thermal stability of the composite gel system. The novel nanocomposite hydrogels PAM/PEI/GO could have the potential to be used in ultra-deep and high-temperature reservoirs for water control.

Author Contributions

Resources, Y.-Q.Y. and T.-Y.X.; investigation, H.-P.Z., J.-J.C., B.-Y.Z. and X.-Y.L.; writing—original draft, H.-P.Z. and J.-J.C.; visualization, Y.W. and W.-B.J.; format analysis, X.S. and A.F.B.E.E.; supervision, J.L. All authors have read and agreed to the published version of the manuscript.

Funding

This research was funded by the Innovation Environment (talents, bases) Construction special Project—Natural Science Plan (Natural Science Fund) Youth Science Fund project of Xinjiang (grant number 2020D01B62), the National Natural Science Foundation of China (grant number 52104053), and the Research Start-up Fund of China University of Petroleum-Beijing at Karamay (grant number XQZX20200024 and XQZX20200013).

Conflicts of Interest

The authors declare no conflict of interest.

Nomenclature

PAMPolyacrylamide
PEIPolyethyleneimine
GOGraphene oxide
TEMTransmission electron microscopy
SEMScanning electron microscopy
DSCDifferential scanning calorimetry
XRDX-ray diffraction
FT-IRInfrared spectrum
G′Elastic modulus or storage modulus
G″Viscous modulus or loss modulus
δ Phase angle
tan δ Damping factor

References

  1. Fan, T.-Y.; Song, X.-M.; Wu, S.-H.; Li, Q.-Y.; Wang, B.-H.; Li, X.-B.; Li, H.; Liu, H.-L. A mathematical model and numerical simulation of waterflood induced dynamic fractures of low permeability reservoirs. Pet. Explor. Dev. 2015, 42, 541–547. [Google Scholar] [CrossRef]
  2. Han, Y.-J.; Zhou, C.-C.; Yu, J.; Li, C.-L.; Hu, F.-L.; Xu, H.-J. Experimental investigation on the effect of wettability on rock-electricity response in sandstone reservoirs. Fuel 2019, 239, 1246–1257. [Google Scholar] [CrossRef]
  3. Chu, H.-Q.; Han, W.-W.; Cao, W.-J.; Gu, M.-Y.; Xu, G.-J. Effect of methane addition to ethylene on the morphology and size distribution of soot in a laminar co-flow diffusion flame. Energy 2019, 166, 392–400. [Google Scholar] [CrossRef]
  4. Yang, H.; Hu, L.; Chen, C. Synthesis and plugging behavior of fluorescent polymer microspheres as a kind of conformance control agent in reservoirs. RSC Adv. 2018, 8, 10478–10488. [Google Scholar] [CrossRef] [PubMed] [Green Version]
  5. Yang, H.; Kang, W.; Yu, Y.; Yin, X.; Wang, P.; Zhang, X. A new approach to evaluate the particle growth and sedimentation of dispersed polymer microsphere profile control system based on multiple light scattering. Powder Technol. 2017, 315, 477–485. [Google Scholar] [CrossRef]
  6. Yang, H.; Shao, S.; Zhu, T.; Chen, C.; Liu, S.; Zhou, B.; Hou, X.; Zhang, Y.; Kang, W. Shear resistance performance of low elastic polymer microspheres used for conformance control treatment. J. Ind. Eng. Chem. 2019, 79, 295–306. [Google Scholar] [CrossRef]
  7. Bai, B.; Zhou, J.; Yin, M. A comprehensive review of polyacrylamide polymer gels for conformance control. Pet. Explor. Dev. 2015, 42, 525–532. [Google Scholar] [CrossRef]
  8. Zhang, S.-L.; Guo, J.-X.; Gu, Y.; Zhao, Q.; Yang, R.-J.; Yang, Y.-Q. Polyacrylamide gel formed by Cr(III) and phenolic resin for water control in high-temperature reservoirs. J. Pet. Sci. Eng. 2020, 194, 107423. [Google Scholar] [CrossRef]
  9. Wu, Q.; Ge, J.; Ding, L.; Wei, K.; Liu, Y. Identification and characterization of a proper gel system for large-volume conformance control treatments in a fractured tight reservoir: From lab to field. J. Pet. Sci. Eng. 2021, 198, 108119. [Google Scholar] [CrossRef]
  10. Sun, F.; Lin, M.; Dong, Z.; Zhu, D.; Wang, S.L.; Yang, J. Effect of composition of HPAM/chromium(III) acetate gels on delayed gelation time. J. Dispers. Sci. Technol. 2015, 37, 753–759. [Google Scholar] [CrossRef]
  11. Guan, H.; Berkland, C.; Moradi-Araghi, A.; Liang, J.T.; Christian, T.M.; Needham, R.B.; Cheng, M. Delayed Gelation of Polymers. U.S. Patent US201514847734, 8 September 2015. Available online: http://www.freepatentsonline.com/y2016/0137906.html (accessed on 18 May 2016).
  12. Hasankhani, G.M.; Madani, M.; Esmaeilzadeh, F.; Mowla, D.; Daryasafar, A. An experimental investigation of polyacrylamide and sulfonated polyacrylamides based gels crosslinked with cr(III)-acetate for water shutoff in fractured oil reservoirs. J. Dispers. Sci. Technol. 2018, 39, 1780–1789. [Google Scholar] [CrossRef]
  13. Xie, B.; Ma, J.; Wang, Y.; Tchameni, A.P.; Luo, M.; Wen, J. Enhanced hydrophobically modified polyacrylamide gel for lost circulation treatment in high temperature drilling. J. Mol. Liq. 2021, 325, 115155. [Google Scholar] [CrossRef]
  14. Chen, J.; Ao, Y.; Lin, T.; Yang, X.; Peng, J.; Huang, W. High-toughness polyacrylamide gel containing hydrophobic crosslinking and its double network gel. Polymer 2016, 87, 73–80. [Google Scholar] [CrossRef]
  15. Zhao, X.; Yang, H.; Wu, P.; Huang, X.; Wang, X. The preparation of MgO nanopowders synthesized via an improved polyacrylamide gel method. RSC Adv. 2019, 9, 14893–14898. [Google Scholar] [CrossRef] [PubMed] [Green Version]
  16. Sengupta, B.; Sharma, V.P.; Udayabhanu, G. A Study of the Effect of the Concentration of Constituents on the Characteristics of a Cross-Linked Polyacrylamide Gel. Pet. Sci. Technol. 2012, 30, 1865–1881. [Google Scholar] [CrossRef]
  17. Xu, J.; Finkenstadt, V.L. Rheological properties of reactive extrusion modified waxy starch and waxy starch-polyacrylamide copolymer gels. Starch-Stärke 2013, 65, 984–990. [Google Scholar] [CrossRef]
  18. Shen, J.; Li, K.; Muhammad, Y. Removal of Cu(II) ions from simulated wastewater using bagasse pith grafted polyacrylamide copolymer. Chem. Eng. Res. Des. 2020, 164, 361–372. [Google Scholar] [CrossRef]
  19. Punyodom, W. Novel Poly(Methylenelactide-g-L-Lactide) Graft Copolymers Synthesized by a Combination of Vinyl Addition and Ring-Opening Polymerizations. Polymers 2021, 13, 3374. [Google Scholar] [CrossRef]
  20. Farjood, M.; Zanjanchi, M.A. A new synthesis methodology for SiO2 gel-based nanostructures and their application for elimination of dye pollutants. New J. Chem. 2020, 44, 5386–5395. [Google Scholar] [CrossRef]
  21. Aqcheli, F.; Salehi, M.B.; Pahlevani, H.; Taghikhani, V. Rheological properties and the micromodel investigation of nanosilica gel-reinforced preformed particle gels developed for improved oil recovery. J. Pet. Sci. Eng. 2020, 192, 107258. [Google Scholar] [CrossRef]
  22. Li, Q.; Yu, X.; Wang, L. Nano-silica hybrid polyacrylamide/polyethylenimine gel for enhanced oil recovery at harsh conditions. Colloids and Surfaces A. Physicochem. Eng. Asp. 2022, 633, 127898. [Google Scholar] [CrossRef]
  23. Shamlooh, M.; Hamza, A.; Hussein, I.A.; Nasser, M.S.; Magzoub, M.; Salehi, S. Investigation of the Rheological Properties of Nanosilica-Reinforced Polyacrylamide/Polyethyleneimine Gels for Wellbore Strengthening at High Reservoir Temperatures. Energy Fuels 2019, 33, 6829–6836. [Google Scholar] [CrossRef]
  24. Piao, Y.-Z.; Chen, B.-Q. Synthesis and mechanical properties of double cross-linked gelatin-graphene oxide hydrogels. Int. J. Biol. Macromol. 2017, 101, 791–798. [Google Scholar] [CrossRef] [PubMed]
  25. Tarashi, S.; Nazockdast, H.; Sodeifian, G. A comparative study on microstructure, physical-mechanical properties, and self-healing performance of two differently synthesized nanocomposite double network hydrogels based on κ-car/PAm/GO. Polymer 2020, 188, 122138. [Google Scholar] [CrossRef]
  26. Bashir, S.; Hasan, K.; Hina, M. Conducting polymer/graphene hydrogel electrodes based aqueous smart Supercapacitors: A review and future prospects. J. Electroanal. Chem. 2021, 898, 115626. [Google Scholar] [CrossRef]
  27. Sun, Y.; Zhang, K.; Deng, R.; Ren, X.; Wu, C.; Li, J. Tunable stiffness of graphene oxide/polyacrylamide composite scaffolds regulates cytoskeleton assembly. Chem. Sci. 2019, 9, 6516–6522. [Google Scholar] [CrossRef] [Green Version]
  28. Dong, Y.; Wu, W.; Liang, L.; Tao, S.; Meng, X.J.N.E.; Technology, P. Preparation and Adsorption Properties of Polyacrylamide/Graphene Oxide Composite Aerogel. J. Biomater. Tissue Eng. 2016, 19, 627–636. [Google Scholar] [CrossRef]
  29. Fathinejad, H.; Souri, A. Study of swelling behavior of hydrogel nanocomposite based on polydopamine-graphene oxide–polyacrylamide. Fuller. Nanotub. Car. Nanostruct. 2021, 30, 503–507. [Google Scholar] [CrossRef]
  30. Yan, X.-Q.; Yang, J.; Chen, F. Mechanical properties of gelatin/polyacrylamide/graphene oxide nanocomposite double-network hydrogels. Composites Science and Technology Compos. Sci. Technol. 2018, 163, 81–88. [Google Scholar] [CrossRef]
  31. Wang, B.; Lin, M.; Guo, J.; Wang, D.; Xu, F.; Li, M. Plugging properties and profile control effects of crosslinked polyacrylamide microspheres. J. Appl. Polym. Sci. 2016, 133, 30. [Google Scholar] [CrossRef]
  32. Zhu, D.; Bai, B.; Hou, J. Polymer Gel Systems for Water Management in High-Temperature Petroleum Reservoirs: A Chemical Review. Energy Fuels 2017, 31, 13063–13087. [Google Scholar] [CrossRef]
  33. Hummers, W.-S.; Offeman, R.-E. Preparation of graphitic oxide. J. Am. Chem. Soc. 1958, 80, 1339. [Google Scholar] [CrossRef]
  34. Zhang, Y.-P.; Xu, J.-J.; Sun, Z.-H.; Li, C.-Z.; Pan, C.-X. Preparation of graphene and TiO2 layer by layer composite with highly photocatalytic efficiency, Prog. Nat. Sci. 2011, 21, 467–471. [Google Scholar] [CrossRef] [Green Version]
  35. Meiqin, L.I.N.; Xianxian, W.E.I.; Zhaoxia, D.O.N.G.; Zihao, Y.A.N.G.; Feifei, S.U.N. Rheological Properties of Starch Graft Polyacrylamide Gel. Acta Pet. Sin. 2020, 36, 801–811. [Google Scholar] [CrossRef]
Figure 1. The structure diagram of GO.
Energies 15 05714 g001
Figure 2. Transmission electron microscope (TEM) picture of graphene oxide.
Energies 15 05714 g002
Figure 3. Cross-linking mechanism of PAM with PEI.
Energies 15 05714 g003
Figure 4. Mechanism diagram of GO-doped PAM gel.
Energies 15 05714 g004
Figure 5. Photos of PAM/PEI/GO gels with 2.0 wt.% PAM, 0.1 wt.% PEI, and various GO concentrations. (a) Without GO; (b) 0.006 wt.% GO; (c) 0.08 wt.% GO; (d) 0.12 wt.% GO.
Energies 15 05714 g005
Figure 6. (a) XRD, (b) FT-IR spectra, and (c) Raman spectra of GO, gel with 0.08 wt.% GO, gel with 0.16 wt.% GO.
Energies 15 05714 g006
Figure 7. (a) Storage modulus (G′), (b) loss modulus (G″), and (c) phase angel (δ) of gels with 0.2 wt.% PEI, 0.1 wt.% GO, and different concentrations of PAM.
Energies 15 05714 g007
Figure 8. Relationship between shear stress and shear rate (γ~τ) of the gels with 0.2 wt.% PEI, 0.1 wt.% GO, and different concentrations of PAM.
Energies 15 05714 g008
Figure 9. Creep-reversion performance curves of the gels with 0.2 wt.% PEI, 0.1 wt.% GO, and different concentrations of PAM.
Energies 15 05714 g009
Figure 10. (a) Storage modulus (G′), (b) loss modulus (G″), and (c) phase angel (δ) of gels with 3.0% PAM, 0.1 wt.% GO, and different concentrations of PEI.
Energies 15 05714 g010
Figure 11. Relationship between shear stress and shear rate (γ~τ) of the gels with 3.0% PAM, 0.1 wt.% GO, and different concentrations of PEI.
Energies 15 05714 g011
Figure 12. Creep-reversion performance curves of the gels with 3.0% PAM, 0.1 wt.% GO and different concentrations of PEI.
Energies 15 05714 g012
Figure 13. (a) Storage modulus (G′), (b) loss modulus (G″), and (c) phase angel (δ) of gels with 3.0% PAM, 0.1 wt.% PEI, and different concentrations of GO.
Energies 15 05714 g013
Figure 14. Relationship between shear stress and shear rate (γ~τ) of the gels with 3.0% PAM, 0.1 wt.% PEI, and different concentrations of GO.
Energies 15 05714 g014
Figure 15. Creep-reversion performance curves of the gels with 3.0% PAM, 0.1 wt.% PEI, and different concentrations of GO.
Energies 15 05714 g015
Figure 16. Relationship between the gelation time and the GO content.
Energies 15 05714 g016
Figure 17. SEM images of PAM/PEI gels with fixed PEI concentration of 0.1 wt.% (ac) and fixed PAM concentration of 3.0 wt.% (df): (a) 2.0 wt.%PAM; (b) 3.0 wt.%PAM; (c) 4.0 wt.% PAM; (d) 0.06 wt.% PEI; (e) 0.2 wt.% PEI; (f) 0.4 wt.% PEI.
Energies 15 05714 g017
Figure 18. SEM images of PAM/PEI/GO gel with 3.0% PAM, 0.1% PEI, and different concentrations of GO: (a,d) 0.06 wt.% GO; (b,e) 0.08 wt.% GO; (c,f) 0.12 wt.% GO.
Energies 15 05714 g018
Figure 19. DSC thermograms of gel systems formed by different contents of GO.
Energies 15 05714 g019
Table 1. Different sample concentrations.
SamplesConcentrations (wt.%)SamplesConcentrations (wt.%)SamplesConcentrations (wt.%)
PAM2GO0.01Cross-linker PEI0.2
30.020.3
40.040.4
50.080.5
60.160.6
0.8
Publisher’s Note: MDPI stays neutral with regard to jurisdictional claims in published maps and institutional affiliations.

