1. Introduction
Rising water temperatures are a concern and have begun to threaten thermally sensitive species such as trout that rely on cold water for survival and optimal growth. While trout can survive temperatures up to 25 °C [
1,
2,
3], optimal growth occurs in temperatures between 13 and 14 °C. For the trout with an initial weight of 0.5 kg, the daily percentage of growth falls from 3.5% to 1% at temperatures above 14 °C [
3]. At temperatures above 19 °C, trout become stressed [
4], resulting in negative impacts on feeding and growth. During feeding, trout require more oxygen than resting, and at higher temperatures oxygen concentration decreases. At temperatures above 22 °C trout do not feed [
5]. The growth and survival of trout are important for angling communities but also affect the state and federal agencies that manage trout hatcheries and fisheries. Reduced growth may result in a negative reputation for local fisheries important to tourism, and higher water temperatures resulting in trout mortality require the additional expense to grow and restock the population.
One solution to this problem is introducing localized man-made refugia to the stream to increase the available trout refuge. It has been shown that trout utilize thermal refugia created by groundwater seeps and thermal stratification during periods of warmer water temperatures [
6,
7]. However, these pockets of refugia are often small and may not provide adequate refugia to support areas with higher trout densities. While some literature focuses on man-made infrastructure to reduce drought impacts [
8], the lack of pertinent literature on man-made trout refugia highlights the need for practical solutions to this problem.
The design of the thermal refugia must allow fish access to the cooler area, and hence a heat exchanger consisting of a bundle of tubes wherein the spacing between the tube rows would be large enough to allow fish species to freely move into cooler areas is a possible design for the refugia. Heat exchangers consisting of tube bundles have been used for numerous applications [
9,
10,
11,
12,
13,
14]. However, using it in a thermal refuge presents unique design challenges. It must provide adequate cooling to reduce the temperature of the surrounding water while allowing fish to access the refugia and maintaining a minimal electric power draw. Previously, the authors conducted lab-scale experiments with heat exchanger prototypes [
15,
16]. The lab-scale heat exchanger configurations were tested in a 1/10-scale model of a section of Spring Creek, South Dakota. The results demonstrated the need for an enclosure to surround the heat exchanger. While a heat exchanger placed directly in the stream resulted in a small decrease in water temperature near the heat exchanger, it required a significant heat transfer rate, and thus correspondingly power, to achieve that cooling effect. However, by utilizing an enclosure that surrounds the heat exchanger on all sides except for a downstream aperture, the average temperature difference between the freestream and the water temperature near the heat exchanger increased to 1.95 °C, which is three times the value without the enclosure (0.64 °C). Additionally, the heat transfer requirement per degree of cooling was significantly reduced to about a third of the requirement without the enclosure.
Building on the small-scale testing, the present work focuses on the development of a larger-scale prototype and testing it in French Creek, South Dakota. To the authors’ best knowledge, the thermal refugia developed and field-tested in this study is a first-of-its-kind prototype and study. The prototype uses a tube-bundle heat exchanger in an enclosure with a downstream aperture as analyzed in the lab-scale experiments [
15,
16]. Prototype design variables tested include the enclosure length relative to the heat exchanger size, aperture size, and cooling fluid flow rates through the heat exchanger.
2. Prototype Description
A schematic diagram of the prototype thermal refugia system used in the experiments is shown in
Figure 1. The prototype of the thermal refugia system consists of three major subsystems: (i) The thermal refugia subsystem which consists of a heat exchanger and an enclosure; (ii) the cooling subsystem which consists of a chiller and a storage tank; (iii) the electricity generation and storage subsystem which consists of a photovoltaic (PV) system with a battery bank to power the cooling subsystem. There are several auxiliary elements to the prototype such as PEX tubing to transport cold water to the heat exchanger; pumps to circulate the cooling water; temperature sensors inside the enclosure, and at the inlet and outlet of the heat exchanger; a mass flow meter to measure the cooling water flow rate; and a charge controller and an inverter for the PV system.
A staggered, single-pass tube-bundle heat exchanger, as shown in
Figure 2. and the schematic in
Figure 3, was fabricated. The overall dimensions of the heat exchanger are 66.0 cm in length (L), 50.8 cm in width (w), and 30.5 cm in height (h). A total of 39, 1.27 cm diameter copper tubes each having a length of 60.9 cm are connected via copper elbows into 13 rows. A longitudinal pitch of 5.0 cm and a transverse pitch of 7.6 cm between the tubes are used to provide spacing for the trout to move freely in the cold region. Two 0.3 cm-thick, aluminum plates are used to increase the area for heat transfer and provide structural support for the heat exchanger tubing.
To isolate the thermal refugia from the free stream, an enclosure made of PVC sheets was fabricated to surround the heat exchanger. The enclosure surrounds the heat exchanger on all sides except for a downstream aperture to allow fish to enter and exit the enclosure. The base enclosure is shown in the picture in
Figure 2 and schematically in
Figure 4. It has a length of 91.5 cm, a width of 91.5 cm, and a height of 45.8 cm. The length of the base enclosure is 1.38 times the heat exchanger length. An optional, extension for the enclosure has a length of 30.5 cm, which, when added to the base enclosure, increases the length by 33%. With the extension, the enclosure is 1.85-times the length of the heat exchanger. To change the size of the aperture of the enclosure, a panel of 22.9 × 91.5 cm
2 is used, which reduces the aperture of the enclosure by 50% by blocking the top half of the aperture. Schematics of the enclosure with panel and extension configurations are shown in
Figure 4a.
A schematic of the top view of the heat exchanger and enclosure configuration showing the thermistor locations is shown in
Figure 4b. A total of 5 Hobo MX2203 series temperature loggers were used inside the enclosure to record the temperatures during experiments. Sensor #1 is located near the aperture of the base enclosure. Sensors #2 and #3 are located at approximately 1/3 of the length of the base enclosure as measured from the base enclosure’s aperture. While Sensors #4 and #5 are located at approximately two-third of the base enclosure length. Hereafter, the “back of the enclosure” refers to near the aperture, while the front of the enclosure is the opposite, closed end. Thus, Sensors 2 and 3 are in the back half of the enclosure and Sensors 4 and 5 are in the front half. The positions of the sensors were held constant when modifications to the enclosure were made. In addition to these temperature measurements, the stream temperature at a location upstream of the cooling system unaffected by the heat exchanger (aka the free stream temperature) was recorded with a Hobo MX2203 temperature logger. The heat exchanger inlet and outlet temperatures were recorded using thermocouples. The data from each sensor was calibrated relative to the free stream sensor by conducting two isothermal calibration tests. The temperatures of the two tests (7.22 °C and 4.44 °C) were selected to approximate the range of temperatures encountered in the stream experiments. During the calibration test, each of the sensors was submerged into a body of water maintained at the constant temperatures by a chiller, and steady-state temperature data were recorded for 30 min. From this data, an average difference for each sensor between its measurements and those of the free stream sensor was obtained and used to correct the data collected from the stream experiments. The uncertainty of the temperature measurements post-correction, based on the calibration test data, is ±0.204 °C.
The heat exchanger is plumbed to a 189 L cold-water storage tank which is shown in
Figure 5. The storage tank was insulated during experiments to minimize loss to the environment. The tank stores cold water from the chiller thus allowing immediate cooling as soon as cooling is required in the thermal refugia. An inline 190 W utility pump is used to pump the cooling water from the cold-water storage tank through the heat exchanger. The slightly warmer water from the heat exchanger outlet returns to the cold-water storage tank. A valve on the inlet tube to the heat exchanger is used to adjust the heat exchanger flow rate. A DM-P series turbine flow meter (uncertainty of ±0.001
) manufactured by Assured Automation is used to measure the flow rate through the heat exchanger. To keep the water in the storage tank cool, it is plumbed to a 370 W, air-cooled chiller as shown in
Figure 5. A 70 W inline utility pump is used to pump water from the chiller to the cold-water storage tank.
The prototype thermal refugia system is powered by a PV system. The total electrical power required to operate the prototype thermal refugia system is approximately 0.64 kW, which includes the chiller and two water pumps. Electricity is generated from an array of four 120-cell monocrystalline solar panels manufactured by Trina Solar (model# TRI-TSM-330DD06M-BK) each having a rated power output of 330 W. To store the electricity, four 12 V, 200 Ah batteries are connected into a 24 V, 400 Ah battery pack is used (
Figure 5). The PV panels generate enough electric power to run the cooling system and charge the battery at the same time when enough insolation (e.g., >500
) is available. When the insolation is not sufficient to run the cooling system, it draws energy from the battery pack.
The prototype was tested in French Creek, South Dakota. The stream has a varied depth and width. The average flow rate of the stream was 0.20 . Based on the hydraulic diameter calculated from depth and width measurements of the stream, the Reynolds number (Re) varied between 41,000 and 104,000 depending on location. The Re was 60,000 at the location where the refuge was set up in the stream.
3. Experimental Conditions and Metrics
Experiments were carried out for the five different prototype configurations and experimental conditions as listed in
Table 1. Due to logistics constraints, these tests were conducted in late fall, and thus, as shown in
Table 1, the stream temperatures were cooler and did not need additional cooling at this point. However, the experiments still provide a relative comparison between the enclosure designs. For Test Condition 1, the heat exchanger was placed directly in the base enclosure (length of 91.5 cm). For tests 3, 4, and 5, the extension (additional length of 30.5 cm) was added to the base enclosure which increases the enclosure length by 33%. Test conditions 1, 3, and 5 had a fully open aperture (height of 45.8 cm). For tests 2 and 4, a panel was attached to block the top half of the aperture and thereby decrease the height of the aperture to 22.9 cm. For the Test Conditions 1 to 4, the heat exchanger flowrate was ~0.12
(Re = 2305) and for Test Condition 5, the flowrate was ~0.068
(Re = 1306). The lower flow rate was investigated to see the effect of flow rate and determine if a smaller pump, which would have less electricity consumption, could be utilized.
To evaluate the performance of the prototype thermal refugia system, the instantaneous temperature difference (
) between the free stream (
) and each enclosure sensor temperature (
) and the instantaneous heat transfer (
are calculated. The time-average temperature difference (
) between the average free stream temperature (
) and the time-average temperature inside the enclosure at each measurement location (
) is calculated. The average (spatially and temporally) temperature inside the enclosure (
) is calculated by averaging the time-average temperatures (
) of all the enclosure temperature sensors. The average temperature difference of the enclosure (
—Equation (4)) is the difference between the average free stream temperature (
) and average temperature inside the enclosure (
). In the subsequent discussions, the average temperature difference is also referred to as the degree of cooling. The time-average heat transfer (
) is also calculated from the instantaneous heat transfer rate (
q). The ratio of
to
is evaluated to compare the heat transfer rate per degree of cooling. To help minimize differences in the data due to each test having different stream temperatures and heat exchanger inlet temperatures, the dimensionless, time-average temperature difference (
) at each location inside the enclosure and the dimensionless, average (spatially and temporally) temperature difference (
) inside the enclosure are calculated using Equations (5) and (6), respectively. To non-dimensionalize, the temperature difference, the maximum possible temperature difference, i.e., the difference between the freestream temperature and the heat exchanger inlet temperature, is used. The ratio of
to
is evaluated to compare the heat transfer rate required per dimensionless cooling effect. To help quantify the temperature variations within the enclosure, the standard deviations of the average temperature difference (
) and the average, dimensionless temperature difference
are also calculated.
4. Results and Discussion
The instantaneous results from Test Condition 3 (
Figure 6 and
Figure 7) are highlighted to show that, for a given test condition, relatively steady behavior is obtained. All other test conditions exhibited similar behavior over time. The duration of each test included approximately 100 min of this relatively steady behavior.
Figure 6 shows the instantaneous temperature (
) at the different measurement positions including the free stream and inside the enclosure during the relatively stable timeframe of the test. There is a slight, general upward trend in temperature of approximately 0.86 °C at each location due to increasing ambient temperatures. However, the temperature differences between each measurement location in the enclosure and free stream are relatively steady during the experiment. During the test, the average free stream temperature is approximately 9.69 °C. The temperature measurements inside the enclosure show the cooling effect of the heat exchanger. The average temperature inside the enclosure ranges from ~8.59 to 9.36 °C. One reason there is a relatively small difference from the free stream is the stream temperature was near the lower temperature limit that the chiller could provide, thus there was a low driving potential for heat transfer under these conditions. The most significant cooling effect occurs at sensor #2, with a temperature of approximately 1.10 °C less than the free stream. The sensors in the front half of the enclosure (sensors #4 and #5) and location #3 show similar temperatures while sensor #1 is the warmest location in the enclosure. Location #1 is the warmest due to being near the aperture where there is more mixing with warmer free stream flow. As shown in
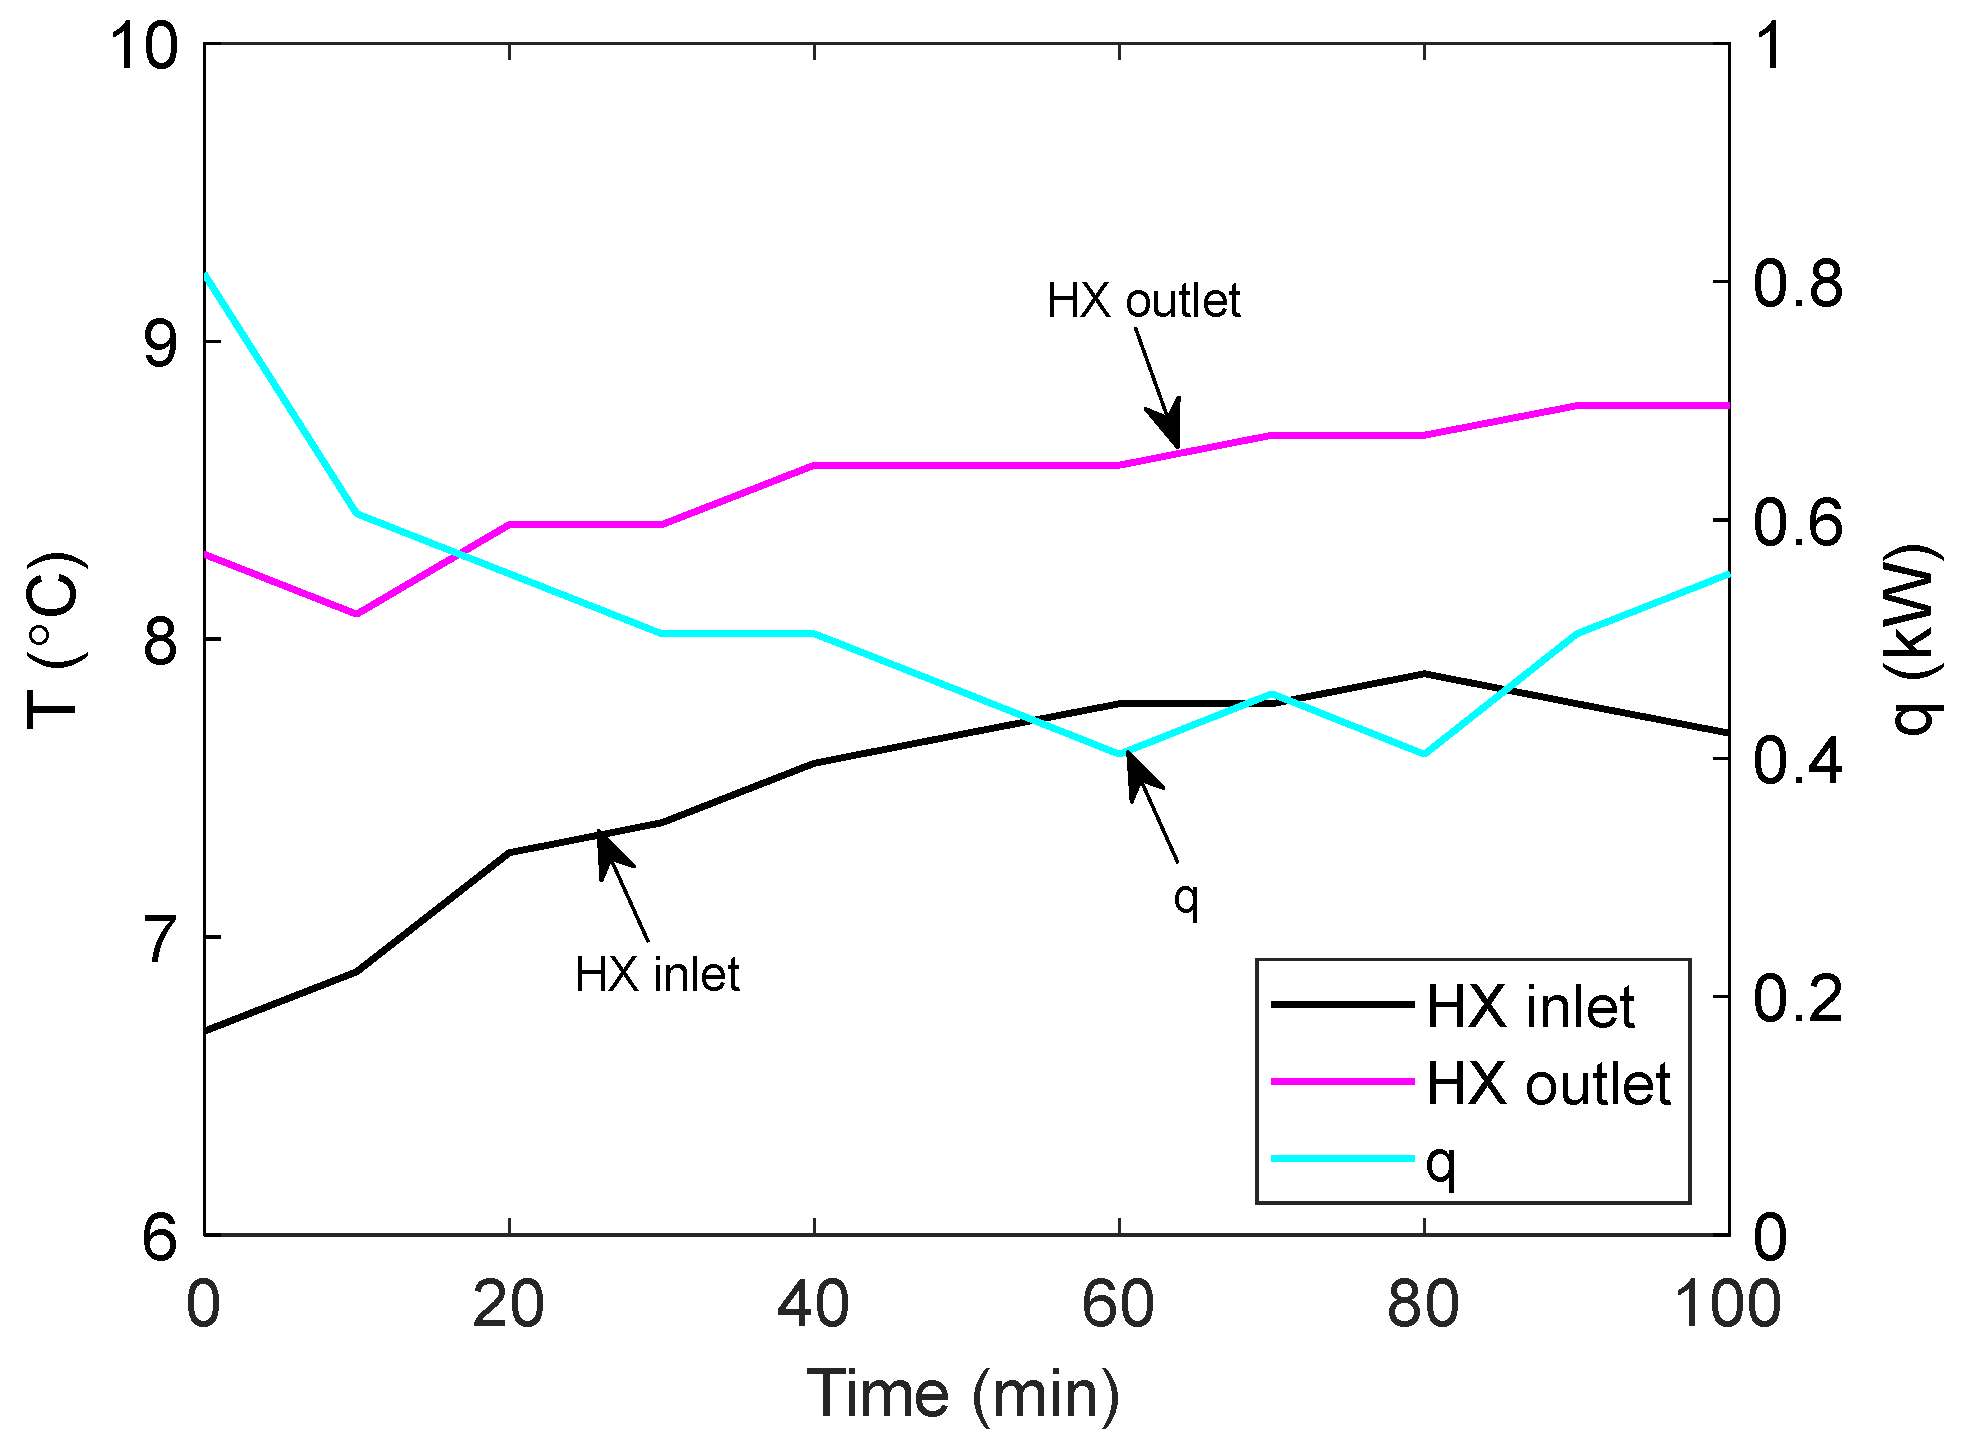
Figure 7, the cooling water from the chiller enters the heat exchanger at approximately 7.49 °C and exits at approximately 8.53 °C for Test Condition 3. With a flow rate of 0.12
, this decrease in cooling water temperature corresponds to an average heat transfer rate of approximately 0.52 kW.
Figure 8 shows the effects of the enclosure configurations on the average degree of cooling and heat transfer.
Figure 8a compares the dimensionless, average temperature difference (
) versus the corresponding average heat transfer per dimensionless degree of cooling (
q/) for each test condition.
Figure 8b provides the corresponding values for the dimensional versions of these metrics (
and
q/
). For Test Condition 1, using only the base enclosure, the dimensionless, average temperature difference is 0.069, which is significantly smaller than other test conditions. Additionally, the average heat transfer required per dimensionless, average temperature difference is significantly higher (9.28 kW/
).
Figure 8b also confirms that with the base enclosure the absolute temperature difference is small (0.13 °C) and the required heat transfer is high (5.10 kW/°C). As such, it can be hypothesized that the base enclosure (Test Condition 1) allows for significant water exchange and mixing with the warmer free stream. As a result, the average temperature inside the enclosure remains very close to the free stream temperature. Utilizing a panel (Test Condition 2) or an extension (Test Condition 3) results in a similar dimensionless, average temperature difference (0.26 vs. 0.31) and average heat transfer required per dimensionless cooling effect (1.92 vs. 1.68 kW/
), with the extension having a slightly better impact. But both are a significant improvement over the base enclosure. Compared to the base enclosure, the dimensionless temperature difference is approximately quadrupled and the average heat transfer per dimensionless cooling effect is approximately one-fifth of the base enclosure design. The panel or the extension improves the cooling effect by better isolating the cooled interior of the enclosure from the free stream. From
Figure 8b, with the extension (Test Condition 3), the absolute temperature difference (0.68 °C) is higher compared to that with the panel (0.29 °C) due to a higher difference between the ambient temperature and cooling water temperature during these tests (
Table 1). Adding both the panel and the extension (Test Condition 4) had the best performance. It showed the largest dimensionless, average temperature difference (0.55) as well as the largest absolute temperature difference (~1 °C). Additionally, it required the lowest heat transfer rate per degree of cooling at 0.81 kW/
(0.45 kW/°C) which is an order of magnitude improvement compared to the base enclosure. The combination of the panel and the extension significantly limits the mixing and exchange of enclosure water with the free stream water, resulting in a higher degree of cooling and a lower heat transfer requirement. It achieved approximately 55% of the maximum degree of cooling that was possible for the experimental conditions, which is nearly double that of the other enclosure configurations and almost an order of magnitude improvement from the base design.
Comparing the results of Test Condition 5 to Test Condition 3 shows the effect of cooling water mass flow rate. These two test conditions have the same enclosure configuration but Test Condition 5 has a lower mass flow rate. The lower mass flow of the cooling water resulted in a smaller dimensionless, average temperature difference (0.15 vs. 0.31). The absolute degree of cooling is also reduced with the lower mass flow rate (
Figure 8b). Since the mass flow rate directly impacts the heat transfer coefficient inside the tubes of the heat exchanger due to the lower fluid velocity, this result indicates that the heat transfer rate for this configuration is not only limited by the stream-side heat transfer coefficient but also significantly impacted by the heat transfer coefficient inside the tubes of the heat exchanger.
Thus, a key requirement for minimizing the heat transfer rate required per degree of cooling and achieving a high degree of cooling is to limit water exchange between the enclosure and the free stream. However, the thermal refugia subsystem designs are sensitive to the thermal resistance between the heat exchanger and the water in the enclosure. As such, care should be taken to prevent isolating the enclosure to the degree that it stagnates the fluid motion inside the enclosures and thus limits the heat transfer rate or using too low of a flow rate in the heat exchanger. However, that stagnation point has not yet been reached with these enclosure designs, and one possible method for improvement is to increase the cooling water mass flow rate.
Figure 9a shows the temperature distribution within the enclosure by comparing the time-average, dimensionless temperature difference (
) at each measurement location for Test Conditions 1–5, and
Figure 9b provides the time-average, temperature difference (
). The locations for the maximum and minimum temperature differences are the same for the different test conditions except for Test Condition 1. For Test Condition 1, the temperature distribution is fairly uniform. Due to the low degree of cooling achieved, the differences between the maximum and minimum temperature difference are small and the entire enclosure remains very close to the free stream temperature. The dimensionless temperature difference only varies from 0 to 0.2 (
Figure 9a), which corresponds to an actual temperature difference from 0 to 0.3 °C (
Figure 9b), so there is little statistical relevance to the distribution of the maximum and minimum. For tests 2–5, location #1 experiences the smallest dimensionless temperature difference. This smaller difference is because thermistor 1 is located closest to the enclosure aperture, and so water at this location mixes more readily with the warmer free stream water. Comparing within a given test condition, locations 3, 4, and 5 have a similar dimensionless temperature difference (within ±0.014 of each other). While locations 2 and 3 are both in the back half of the enclosure, location 2 likely has a larger temperature difference due to the complex flow in the stream and the position of the enclosure in the stream which affects how the free stream water enters the enclosure. Likely, water from the free stream more readily flows to location 3 then to the front of the enclosure before interacting around location 2. Using the panel or the extension (Test Conditions 2 and 3) showed improvement in the temperature difference at every location compared to the base enclosure (Test Condition 1). Adding both the panel and the extension (Test Condition 4) showed the largest dimensionless temperature difference as well as the largest absolute temperature difference at each location. As such, for the designs considered, while the enclosure configuration impacts the magnitude of the temperature difference at each location, it does not significantly impact where the maximum and minimum temperature locations occur within the enclosure.
Figure 10a shows the dimensionless, average temperature difference versus the standard deviation of the dimensionless, average temperature difference, and
Figure 10b shows the average temperature difference versus the standard deviation of the average temperature differences. Test Condition 1 (base enclosure) has the smallest dimensionless, average temperature difference (0.069), but also has the smallest standard deviation (0.085) meaning the temperature inside of the enclosure is more evenly distributed compared to other test conditions. However, as shown in
Figure 9, this distribution is even because it is nearly the temperature of the free stream. With the exception of Test Condition 4, as the average degree of cooling increases, due to modifications to the enclosure, the standard deviation increases. Adding the panel (Test Condition 2) or the extension (Test Condition 3) increases the standard deviation, but the panel causes a more uneven temperature distribution than the extension. Thus, it is important to have an extension much longer than the heat exchanger to help limit temperature variations. A notable difference occurs by utilizing the extension and panel (Test Condition 4) because it does not yield a higher dimensionless standard deviation even though the degree of cooling increases. Test Conditions 3 and 4 have the same dimensionless standard deviation (0.143), and both are less than Test Condition 2 (0.16). Comparing Test Condition 4 to Test Condition 2, the standard deviation is reduced because of the addition of the extension. The decline in the standard deviation of dimensionless temperature difference is attributed to less interaction between water in the front of the enclosure with the free stream. As shown in
Figure 9, while the temperature difference increases at each location for Test Condition 4 vs. 3, the largest increase is at location 1 which is the location nearest to the aperture. Thus, the combination of the panel and extension is not just better at isolating the water around the heat exchanger, but most of the water in the enclosure and thus creating a larger volume of cooled water. A lower mass flow rate of the cooling water in Test Condition 5 compared to Test Condition 3, resulted in a lower dimensionless standard deviation (0.143 vs. 0.114). However, this is due to the lower degree of cooling achieved as shown by the average temperature difference (0.15 vs. 0.31) and the individual location temperature differences in
Figure 9.
5. Conclusions
A first-of-its-kind solar-powered prototype system designed to provide thermal refugia for cold-water fish was successfully tested in a stream. The prototype maintained a region of water colder than the surrounding stream temperatures. While the reduction in temperature (~1 °C) was small due to cold stream temperatures during the time of testing, the current work demonstrates that man-made thermal refugia can be provided in a stream. To create the refugia in the stream, a heat exchanger inside an enclosure with a downstream aperture was utilized. Various configurations of the enclosure were investigated over a series of tests. The prototype variations were evaluated based on the temperature difference between the water inside the enclosure and the free stream, i.e., the degree of cooling, the heat transfer per degree of cooling, and the temperature distribution within the enclosure. For the enclosure designs considered, the enclosure design did not have a significant impact on the locations of maximum and minimum temperature. As a greater degree of cooling is achieved, it can lead to a greater difference between the maximum and minimum locations. However, the enclosure design can help minimize this effect and provide as large a cooled volume as possible. The combined panel and extension configuration had a much higher degree of cooling than the panel-only or extension-only configuration, but it had an equivalent or a lower standard deviation in the temperature differences. The base enclosure (1.38-times longer than the heat exchanger) did not sufficiently isolate the refugia and resulted in a very small degree of cooling and required a high heat transfer per degree of cooling. Adding a panel to reduce the aperture by half or an extension to make the enclosure 1.85-times longer than the heat exchanger, significantly improved the degree of cooling and reduced the heat transfer to achieve that temperature difference. With these modifications, the average dimensionless temperature difference approximately quadrupled to 0.31, and the heat transfer per dimensionless degree of cooling was reduced to approximately one-fifth of the base configuration value. However, decreasing the mass flow rate in the heat exchanger for the extension-only configuration, resulted in a lower degree of cooling due to the higher thermal resistance associated with lower velocities. The best performance was achieved by using both the panel and the extension. This configuration, which likely has the least amount of water exchange with the free stream, showed the largest dimensionless temperature difference (0.55), which is nearly double that of the panel-only or extension-only configurations. Additionally, it had the lowest heat transfer rate per dimensionless degree of cooling at 0.81 kW/ which is nearly half of the heat transfer for the panel-only or extension-only configuration and an order of magnitude lower than the base enclosure. Thus, the enclosure design is a significant factor in the refugia’s performance. It needs to limit water exchange between the enclosure and the free stream to achieve a high degree of cooling while minimizing the heat transfer rate required per degree of cooling. However, care needs to be taken to not excessively increase the thermal resistance, e.g., by using too low a flow rate through the heat exchanger, and thereby reducing the heat transfer. To achieve this isolation, the current work shows the need for an enclosure that is longer than the heat exchanger (e.g., 1.85× longer) and an aperture much smaller than the cross-sectional area of the enclosure.


