Article

Techno-Economic Evaluation of a Hybrid Energy System for an Educational Institution: A Case Study

by
Saheed Lekan Gbadamosi
1,2,*,
Fejiro S. Ogunje
2,
Samuel Tita Wara
3 and
Nnamdi I. Nwulu
1
1
Center for Cyber Physical Food, Energy and Water Systems, University of Johannesburg, Johannesburg 2006, South Africa
2
Department of Electrical, Electronic and Computer Engineering, Afe Babalola University, Ado-Ekiti 260213, Nigeria
3
Office of the Vice Chancellor, Havilla University, Nde-Ikom (HUNI), Nde 562261, Nigeria
*
Author to whom correspondence should be addressed.
Energies 2022, 15(15), 5606; https://doi.org/10.3390/en15155606
Submission received: 16 June 2022 / Revised: 23 July 2022 / Accepted: 27 July 2022 / Published: 2 August 2022

Abstract

:
This study evaluates the technical, economic and environmental benefits of renewable energy resources (RER) for electricity supply to large size buildings in an educational institution. The cost of energy generation coupled with the epileptic power supply has led to the demand for an alternative source of energy supply to an education institution in Nigeria. The essence of renewable energy generation is becoming more glaring and a hybrid energy system (HES) is believed to deliver efficient and sustainable energy for the institutions; this paper aims to analyse the techno-economic assessment of a HES design setup at the College of Engineering, Afe Babalola University Ado-Ekiti for powering the university buildings; this grid connected system was assessed with various system configurations was simulated using hybrid optimization model for electric renewables (HOMER) software and the levelized cost of energy (LCOE) with the consideration of the HES benefits was developed. The results obtained from the simulation indicate that the grid and solar Photovoltaic (PV) system provide an optimal system that adequately meets the load demand with more renewable energy integration and this significantly reduces the cost of energy by 45% and also causes a 32.09% reduction in CO2 emissions; this configuration is environmentally sustainable and financially suitable for electrifying an educational institution.

1. Introduction

The energy demand across the globe is increasing significantly owing to the shortage of fossil fuels, population increase and economic development. Presently, over a billion people across the world are without access to electricity [1], thereby crippling several sectors across the world. Among the sectors seriously affected is the education sector, which is becoming a leading electricity consumer globally due to the large structures within this sphere and the steady need of electricity supply for so many uses within the institutions [2]; moreover, a constant supply of electricity from the conventional fossil fuel generators are being threatened due to hike in fuel price caused by war and continuous calls for environmental pollution reduction. Therefore, the viable alternative to solve this current situation is the use of renewable energy resources to meet the growing energy demand in the world. The RERs are clean and environmental-friendly energy sources such as wind, solar, hydro, biomass and hydro that significantly reduce emissions and ensure energy sustainability [3,4]. In recent years, RERs have been attracting attention in meeting the growing energy demand with a reduced operational cost and decarbonization of the emissions; these RERs are faced with the problem of unstable energy generation due to their unpredictability and unstable nature [5]. Therefore, to solve this issue, the deployment of more than one energy source will increase energy efficiency and ensure system reliability [6]. The most preferable approach to RERs intermittent nature is the deployment of energy mix configurations from more than two energy sources.
Many studies have discussed the design optimization of the hybrid energy system with a focus on renewable energy resources and energy storage for electricity supply. Ref. [1] explores the potential of PV-wind-diesel and PV-wind-battery hybrid systems to meet the demand of small residential apartments in Saudi Arabia. Ref. [7] presents biomass, wind and solar hybrid energy systems to satisfy the load profile of a village community in India. Ref. [8] proposed the integration of gravity energy storage with hybrid wind and PV for an off-grid system to evaluate its optimal operation and system design. In Ref. [9], the authors present a comparison evaluation of PV-battery storage and PV-wind-battery storage system for powering multistorey buildings in residential areas. Ref. [10] presents a PV, battery storage and heat pump for electrification of complex buildings with consideration to sizing and optimal operating conditions of the hybrid energy system.
Similarly, some reviews discussed the optimization design of grid-connected hybrid systems. Ref. [11] presents a grid-connected hybrid system for rural electrification of Kallar Kahar. The hybrid RER consists of solar, biomass and wind energy. The optimization design was modelled using Homer software. In [12], both an off-grid and grid-tied hybrid energy system were presented based on their economic and environmental impacts. The paper presents several system configurations based on the climatic condition potential in the region and HOMER software was used for the optimization design of the systems. Ref. [13] presents an optimization design of hybrid RES to satisfy the daily energy demand of residential load in a rural settlement with consideration to energy management at the demand side. Ref. [14] proposed hybrid RES, which involves integrating wind power, solar PV and combined heating and power (CHP) in a grid-tied network to meet both the electrical and thermal loads. In Ref. [15], a combination of diesel generator, PV, biomass, wind and battery system was proposed to achieve an optimal configuration to meet consumer demand using several optimization techniques. Ref. [16] proposed hybrid RES as a means reducing power outages on the grid-tied network in a remote location using HOMER software. The obtained results show an increase in power system reliability with the integration of hybrid RES.
In addition, several researchers believed that using a rooftop PV increases its efficiency as well as improves the output energy of the panels. Ref. [17] deploys the rooftop PV in a building in South Korea to assess the PV potential and its economic values to the system. Ref. [18] presents a review based on social, political and economic implications of solar rooftops in improving the power deficit in India. Ref. [18] presents solar PV rooftop and battery storage for improving the voltage profile of distribution systems in residential areas. In Ref. [19], a novel model based on geographical information system (GIS) was developed for optimal planning of solar PV rooftop system. The model was employed to acquire accurate data for the installation of the rooftop and also to boost the profit of installing the PV in the system. Ref. [20] presents a novel method for estimating the potential of rooftops in different cities in India. The mathematical formulation and micro-level were employed to estimate the activeness of the rooftop.
A critical survey of the above reviews shows that there are no studies that considered a grid-tied hybrid wind power, battery storage, diesel generator and solar rooftop system. Therefore, this paper presents a real-time analysis of solar rooftops integrated to a hybrid system to examine its operational efficiency and validate the energy balance with a grid connected system. The following are the main contribution of this paper:
  • Determination of the solar rooftop PV system potential and performance using GIS estimation in order to obtain real-time solar data.
  • Development of an optimization design for the grid-connected hybrid energy system considering the diesel generator, wind power, solar rooftop PV and battery storage system for technical assessment of the four configuration models for the educational institutions.
  • Economic assessment such as the levelized cost of energy (LCOE) of the four system configurations for determining the optimal choice of hybrid energy system configuration suitable for the educational institution.
The remaining of this paper is organized as follows: Section presents the background of the study In Section 3, the methodology employed was presented. In Section 4, the presented simulation results were discussed, and the paper was concluded in Section 5.

2. Background

The details of the background study are given in this section.

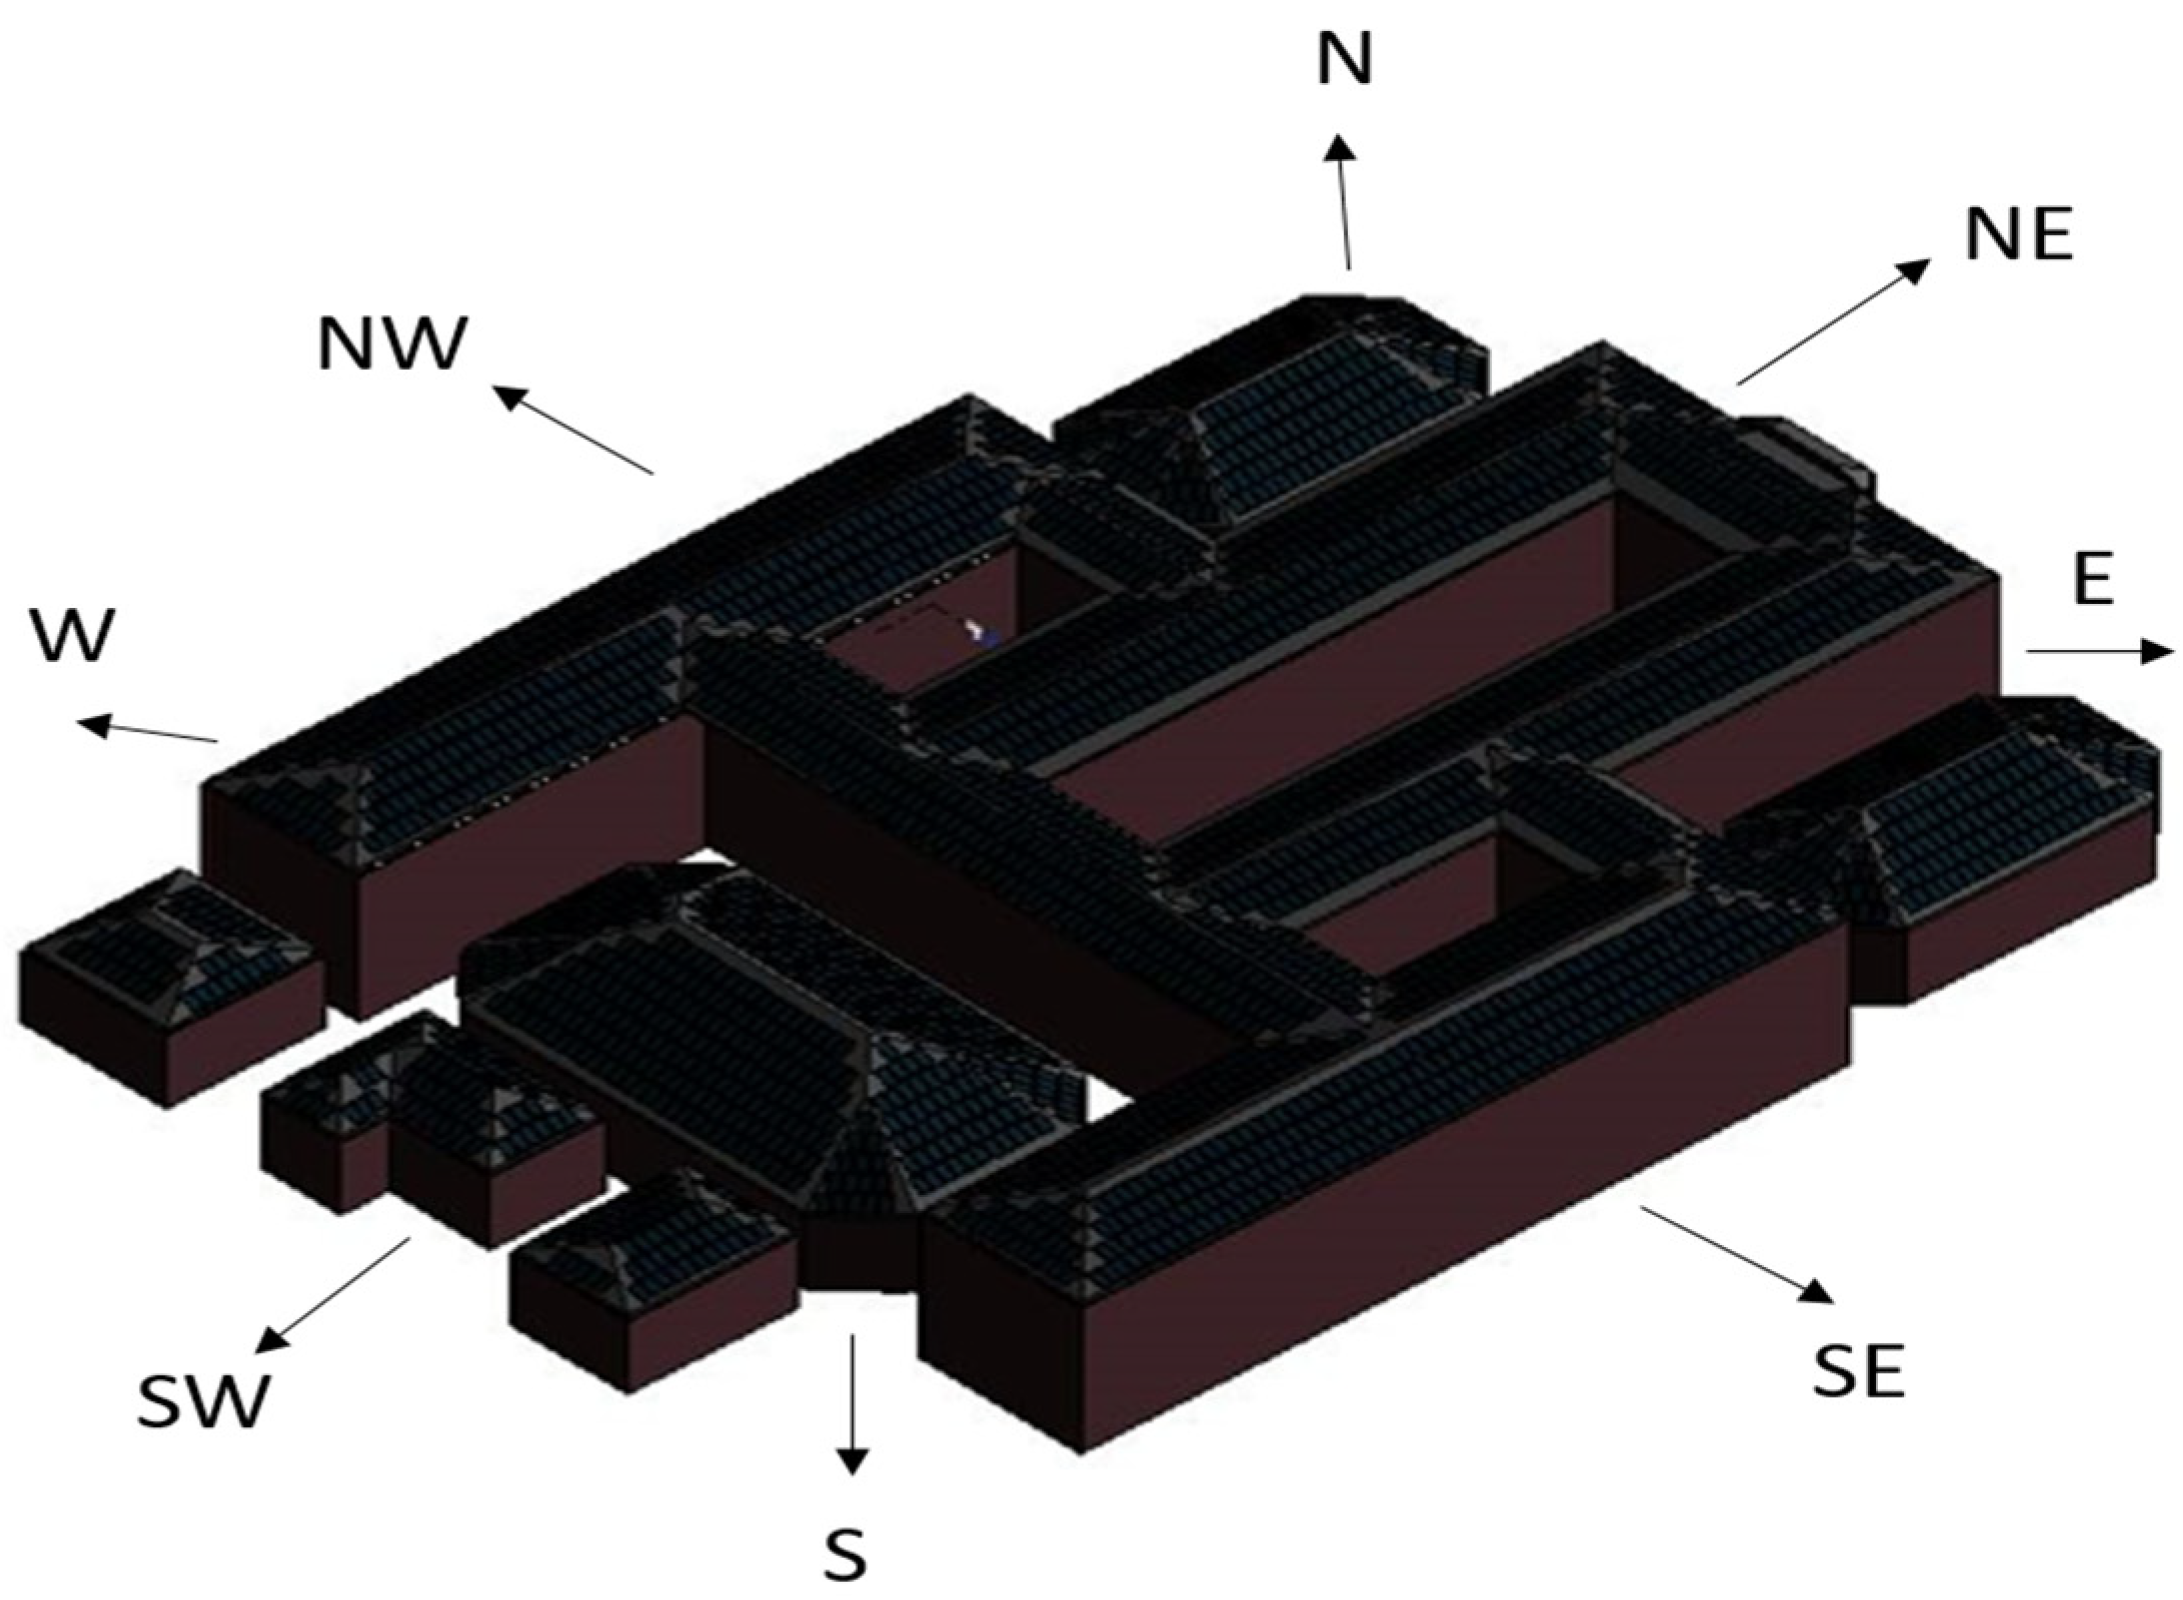
2.1. Description of the Case Study

Afe Babalola University is located in Ado-Ekiti, Ekiti State, just opposite the Federal Polytechnic Ado-Ekiti; it is a private university that was founded in 2009. The university is located on latitude 7.60117° N and longitude 5.30172° E. Afe Babalola University comprises the University, multi-purpose teaching hospital, farm, international school, student accommodations, staff quarters, shopping malls and cafeterias. The College of Engineering is a 3-storey building.

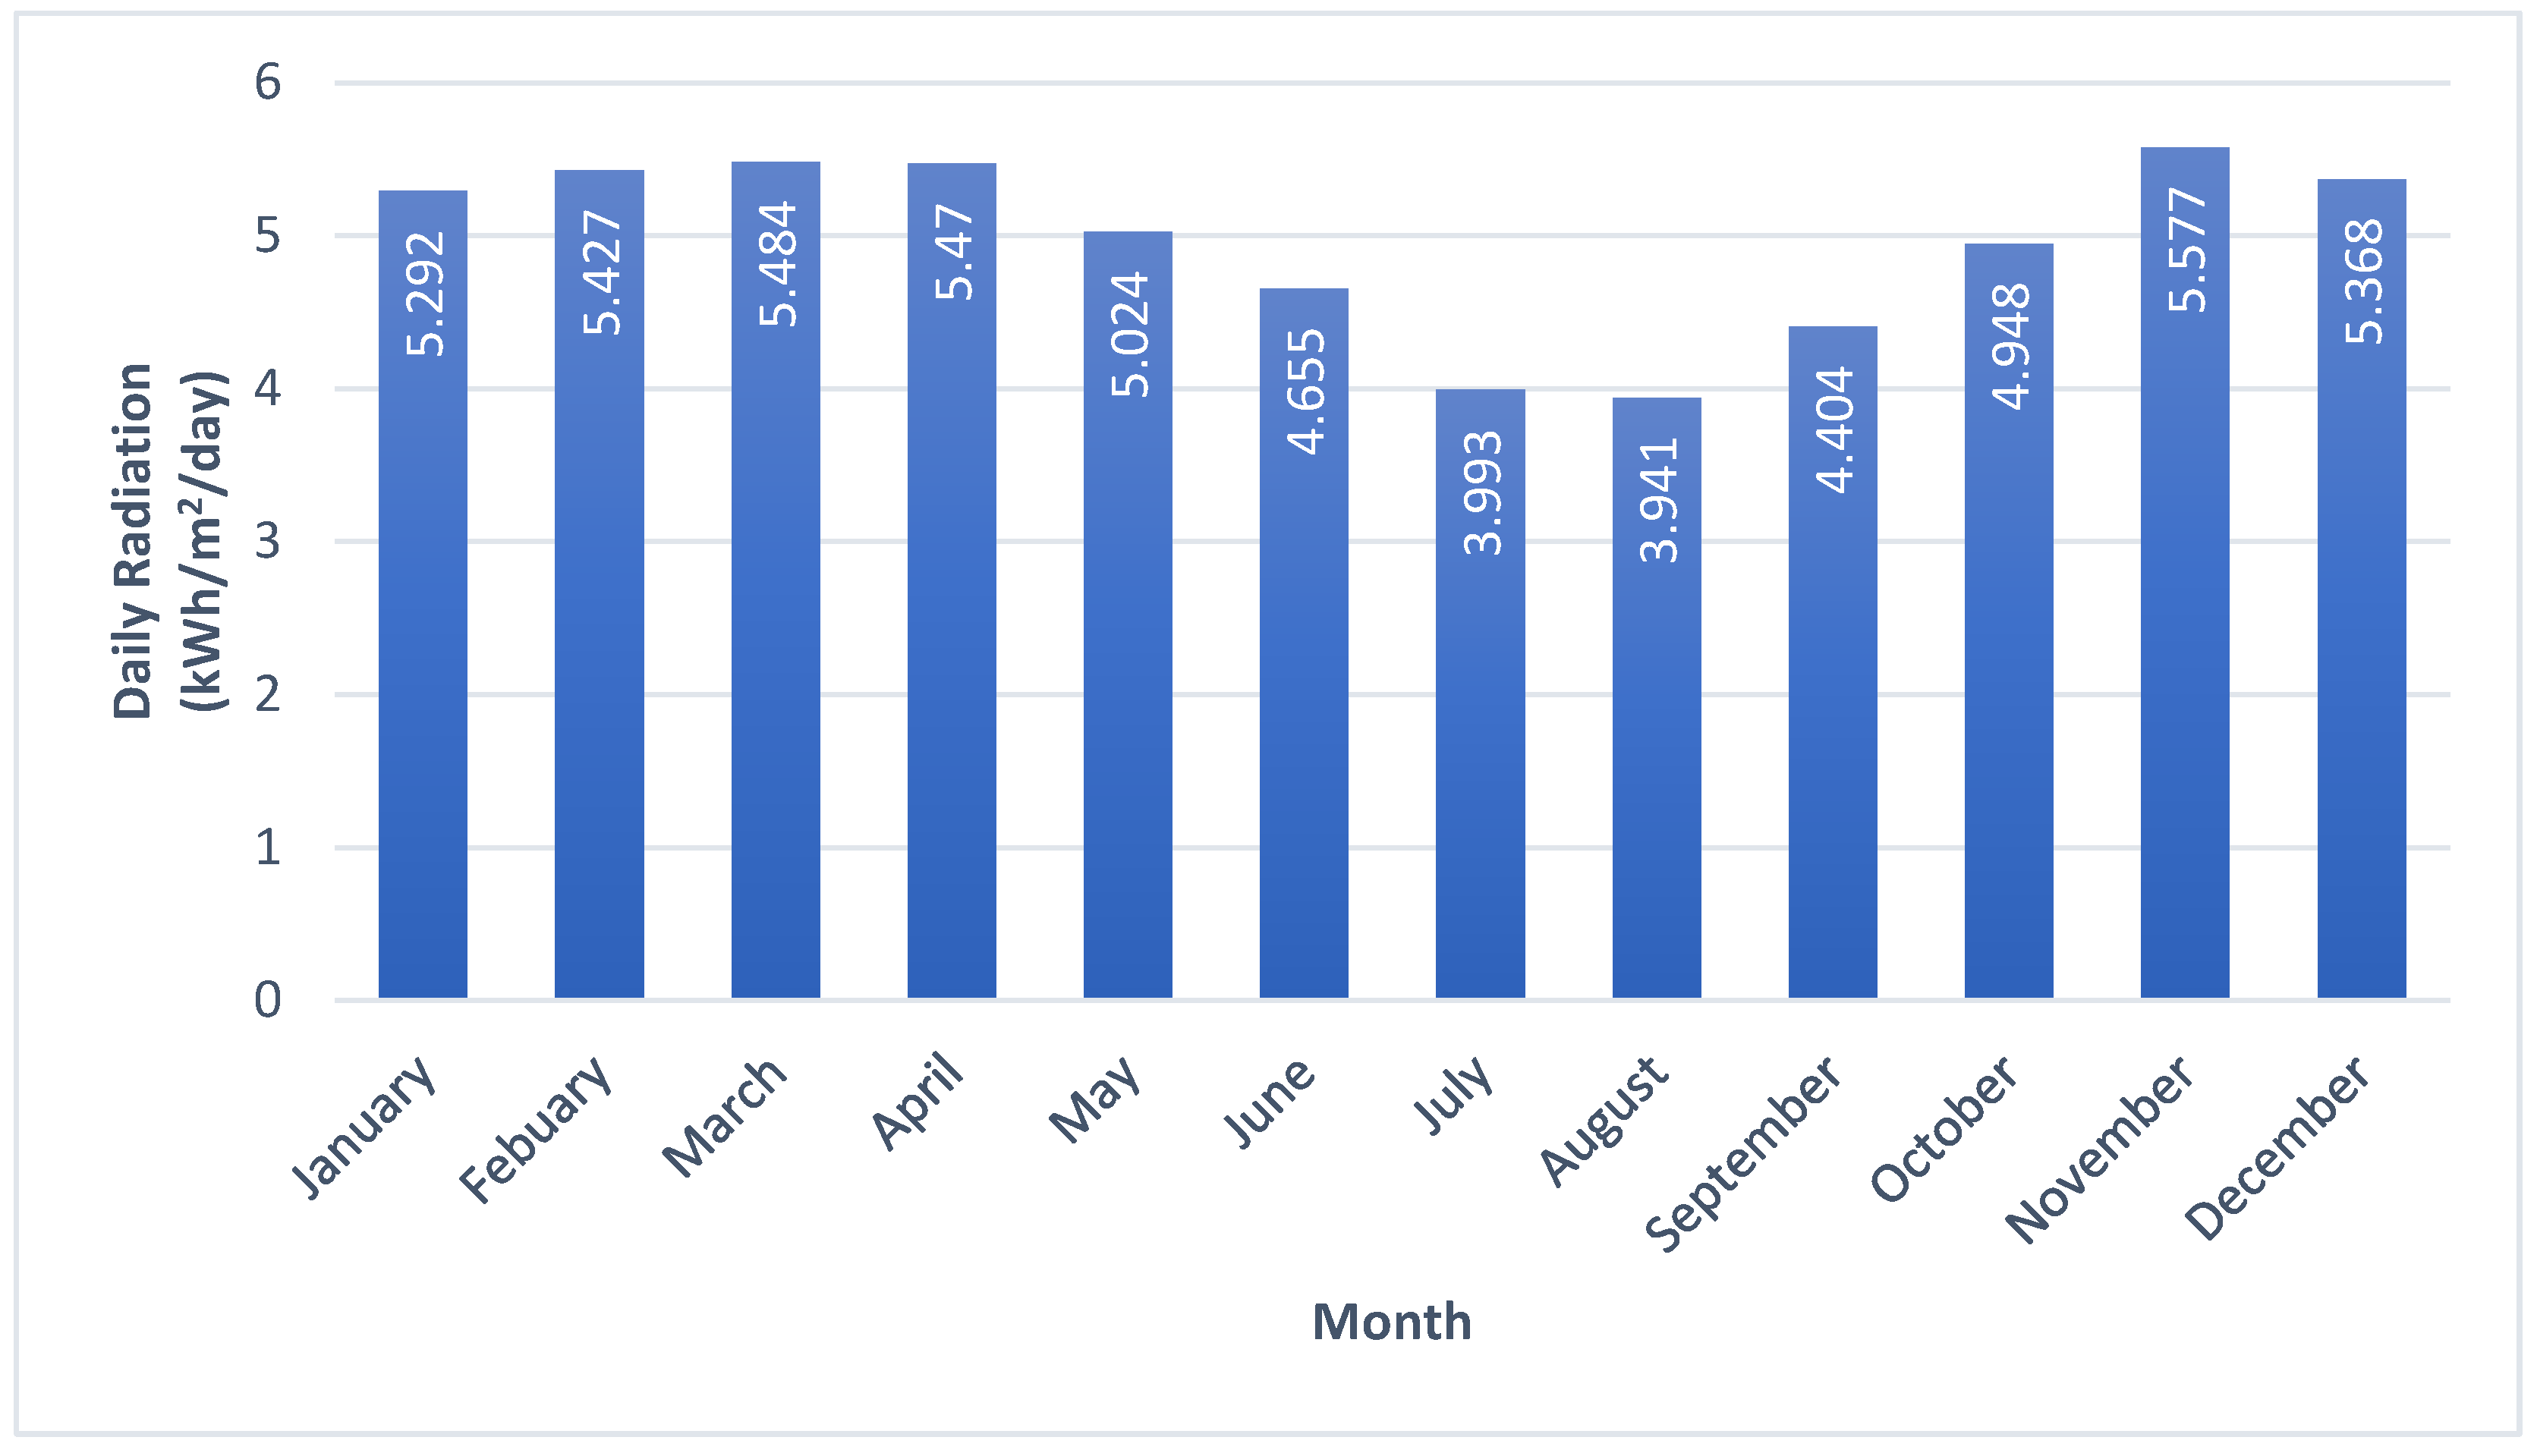
2.2. Solar Global Horizontal Irradiance

The monthly average solar global irradiance data for the College of Engineering is shown in Figure 1; it was obtained from the National Renewable Energy Lab Database hosted on HOMER Pro. The data were obtained by entering the College’s location on HOMER Pro. The annual average monthly solar global horizontal irradiance was obtained to be 4.97 kWh/m2/day, with November having the highest at 5.577 kWh/m2/day, and August having the lowest at 3.941 kWh/m2/day.

2.3. Daily Load Profile

The educational institution load profile differs from the industrial and commercial loads because of the semester period and period of vacations. The College of Engineering, College of Social and Management Science and College of Law are connected to the same load center and are rated at 320 kW. Therefore, the three Colleges load are categorized as one load and the daily and monthly load profile is shown in Figure 2. The maximum demand is in the month of July and the maximum daily load is the hour of 10:00 pm. The synthetic load profile shown in Figure 2 was created with a peak load to match the rating of the load center; this would ensure that at all times, the simulated systems would be able to supply the load demanded at these Colleges.

3. Methodology

In this section, the mathematical modelling of HES components and the computation of economic variables are described in Section 3.1 and Section 3.2, respectively. The simulation software is discussed in Section 3.3.

3.1. Mathematical Modelling of the HES Components

The hybrid energy system components have been modelled based on their equations and are described in the section.

3.1.1. Rooftop Solar PV Arrangement

In this study, the rooftop for the College of Engineering was modelled using Revit software [21,22]. The simulations are performed to assess the real power produced by the rooftop panels. 300 W panels and their dimensions were modelled and placed on the rooftop until they fit completely as shown in Figure 3. The rated capacity of the PV array on the different orientations of the rooftops are shown in Table 1; this capacity can be obtained using Equation (1).
Rated   Capacity   ( kW ) = N p × 300 1000
where Np is the number of panels on the rooftop.
The hourly energy generation by PV panels depends on PV characteristics and cell temperature.
The hourly power produced by the rooftop solar PV panels is based on the arrangement of the PV array. Therefore, the power output of the solar PV array can be expressed as [23]:
P P V = Y P V f P V ( G ¯ T G ¯ T , S T C ) [ 1 + α P ( T c T c , S T C ) ]
where Y P V is the rated capacity of the PV array (kW), f P V is the derating factor of the PV (%), G ¯ T is the solar radiation incident on the PV array in the current time step (kW/m2), G ¯ T , S T C (TC,STC) is the solar radiation incident on the PV array in standard test conditions (1 kW/m2), α P is the temperature coefficient of power (%/°C), Tc is the PV cell temperature in the current time step (°C), and Tc,STC is the PV cell temperature under standard test conditions. The solar PV efficiency at standard test conditions can be expressed as [24,25]:
η m p , S T C = Y P V A P V G T , S T C
where η m p , S T C is the efficiency of the PV module under standard test is conditions (%), Y P V is the rated capacity of the PV array (kW), APV is the surface area of the PV module (m2), and GT,STC is the radiation at standard test conditions.

3.1.2. Wind Power

The variability of the wind power range portrays its maturity among the renewable energy sources widely available. The output power of a wind turbine is determined by the wind speed and the wind speed at the turbine hub can be expressed as [26]:
v h h u b v h a = ( h h u b h a )
where v h h u b is the average wind speed at height of the turbine hub; v h a is the average wind speed at the height above the ground. is the turbulence index and its value is a function of atmospheric stability and roughness of the surface. The power output of the wind turbine can be expressed as:
P w = 0.5 γ A ρ λ v 3
where γ is the wind turbine efficiency; A is the wind turbine swept area; ρ is the air density; λ is the wind turbine coefficient and v is the wind velocity.

3.2. Computation of Economic Variables

In this study, the economic variables used are the levelized cost of energy (LCOE) and net present cost (NPC). LCOE is a measure of the average net present cost of electricity generation for a generating plant over its lifetime; it can be expressed as [27]:
L C O E = C t o t a l E t o t a l
where C t o t a l is the total annualized cost of energy for the whole system in $/year and E t o t a l is the total energy consumption per year in kWh/year.
NPC is the present value of all the costs of installing and operating the Component over the project lifetime, minus the present value of all the revenues that it earns over the project lifetime [27,28] and this can be computed using:
N P C = C t o t a l C R F ( i + P T )
where P T is the project lifetime; i is the annualized interest rate in % and CRF is the capital recovery factor and is a function of the number of years.

3.3. Simulation Process

In this work, Revit software was used to model the rooftop for the study site. The simulations were performed to assess the real power produced by the rooftop panels. Several solar panels and their dimensions were modelled and placed on the rooftop until they fit completely as shown in Figure 3. Secondly, Hybrid Optimization Model for Multiple Energy Resources (HOMER) software tool was employed to evaluate the technical, economical and environmental aspects of the appropriate probable solution to determine the optimal configuration based on the LCOE and NPC. The optimal systems were calculated based on their net present cost, initial capital, operating cost, maintenance cost and replacement cost. A lifetime of 25 years, a discount rate of 8%, and an inflation rate of 2% were assumed. HOMER software was designed by National Renewable Energy Laboratory (NREL); this software is majorly used by engineering because of its ability to analyze technical and economic aspects of the power system network. In this study, four power system configurations were considered as shown in Figure 4. The hybrid energy system configuration consists of the rooftop solar PV, diesel generator, wind turbine, battery and the grid. The different power system configurations are:
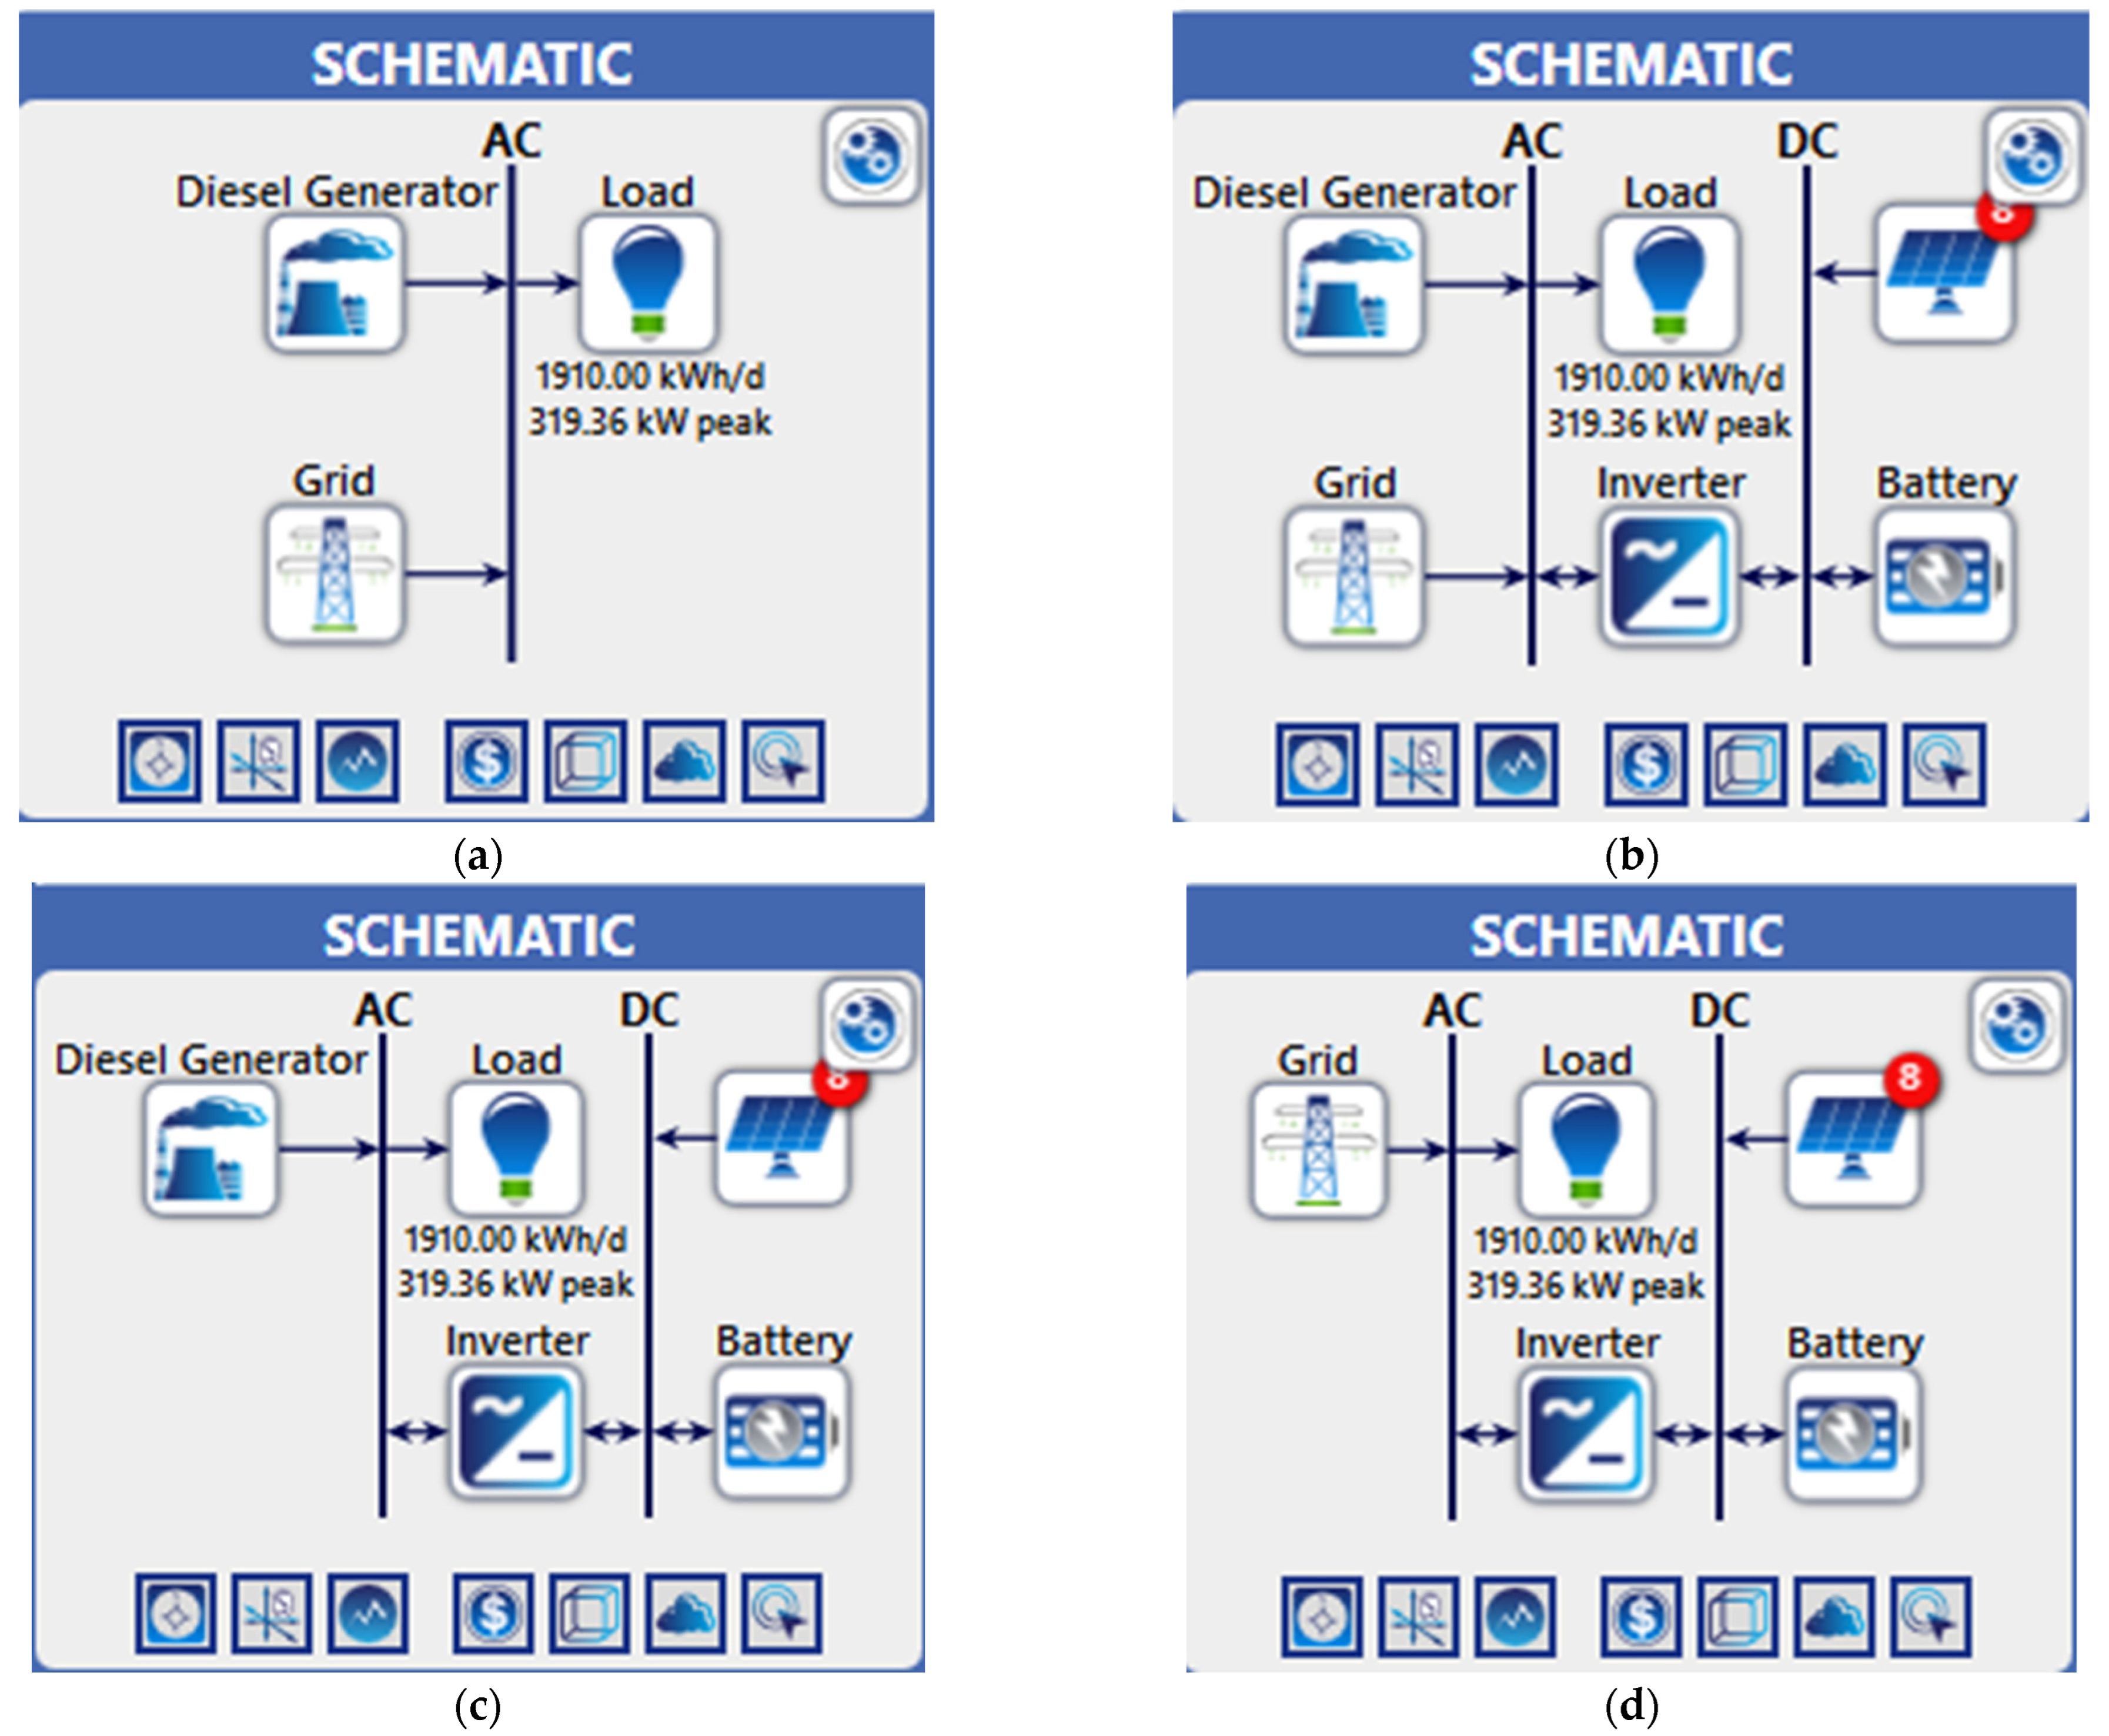
  • Diesel Generator and Utility Grid System (DU);
  • Diesel Generator, Utility Grid, Solar PV, Inverter and Battery System (DUP);
  • Diesel Generator, Solar PV, Inverter and Battery System (DP);
  • Utility Grid, Solar PV, Inverter and Battery System (UP).

4. Results and Discussion
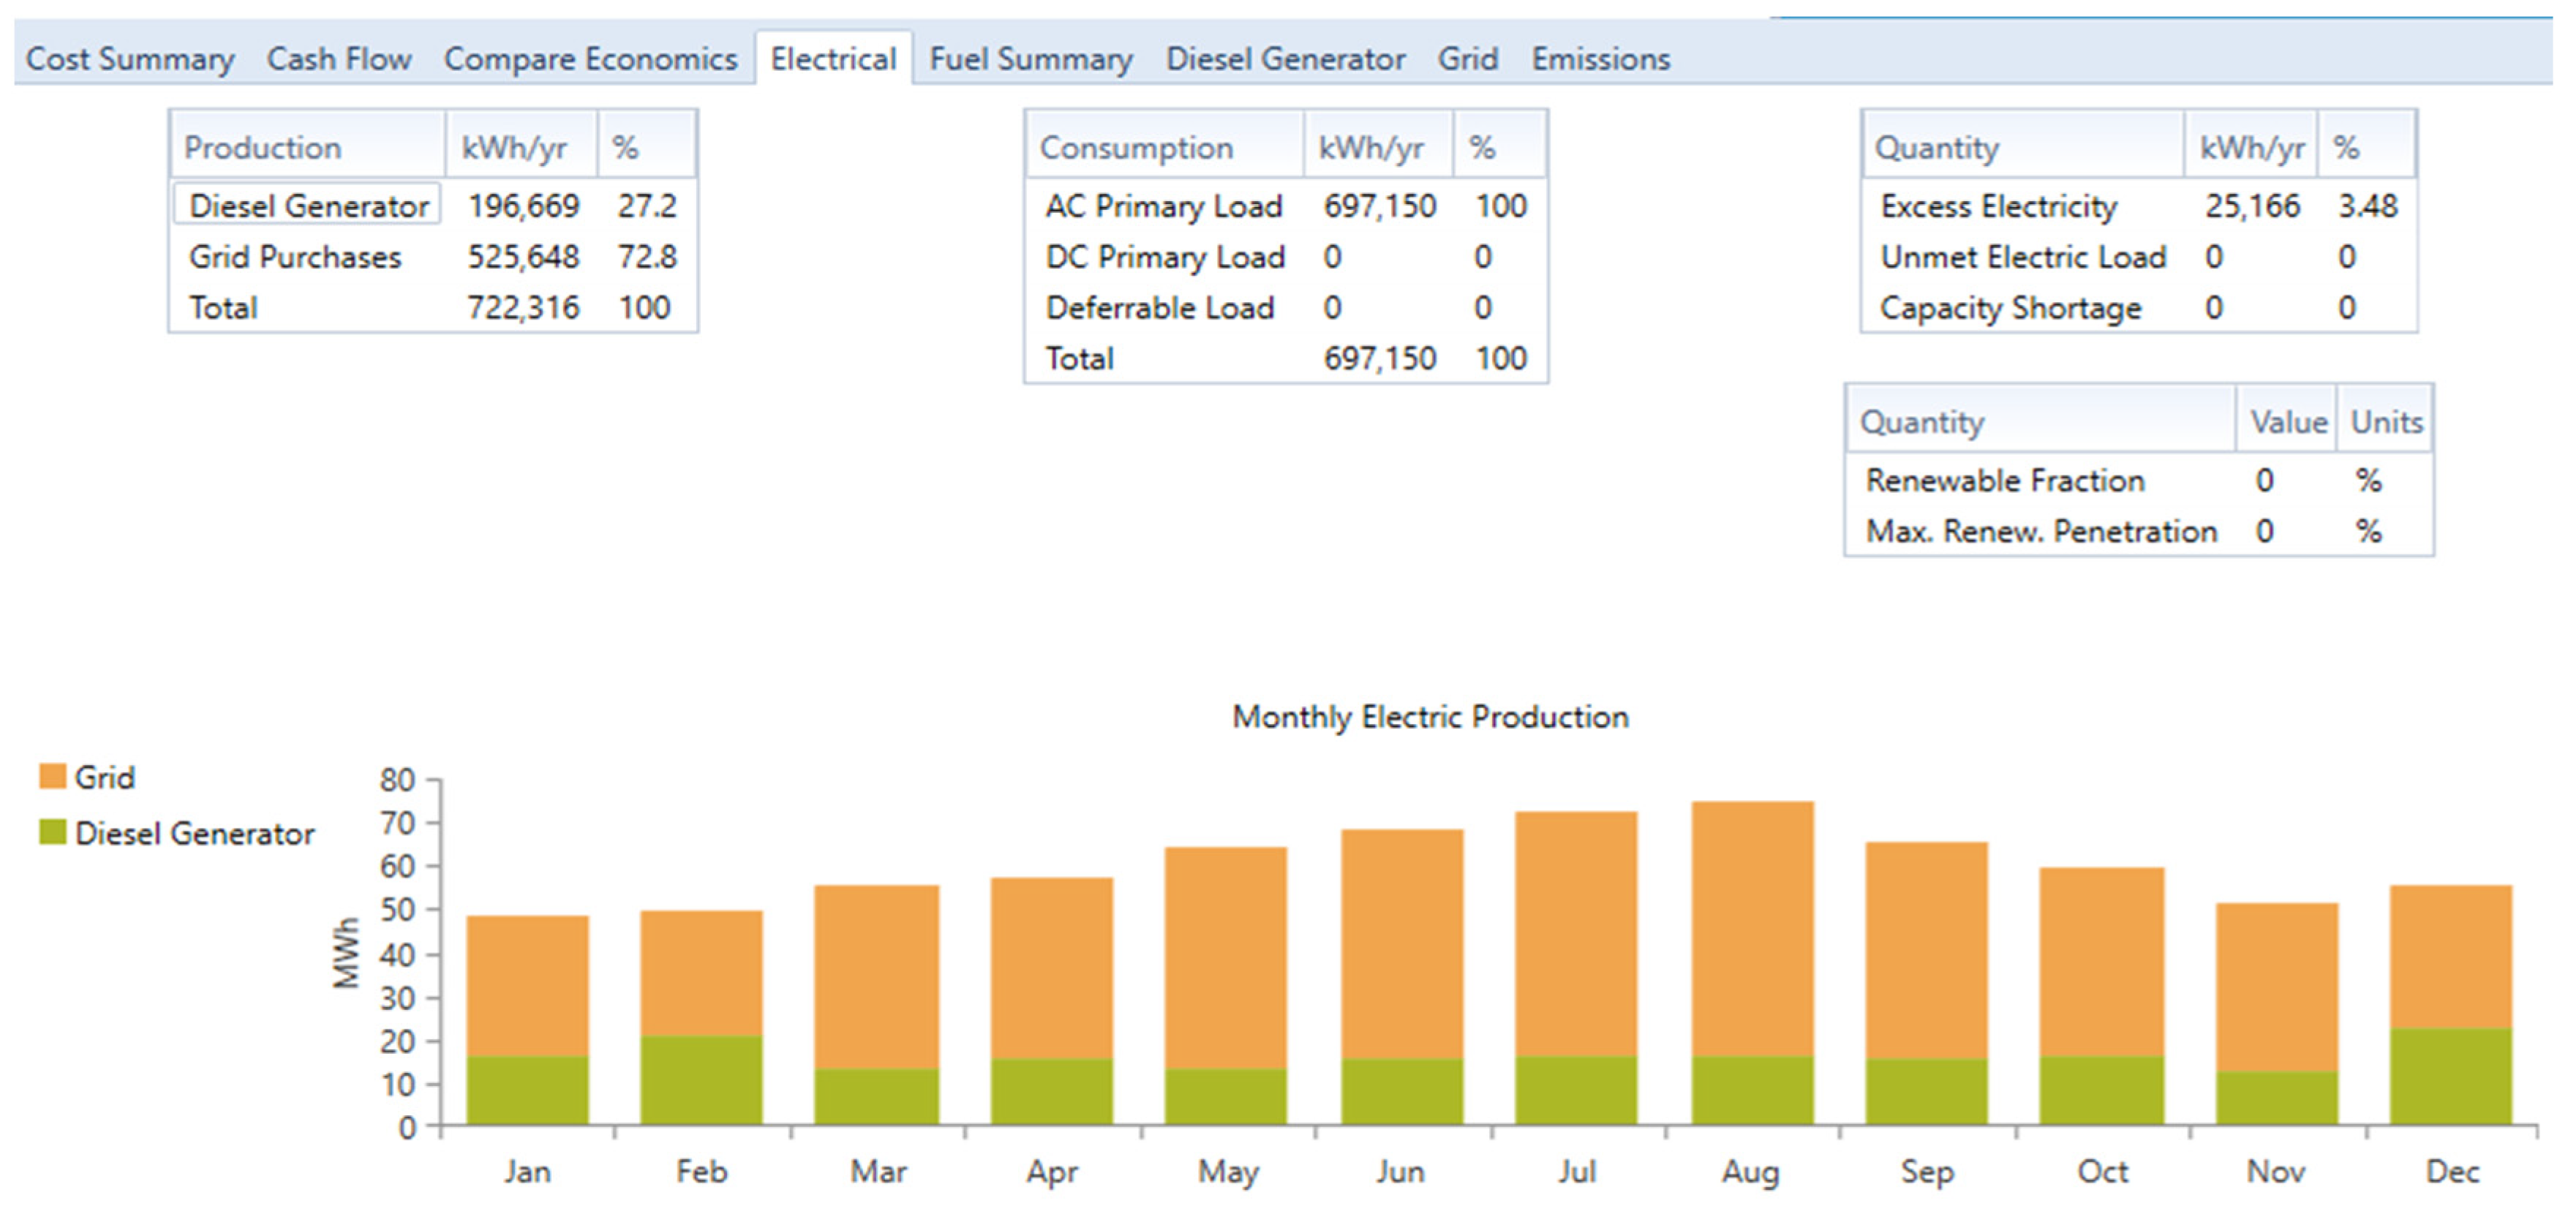
This section presents the performance evaluation of the techno-economic analysis of HES for the institution which is based on the electrical power generated by each component of the hybrid energy system together with cost parameters. The results obtained from the simulation are discussed in three directions such as power capacity, emissions and economic analysis based on the established configurations.

4.1. Power Capacity

The average power produced by a diesel generator is constant for DU, DUP and DP configurations, which is 500 kW. Similarly, the power consumed from the utility grid is also constant for DU, DUP and UP configurations and it is 1743 kW, as shown in Table 2; this is an indication that for any configuration that involves a diesel generator and utility grid, these two are prioritized in the system. The power produced by the rooftop solar PV for DUP, DP and UP configurations are 203.7 kW, 957.6 kW and 357.6 kW, respectively, as shown in Table 2. In DP configuration, it is evident that the main power produced is from rooftop solar PV which is more optimal than the utility grid and diesel generator. The DU system produced a total of 722,316 kWh/year which satisfied 100% of the energy demanded with 3.48% excess energy as shown in Figure 5. The DUP system produced a total of 813,567 kWh/year which also satisfied 100% of the energy demanded with 13% excess energy as shown in Figure 6. Renewable energy contributed 24.7% of the power produced from this configuration. The DP system produced 51.9% excess energy but was unable to meet 0.00783% of the electrical load and a capacity shortage of 0.0992%; it can be observed that 64.3% of the produced are from the renewable energy as shown in Figure 7. The UP system produced a total of 821,080 kWh/year and was able to fully meet the energy demand with 12.7% excess energy as shown in Figure 8. Renewable energy contributed 52.8% of the power produced from this configuration.

4.2. Emissions

The fuel consumed by the diesel generator is a major factor to environmental emissions in the society. Table 3 presents a comparison of system emissions which comprises of different pollutants at different configurations. In DU configuration, the load demand of the institution is satisfied by the diesel generator and utility supply. There is absence of renewable energy and storage system in DU configuration and therefore the system produced the highest CO2 emissions of 422,169 kg/year. In DUP configuration, renewable energy accounted for 24.7% of the power produced and the CO2 emission is given as 340,750 kg/year. In DP configuration, renewable energy contributed 52.8% of the power produced and the CO2 emissions is given as 239,703 kg/year. In UP configuration, renewable energy accounted for 52.8% of the energy generated from the system and the CO2 emissions is given as 135,474 kg/year, which is a 32.09% emission reduction when compared to the DU system; this is an indication that the presence of renewable energy improves the emission reduction. Similarly, aside the CO2, other pollutants such as CO, UHC, PM, SO2 and NOx is higher in DP configuration as compared to DU and DU configurations; however, the UP system produced only CO2 emission as well as lower emissions as compared to other configurations because it is the only configuration without the presence of diesel generator; it is evident that the UP system is more environmentally sustainable as compared to other configurations.

4.3. Economic Analysis

The summary of the optimized economic analysis for the four configurations is presented in Table 4. The UP configuration has the minimum levelized cost of energy of ₦ 31.26 as compared to DU, DUP and DP systems which have LCOE of ₦ 57.14, ₦ 54.96 and ₦ 86.85, respectively; this is evidence of the higher penetration of renewable energy into the system as against other configurations. Similarly, UP system has the less NPC of ₦ 281,719,600 as compared to DU, DUP and DP systems which are ₦ 514,967,400; ₦ 495,329,200 and ₦ 782,075,00, respectively. In addition, the UP system has a lower operating cost of ₦ 13,505,270 as compared to DU, DUP and DP systems which are ₦ 39,834,980; ₦ 33,135,460 and ₦ 27,803,930, respectively; it is observed that UP has a lower operating cost because there is no cost incurred for a diesel generator in this configuration whilst the DU system has the highest operating cost due to large sufficient amount incurred on diesel fuel and cost incurred on electricity from the utility supply. The internal rate of return (IRR) for DUP and DP configurations is the same at 8% whilst the UP system has a higher IRR of 11.4%. Similarly, the UP system has the highest return on an investment (ROI) of 8% and a lower payback period of 7.64 years against DUP and DP configurations that have ROI and payback periods of 6% and 5.4%; 8.9 and 17.06 years, respectively.

5. Conclusions

This study carries out a technical and economic assessment of four different configurations of HES for electricity supply to the College of Engineering, Afe Babalola University, Ado-Ekiti for powering the university buildings. Revit software was used to model the solar rooftop for the building. The grid-connected HES was modelled and simulated using HOMER software for different system configurations. An LCOE and NPC were computed to evaluate the economic feasibility of these configurations. The simulation results show that the UP system can be considered as the optimal system configuration when compared to the other scenarios owing to its ability to accurately meet the energy demand with 12.7% excess energy. More importantly, it was observed that the configuration with the highest renewable energy fraction experienced a significant decrease in the cost of energy by 45% and this also enhances the drive for energy transition by reducing carbon emissions by 32.09%. Adopting this system provides the College of Engineering ABUAD with a more affordable and sustainable means of producing electricity. In the future, machine learning can be used to train the real data obtained from the rooftop solar PV to predict the precise power output obtainable from solar PV.

Author Contributions

Conceptualization, F.S.O., S.T.W. and S.L.G.; methodology, F.S.O. and S.L.G.; software, F.S.O. and S.L.G.; validation, F.S.O., S.T.W., S.L.G. and N.I.N.; formal analysis, F.S.O. and S.L.G.; investigation, F.S.O., S.T.W. and S.L.G.; resources, F.S.O., S.T.W., S.L.G. and N.I.N.; data curation, F.S.O.; writing—original draft preparation, F.S.O.; writing—review and editing, F.S.O., S.T.W., S.L.G. and N.I.N.; visualization, S.L.G.; supervision, S.T.W., S.L.G. and N.I.N.; project administration, S.L.G.; funding acquisition, S.L.G. and N.I.N. All authors have read and agreed to the published version of the manuscript.

Funding

This research received no external funding.

Institutional Review Board Statement

Not applicable.

Informed Consent Statement

Not applicable.

Data Availability Statement

The data used in this manuscript were generated in real time.

Conflicts of Interest

The authors declare no conflict of interest.

References

  1. Baseer, M.A.; Alqahtani, A.; Rehman, S. Techno-economic design and evaluation of hybrid energy systems for residential communities: Case study of Jubail industrial city. J. Clean. Prod. 2019, 237, 117806. [Google Scholar]
  2. Gul, M.S.; Patidar, S. Understanding the energy consumption and occupancy of a multi-purpose academic building. Energy Build. 2015, 87, 155–165. [Google Scholar]
  3. A comparative analysis of generation and transmission expansion planning models for power loss minimization. Sustain. Energy Grids Netw. 2021, 26, 100456.
  4. Gbadamosi, S.L.; Nwulu, N.I. A multi-period composite generation and transmission expansion planning model incorporating renewable energy sources and demand response. Sustain. Energy Technol. Assess. 2020, 39, 100726. [Google Scholar]
  5. Gbadamosi, S.L.; Nwulu, N.I.; Siano, P. Harmonics Constrained Approach to Composite Power System Expansion Planning with Large-Scale Renewable Energy Sources. Energies 2022, 15, 4070. [Google Scholar]
  6. Gbadamosi, S.L.; Nwulu, N.I. Reliability assessment of composite generation and transmission expansion planning incorporating renewable energy sources. J. Renew. Sustain. Energy 2020, 12, 026301. [Google Scholar]
  7. Murugaperumal, K.; Ajay, P.; Vimal Raj, D. Feasibility design and techno-economic analysis of hybrid renewable energy system for rural electrification. Sol. Energy 2019, 188, 1068–1083. [Google Scholar] [CrossRef]
  8. Emrani, A.; Berrada, A.; Arechkik, A.; Bakhouya, M. Improved techno-economic optimization of an off-grid hybrid solar/wind/gravity energy storage system based on performance indicators. J. Energy Storage 2022, 49, 104163. [Google Scholar]
  9. Liu, J.; Wang, M.; Chen, X.; Cao, S.; Yang, H. Techno-economic design optimization of hybrid renewable energy applications for high-rise residential buildings. Energy Convers. Manag. 2020, 213, 112868. [Google Scholar]
  10. Arabkoohsar, A.; Behzadi, A.; Sulaiman, A. Techno-economic analysis and multi-objective optimization of a novel solar-based building energy system; An effort to reach the true meaning of zero-energy buildings. Energy Convers. Manag. 2021, 232, 113858. [Google Scholar]
  11. Ahmad, J.; Imran, M.; Khalid, A.; Iqbal, W.; Ashraf, S.R.; Adnan, M.; Ali, S.F.; Khokhar, K.S. Techno economic analysis of a wind-photovoltaic-biomass hybrid renewable energy system for rural electrifi cation: A case study of Kallar Kahar. Energy 2018, 148, 208–234. [Google Scholar]
  12. Das, B.K.; Alotaibi, M.A.; Das, P.; Islam, M.S.; Das, S.K. Feasibility and techno-economic analysis of stand-alone and grid-connected PV/Wind/Diesel/Batt hybrid energy system: A case study. Energy Strateg. Rev. 2021, 37, 100673. [Google Scholar]
  13. Akram, F.; Asghar, F.; Asghar, M.; Amjad, W.; Manzoor, M.O.; Munir, A. Techno-economic optimization analysis of stand-alone renewable energy system for remote areas. Sustain. Energy Technol. Assess. 2020, 38, 100673. [Google Scholar]
  14. Ma, W.; Xue, X.; Liu, G.; Zhou, R. Techno-economic evaluation of a community-based hybrid renewable energy system considering site-specific nature. Energy Convers. Manag. 2018, 171, 1737–1748. [Google Scholar]
  15. Sawle, Y.; Gupta, S.C.; Bohre, A.K. Socio-techno-economic design of hybrid renewable energy system using optimization techniques. Renew. Energy 2018, 119, 459–472. [Google Scholar]
  16. Shabestari, S.T.; Kasaeian, A.; Rad, M.A.V.; Fard, H.F.; Yan, W.-M.; Pourfayaz, F. Techno-financial evaluation of a hybrid renewable solution for supplying the predicted power outages by machine learning methods in rural areas. Renew. Energy 2022, 194, 1303–1325. [Google Scholar]
  17. Lee, M.; Hong, T.; Jeong, J.; Jeong, K. Development of a rooftop solar photovoltaic rating system considering the technical and economic suitability criteria at the building level. Energy 2018, 160, 213–224. [Google Scholar]
  18. Kabir, M.N.; Mishra, Y.; Ledwich, G.; Xu, Z.; Bansal, R.C. Improving voltage profile of residential distribution systems using rooftop PVs and Battery Energy Storage systems. Appl. Energy 2014, 134, 290–300. [Google Scholar]
  19. Jung, S.; Jeoung, J.; Kang, H.; Hong, T. Optimal planning of a rooftop PV system using GIS-based reinforcement learning. Appl. Energy 2021, 298, 117239. [Google Scholar]
  20. Singh, R. Approximate rooftop solar PV potential of Indian cities for high-level renewable power scenario planning. Sustain. Energy Technol. Assess. 2020, 42, 100850. [Google Scholar]
  21. Tarigan, E. Simulation and Feasibility Studies of Rooftop PV System for University Campus Buildings in Surabaya, Indonesia. Int. J. Renew. Energy Res. 2018, 8, 896–908. [Google Scholar]
  22. Teofilo, A.; Sun, Q.; Radosevic, N.; Tao, Y.; Iringan, J.; Liu, C. Investigating potential rooftop solar energy generated by Leased Federal Airports in Australia: Framework and implications. J. Build. Eng. 2021, 41, 102390. [Google Scholar] [CrossRef]
  23. Gbadamosi, S.L.; Nwulu, N.I.; Sun, Y. Multi-objective optimisation for composite generation and transmission expansion planning considering offshore wind power and feed-in tariffs. IET Renew. Power Gener. 2018, 12, 1687–1697. [Google Scholar]
  24. Nwulu, N.I.; Gbadamosi, S.L. Power Systems and Renewable Energy Systems. In Optimal Operation and Control of Power Systems Using an Algebraic Modelling Language; Springer: Cham, Switzerland, 2021; pp. 1–19. [Google Scholar]
  25. Gbadamosi, S.L.; Nwulu, N.I. Optimal planning of renewable energy systems for power loss reduction in transmission expansion planning. J. Eng. Des. Technol. 2020, 18, 1209–1222. [Google Scholar]
  26. Gbadamosi, S.L.; Nwulu, N.I. Optimal Power Dispatch and Reliability Analysis of Hybrid CHP-PV-Wind Systems in Farming Applications. Sustainability 2020, 12, 8199. [Google Scholar]
  27. Gbadegesin, A.O.; Sun, Y.; Nwulu, N.I. Techno-economic analysis of storage degradation effect on levelized cost of hybrid energy storage systems. Sustain. Energy Technol. Assess. 2019, 36, 100536. [Google Scholar]
  28. Li, C.; Ge, X.; Zheng, Y.; Xu, C.; Ren, Y.; Song, C.; Yang, C. Techno-economic feasibility study of autonomous hybrid wind/PV/battery power system for a household in Urumqi, China. Energy 2013, 55, 263–272. [Google Scholar]
Figure 1. Monthly average solar global horizontal irradiance.
Energies 15 05606 g001
Figure 2. Load profile of the Colleges of Engineering, Law and SMS.
Energies 15 05606 g002
Figure 3. Model of rooftop solar PV panels on College of Engineering building.
Energies 15 05606 g003
Figure 4. Schematic diagrams for the four configurations on HOMER software (a) DU system (b) DUP system (c) DP system (d) UP system.
Energies 15 05606 g004
Figure 5. Summary of power produced for DU system.
Energies 15 05606 g005
Figure 6. Summary of power produced for the DUP system.
Energies 15 05606 g006
Figure 7. Summary of power produced for the DP system.
Energies 15 05606 g007
Figure 8. Summary of power produced for UP system.
Energies 15 05606 g008
Table 1. Rooftop orientation and rated PV capacity.
OrientationRated Capacity (kW)
North PV Array10.5
East PV Array10.5
South PV Array10.5
West PV Array10.5
North-East PV Array164.1
North-West PV Array293.4
South-East PV Array296.4
South-West PV Array161.7
Table 2. Power produced based on system architecture.
ComponentsDUDUPDPUP
Diesel Generator (kVA)500500500-
Grid (kW)17431743-1743
North PV Array (kW)-10.510.5-
East PV Array (kW)-10.510.510.5
South PV Array (kW)-10.510.510.5
West PV Array (kW)-10.510.510.5
North-East PV Array (kW)--164.1164.1
North-West PV Array (kW)--293.4-
South-East PV Array (kW)--296.4-
South-West PV Array (kW)-161.7161.7162
Batteries (2500 AH)-2448024
Inverter (kW)-115325160
Table 3. Comparison of the system emissions.
DUDUPDPUP
Carbon Dioxide (kg/year)422,169340,750239,703135,474
Carbon Monoxide (kg/year)1064106412400
Unburned Hydrocarbons (kg/year)56.456.465.80
Particulate Matter (kg/year)9.099.0910.60
Sulfur Dioxide (kg/year)5035035860
Nitrogen Oxides (kg/year)2042042380
Total424,005342,586241,843135,474
Table 4. Economic analysis for the system configurations.
ParametersDUDUPDPUP
LCOE (₦)57.1454.9686.8531.26
NPC (₦)514,967,400495,329,200782,075,00281,719,600
Operating Cost (₦)39,834,98033,135,46027,803,93013,505,270
ROI (%)-6.05.48.0
IRR (%)-8.08.011.4
Simple Payback (yr)-8.9417.067.64
Publisher’s Note: MDPI stays neutral with regard to jurisdictional claims in published maps and institutional affiliations.

