1. Introduction
Energy demand is increasing significantly worldwide due to economic and technological developments [
1].
Energy sources of fossil origin fuel the phenomenon of climate change and are the cause of many international conflicts [
2]. It goes without saying that on a political level, after the Kyoto Protocol in 1997, the most important international agreement to combat climate change is the Paris Agreement, the main goal of which is to achieve climate neutrality by 2050. In this context, 2021 ended with the stated goal of climate neutrality. In this regard, the initiatives undertaken by the European Commission are considerable. These are mainly action plans and strategies documents covering the different areas of action included in the European Green Deal [
3], and the principle of energy efficiency (EE1st) has great importance. These different actions from Europe [
4] have facilitated a shift from a traditional energy production and consumption model to a more flexible one that integrates innovative technologies with renewable energy sources.
According to the “Energy Efficiency First” (EE1st) (recommendation of the European Commission of 28 September 2021) guiding concept, energy saving or demand response should be provided to end customers when these resources are less expensive or more valuable than supply-side alternatives. Therefore, planning, investment, regulation, and market design begin with implementing a systematic approach to assess the potential for energy saving and response to demand. Policies, investments, and practical measures that increase energy savings and demand response among end-use customers must be prioritized whenever they are found to deliver higher net benefits than investments in networks or supply alone. This recommendation from Europe encourages and stimulates a shift from a traditional model of energy production and consumption, which is based on large suppliers, the use of mostly fossil fuels, and consumers with a passive attitude as they suffer the price, to a more flexible model that integrates innovative technologies with renewable energy sources and focuses on energy consumers who have a proactive attitude.
The EE1st principle implies taking a holistic approach, considering the overall efficiency of the integrated energy system through the entire value chain (from energy production to grid transport to final energy consumption) in order to achieve efficiencies, both in primary and final energy consumption.
In particular, three trends converge to create revolutionary results:
electrification, decentralization, and digitalization [5]. A wide range of technologies has the potential to reduce greenhouse gas emissions, of which energy efficiency is one of the most important, especially in the short to medium term.
At the same time, introducing “smart grid” technologies into the electric distribution system allows energy and information to be delivered in various directions, engaging and proactively making a multitude of new participants supporting EE1st principles, resulting in services such as demand response (DR).
Through DR services, consumers have the opportunity to respond to the signals of the electricity market by modulating their energy consumption with the aim of reducing peaks in electricity demand and supply, reducing the price, and increasing power system reliability. Definitively, DR allows to achieve flexibility, greater grid stability, and more rational and efficient use of the electricity grid infrastructure.
While the interplay between EE and DR is an established practice in the literature [
6,
7,
8,
9,
10], the relationship between EE, DR, and electric system reliability (ESR) is investigated in this paper. First, the existing interdependence between EE and DR will be considered since both aim to change users’ consumption profiles to ensure the realization of a zero-emission, resilient, and efficient power system. At the same time, it will be shown how EE interventions positively influence the electricity system’s reliability. To the authors’ knowledge, there is currently no analysis in the literature that determines the interplay between EE, DR, and ESR.
Classic energy performance contracting (EPC) is a method for managing energy efficiency financing, offering customers a complete set of energy efficiency, renewable energy, and distributed generation measures. Guarantees often accompany EPC in which the savings produced by a project will be sufficient to finance the project’s total cost. An energy services company (ESCO) can lighten the customer by offering an ideal set of measures, providing guarantees for performance, expected savings, and the payback time delivered included in a typical EPC project [
11].
The ESCOs and the EPC market have emerged together. Their main objective is to persuade consumers to use less energy during peak hours or shift energy at off-peak times, such as at night or on weekends. These modifications in energy demand could result in both energy and cost savings [
12]. All EPC contracts must include energy efficiency improvements and a maintenance plan that will consider technical and energy management. Therefore, there is an increasing interest in including DR revenues in EPC; thus, evaluating the interplay between EE and DR becomes crucial [
13].
The paper proposes an evaluation tool from the user’s perspective. In particular, the tool measures the three-dimension values (EE, DR, and ESR) by CO2 emission reduction, the quantity of energy available for DR services, and the quantity of energy requested in critical hours (highest load demand for the electricity system estimated by the transmission system operator (TSO)).
The tool was implemented and tested in an Italian scenario in which some numerical results were used, taking into consideration the data from real residential users located in Southern Italy in the Calabria region. Specifically, the tool operates with input data on the hourly profiles of the baseline users (before an energy efficiency intervention) and the estimated profiles (after an energy efficiency intervention).
The proposed method has shown how efficient energy use may affect DR resource availability and power system reliability. In conclusion, the authors will outline a more reliable electric system that is ready for new types of EE contracts and able to monetize EE values such as pay for performance [
14].
2. Materials and Methods
2.1. Definitions
Agreeing with [
6] and other definitions [
8,
9] in defining EE as a persistent and sustained reduction in building energy consumption is necessary to provide a fixed level of service. In a comprehensive EE1st compliant approach, EE is considered the stable change in consumption profile that can achieve comfort in building use at a minimum cost to energy and CO
2 production. To achieve this goal, one or more so-called EE measures must be implemented. Some examples of energy efficiency interventions are the installation of photovoltaic systems, storage, thermal insulation, heat pumps, etc.
The effect of energy efficiency on electricity demand and the electricity system is evident in that buildings and equipment impose lower power loads (fewer kilowatts of demand) on the electricity system because they are more efficient and consume less energy (fewer kilowatt-hours).
Since most technologies promoted by energy efficiency programs (e.g., lighting, air conditioning) operate during peak demand hours, they help reduce critical system hours and meet system demand during critical hours, improving system reliability.
ESR is defined as the ability to meet electricity demand at all times while meeting safety and service quality requirements. Therefore, the adoption of these interventions generates an advantage in the management and control of the electricity system in terms of lower investment costs and dispatch management and in order to ensure the reliability of the power system and supply loads with continuity.
Capacity markets have been established in different countries with the aim of encouraging investment in generating plants that allow more power generation precisely during critical hours, i.e., hours when the risk of load nonsatisfaction is highest. The adoption of the capacity market requires facing costs that vary from country to country depending on the fee set.
DR is defined as a change in building energy demand or consumption for a limited time in response to a financial incentive or command signal [
7]. Specifically, a DR service changes the energy profile through consumption profile flexibility. With a DR service, the energy profile charge is adjusted so that electricity consumption can be reduced, increased, or shifted during peak or downstream periods in response to hourly rates or incentives. In particular, a DR service works more flexibly to cope with the inflexibility of renewables or reduce grid consumption during peak periods.
A DR service can be of the explicit or implicit type. Implicit DR (also called “price-based”) is, in fact, a demand-side management (DSM) service. It refers to consumers choosing to be exposed to time-varying electricity prices that reflect the value and cost of electricity in different periods. Armed with this information, consumers can decide—or automate the decision—to shift their electricity consumption away from times of high prices, thereby reducing their energy bill. Time-varying prices are offered by electricity suppliers and can range from simple day and night prices to highly dynamic prices based on hourly wholesale prices. Examples include time-of-use pricing, critical peak pricing, and real-time pricing.
In explicit DR (also called “incentive-based”), the aggregate load is traded in electricity markets with similar supply-side services and receives the same prices. Usually, this happens within balancing markets; consumers receive direct payments to change their consumption due to a request, which is typically triggered by the activation of balancing services, differences in electricity prices, or a constraint on the grid. Consumers can gain from their flexibility in electricity consumption and support the system. The DR referred to in this paper is explicit DR.
2.2. Interplay between EE, DR Programs, and ESR
The integration of EE, DR, and ESR is an emerging area of research with limited implementation experience. To the authors’ knowledge, previous studies have focused on the interactions of EE and DR and the interaction between EE and ESR. However, there is no study aimed at demonstrating, with empirical data, the interaction between EE, DR, and ESR. Traditional EE measures combined with DR and other technologies, such as storage systems, can lead to increased energy productivity by creating a more flexible and reliable energy system. EE affects the available load by reducing or shifting it from peak to off-peak periods (and vice versa) or increasing the potential for flexibility. Following an EEI (suppose the installation of a heat pump), the load shape is higher in some hours, which increases EE availability and encourages greater participation in DR programs. In this case, EE and DR complement each other.
The relationship that exists between EE and ESR interventions is discussed in [
15,
16], which shows that by using a sufficiently high level of energy efficiency, there will be fewer outages, which have a positive effect on system reliability [
17].
From the grid operator’s point of view, efficient energy use (especially during critical hours) gives benefits to the power system by making it more reliable and strengthening its ability to adapt to challenges. This results in lower demand in terms of DR.
2.3. Data-Driven DR–EE–ESR Interplay Simulation
This section proposes a tool for evaluating the benefits of EEI measures. It will consider the characteristic load profile of the user, the composition of the national fuel mix, and data from the power system, calculating the validity of energy efficiency measures in terms of DR service, power system reliability, and emission reduction. The methodology was tested using an Italian case scenario, considering the consumption profile measured in a reference year.
2.3.1. Methodology
The proposed evaluation methodology uses as input data the hourly profiles of the base users (before an EEI) and the estimated profiles (after an EEI); it also employs the national average fuel mix used for the production of the electricity fed into the electricity system, the number of annual peak hours estimated by the TSO, and the demand for availability in terms of DR. Input concepts are briefly explained below:
A basic hourly profile: This is a utility profile on which no EEI has been installed.
A measured hourly profile: This is a user profile on which EEI has been installed.
The hourly national energy mix: This is the set of primary energy sources used to produce the electricity that is subsequently fed into the national electric system for sale to the end user.
The number of critical hours in the electric system: The peak is defined as the set of the number of hours in the year when the probability of system inadequacy is greatest, i.e., the hours when there is a poor ability of the system to meet the demand for electricity within predetermined levels of safety and quality. The TSO determines them for the capacity market. In particular, the adequacy assessments verify the ability of the electricity system to cover the demand for electricity with the necessary reserve margins at all times during the period under consideration. For this reason, annual peak hours are identified as the hours with the lowest adequacy margin on a national basis for each calendar year.
DR demands from the electric system: Reliable operation of the electric system requires a perfect balance between real-time supply and demand. This balance is not easy to achieve since both demand and supply levels can change rapidly and unexpectedly due to many reasons, such as forced outages of generating units, transmission and distribution line outages, and sudden changes in load. Electric system infrastructure is capital intensive; demand-side response (load) is one of the cheapest resources available to operate the electric system.
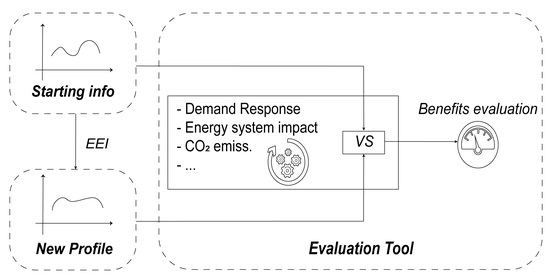
The data flows are represented in
Figure 1. The starting profile, associated with the expected effects of the EEIs on its load profile, is used to obtain the post-EEI profile. These two profiles, with the other input data previously described, are processed by the EvTool to evaluate the impact of the EEIs through specified indicators.
In detail, the used indicators are:
CO2 emissions—in order to estimate social benefits, an estimate of CO2 savings will be made, taking into account the hourly energy production mix in the system;
change in system demanded energy (DR)—to estimate the DR benefits, the amount of energy made available for the DR service will be evaluated by considering the historical demands of the electric system;
change in energy reflecting on critical hours—in order to estimate the benefits of the electric system, the difference in the amount of energy that occurs during the critical hours after the EEI will be evaluated.
Thus, thanks to the EvTool, it is possible to simultaneously estimate the amount of CO2 saved, the amount of energy available for DR, and the benefits to the electric system related to the load level during critical hours. The target is to evaluate the interventions from different points of view to understand their actual efficiency.
2.3.2. Italian Case
In the Italian context, Terna is the TSO. Terna’s Statistical Office, included in Sistan (national statistical system), is responsible by law for processing official statistics of the entire national electricity sector and is, therefore, also responsible for our country’s official statistical communications to international bodies, such as Eurostat, the IEA, the OECD, and the UN [
18].
The market for dispatching services (DSM), in particular, is the instrument through which Terna procures the resources necessary to manage and control the system (intrazonal congestion resolution, creation of energy reserves, real-time balancing). Terna, together with the Regulatory Authority for Energy Networks and Environment (ARERA), has started the process of gradually opening the DSM to demand small-scale, programmable, and nonprogrammable generation plants and storage. Although being part of an experiment, pilot projects are, to all intents and purposes, true regulations that define the technical specifications and procedures that the new resources must comply with in order to provide services. In accordance with what is defined in Resolution 300/2017/R/eel, pilot projects provide for participation in the DSM as follows:
- (1)
in single form for relevant production units (RUEs);
- (2)
in aggregate form for mixed enabled virtual units (UVAMs).
UVAMs must be characterized by a modulable up (increase in input or decrease in withdrawal) or down (increase in withdrawal or decrease in input) capacity of at least 1 MW. The UVAM must be capable of sustaining modulation for at least 480 consecutive minutes. As regards the procedure for forwarding procurement of UVAM, there are three annual products, such as: (a) an annual afternoon product with a strike price equal to EUR 200/MWh, (b) an annual evening product with a strike price equal to EUR 400/MWh, and an annual evening product with a strike price equal to EUR 200/MWh. In the paper, the author considers residential consumers wishing to participate in the DSM and UVAM of interest. It may consist of an aggregation of sites capable of modulating the power profile by opportune devices using loads, distributed generation, and storage systems. UVAMs must be characterized by a modulable up (increase in input or decrease in withdrawal) or down (increase in withdrawal or decrease in input) capacity of at least 1 MW. The UVAM must be capable of sustaining modulation for at least 480 consecutive minutes [
18].
Regarding the procedure for forwarding procurement of UVAM, there are three annual products of which: (a) an annual afternoon product with a strike price equal to EUR 200/MWh, (b) an annual evening product with a strike price equal to EUR 400/MWh, and an annual evening product with a strike price equal to EUR 200/MWh [
18]. The hourly availability range is shown in the
Table 1 below:
4. Conclusions
Since the EE1st is a fundamental principle applied to policymaking, planning, and investment in the energy sector, adoption implies a holistic approach through the entire value chain (from energy production to grid transport to final energy consumption) in order to achieve efficiencies in both primary and final energy consumption. In this context, quantifying EEI value from a different perspective is necessary.
In this paper, the authors developed a method that suggested a related tool able to catch the benefit of an EEI in terms of social benefits, i.e., CO2 emission reduction, DR availability, and electric system reliability.
A possible solution, especially for EPC, is the pay-for-performance contract (P4P). P4P has already been implemented for several years in the United States. Currently, we are observing this concept being introduced in the EU regulatory framework with the SENSEI project [
19], which proposes an advanced EPC version that combines pay-for-performance (P4P) arrangements with energy performance contracting (EPC).
To do that, an adequate smart metering system, supported by a measuring and verification system, is necessary to verify the resulting performance of the user involved in the EEI. Only real and effective energy performance creates the related values.
The simulation results show how the proposed approach works and the related measured effect of the EEI. An Italian scenario was considered for such a simulation.
This tool may be useful for the development of ongoing pay-for-performance contracts (P4P). Pay for performance (P4P) has been described as a scheme that aims to achieve more than persistent energy savings over time by offsetting energy efficiency resources, i.e., by comparing measured energy consumption and actual energy consumption in the absence of energy efficiency measures.
The P4P model allows EE values on the entire value chain to be offered on a bidding platform to players in the market as an investment. This approach encourages long-term investment and transparent cash flows (pay) in energy-efficient buildings by metering energy savings smartly and achieving a return on investment (ROI) based on proven and measured savings in the buildings (performance).


 ,
, 


