Article

Parametric Study of Panel PCM–Air Heat Exchanger Designs

1
Department of Mechanical Engineering, University of Massachusetts Lowell, Lowell, MA 01854, USA
2
Department of Plastics Engineering, University of Massachusetts Lowell, Lowell, MA 01854, USA
*
Author to whom correspondence should be addressed.
Energies 2022, 15(15), 5552; https://doi.org/10.3390/en15155552
Submission received: 15 June 2022 / Revised: 25 July 2022 / Accepted: 28 July 2022 / Published: 30 July 2022
(This article belongs to the Section G2: Phase Change Materials for Energy Storage)

Abstract

:
Heat exchangers, devices for the transfer of heat between two or more working fluids, are extensively used in cooling applications and heating applications. Heat exchangers in buildings are typically components of space-conditioning systems, as well as of water-heating applications. Heat exchangers are also sometimes used in applications that require storage and release of energy at specific times. Phase change materials (PCMs) enhance these heat-exchange processes, given their ability to melt and solidify at a fixed range of temperatures, absorbing or releasing significant amounts of latent heat. Five different configurations of PCM–air heat exchangers for thermal control in buildings are analyzed in this work. The heat exchangers were fitted with PCM encapsulated in plastic and composite pouches of various shapes, and packaged in stackable panel layers. Three-dimensional computational fluid dynamics (CFD) modeling of coupled incompressible fluid and conjugate heat transfer were performed on the designs. The phase change process was numerically modelled using the apparent heat capacity method. Steady-state CFD simulations provided quantification of pressure drop as a function of air flow velocity. Transient simulation results describe the thermal evolution of PCM in the pouches, helping to determine the best performing configuration with respect to total thermal charging time.

1. Introduction

In recent decades, there has been increasing interest in energy conservation technologies and materials. A wide variety of solutions have been created for reducing the cost of energy and limiting the consumption of fossil fuels. Nowadays, research efforts have notably shifted towards energy efficiency and the use of renewable energy sources.
According to the U.S. Energy Information Association [1], around 40 percent of total U.S. end-use energy consumption in 2020 was related to the residential and commercial building sectors, and approximately one third of this was used for heating, ventilation, and cooling purposes. To increase energy usage efficiency in these applications, various methods have been adopted for heat recovery, as well as for active and passive cooling and heating. Among the most compelling technologies, given their potential for seamless integration and high impact, are Latent Heat Thermal Energy Storage Systems (LHTES), which include phase change materials (PCMs). The increased interest in PCMs as energy storage media is due to their reasonably high thermal energy storing capacity and almost isothermal heat conduction during charge and discharge processes. PCMs can absorb significant amounts of heat while maintaining stable temperatures until the material is fully melted. As soon as the ambient temperature around the material decreases, the PCM start to solidify again and releases the stored latent heat. This operation principle is at the core of the design and development of PCM–air heat exchangers, PCM solar power generators and water heating systems, PCM building envelopes, etc. [2,3].
Our research team has been working on a variety of PCM chemical formulations and the development of different types of thermally dynamic building systems, including solar thermal and photovoltaic modules, PCM-enhanced envelopes, space conditioning and water heating systems, etc. A wide diversity of current research efforts have demonstrated that PCMs used in buildings can be effectively utilized to shave and shift time daily peak electricity demands for heating and cooling purposes. Mechanical ventilation systems can be aided by using integrated PCM heat exchangers. In their recent work, Kosny et al. [4] showed that using passively working PCM in roof-deck-installed thermal disconnect systems can significantly reduce and shift overall and peak roof-generated thermal loads. They also showed substantial reductions in peak roof temperatures, nightly heat losses, and daily heat gains. Kuznik et al. [5] proposed a methodology that uses dimensionless analysis of the equations describing PCM heat exchanger systems. The approach was used to identify the best PCM for the chosen usage scenario and the configuration of heat storage for the purpose of electricity peak-load shaving. Medrano et al. [6] experimentally explored five PCM heat exchangers with varying inlet temperatures and flow rates. They identified the best performing among the proposed designs and showed that increasing the inlet temperature closer to the PCM phase change temperature positively affected phase change performance. Lazaro et al. [7] investigated the efficacy of PCM–air heat exchanger slab designs using real-scale experiments. They showed that an increase of heat exchanger performance can be achieved by design enhancements instead of by the thermal conductivity of the PCM material, as the latter is generally associated with increased PCM cost.
Several recent reports have focused on the numerical investigation of PCM heat exchangers. In numerical investigations, there are two main approaches for modeling phase change in LHTES, using models respectively based either on temperature or on enthalpy as the solution variable. Models based on temperature generally require separate equations for the different phases (solid and liquid) and solid–liquid interface tracking. In contrast, models based on enthalpy typically utilize one energy conservation equation written in terms of enthalpy. Alternatively, the apparent heat capacity method can be used for modeling phase change. This method solves a single energy equation and employs effective material properties to model the phase-change interface. Raj et al. [8] used this method to perform a computational fFluid dynamics (CFD) analysis of heat transfer and pressure drop in a PCM–air heat exchanger for free convective cooling applications. They experimentally and computationally analyzed the thermal performance of a PCM-enhanced heat-exchanger module, showing that increasing air inlet velocity had a detrimental effect on PCM solidification time. Dolado et al. [9] characterized a real-scale PCM–air heat exchanger by using computational modeling and experimentation. Phase change was simulated using an experimentally determined enthalpy–temperature curve to model heat storage capacity as a function of temperature. They proved the validity of the model for a wide range of inlet air velocities and temperatures. Also, they showed that PCM charge–discharge times were proportional to the PCM enthalpy values.
This paper presents the computational analysis of five stackable panel PCM–air heat exchanger designs for building applications, and focuses on finding the best performing PCM pouch shapes and placement patterns. A representative design using pyramidical PCM capsules for a stack of four panels is presented in Figure 1. Air flows through the stacked layers of plastic panels containing arrays of PCM pouches. Air and PCM are not in direct contact, as the PCM material is encased in pouches of various forms, sizes, and relative positions. A thin layer of packaging material makes a barrier between PCM and the air.
The PCM formulation analyzed in this paper was mixture of calcium chloride hexahydrate (CaCl2·6H2O) + sodium chloride (NaCl) + strontium chloride (SrCl2·6H2O), 93% + 5% + 2% by mass. In the numerical analyses, we used PCM latent enthalpy values obtained by differential scanning calorimeter (DSC) measurements, as depicted in Figure 2 and in thermal cycles data in Table 1. The PCM formulation considered in this study exhibited a melting point of 26.2 °C, peak temperature of 29.6 °C, and phase-change enthalpy of around 180 J/g.
The various advantages of the proposed PCM–air heat exchanger include its layered structure, the packing of the PCM material, the modular configuration of the panels, the flexibility to use different plate configurations, and the possibility of mechanical and chemical cleaning of individual panels. This type of heat exchanger design is typically used when overall heat transfer coefficients are low either on one side or both sides of the heat transfer surfaces, such as air in the present PCM–air heat exchanger [10].
In the present work, we performed three-dimensional (3D) CFD analyses of transient conjugate heat transfer with phase change processes for five different designs of PCM–air heat exchangers. The numerical model included single-phase convection on the gas (air) domain, together with conduction solid-to-liquid phase change (i.e., negligible effect of natural convection) in the PCM domain. Gas flows were set to specified inlet velocities, thermally interacting with the PCM pouches throughout the length of the heat exchanger. In this model we assumed constant properties, which can be considered a limitation of the model as most fluid properties vary with temperature. Nevertheless, given the temperature ranges of interest, the changes in properties with temperature were negligible, and therefore the assumption of constant properties was reasonable. Moreover, since the simulations were time-dependent and 3D, the assumed constancy of material properties drastically reduced the computational cost of the simulations.
In view of the goal of determining the optimal PCM–air heat exchanger design configuration from among the five considered, we first investigated isothermal pressure drops for various inlet velocities. Subsequently, fully-coupled thermal-fluid simulations with conjugate heat transfer and non-isothermal incompressible flow were employed to analyze the thermal performance of the different PCM–air heat exchanger configurations, to assess their performance.

2. Materials and Methods

In the building applications under consideration, the heat exchangerconsisted of multiple layers of PCM panels stacked on top of each other, as depicted in Figure 1b. In each panel, PCM was packaged inside equilateral square pyramids with a truncated apex (frustum), or cylinders, and encased with plastic material. For all considered pyramidical and cylindrical pouch designs, the height of PCM varied between 6.35 and 17.78 mm (i.e., ¼ and 0.7 inches). In the pyramidical configurations, the distance between two frustums, base length, and the angle between the base and lateral surface were constant and were equal to 4.78 mm (0.19 inches), 38.1 mm (1.5 inches), and 45 degrees, correspondingly. Complete schematics and dimensions of the PCM panels for the pyramidical (PY) configuration are presented in Figure 3.
For the other pyramidical designs, namely pyramidical with offset (PYO) and pyramidical rotated (PYR), the same values were used for pouch height, base length, angle between base and lateral sides, and inter-frustum distance. In the case of the PYO design, each even row was shifted in the direction perpendicular to the inlet flow, by the base length of the pyramidical pouch divided by two. For the PYR design, each pouch was rotated 45 degrees clockwise, using the vector normal to the panel as the axis of rotation. For the cylindrical designs (CY and CYO), the diameter of the pouches was equal to the base length of the pyramidical pouches, i.e., 38.1 mm (1.5 inches), and the cylinders were offset by the same length as in the PYO.
The initial computational assessment of the PCM pouch design was based on thermal simulations where PCM was initially solid at a temperature of 20 °C. Inlet air was at a temperature of 35 °C, higher than the melting temperature of PCM. Upon entering the domain, the air stream heated the PCM pouches, with their subsequent phase change occurring in the temperature range of 23 to 31 °C, and latent heat of melting of 180 kJ/kg (from the DSC analysis, see Figure 2). The density of the PCM in the solid phase was 1.71 × 10³ kg/m3 and the specific heat at constant pressure was 1.6 kJ/kg/K; values for the liquid phase were 1.56 × 10³ kg/m3 and 1.9 kJ/kg/K, respectively. Other assumptions used in the computational model included:
  • Air flow was incompressible due to the small variations of density for the considered inlet velocities.
  • Material properties were constant for the liquid and solid phases of the PCM.
  • Natural (free) convection within the encapsulated PCM was considered negligible, hence the pouches experienced heat conduction-dominated phase change.
Five PCM-–air heat exchanger panel designs were considered, namely pyramidical (PY), pyramidical with offset (PYO), pyramidical rotated (PYR), cylindrical (CY) and cylindrical with offset (CYO), and their schematics are shown in Figure 4. Table 2 summarizes the key geometric characteristics of the PCM pouches, including the volume of PCM within a pouch, the surface areas exposed to air, and the ratio of volume to heat-exchange surface area.
The computational analysis framework was composed of two coupled models: laminar incompressible non-isothermal flow, and conjugate heat transfer between fluid and PCM. The models describe the flow of air and its interaction with the PCM pouches leading to the thermal evolution (temperature and phase fraction) of the PCM–air heat exchanger.
The flow of air is described by the equations of mass conservation for incompressible flow, momentum conservation, and energy conservation. These are given by:
( ρ u ) = 0 ,
ρ t u + ρ ( u ) u = [ - p I + τ ] ,   and
ρ c p t T + ρ c p u T + q = 0 .
where ρ, u, p, τ, cp, T, q are mass density, velocity, pressure, stress tensor, specific heat at constant pressure, temperature, and heat flux, respectively. The stress tensor in the case of Newtonian fluid is given by:
τ = - μ ( u +   ( u ) T ) ,
and the heat flux is described using Fourier’s law:
q = - κ T ,
where κ is thermal conductivity. In the energy conservation equation, we neglected thermal expansion, viscous dissipation, and pressure work. The values of transport and material properties used in simulations are listed in Table 3.
The first phase of the computational analysis was constituted by steady-state simulations under isothermal conditions (i.e., Equations (1) and (2) only) in order to determine the pressure drop across a PCM–air heat exchanger panel. The second phase of the analysis consisted of simulations of coupled conjugate heat transfer with phase change and incompressible fluid flow in order to assess the thermal performance of the designs.
Because our model was time-dependent and 3D, for the reduction of computational cost we neglected convective motion caused by buoyancy. The thermal evolution of the PCM can be described by the nonlinear heat conduction model given by:
ρ c p t T = ( κ T ) ,
where the heat capacity cp and thermal conductivity κ are (nonlinear) functions of temperature T. To describe phase change within the PCM pouches, we use the apparent heat capacity formulation. This formulation assumes that specific heat is equal to the phase-fraction-averaged specific heats plus the latent heat of melting multiplied by the temperature derivative of the mass fraction, namely:
c p = θ s c p , s + θ l c p , l + L 1 2 α m T ,
α m = 1 2 θ l - θ s θ s + θ l .
In the above expressions, quantities with subscripts s and l correspond to values in solid and liquid states, respectively, and θ denotes phase fraction. We have only two phases:
θ s + θ l = 1 .
Thus, the mass fraction is given by:
α m = 1 2 ( θ l - θ s ) ,
whereas effective thermal conductivity is also phase fraction averaged:
κ = θ s κ s + θ l κ l
Equations (6)–(11) describe heat transfer and phase change in the PCM part of the simulation domain, and Equations (1)–(5) model fluid flow and conjugate heat transfer in the air part.
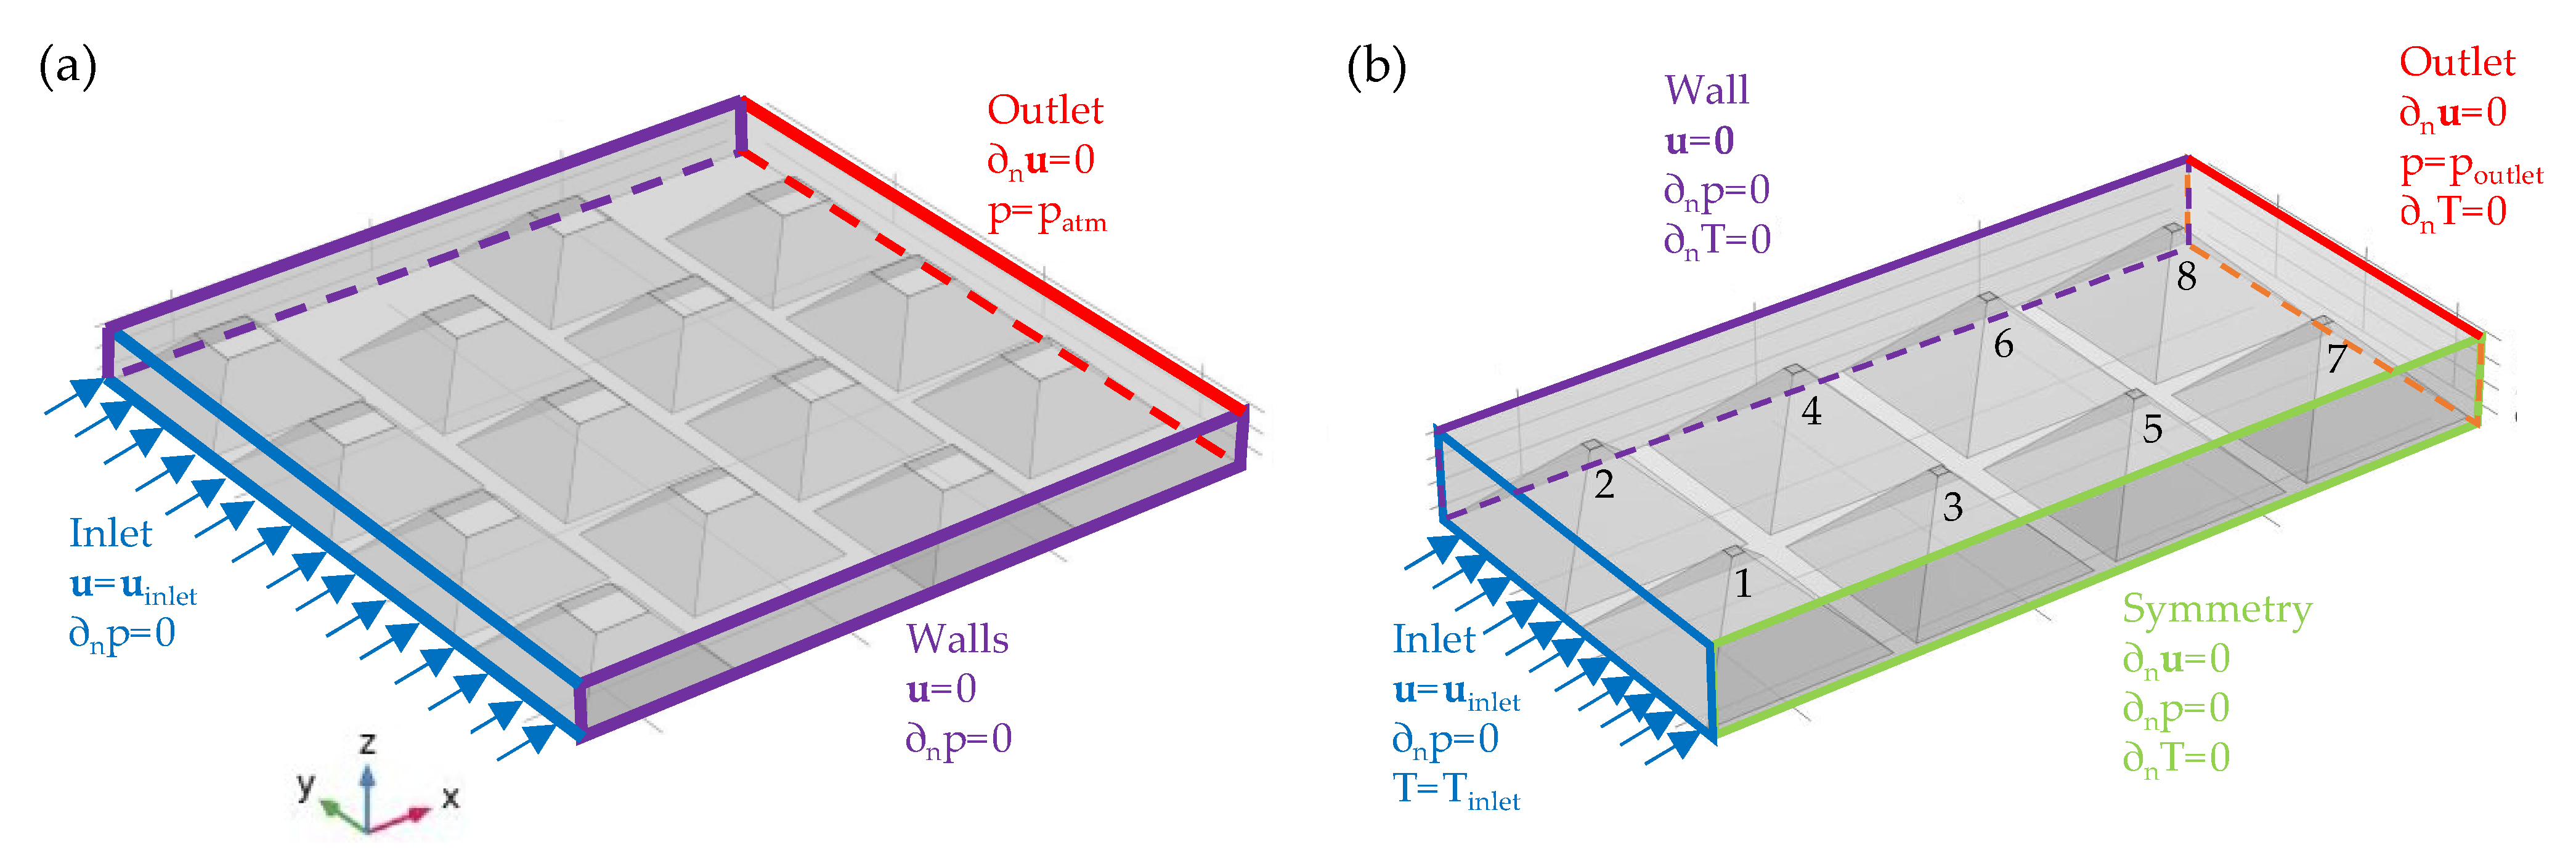
For the first set of simulations, we modelled the full 3D domain of the PCM–air heat exchanger. The computational domain and the set of boundary conditions used are schematically depicted in Figure 5. In the second set of simulations, we used a symmetry plane in the direction of air flow and simulated only half of the domain to decrease the computational cost for the coupled fluid flow and conjugate heat transfer simulations.
The boundary conditions used in the set of numerical experiments are listed in Table 4. In the simulations, we set inlet velocities and temperatures at fixed values with zero pressure gradient. For the outflow boundary, zero gradient boundary conditions were used for velocity and temperature, while the value of pressure was specified equal to 1 atm. At the wall boundaries, velocity was set to zero (i.e., no-slip condition) and zero gradients were used for temperature and pressure. The same values were used on the surfaces of the PCM pouches, except for temperature, for which the value was coupled to the temperature of the air following the conjugate transfer model.
Model set-up, geometry specification, meshing, and analysis were performed using COMSOL® software [15], specifically its Heat Transfer module. COMSOL is widely used for the computational modeling of various coupled physics problems, including conjugate heat transfer and phase change. There are numerous studies that verify and validate COMSOL’s Heat Transfer module for these purposes. Kylili et al. [16] used it to characterize the thermal performance of PCM-enhanced building elements, validating their results with experiments. Kant et al. [17] used and validated COMSOL for the prediction of melting–solidification of five different fatty acids in an aluminum container. Moreover, COMSOL has been validated with PCM heat transfer problems similar to the present study [18,19,20]. COMSOL employs the finite element method (FEM) for solving the set of partial differential equations comprising the model. COMSOL’s capability of coupling and modeling different multiphysics makes it a convenient and highly flexible CFD tool. Because coupled 3D simulations are computationally intensive to speed-up simulations, the client-server capability of COMSOL to run computations on a remote high-performance cluster was used. Simulations were run for 10 h of simulation time using 15 cores and took several hours of wall-clock time on average.

3. Results

3.1. Steady-State Isothermal Pressure Drop Analysis

As a first step towards the optimization of the PCM–air heat exchangers, we conducted the series of steady-state simulations with varying inlet velocities and PCM panel heights, to obtain pressure drops for each panel design. As described in the previous section, for this analysis, the whole panel domain was considered isothermal with no heat transfer and no phase change. PCM pouch heights ranged between 6.35 and 17.78 mm, while inlet velocities were in the range of 0.2 to 2.0 m/s.
Figure 6 presents representative steady-state results, namely distributions of air velocity magnitude and pressure, for the PYO design for uinlet = 2 m/s and h = 12.19 mm. The results in Figure 6a show that air flow accelerated through the channels formed by neighboring PCM pyramids until being obstructed by the pouch in the next row, and subsequently flowed around it. Similar flow patterns were observed for each row of PCM pouches. The results in Figure 6b show that the largest decrease in pressure was experienced between the inlet plane and the first row of pyramids, and the decrease in pressure was significantly lower through the next rows, with the lowest pressure values found in the vicinity of the outlet plane. The results also showed very small pressure variations along each given row of pyramidical pouches.
Figure 7 summarizes the results comparing pressure drop as a function of inlet velocity and height for all the investigated PCM–air heat exchanger panel designs. The results clearly show that the pressure drop across the panel decreased with increasing panel height. The observed trend was as expected, given that the hydraulic diameter of the channels between pouches increases with panel height, and the pressure drop increases with increasing velocity.
Among the three pyramidical designs, the PY design had a maximum pressure drop of 547 Pa, whereas the PYO design had a highest pressure drop of 580 Pa (for the minimum height of 6.35 mm and the maximum inlet velocity of 2 m/s). That is to say, the PYO design showed a ~6% increase in pressure drop compared with the PY design. In contrast, the PYR design showed the lowest pressure drop values, with a maximum pressure drop of 246 Pa, ~50% lower than for the PY design.
For the cylindrical designs, the pressure drop was almost one order of magnitude lower than for the pyramidical designs. The highest pressure drop was observed for the CYO design, at roughly 61 Pa. This value was 42% larger than the pressure drop for the CY configuration, with a maximum pressure drop of 43 Pa at 2 m/s inflow.
These results indicate that the cylindrical pouch designs offered drastically lower pressure drops, with the cylindrical-offset (CYO) configuration being the optimal design to maximize the residence time of air and enhance heat exchange in the PCM–air heat exchanger.

3.2. Transient Phase Change Analysis

Next, to assess the PCM–air heat exchanger designs for optimal thermal performance, we analyzed transient conjugate heat transfer and phase change coupled with incompressible fluid flow, for the five panel designs. Figure 8 shows results for all designs for the evolution of solid phase fractions of individual PCM pouches against time, with inlet velocity of 0.2 m/s and panel heights of 17.78 mm (minimum inflow velocity and largest height leading to the lowest pressure drop). The solid fraction for a given pouch was computed as α ¯ s = α s d V p o u c h / V p o u c h , where α s is the solid fraction and Vpouch is the volume of the pouch.
The plots in Figure 8 illustrate that the speed of phase change was greatest for the first row of PCM pouches for all panel configurations, with a visible delay of melting for each subsequent row. Additionally, the phase change processes occurred almost concurrently for the PCM pouches on each row. An exception to this was pouch 6 in the third row of the CYO panel design, where phase change started earlier than for the second row. A possible explanation lies in the configuration of the proposed CYO design, as observed in Figure 4.This design there included a much larger air mixing volume upstream of pouch 6, i.e., between pouch 4 and the walls, compared to the CY design. Upon flowing downstream, this air mass impacted on the cylindric pouch, transferring its thermal energy to the pouch.
The results in Figure 8 also show that for the first rows of PY, PYO, and PYR configurations, phase change was completed at 3.6, 3.4 and 4.7 h, respectively. For the CY and CYO designs, the respective times were 5.6 and 5.2 h. Phase change completion time varied not only by configurations and rows, but was also different for pouches in the same row. Interestingly, the last PCM row in the CYO design did not liquify completely after 10 h of simulation time.
The temperature evolution for individual PCM pouches in the different panel designs are illustrated in Figure 9. The results show that phase fraction for each pouch followed the pouch’s average temperature, as expected. For all configurations, pouches in the first row were first heated, with the clearly distinguishable heating of each PCM row observed for the PY, PYO, and PYR designs. Each panel except CY and CYO reached inlet air temperature of 35 °C and steady-state by the end of the 10 h simulation time. It should be noted that, although the average PCM volume temperature did not reach the inlet value, we considered the phase change process complete as all the PCM was liquified.
Figure 10 shows the comparison of volume-averaged solid phase fraction over all PCM pouches and temperature evolutions for all the PCM–air heat exchanger configurations. The PYO design was fastest in terms of charging, followed by the PYR, PY, CY, and finally the CYO configuration. Full PCM panel charge times were 6.8, 7.1, 7.5 and 9.6 h for the PYO, PY, PYR and CY designs, respectively. Although the phase-change process was close to completion in the case of the CYO design, it had not finished after 10 h.

4. Discussion

In this work, we performed computational optimization analysis for several PCM–air heat exchanger designs. The analysis consisted of two parts: isothermal incompressible steady-state fluid flow pressure drop, and transient conjugated heat transfer with phase change and coupled non-isothermal flow.
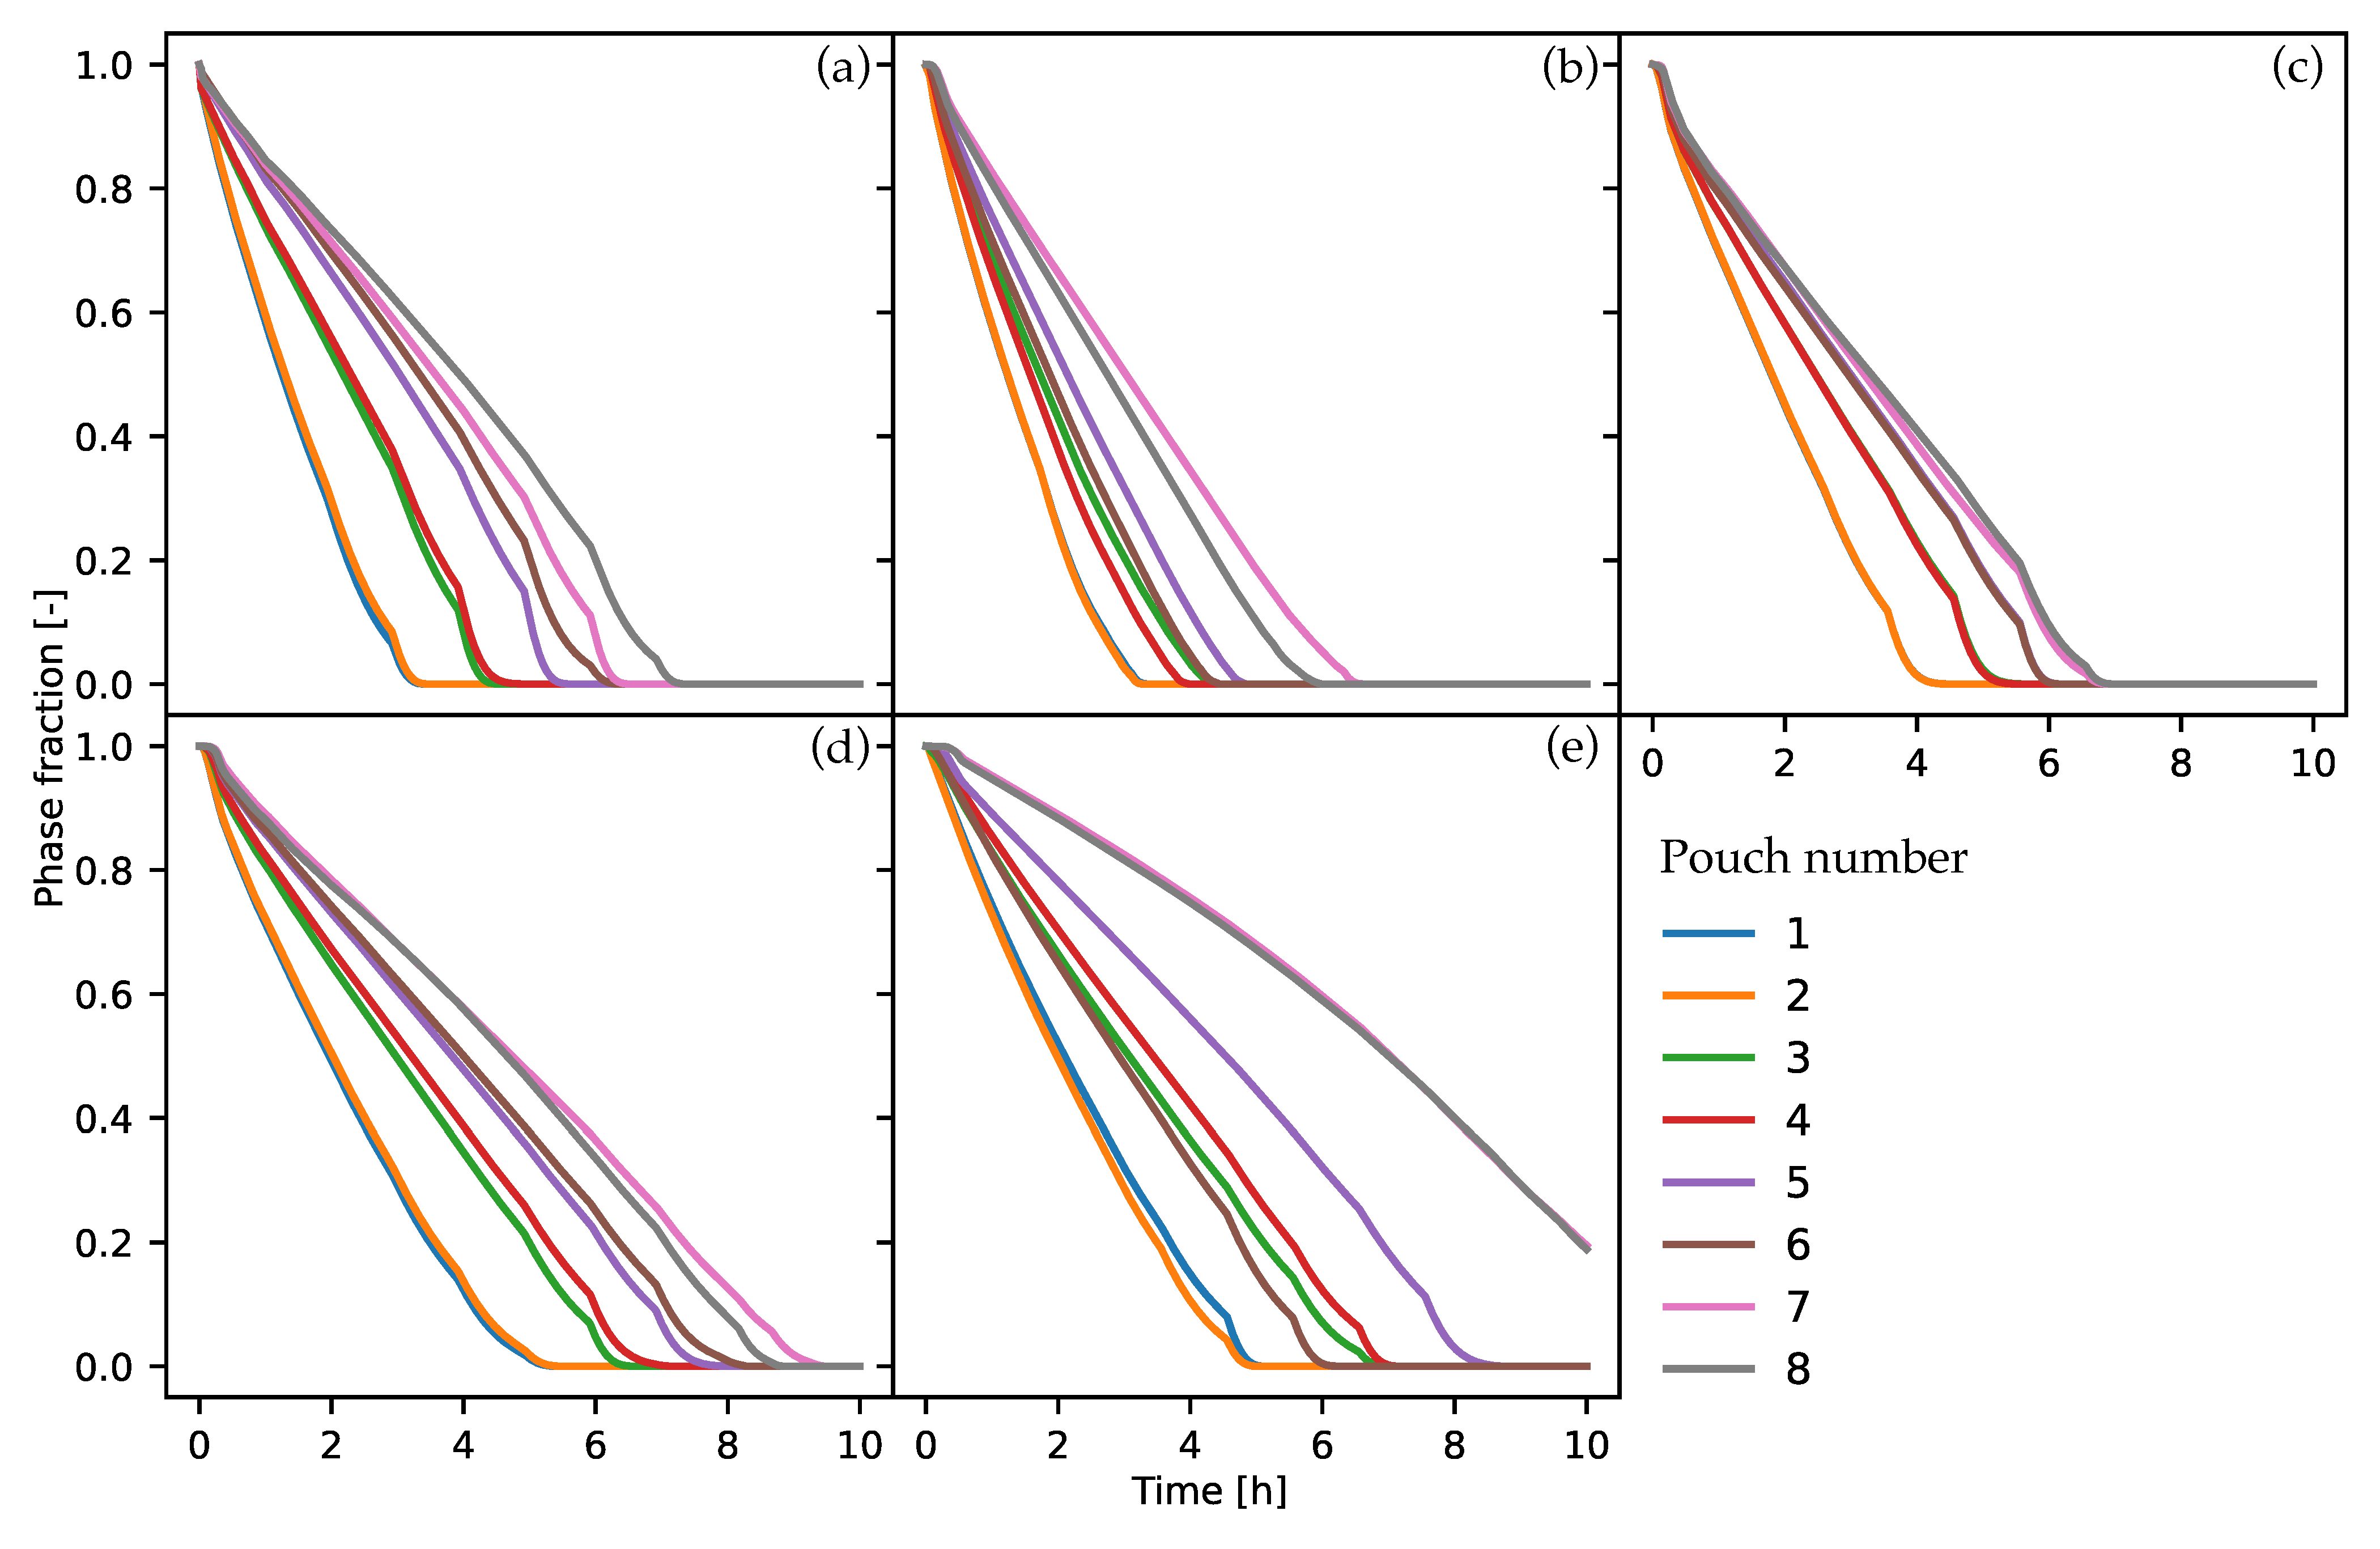
The results revealed that the more distant rows of PCM pouches began phase change much later than the front rows. This fact can be used for to improve proposed PCM–air heat exchanger designs, by placing packaged PCM material with decreasing melting temperatures in each subsequent row. This will allow synchronization of the phase change process in the heat exchanger, thus decreasing the time required for charge and discharge of the PCM panel and thereby increasing its efficiency. The combination of different PCMs with different melting temperatures has proven quite successful in other applications, and can improve the performance of panel PCM–air heat exchangers [21,22].
Finally, a lower ratio of PCM volume with surface area exposed to air was associated with faster PCM charging times. In this resecpt, the fastest pyramidical design had a value of 4.51, while cylindrical configurations had a ratio of 9.52. Therefore, to maximize the heat transfer process between the air and the PCM panels, volume-to-surface ratio should be minimized.
From the first part of the optimization analysis, we concluded that in terms of pressure drop and air residence time, the CY design was optimal because it had the lowest value of pressure drop for varying heights, ranging from 27 to 43 Pa for the highest inlet velocity of 2 m/s. The second-best design was the CYO, with values of 28 to 61 Pa for the same velocity range. Similar values for all pyramidical designs (PY, PYR, PYO) were on average higher by the same order of magnitude.
For the second part of the numerical investigation, we determined that the PYO design was optimal in terms of charging speed, as its charging was approximately 51% faster than the CY design. The second-fastest panel was the PYR design, which charged 5% slower than the PYO design and was followed by the PY, CY, and CYO panels. The worst design in terms of charging was the CYO configuration, which had not completed the phase-change process by the end of 10 h simulation time. It is important to notice that the PYO configuration had two fewer PCM pouches, which contributed to the faster completion of its phase change.

5. Conclusions

A parametric study of the design of a panel PCM–air heat exchanger design composed of stackable layers has been presented in this paper. Using CFD modeling, the study focused on evaluating different shapes and patterns of encapsulated PCM pouches packaged in stackable panels. The pouches under consideration had pyramidical or cylindrical shapes and their patterns included regular, regular-rotated, and offset staggered arrays; the shapes and patterns were chosen due to their suitability for mass manufacture. A total of five panel designs were evaluated: pyramidical (PY), pyramidical with offset (PYO), pyramidical rotated (PYR), cylindrical (CY), and cylindrical with offset (CYO).
First, an investigation of steady-state pressure drop as function of height and air inlet velocity was performed for the different designs. The obtained results indicated that the optimal configuration was the CYO, which showed a significantly lower pressure drop than the other designs.
In the second part of the work, transient simulations of coupled conjugate heat transfer with phase change and incompressible fluid flow were carried out to determine the best-performing PCM panel in terms of thermal charging speed, from among the five considered designs. Results show that the PYO design had the fastest charging speed of 6.8 h, followed by the PY, PYR, and CY designs with charging times of 7.1, 7.5 and 9.6 h, respectively. In the case of CYO configuration, the phase-change process had not finished by the end of the 10 h simulation time.
This study can be used as a basis for the design optimization of panel PCM–air heat exchangers. For design optimization purposes, the full charging–discharging cycle should be modeled for a wider range of PCM pouch shapes (e.g., prisms, truncated cones) and placement patterns (e.g., staggered with variable spacing). Additionally, cost benefit analysis should be performed for determining optimal configurations for HVAC and energy-saving applications.

Author Contributions

Conceptualization, J.K.; methodology, J.P.T.; model formulation, T.K.; validation, T.K., J.P.T. and J.K.; formal analysis, T.K.; investigation, T.K. and J.T.; resources, J.K., J.P.T. and J.T.; data curation, T.K.; writing—original draft preparation, T.K.; writing—review and editing, J.P.T., J.K. and J.T.; visualization, T.K.; supervision, J.P.T. and J.K.; project administration, J.K.; funding acquisition, J.K.; material testing, J.T. All authors have read and agreed to the published version of the manuscript.

Funding

This research was funded by the Department of Energy, grant number DE-EE0009156.

Data Availability Statement

The data presented in this study are available from the corresponding author upon reasonable request.

Acknowledgments

The authors thank Benedict Amuta for creating Solidworks drawings of the designs. This work was completed in part with computational resources from the Massachusetts Green High Performance Computing Cluster (MGHPCC).

Conflicts of Interest

The authors declare no conflict of interest.

References

  1. U.S. Energy Information Administration. Monthly Energy Review—February 2022; U.S. Energy Information Administration: Washington, DC, USA, 2022; Volume 276. [Google Scholar]
  2. Mofijur, M.; Mahlia, T.; Silitonga, A.; Ong, H.; Silakhori, M.; Hasan, M.; Putra, N.; Rahman, S.M. Phase Change Materials (PCM) for Solar Energy Usages and Storage: An Overview. Energies 2019, 12, 3167. [Google Scholar] [CrossRef] [Green Version]
  3. Seong, Y.-B.; Lim, J.-H. Energy Saving Potentials of Phase Change Materials Applied to Lightweight Building Envelopes. Energies 2013, 6, 5219–5230. [Google Scholar] [CrossRef]
  4. Kośny, J.; Miller, W.A.; Yarbrough, D.; Kossecka, E.; Biswas, K. Application of Phase Change Materials and Conventional Thermal Mass for Control of Roof-Generated Cooling Loads. Appl. Sci. 2020, 10, 6875. [Google Scholar] [CrossRef]
  5. Kuznik, F.; Arzamendia Lopez, J.P.; Baillis, D.; Johannes, K. Design of a PCM to air heat exchanger using dimensionless analysis: Application to electricity peak shaving in buildings. Energy Build. 2015, 106, 65–73. [Google Scholar] [CrossRef]
  6. Medrano, M.; Yilmaz, M.O.; Nogués, M.; Martorell, I.; Roca, J.; Cabeza, L.F. Experimental evaluation of commercial heat exchangers for use as PCM thermal storage systems. Appl. Energy 2009, 86, 2047–2055. [Google Scholar] [CrossRef]
  7. Lazaro, A.; Dolado, P.; Marín, J.M.; Zalba, B. PCM–air heat exchangers for free-cooling applications in buildings: Experimental results of two real-scale prototypes. Energy Convers. Manag. 2009, 50, 439–443. [Google Scholar] [CrossRef]
  8. Antony Aroul Raj, V.; Velraj, R. Heat transfer and pressure drop studies on a PCM-heat exchanger module for free cooling applications. Int. J. Therm. Sci. 2011, 50, 1573–1582. [Google Scholar] [CrossRef]
  9. Dolado, P.; Lazaro, A.; Marin, J.M.; Zalba, B. Characterization of melting and solidification in a real scale PCM-air heat exchanger: Numerical model and experimental validation. Energy Convers. Manag. 2011, 52, 1890–1907. [Google Scholar] [CrossRef]
  10. Kakac, S.; Liu, H.; Pramuanjaroenkij, A. Heat Exchangers: Selection, Rating, and Thermal Design; CRC Press: Boca Raton, FL, USA, 2002. [Google Scholar]
  11. Tyagi, V.V.; Buddhi, D. Thermal cycle testing of calcium chloride hexahydrate as a possible PCM for latent heat storage. Sol. Energy Mater. Sol. Cells 2008, 92, 891–899. [Google Scholar] [CrossRef]
  12. Cabeza, L.F.; Roca, J.; Nogués, M.; Mehling, H.; Hiebler, S. Immersion corrosion tests on metal-salt hydrate pairs used for latent heat storage in the 48 to 58°C temperature range. Mater. Corros. 2002, 53, 902–907. [Google Scholar] [CrossRef]
  13. Zalba, B.; Marín, J.M.; Cabeza, L.F.; Mehling, H. Review on thermal energy storage with phase change: Materials, heat transfer analysis and applications. Appl. Therm. Eng. 2003, 23, 251–283. [Google Scholar] [CrossRef]
  14. Rezvanpour, M.; Borooghani, D.; Torabi, F.; Pazoki, M. Using CaCl2·6H2O as a phase change material for thermo-regulation and enhancing photovoltaic panels’ conversion efficiency: Experimental study and TRNSYS validation. Renew. Energy 2020, 146, 1907–1921. [Google Scholar] [CrossRef]
  15. COMSOL Multiphysics®, v. 5.6; COMSOL AB: Stockholm, Sweden, 2020; Available online: https://www.comsol.com/ (accessed on 14 June 2022).
  16. Kylili, A.; Theodoridou, M.; Ioannou, I.; Fokaides, P.A. Numerical heat transfer analysis of Phase Change Material (PCM)–enhanced plasters. In Proceedings of the 2016 COMSOL Conference in, Munich, Germany, 12–14 October 2016. [Google Scholar]
  17. Kant, K.; Shukla, A.; Sharma, A. Performance evaluation of fatty acids as phase change material for thermal energy storage. J. Energy Storage 2016, 6, 153–162. [Google Scholar] [CrossRef]
  18. Dhaidan, N.S.; Khodadadi, J.M.; Al-Hattab, T.A.; Al-Mashat, S.M. Experimental and numerical investigation of melting of phase change material/nanoparticle suspensions in a square container subjected to a constant heat flux. Int. J. Heat Mass Transf. 2013, 66, 672–683. [Google Scholar] [CrossRef]
  19. Biwole, P.H.; Eclache, P.; Kuznik, F. Phase-change materials to improve solar panel’s performance. Energy Build. 2013, 62, 59–67. [Google Scholar] [CrossRef] [Green Version]
  20. Kaplan, F.; De Vivero, C.; Howes, S.; Arora, M.; Homayoun, H.; Burleson, W.; Tullsen, D.; Coskun, A.K. Modeling and analysis of Phase Change Materials for efficient thermal management. In Proceedings of the 2014 IEEE 32nd International Conference on Computer Design (ICCD), Seoul, Korea, 19–22 October 2014; IEEE: Piscataway, NJ, USA, 2014; pp. 256–263. [Google Scholar]
  21. Li, W.; Wang, J.; Zhang, X.; Liu, X.; Dong, H. Experimental and numerical investigation of the melting process and heat transfer characteristics of multiple phase change materials. Int. J. Energy Res. 2020, 44, 1129–1132. [Google Scholar] [CrossRef]
  22. Aldoss, T.K.; Rahman, M.M. Comparison between the single-PCM and multi-PCM thermal energy storage design. Energy Convers. Manag. 2014, 83, 79–87. [Google Scholar] [CrossRef]
Figure 1. Representative stack of four layers of PCM–air heat exchanger: (a) isometric view, (b) side view of the assembly.
Energies 15 05552 g001
Figure 2. Differential scanning calorimeter (DSC) test-generated enthalpy curve for the mixture of calcium chloride hexahydrate (CaCl2·6H2O) + sodium chloride (NaCl) + strontium chloride (SrCl2·6H2O) (93% + 5% + 2%) for different thermal cycles. The average phase-change enthalpy for cycles 5–25 was approximately 180 J/g.
Energies 15 05552 g002
Figure 3. Designs of PCM panels for the pyramidical (PY) configuration with different frustrum heights: (a) h = 15.24 mm, (b) h = 6.35 mm.
Energies 15 05552 g003
Figure 4. PCM–air heat exchanger designs: PY—pyramidical, PYO—pyramidical with offset, PYR—pyramidical rotated, CY—cylindrical, and CYO—cylindrical with offset. All dimensions are in mm.
Energies 15 05552 g004
Figure 5. Boundary conditions for the PCM–air heat exchanger model: (a) steady-state incompressible flow for the assessment of pressure drop across, (b) coupled transient conjugate heat transfer and incompressible flow for assessment of thermal performance. The numbers identify individual pouches in order to track the evolution of the PCM within a given pouch.
Energies 15 05552 g005
Figure 6. Air flow through a PCM–air heat exchanger panel: (a) steady-state air velocity magnitude and (b) pressure distributions for the PYO design, for uinlet = 2 m/s and h = 12.19 mm.
Energies 15 05552 g006
Figure 7. Pressure drops across PCM–air heat exchanger panels. Total pressure drop for varying pouch heights and inlet velocities for (a) PY, (b) PYO, (c) PYR, (d) CY, and (e) CYO designs.
Energies 15 05552 g007
Figure 8. Evolution of solid phase fractions with time during the charging of PCM pouches for (a) PY, (b) PYO, (c) PYR, (d) CY, and (e) CYO designs. The phase change process ends when the phase fraction reaches zero. Delays in phase transitions were observed for each subsequent row of PCM pouches in all the investigated designs.
Energies 15 05552 g008
Figure 9. Temperature change with time during charging of the PCM panels for (a) PY, (b) PYO, (c) PYR, (d) CY, and (e) CYO designs. Arrows indicate completion of phase transition.
Energies 15 05552 g009
Figure 10. PCM panel volume-averaged (a) phase fraction and (b) temperature versus time during discharging. The phase-change process is considered complete when the phase fraction flattens.
Energies 15 05552 g010
Table 1. Thermal cycle data for CaCl2·6H2O based PCM.
Heating CycleOnset Temperature, °CPeak Temperature, °CLatent Heat, J/g
222.425.1128
524.426.7178
1025.128.4196
1526.630.8181
2026.229.7170
2526.329.3169
Table 2. Geometric characteristics of the PCM–air heat exchanger panels.
PCM Volume, mm3/Surface Area Exposed to Air, mm2 = Volume-to-Surface Ratio, mm
Height, mmPyramidical (PY)/Pyramidical rotated (PYR)Pyramidical with offset (PYO)Cylindrical (CY)Cylindrical with offset (CYO)
6.35103784/18248
= 5.69
90811/15967
= 5.69
115701/12155
= 9.52
101239/10635
= 9.52
10.16132494/25693
= 5.16
115933/22481
= 5.16
185125/19448
= 9.52
161986/17017
= 9.52
11.18137070/27235
= 5.03
119936/23831
= 5.03
203642/21392
= 9.52
178193/18718
= 9.52
12.19140603/28589
= 4.92
123027/25016
= 4.92
222143/23337
= 9.52
194383/20420
= 9.52
13.21143229/29757
= 4.81
125326/26037
= 4.81
240660/25282
= 9.52
210574/22122
= 9.52
14.22145086/30739
= 4.72
126950/26986
= 4.72
259178/27227
= 9.52
226781/23823
= 9.52
15.24146304/31532
= 4.64
128016/27591
= 4.64
277679/29172
= 9.52
242971/25525
= 9.52
17.78147439/32700
= 4.51
129009/28612
= 4.51
323956/340333
= 9.52
283463/29779
= 9.52
Table 3. Transport properties of PCM.
PropertyUnitsSolidLiquid
densitykg m−31.71 × 10³ [11]1.56 × 10³ [12]
thermal conductivityW m−1K−11.08 [13]0.56 [13]
specific heat at constant pressureJ kg−1K−11.6 × 10³ [14]1.9 × 10³ [14]
melting temperatureK300
melting temperature rangeK296–304
latent heat of fusionkJ kg−1180
Table 4. Boundary conditions for the PCM–air heat exchanger simulations.
BoundaryInletOutletWallsPCM-Air Interface
Field
TTinlet T n = 0 T n = 0 Tair = TPCM
uuinlet u n = 0 uwalluwall
p p n = 0 poutlet p n = 0 p n = 0
Publisher’s Note: MDPI stays neutral with regard to jurisdictional claims in published maps and institutional affiliations.

