Article

Experimental and Numerical Investigation of Rotor–Stator Interaction in a Large Prototype Pump–Turbine in Turbine Mode

1
Branch Company of Maintenance & Test, CSG Power Generation Co., Ltd., Guangzhou 511400, China
2
Department of Energy and Power Engineering, Tsinghua University, Beijing 100084, China
3
S.C.I. Energy, Future Energy Research Institute, Seidengasse 17, 8706 Zurich, Switzerland
*
Author to whom correspondence should be addressed.
Energies 2022, 15(15), 5523; https://doi.org/10.3390/en15155523
Submission received: 13 June 2022 / Revised: 25 July 2022 / Accepted: 28 July 2022 / Published: 29 July 2022
(This article belongs to the Section L: Energy Sources)

Abstract

:
In recent years, large-capacity, high-head pump–turbine units have been developed for pumped storage power plants to effectively utilise water energy and store large amounts of electricity. Compared with the traditional Francis turbine unit, the radial distance between the trailing edge of the guide vanes and the leading edge of runner blades of high-head pump–turbine unit is smaller, so the rotor–stator interaction and the corresponding pressure fluctuations in the vaneless space of pumped storage units are more intense. The pressure fluctuations with high amplitudes and high frequencies induced by rotor–stator interaction (RSI) become the main hydraulic excitation source for the structures of the unit and may cause violent vibration and fatigue damage to structural components, and seriously affect the safe operation of the units. In this paper, the RSI of a high-head pump–turbine in turbine mode of operation is studied in detail by means of site measurement and full three-dimensional unsteady simulations. The results of RSI-induced pressure fluctuations in turbine mode are analysed experimentally and numerically. The accuracy of the numerical calculations is verified by comparing with the measured results, and the variation law of RSI is deeply analysed. The results show that the pressure fluctuations in the vaneless space are affected by the wake of the guide vane, the rotating excitation of the runner, the low-frequency excitation of the draft tube, and the asymmetric characteristics of the incoming flow of the spiral case, and shows significant differences in spatial position. The findings of the investigation are an important and valuable reference for the design and safe operation of the pumped storage power station. It is recommended to design the runner with inclined inlets to reduce the amplitudes of RSI-induced pressure fluctuations and to avoid operating the pump–turbine units under partial load for long periods of time to reduce the risk of pressure fluctuation induced severe vibration on the structures.

1. Introduction

With the increasing demand for electricity and the large-scale access of clean energy such as wind power and photovoltaic power generation to the power grid, the demand for peak shaving and frequency modulation of the power grid increases, and the capacity of energy storage and consumption also needs to be increased. The pumped storage power station (PSPS) can generate electricity and store energy and has the ability to flexibly change working conditions such as startup and shutdown and load regulation. Increasing the installed capacity of pumped storage units in the power grid can improve the flexible regulation capacity of the power grid, which is of great significance to the stable and safe operation of the power grid.
Reversible hydromachines such as pump–turbines (PTs) are widely used in PSPSs, which are able to operate in the power generation condition or in the pumped storage condition according to grid requirements. When the unit operates in turbine mode, the water flows into the PT runner from the spiral case, and the water impacts the runner blades to drive the main shaft to rotate for power generation. When the unit is switched to pump mode, the water flow enters the PT impeller from the draft tube and the water is pumped to the upper reservoir for energy storage in the form of potential energy. Considering the economics of construction and operation, PSPSs mostly use high-head PT units with long inflow channels and narrow vaneless zones, resulting in more intense pressure fluctuations in the vaneless space. Many studies [1,2,3,4,5,6,7,8,9,10,11] have reported abnormal vibrations and even fatigue cracks in the runners of hydraulic turbine units due to intense pressure fluctuations in the vaneless space, which seriously affect the safe operation of power stations. The pressure fluctuations in the vaneless space are mainly caused by rotor–stator interaction (RSI).
RSI describes the mutual interference of runner channel flow in the rotating frame and guide vane channel flow in the stationary frame, resulting in the superposition of pressure and velocity fields in the vaneless space and producing high-level pressure fluctuations. The wake of stay vanes is disturbed by guide vanes and cut by the runner with the rotational speed as high as 600 rpm, resulting in strong unstable flow in the vaneless space and severe pressure fluctuations [2,3,6,12,13,14,15,16,17,18,19].
The researchers experimentally investigated the RSI of the turbo-machines by means of particle image velocimetry (PIV) and high-speed flow visualization measurements, and they found that the upstream wake being chopped off by the downstream blades increases the turbulence in the downstream velocity field [20,21,22]. The investigations [23,24,25,26,27,28,29,30] summarised the current measurement methods of hydraulic machinery, compared the advantages and disadvantages of various methods, and gave experimental test cases of pressure fluctuations in the vaneless space of the hydraulic turbine units.
Experimental measurement and numerical simulation are the main methods to study the RSI of pumped storage units. The measurement method is more direct and the result is more reliable. Based on the development of computational fluid dynamics (CFD), numerical simulation has gradually become an important method to study hydraulic turbine units. The scholars [2,6,15,16,17,18,19,22,24,25,26,27,28,29,30] have carried out a large number of measurement tests on RSI phenomena and provided a considerable number of reliable data. The researchers [3,6,14,17,18,24,29,30] have compared the simulation calculation and test measurement results of pressure fluctuations in the vaneless space of the unit and proved the feasibility and accuracy of the simulation calculation.
The three-dimensional turbulent unsteady calculation is widely used to study the RSI phenomenon. Many researchers [13,14,15,16,30] have compared the effects of different turbulence models on the calculation results, and proved the accuracy of various calculation models for the simulation results of pressure fluctuations in the vaneless space. Many studies [2,3,6,7,12,13,14,15,16,17,18,19,20,21,22,23,24,25,26,27,28,29,30] have investigated the causes of pressure fluctuations in the vaneless space, and conducted sensitivity studies by controlling the geometric variables. However, there are still deficiencies in the RSI analysis of the high-head PT, with a lack of research on RSI under partial load and other off-design conditions. PT units often work under off-design conditions due to peak shaving demand of the grid, when the pressure fluctuations of the unit often intensify and pose a threat to the safety of the unit. Therefore, the research on pressure fluctuations in the vaneless space of the high-head PT unit under different loads is of great significance.
In this paper, the site measurement and numerical simulation of a high-head PT in turbine mode were carried out, and the variation of pressure fluctuations in the vaneless space of the unit under 60%, 86.7%, and 100% load were analysed in detail. The effect of RSI on the flow characteristics of the unit was analysed in depth by comparing the numerical calculation of the unit with the results of field tests. The conclusions of the study have important reference values for the design and safe operation of the PSPSs.

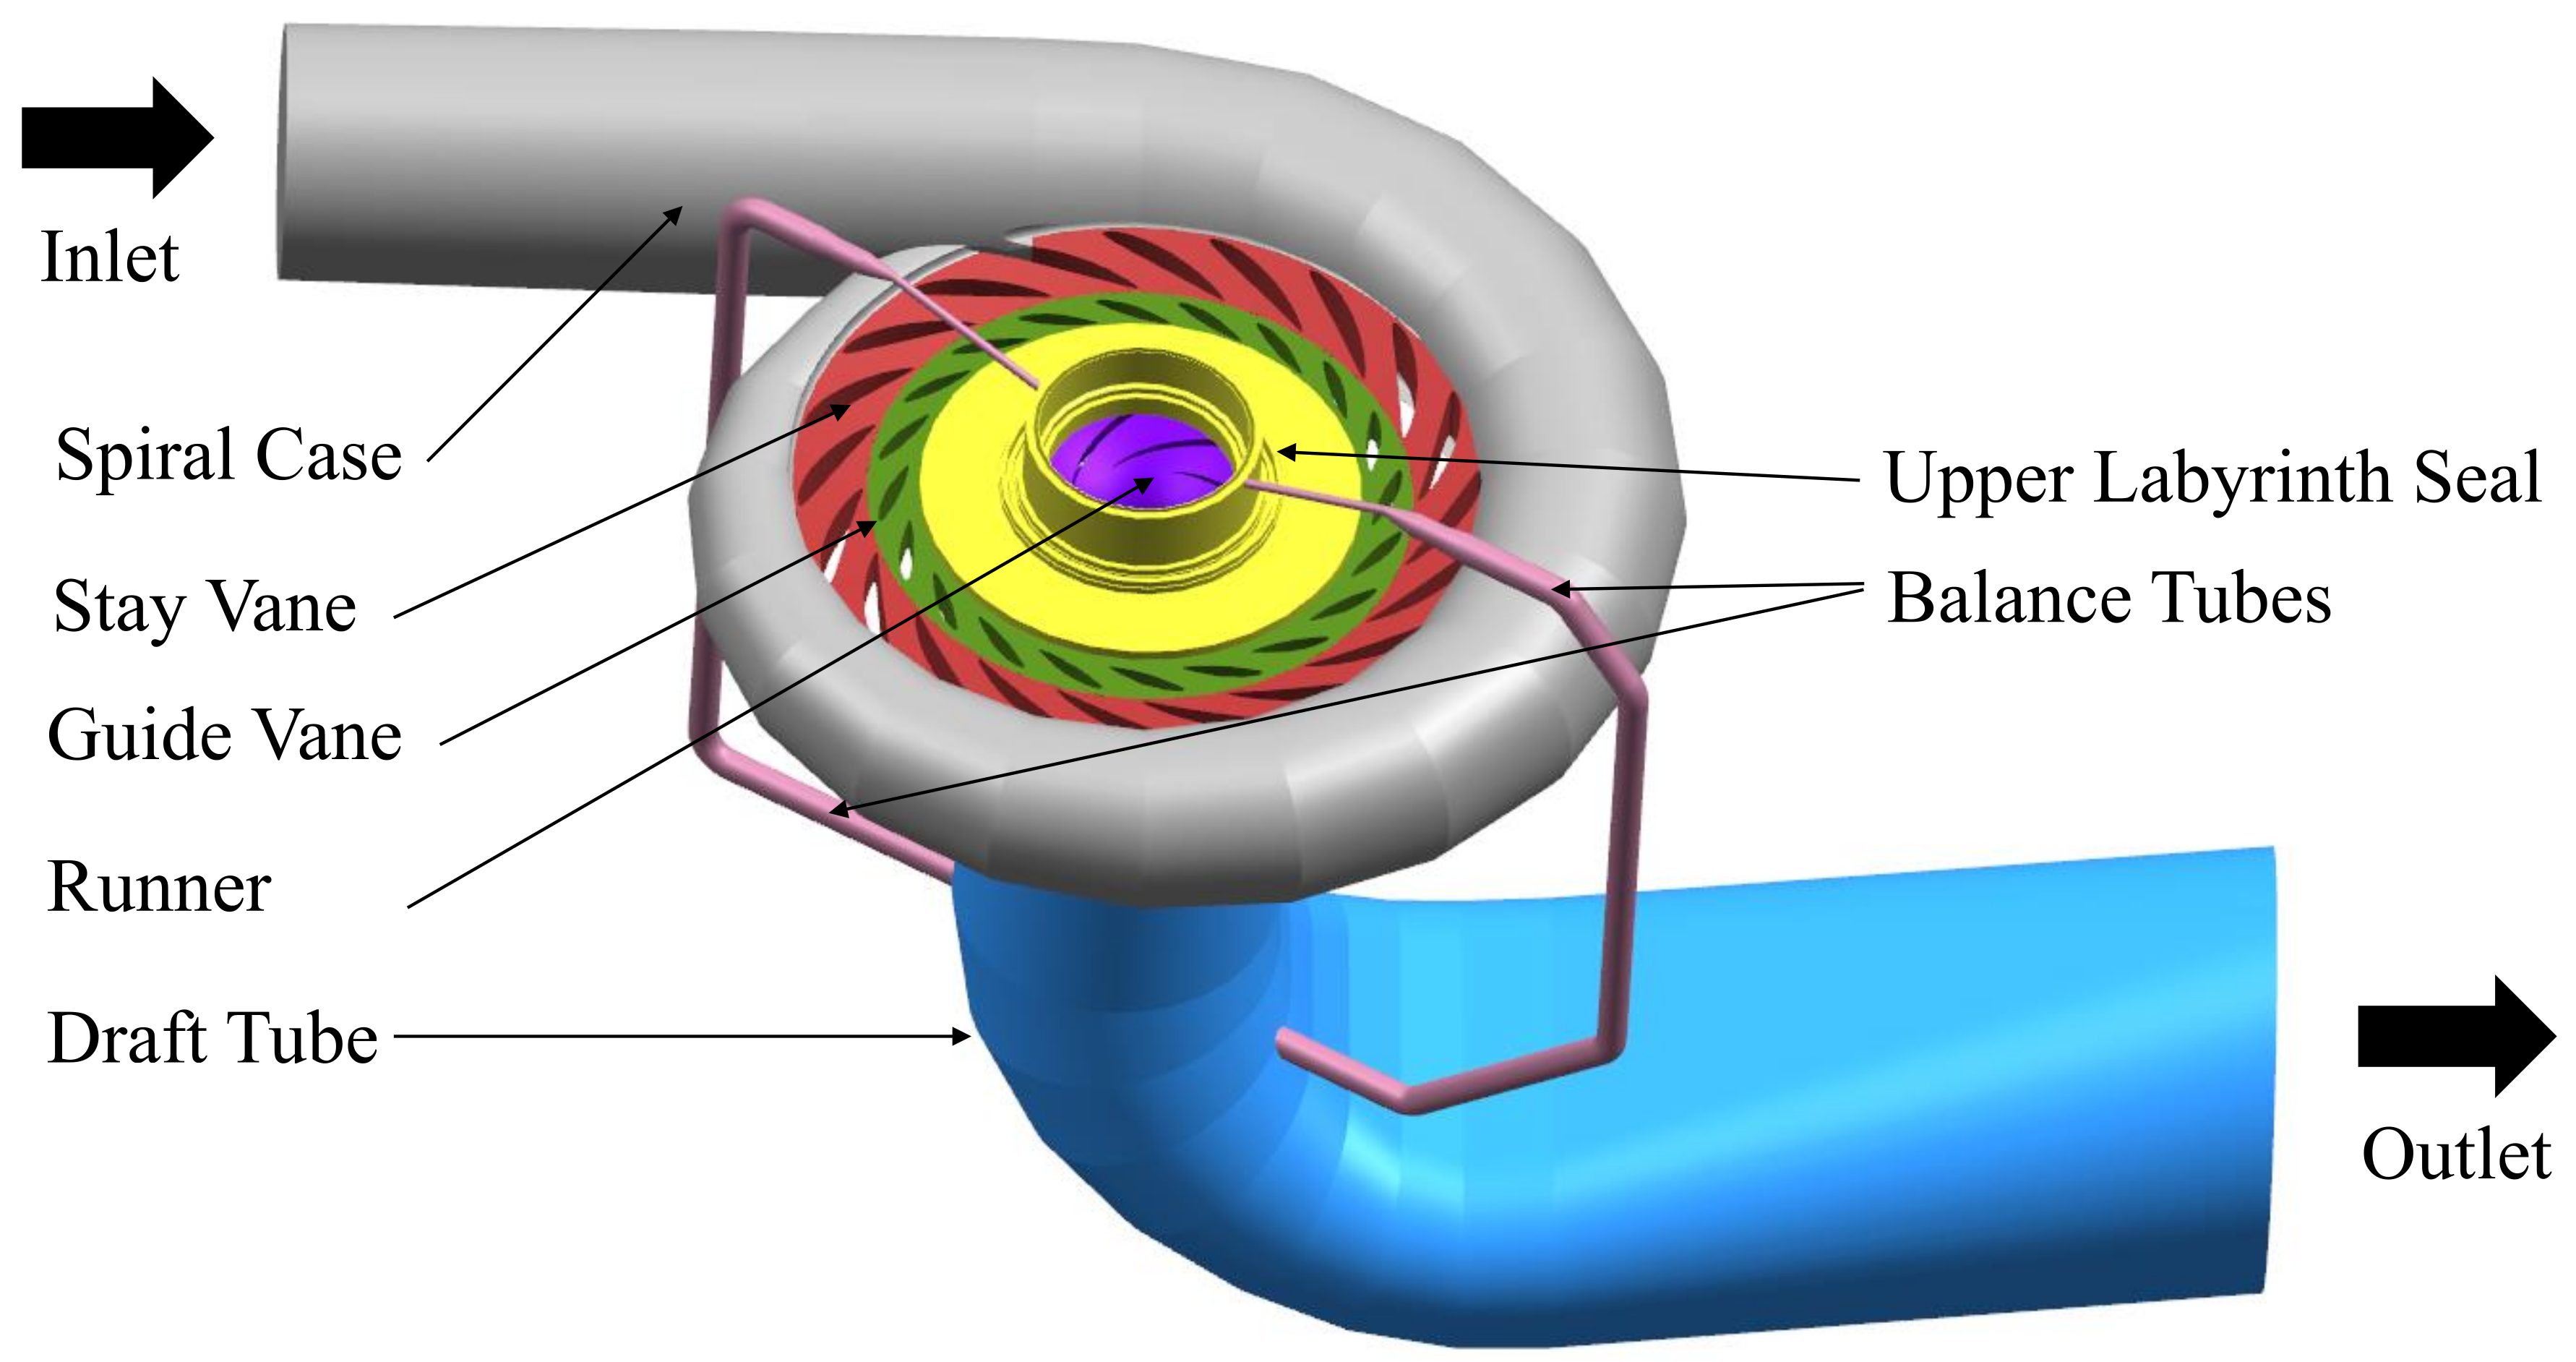
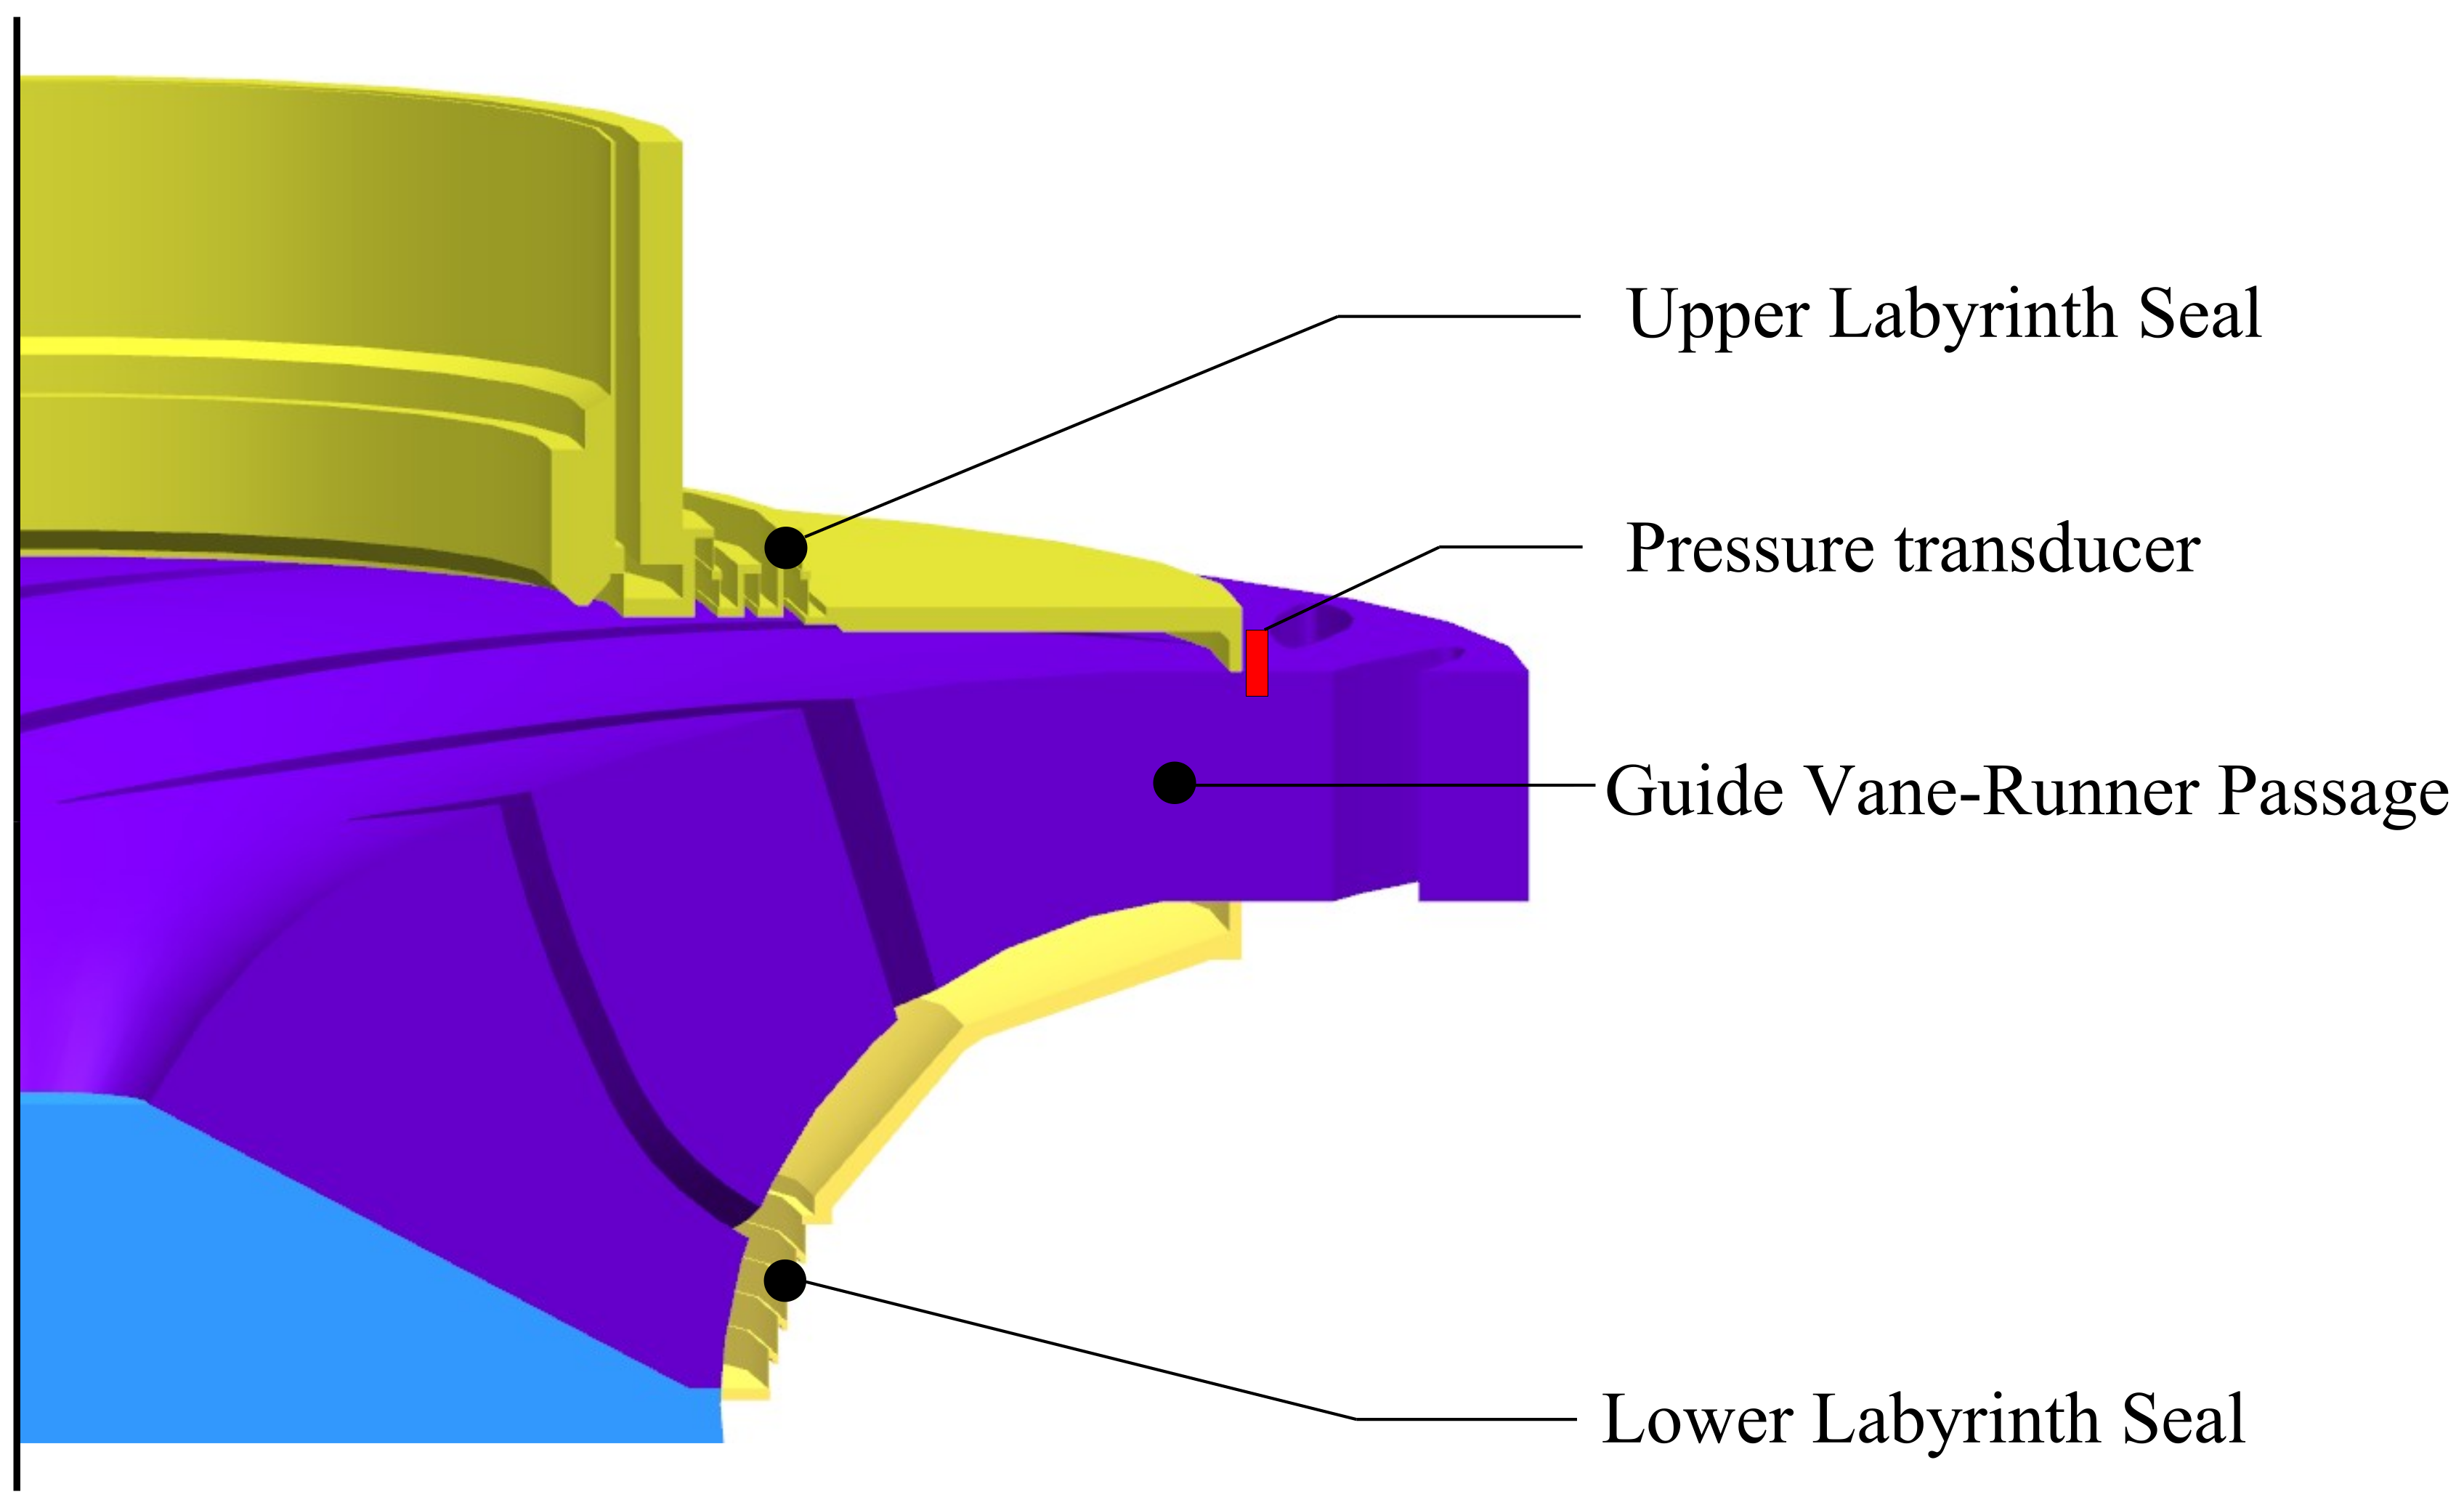
2. Field Measurement

The research object of this paper is a large prototype high-head PT unit (Figure 1), and the basic parameters of the unit are shown in Table 1.
To ensure its smooth operation and long-term safe and stable operation, the PT units utilise an online monitoring system with different types of sensors, such as displacement sensors on the shaft line, temperature sensors in the oil of shaft radial and thrust bearings, and pressure transducers in the flow channel. Figure 2 shows the location of a pressure transducer, which is installed in the vaneless space between the guide vane and runner blade, and the parameters of the pressure transducer are listed in Table 2.
The unit needs to adjust to partial load frequently according to the demand of the power grid. Therefore, pressure fluctuations in the vaneless space are measured under 60%, 86.7%, and 100% loads.
The field-measured results of pressure fluctuations in the vaneless space between the guide vane and runner blade at various load conditions are shown in Figure 3. The pressure in the vaneless space shows multiple peaks in the measurement, and the main peaks occur at f / f n = 7 , 14 , 21 .

3. Numerical Calculations

3.1. Numerical Method of Three-Dimensional Fluid Dynamics Calculation

The governing equations describing turbulent fluid flow are derived from the three fundamental laws of conservation of mass, conservation of momentum, and conservation of energy. In the flow problem of hydraulic machinery, we are primarily concerned with the conversion of mechanical energy, and the conservation equation of mechanical energy can be derived from the momentum equation. Therefore, the governing equations in this study only include the mass conservation equation and the momentum conservation equation:
ρ t + x i ρ u i = 0
t ( ρ u i ) + x j ( ρ u i u j ) = p x i + τ i j x j + ρ f i
where ρ and u i are the fluid density and fluid velocity component, respectively, p is pressure, τ i j is the surface force tensor, the indexes i and j represent the three-dimensional coordinate direction, and f i is the mass force source term.
The Reynolds-averaged Navier–Stokes (RANS) equations are used for indirect numerical simulation, and each value ϕ in the turbulence is decomposed into the sum of the mean value ϕ ¯ and the fluctuation value ϕ :
ϕ = ϕ ¯ + ϕ
The Navier–Stokes equation is averaged to obtain the turbulent average flow control equation:
x i ( u i ¯ ) = 0
t u i ¯ + x j u i ¯ u j ¯ = 1 ρ p ¯ x i + x j ν ( u i x j + u j x i ) u i u j ¯ x j + f i
where u i u j ¯ is the Reynolds stress.
RANS equations introduce a new unknown Reynolds stress. In order to close the equations, a variety of turbulence models were proposed to connect the Reynolds stress with the average turbulence. Common two-equation eddy viscosity models include k ε model, k ω model, RNG k ε model, SST k ω model, and more modified models. The standard k ε model has a poor prediction effect on near-wall flow, while the subsequent k ω model improves the simulation effect of near-wall flow, but leads to intensive sensitivity to free turbulence.
SST k ω model (shear stress transport k ω ) combines the advantages of the two models. The standard SST k ω model is used in the near-wall region and the standard k ε model is used in the free turbulence region. Due to its coupling characteristics, SST k ω model can well predict flow separation and has been widely used in academia and engineering. The description is as follows:
k t + x j ( u ¯ j k ) = x j ( ν + ν t σ k 2 ) k x j + P k β k ω
ω t + x j ( u ¯ j ω ) = x j ( ν + ν t σ ω 2 ) ω x j + 2 ( 1 F 1 ) 1 σ ω 2 ω k x j ω x j + α ω k P k β 2 ω 2
where the turbulent kinetic energy term is
P k = 2 ν t S i j u ¯ i x j
where S i j = ( u ¯ i / x j + u ¯ j / x i ) / 2 is strain rate.
Mixing function F 1 :
F 1 = tanh ( arg 1 4 )
arg 1 = min max k β ω y , 500 ν y 2 ω , 4 k ρ σ ω 2 C D k ω y 2
C D k ω = max 2 ρ 1 σ ω 2 ω k x j ω x j , 10 20
where y is the distance from the nearest wall. The eddy viscosity coefficient is defined as
ν t = a 1 k max ( a 1 ω , S F 2 )
F 2 = tanh ( arg 2 2 )
arg 2 = max 2 k β ω y , 500 ν y 2 ω
The other coefficients are a 1 = 0.31 , β = 0.09 , α 2 = 0.44 , β 2 = 0.0828 , σ k 2 = 1 , and σ ω 2 = 1 / 0.856 .

3.2. Mechanism Analysis of RSI Phenomenon

Potential flow interactions and wake interactions are the main causes of RSI. For the PT unit in turbine mode, the rotating runner generates a periodic hydraulic excitation in the vaneless space between the tailing edges of the guide vanes and the leading edges of the runner blades, and the outflow wakes of the guide vanes are also excited in the vaneless space by downstream cutting. The combination of the two reasons forms the RSI phenomenon in the PT unit. When the runner rotates, the area where the strong local excitation occurs will also rotate accordingly. Viewed from the stationary coordinates, the runner will generate a radial excitation. Tanaka [29] proposed an equation to describe the rotation mode of pressure fluctuations:
n N g v ± k = m N b
where N g v and N b are the guide vane number and the runner blade number, respectively, n and m are arbitrary integers (n, m = 1, 2, 3 …), and k is the nodal diameter number of the rotation mode of pressure fluctuations. The energy intensity of each mode decreases with the increase of k, so the lower the nodal diameter number of k, the more intensive the pressure fluctuation is.
The angular speed at which the pressure fluctuation mode is
ω k = m N b ω k
where ω is the angular speed of the runner ( ω = 2 π f n ). A positive value of k indicates that the rotating direction of the pressure fluctuation mode is the same as that of the runner.
Observed in the stationary coordinate system, the frequency f s and the rotational speed n m s of the pressure fluctuation can be described as
f s = m N b f n
n m s = ± m N b f n k
Observed in the rotating coordinate system, the frequency f r and the rotational speed n m r of the pressure fluctuation can be expressed as
f r = n N g v f n
n m r = ± n N g v f n k

4. Fluid Numerical Calculations

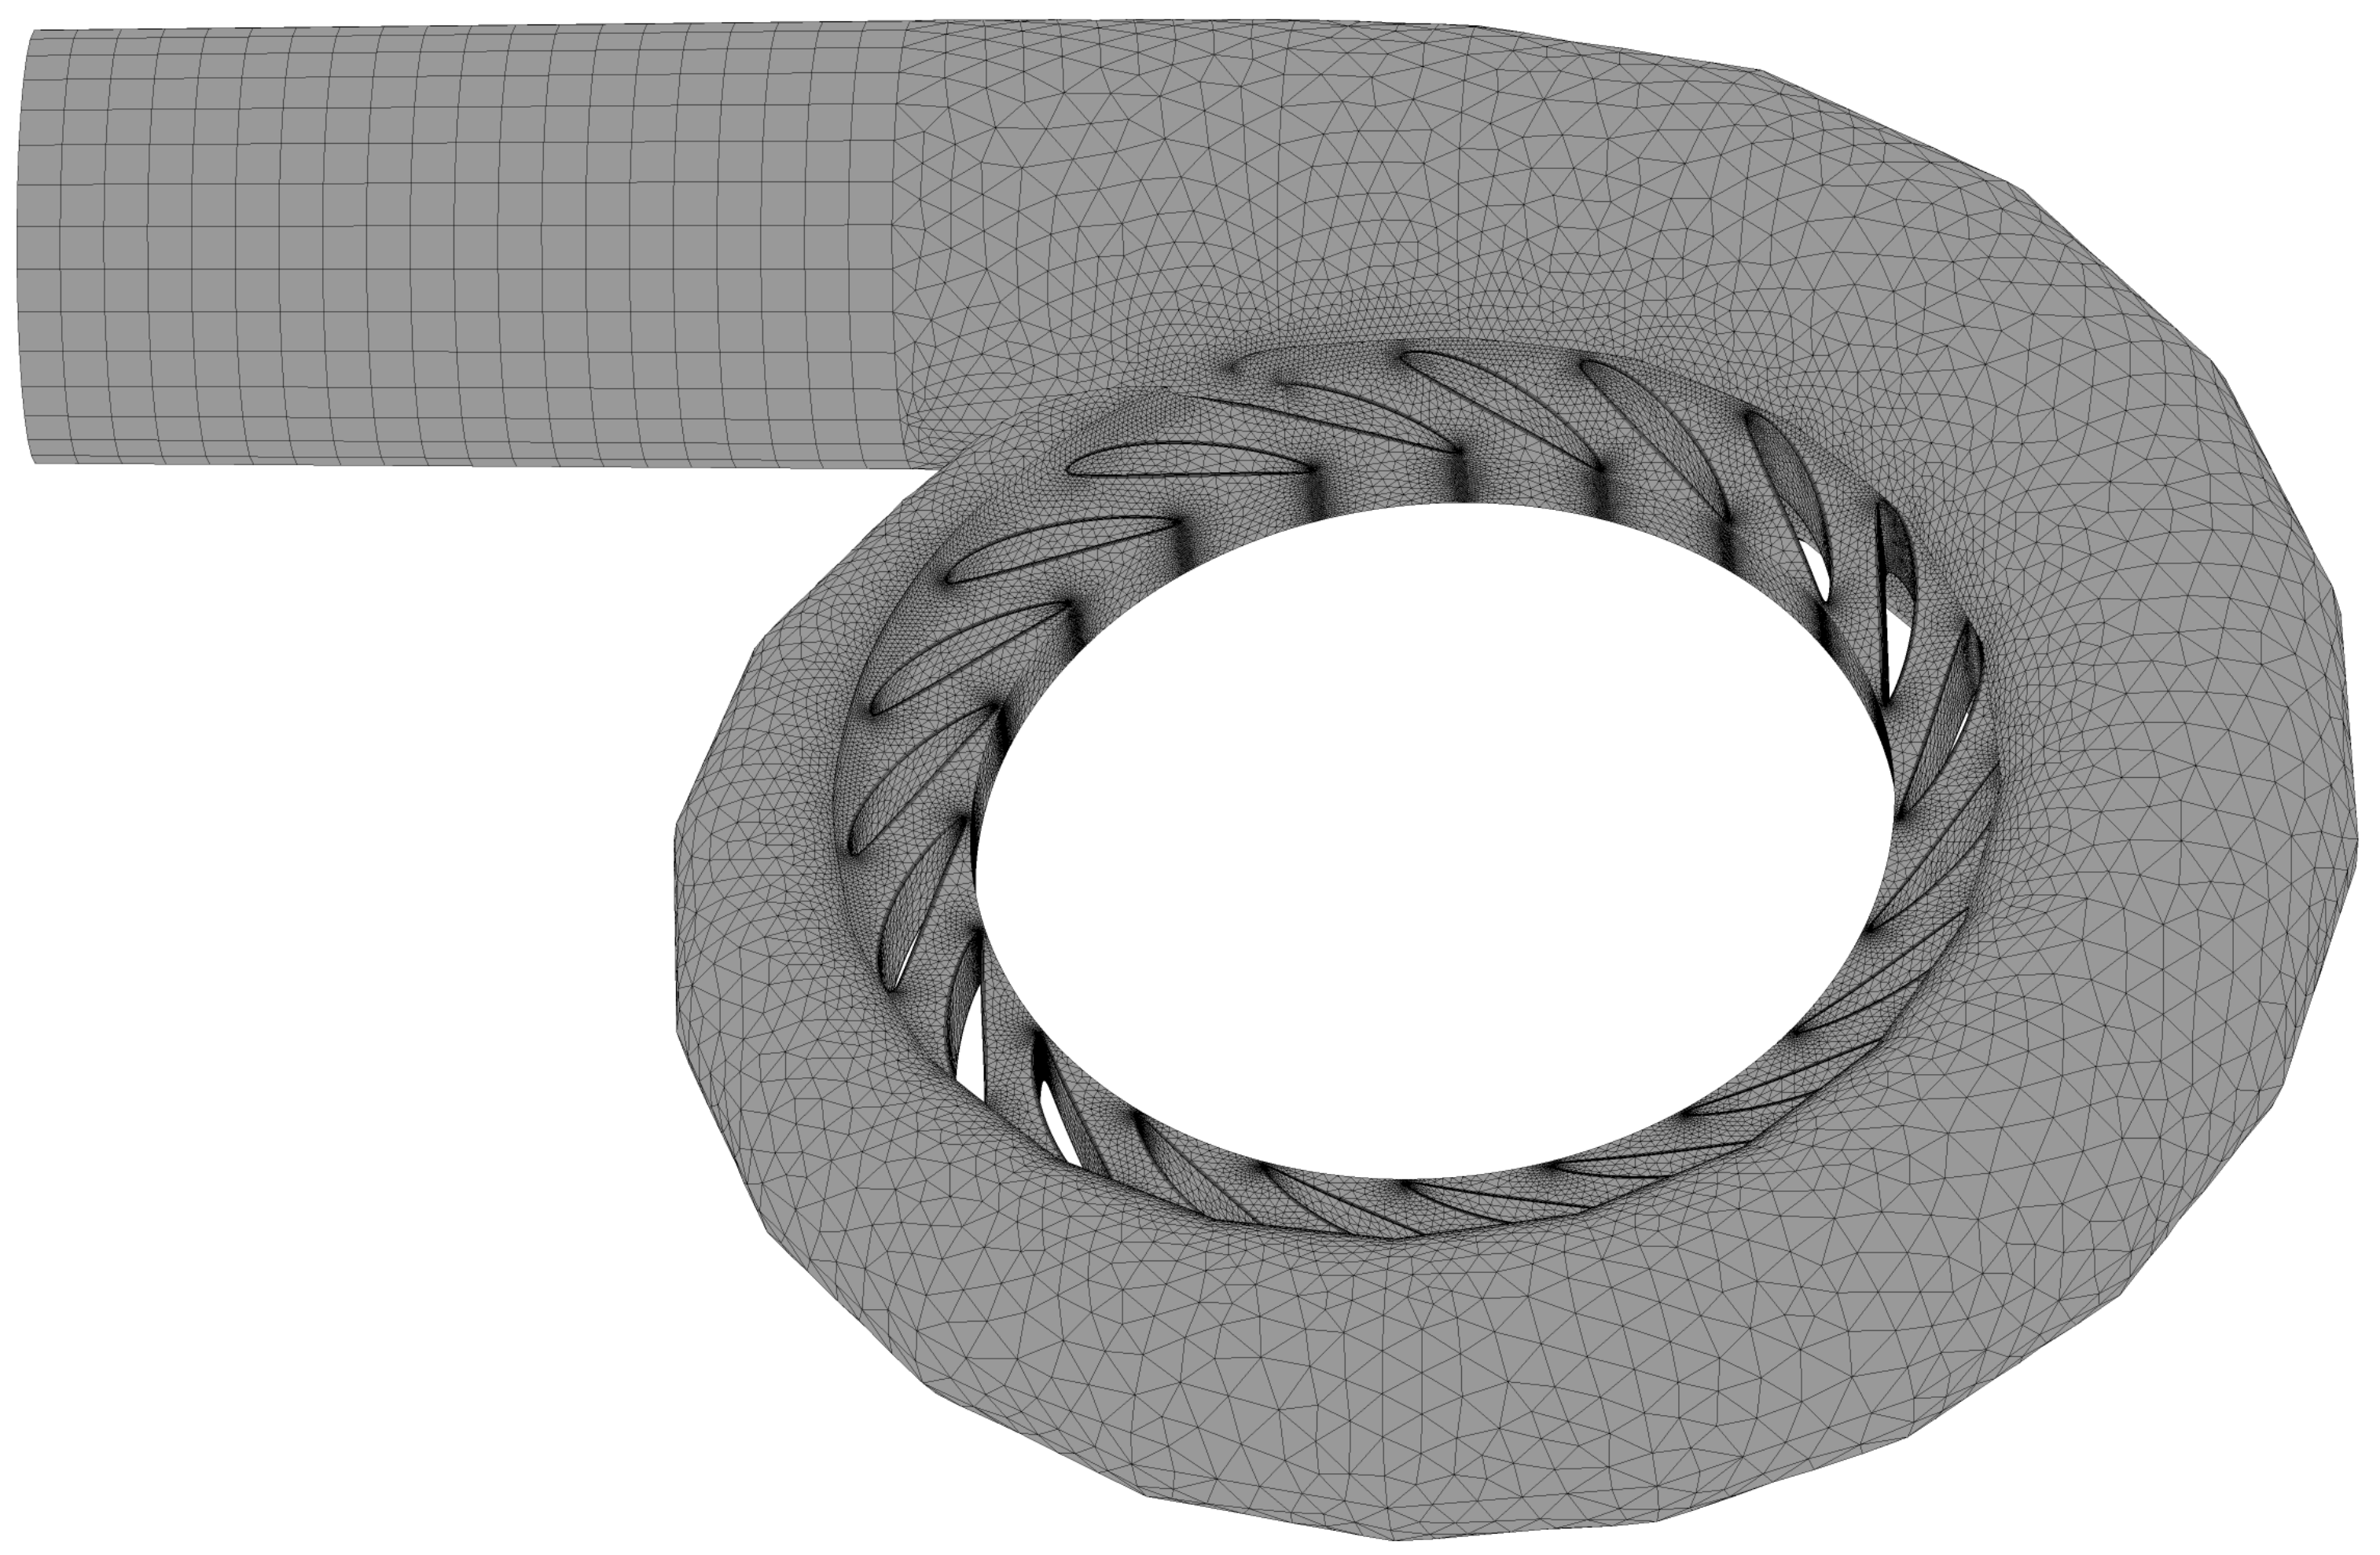
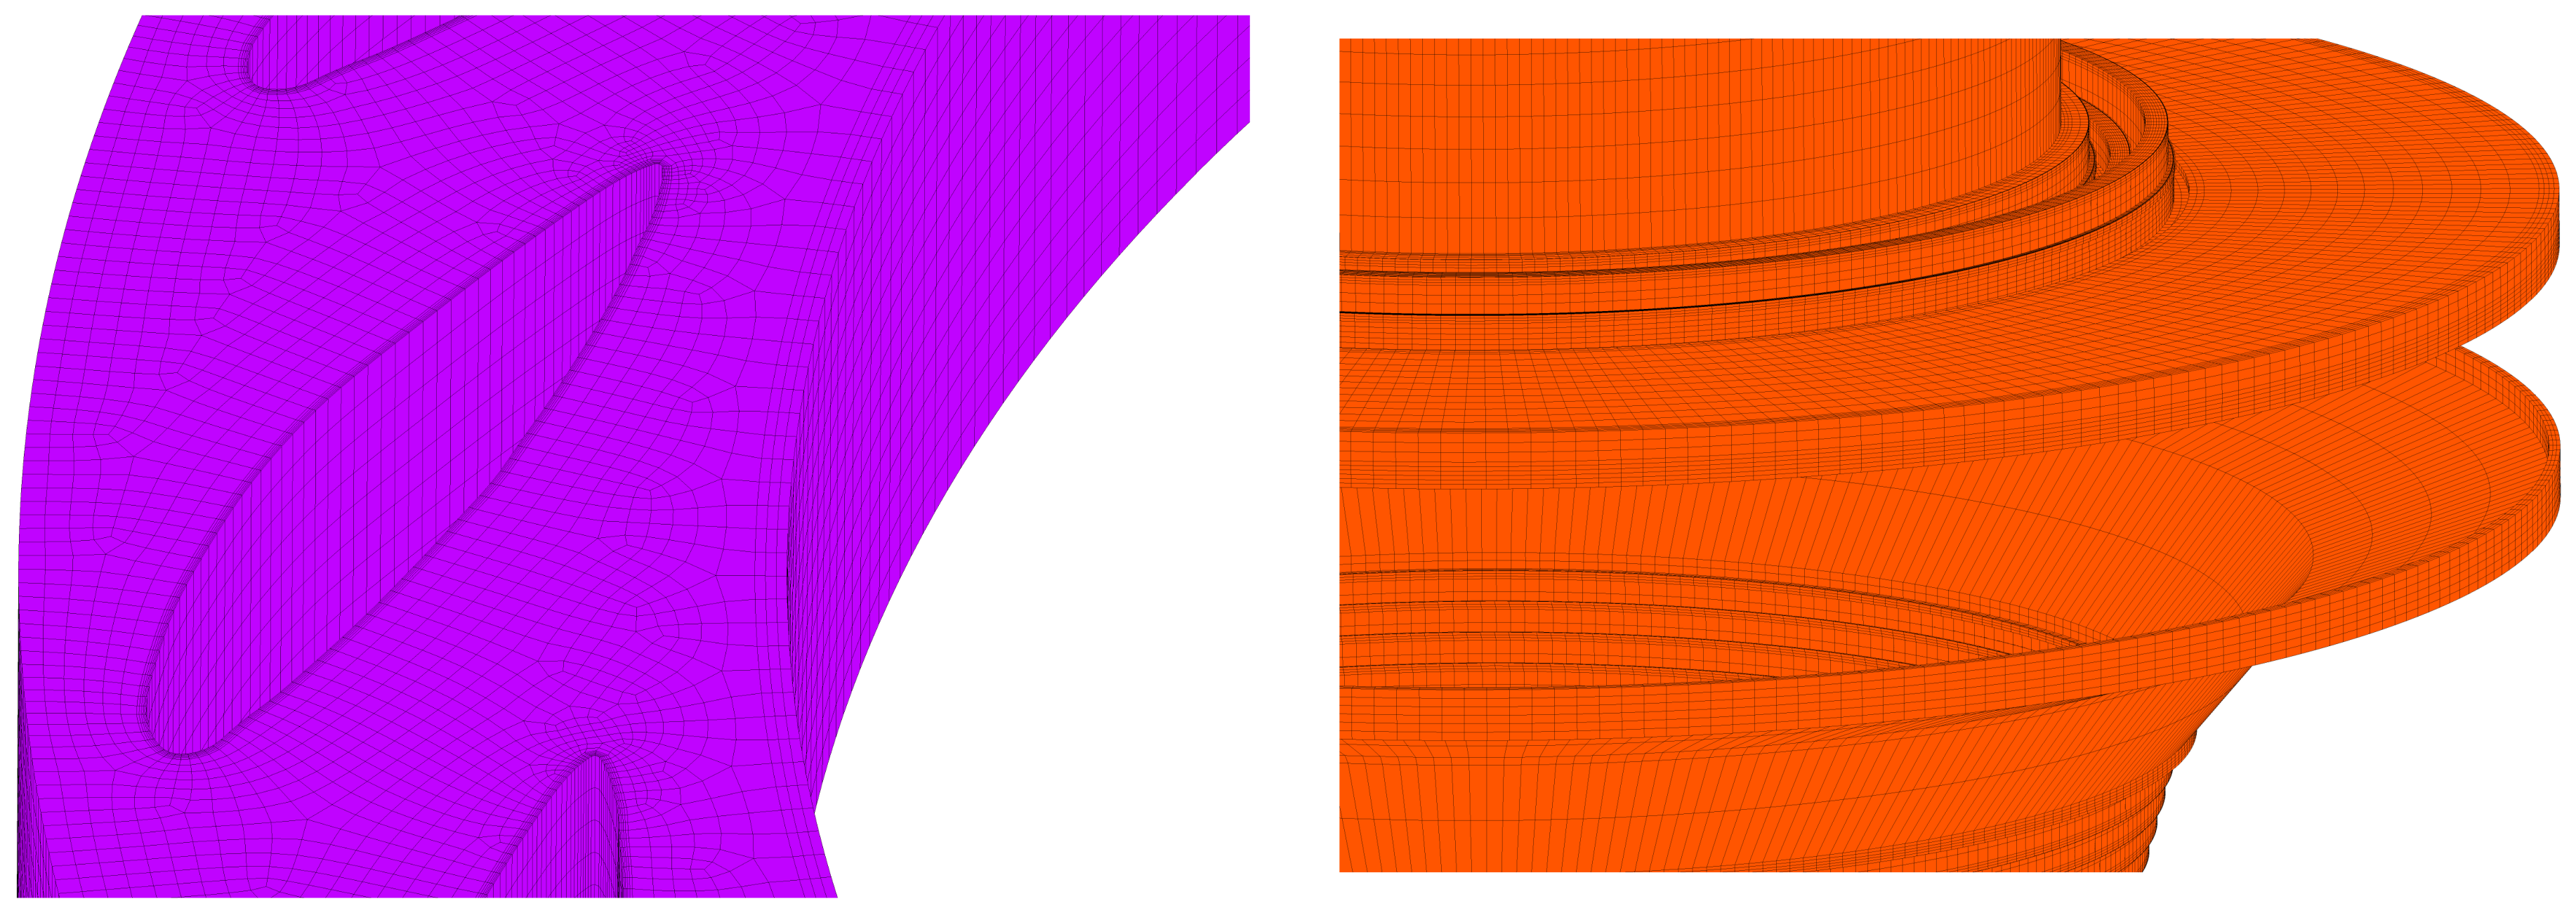
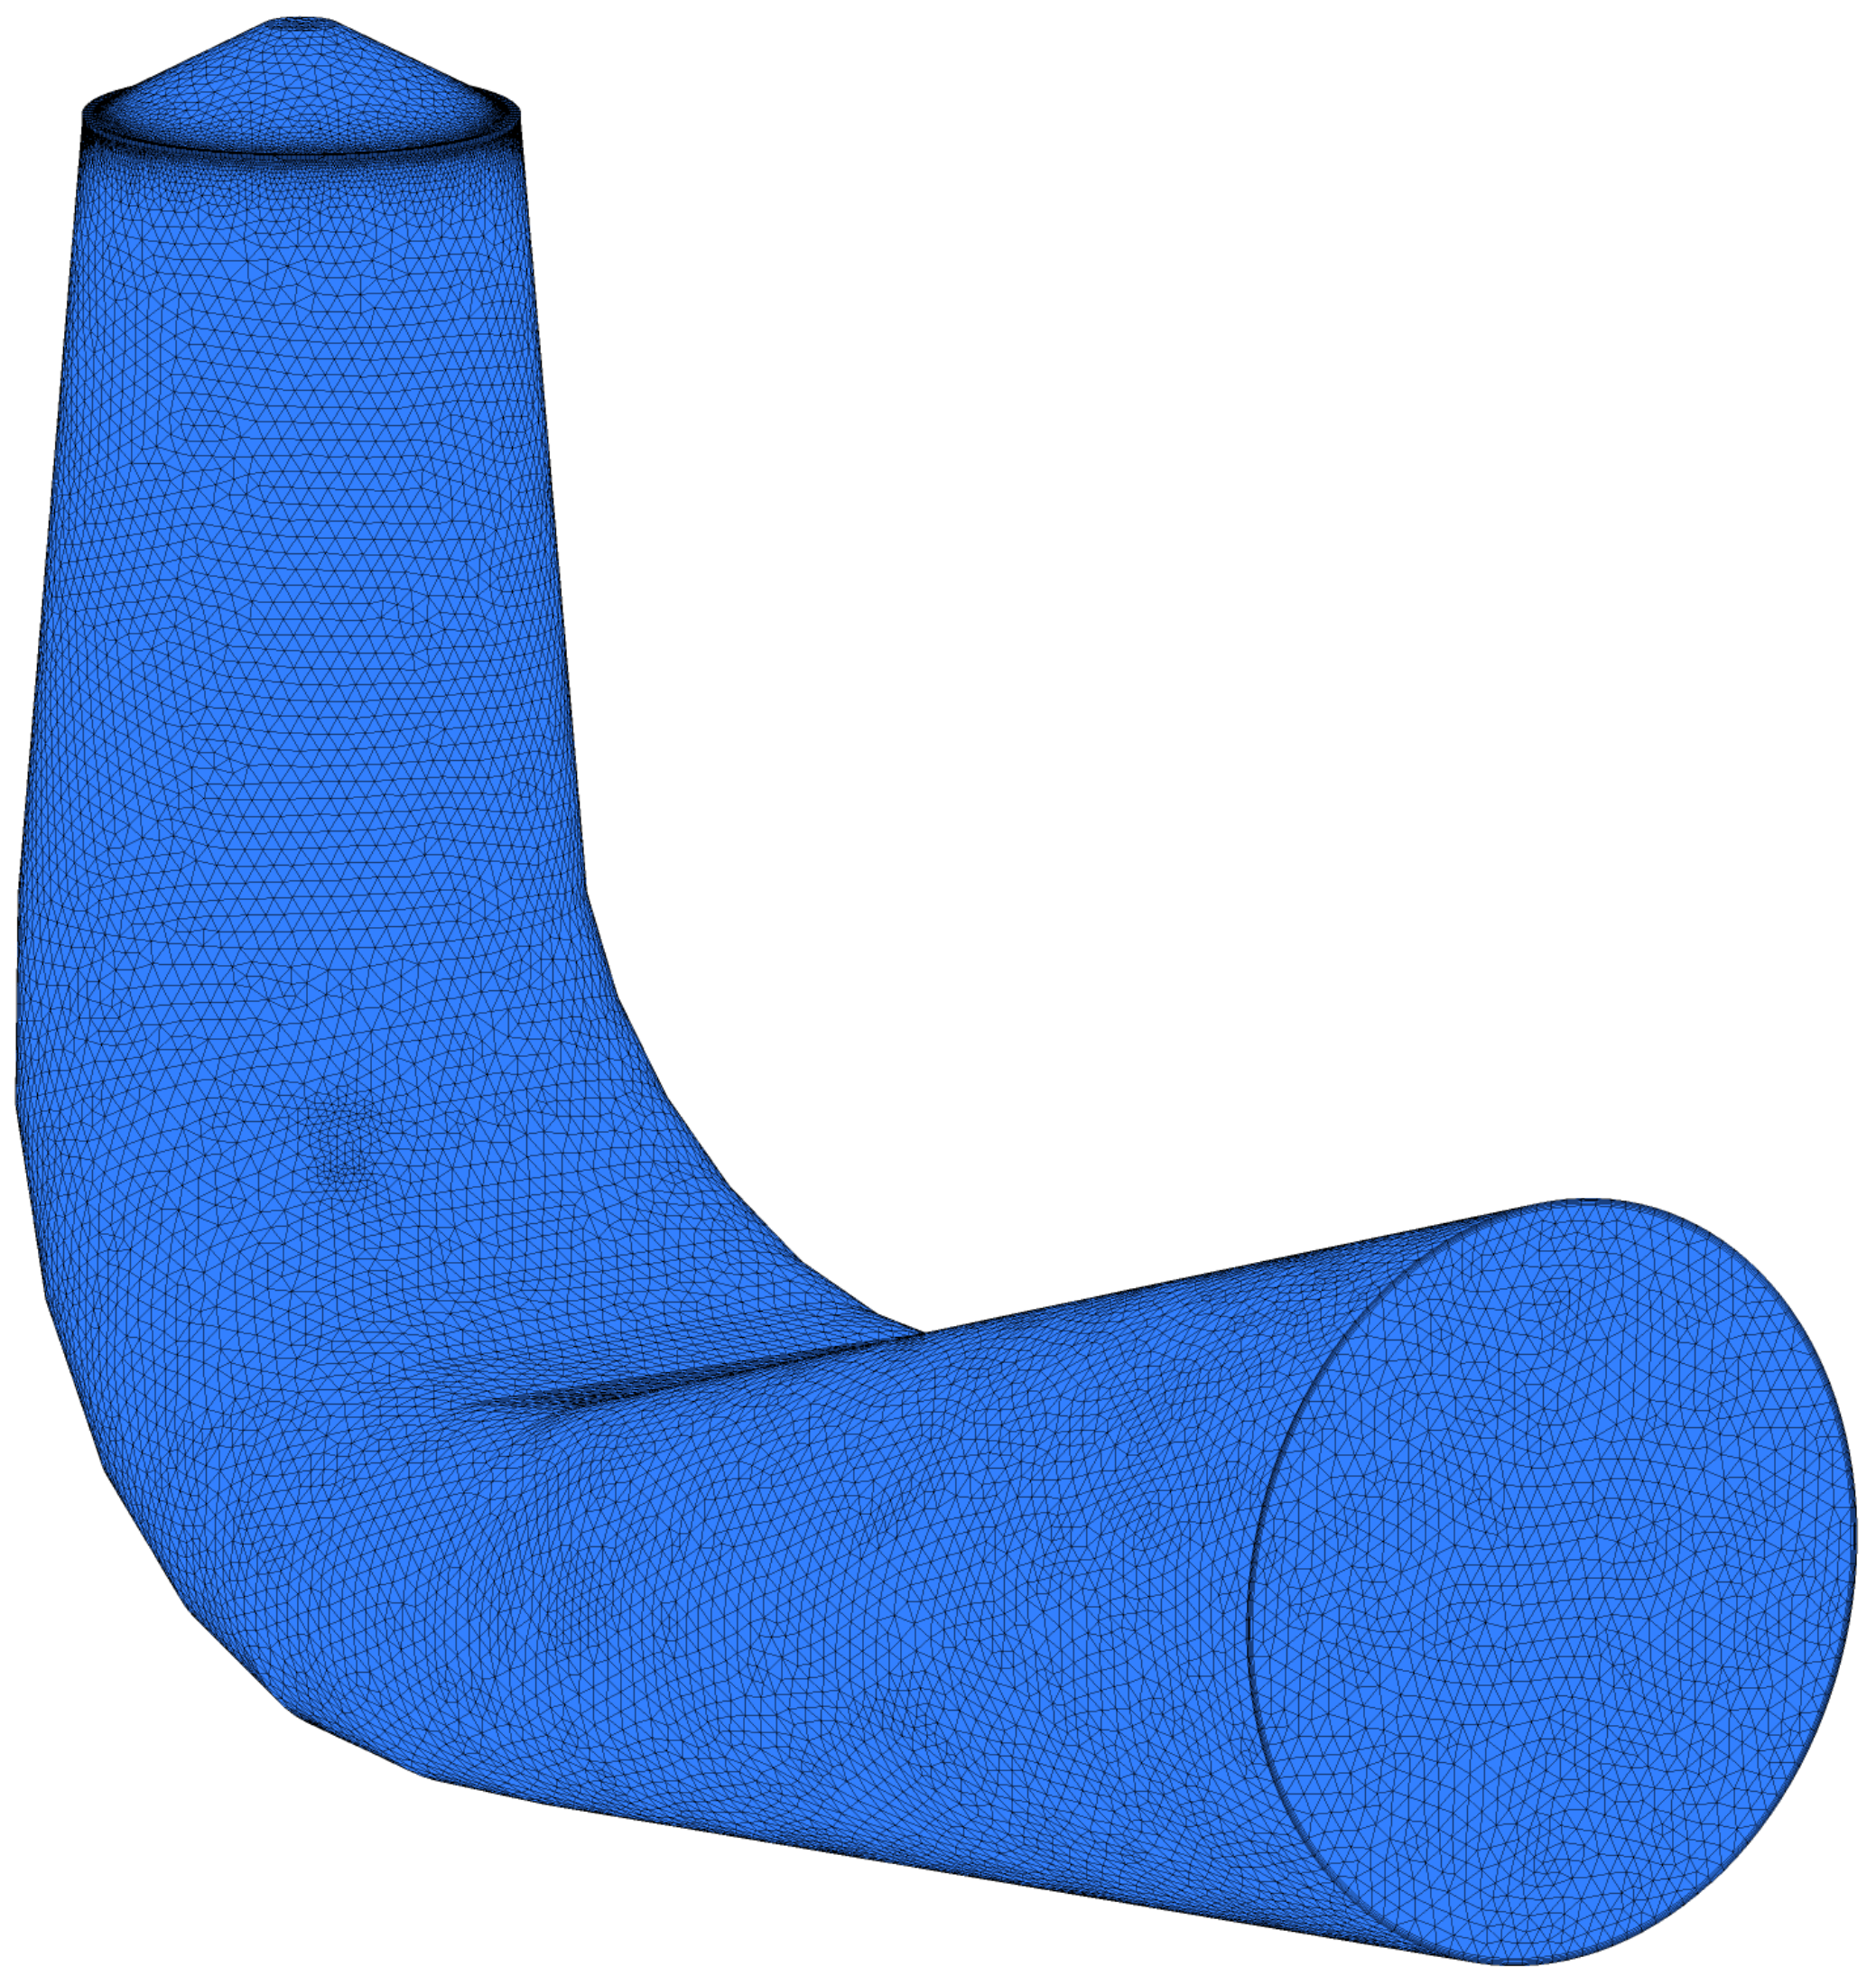
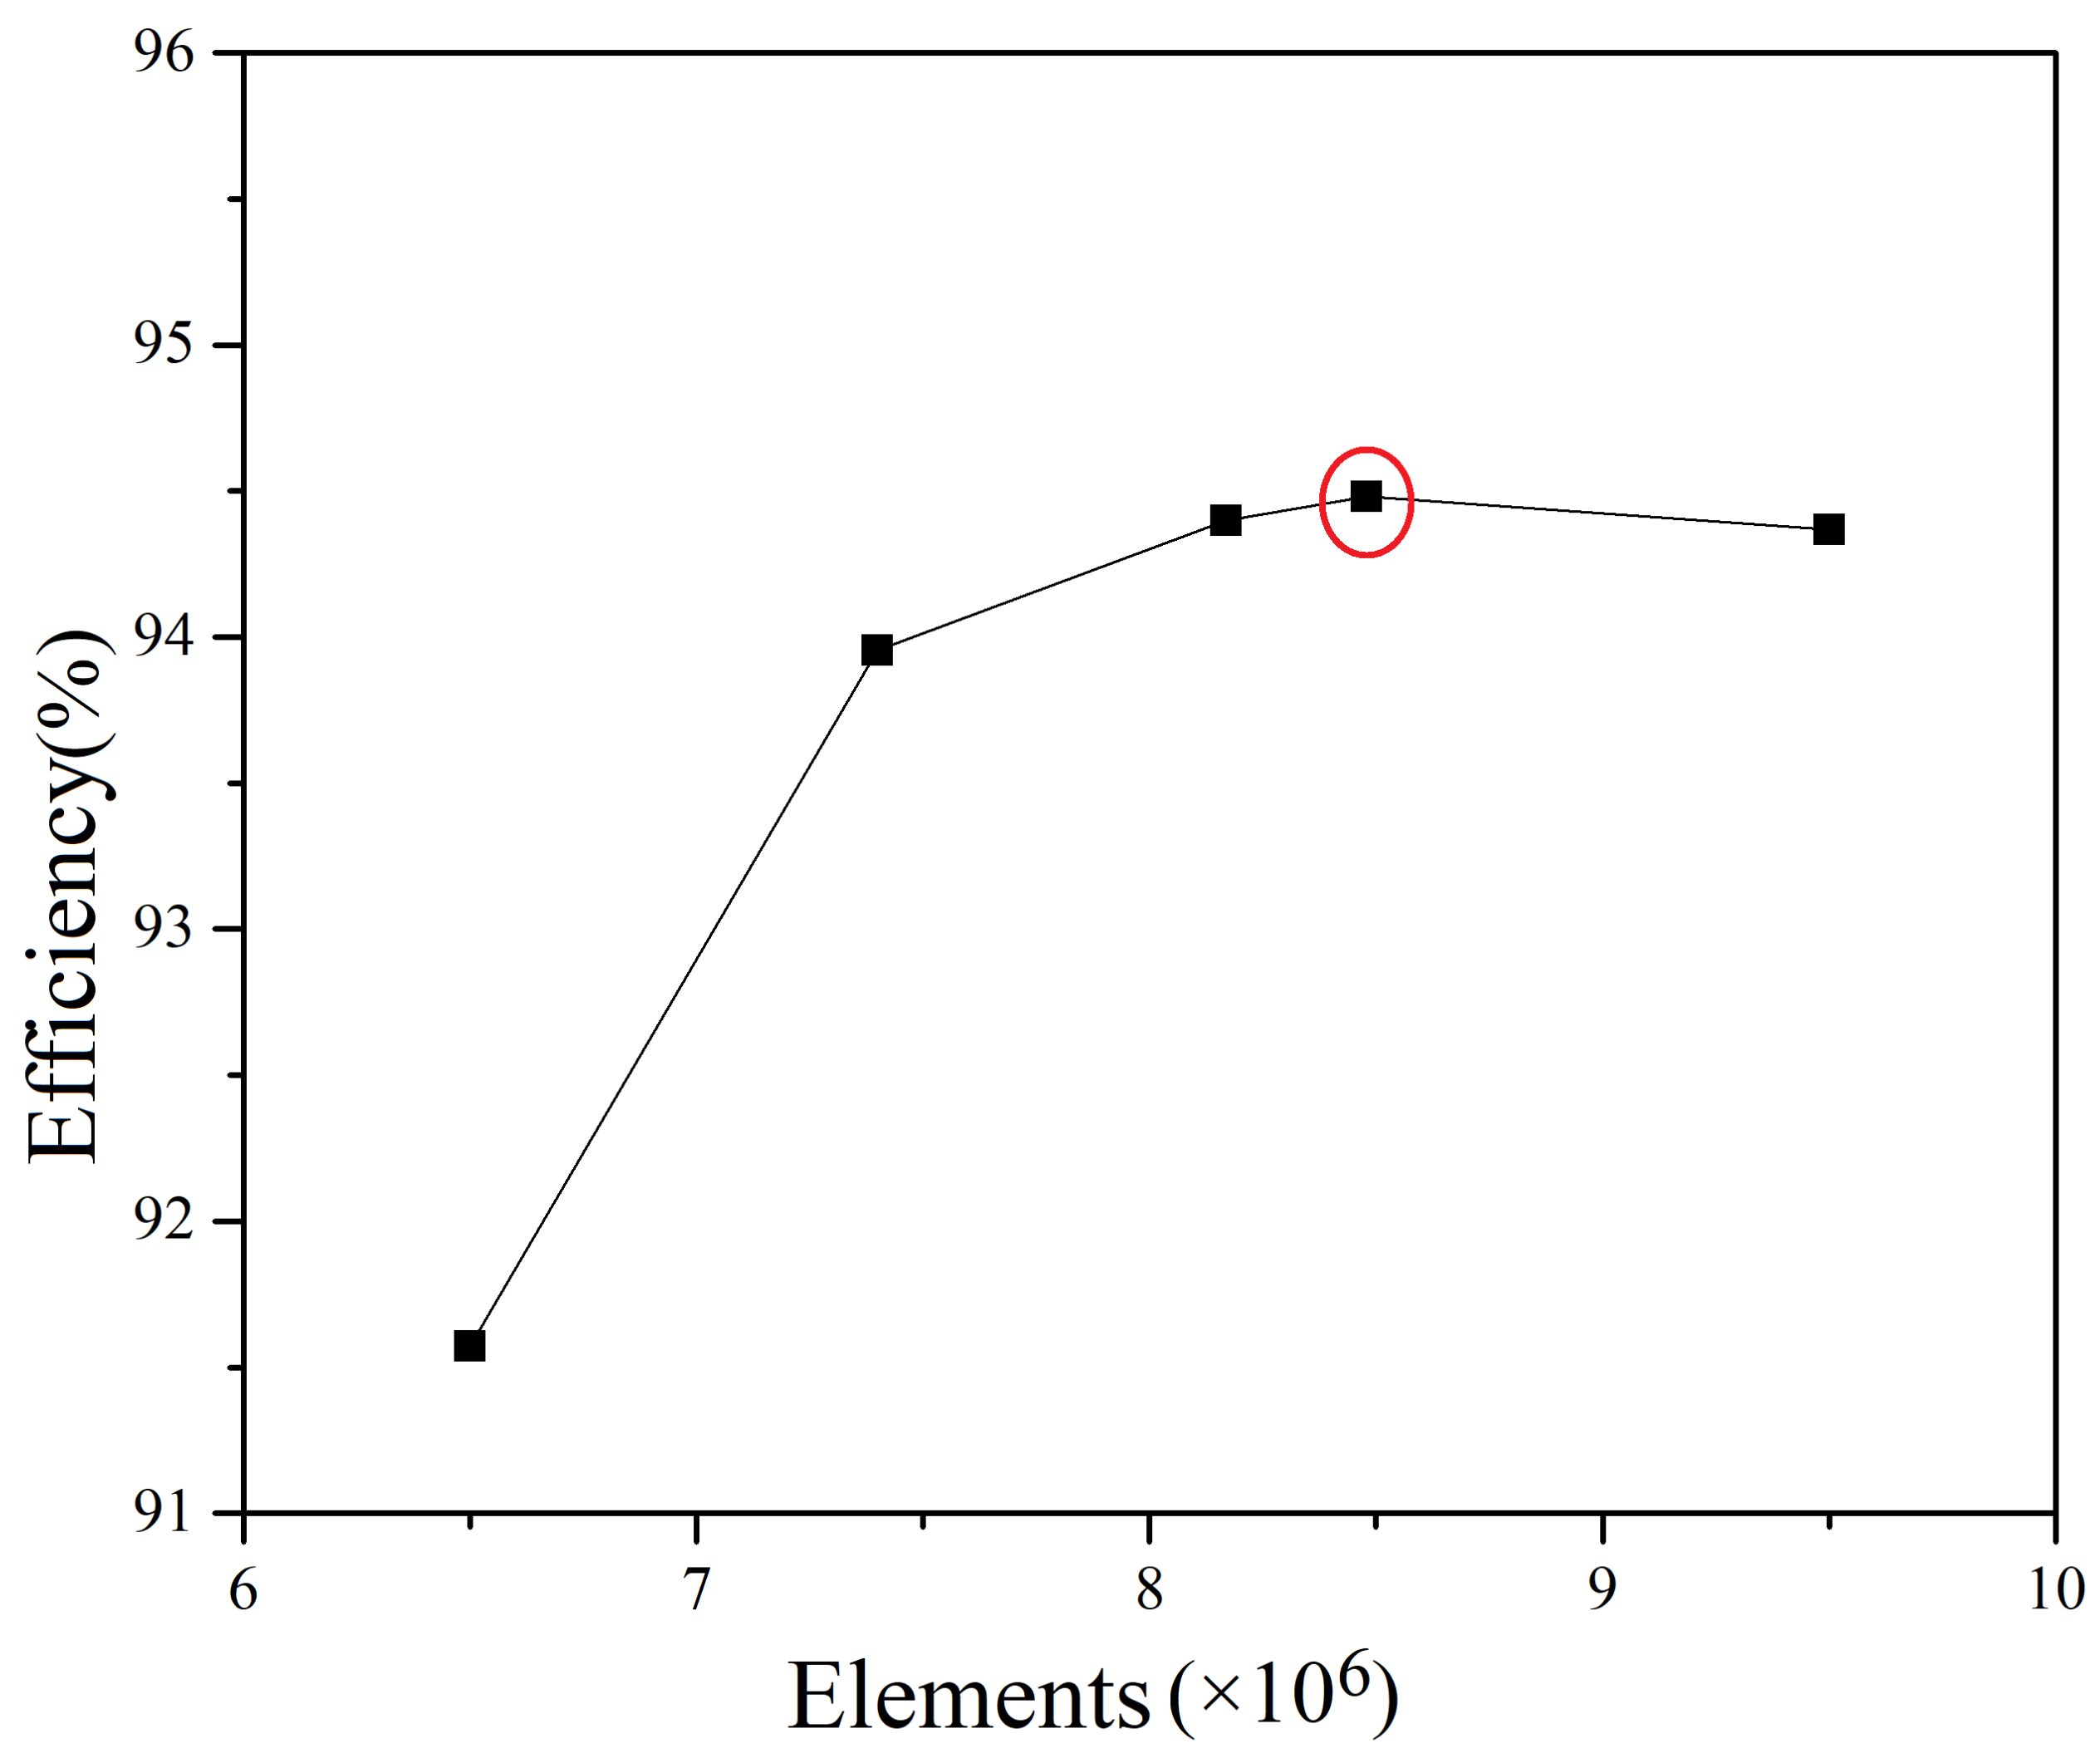
4.1. Models, Meshes, and Calculation Settings

The fluid domain models of the unit used for fluid dynamics calculations include spiral case, stay vanes, guide vanes, runner, and draft tube, as well as upper and lower labyrinth seals and balance pipes, as shown in Figure 1 and Figure 2. A hybrid mesh of the fluid model with tetrahedral and hexahedral elements is created by ANSYS MESH to achieve a balance between computational cost and computational accuracy for complex models (Figure 4, Figure 5, Figure 6 and Figure 7). The meshes of the boundary layers near the walls of runner blades, guide vanes, stay vanes, spiral case, and draft tube are refined with at least three layers of meshes to ensure the accuracy of the calculation. The wall function is used to solve the flow in the boundary layer, and the dimensionless parameter Y+ values of the first mesh layer close to the walls of the fluid domains are in the range of 5 to 100. The analysed load conditions are 60%, 86.7%, and 100% of full load.
ANSYS CFX is used to perform transient fluid dynamics calculations. To ensure the convergence of the calculations, the total analysis time is set to 0.6 s, covering five rotational revolutions of the runner, and each time-step is set to 0.006 s. The runner domain is set as a rotating domain with the rotational speed of 500 rpm, and other fluid domains are set as stationary domains. The interfaces between guide vane domain and runner domain, runner domain, and draft tube domain are set to transient rotor–stator interface. The solver is set to high resolution and the residuals are set to 10 4 .
Five sets of meshes are constructed to verify the mesh independence. The mesh sizes of the fluid domains of runner, spiral case, stay vanes, guide vanes, and draft tube are adjusted with different values. The steady-state calculations of 100% load condition are chosen to carry out the mesh independence analysis. The efficiency between the spiral case inlet and draft tube outlet is selected to compare the calculations (Figure 8). The fourth set of meshes with around 8.5 million elements (marked with the red circle in Figure 8) was adopted to perform the detailed analysis of the PT unit.
Under the rated head, the guide vane opening increases with the power load of the unit. The efficiencies between the spiral case inlet and draft tube outlet at 60%, 86.7%, and 100% of full load are measured and calculated. As shown in Figure 9, the comparison shows that the calculation results at three different guide vane openings corresponding to three load cases have a rather good agreement with the measured ones, which confirms that the numerical calculation results are reliable.

4.2. Velocity and Pressure Distributions at Vaneless Space

Figure 10 shows the velocity and pressure distributions in the middle section view from the stay vanes to the runner under different loads in turbine mode.
The pressure coefficient C p is defined as
C p = p ρ g H r 100 %
where p is pressure, ρ is fluid density, g is gravitational acceleration, and H r is rated head of the PT unit.
The runner blades with the high rotating speed of 500 rpm interfere with the relatively slow flow from the guide vane passage in the vaneless space. The runner blades generate a high-pressure area at the runner inlet and the high-pressure waves propagate upstream so that the vaneless space is subjected to a periodic excitation. The wake of the guide vane flows to the rotating region through the vaneless space, where the flow rate increases sharply and the wake cutting generates a hydraulic excitation located in the vaneless space, which propagates upstream and downstream at the same time. The pressure fluctuation frequencies induced by RSI are related to the number of runner blades and the runner rotational frequency.
When the leading edge of a runner blade passes by the trailing edge of a guide vane, the fluctuating pressure in the vaneless space increases due to the local decrease in flow rate and reaches the peak value. When the runner blade leaves the trailing edge of the guide vane, the main pressure fluctuation interference is caused by the wake of the guide vane and the inflow of the runner. The local extreme value of the pressure fluctuation occurs and reaches the minimum value at the moment when the influence of the runner blade is minimal.

4.3. RSI-Induced Pressure Fluctuations Analysis

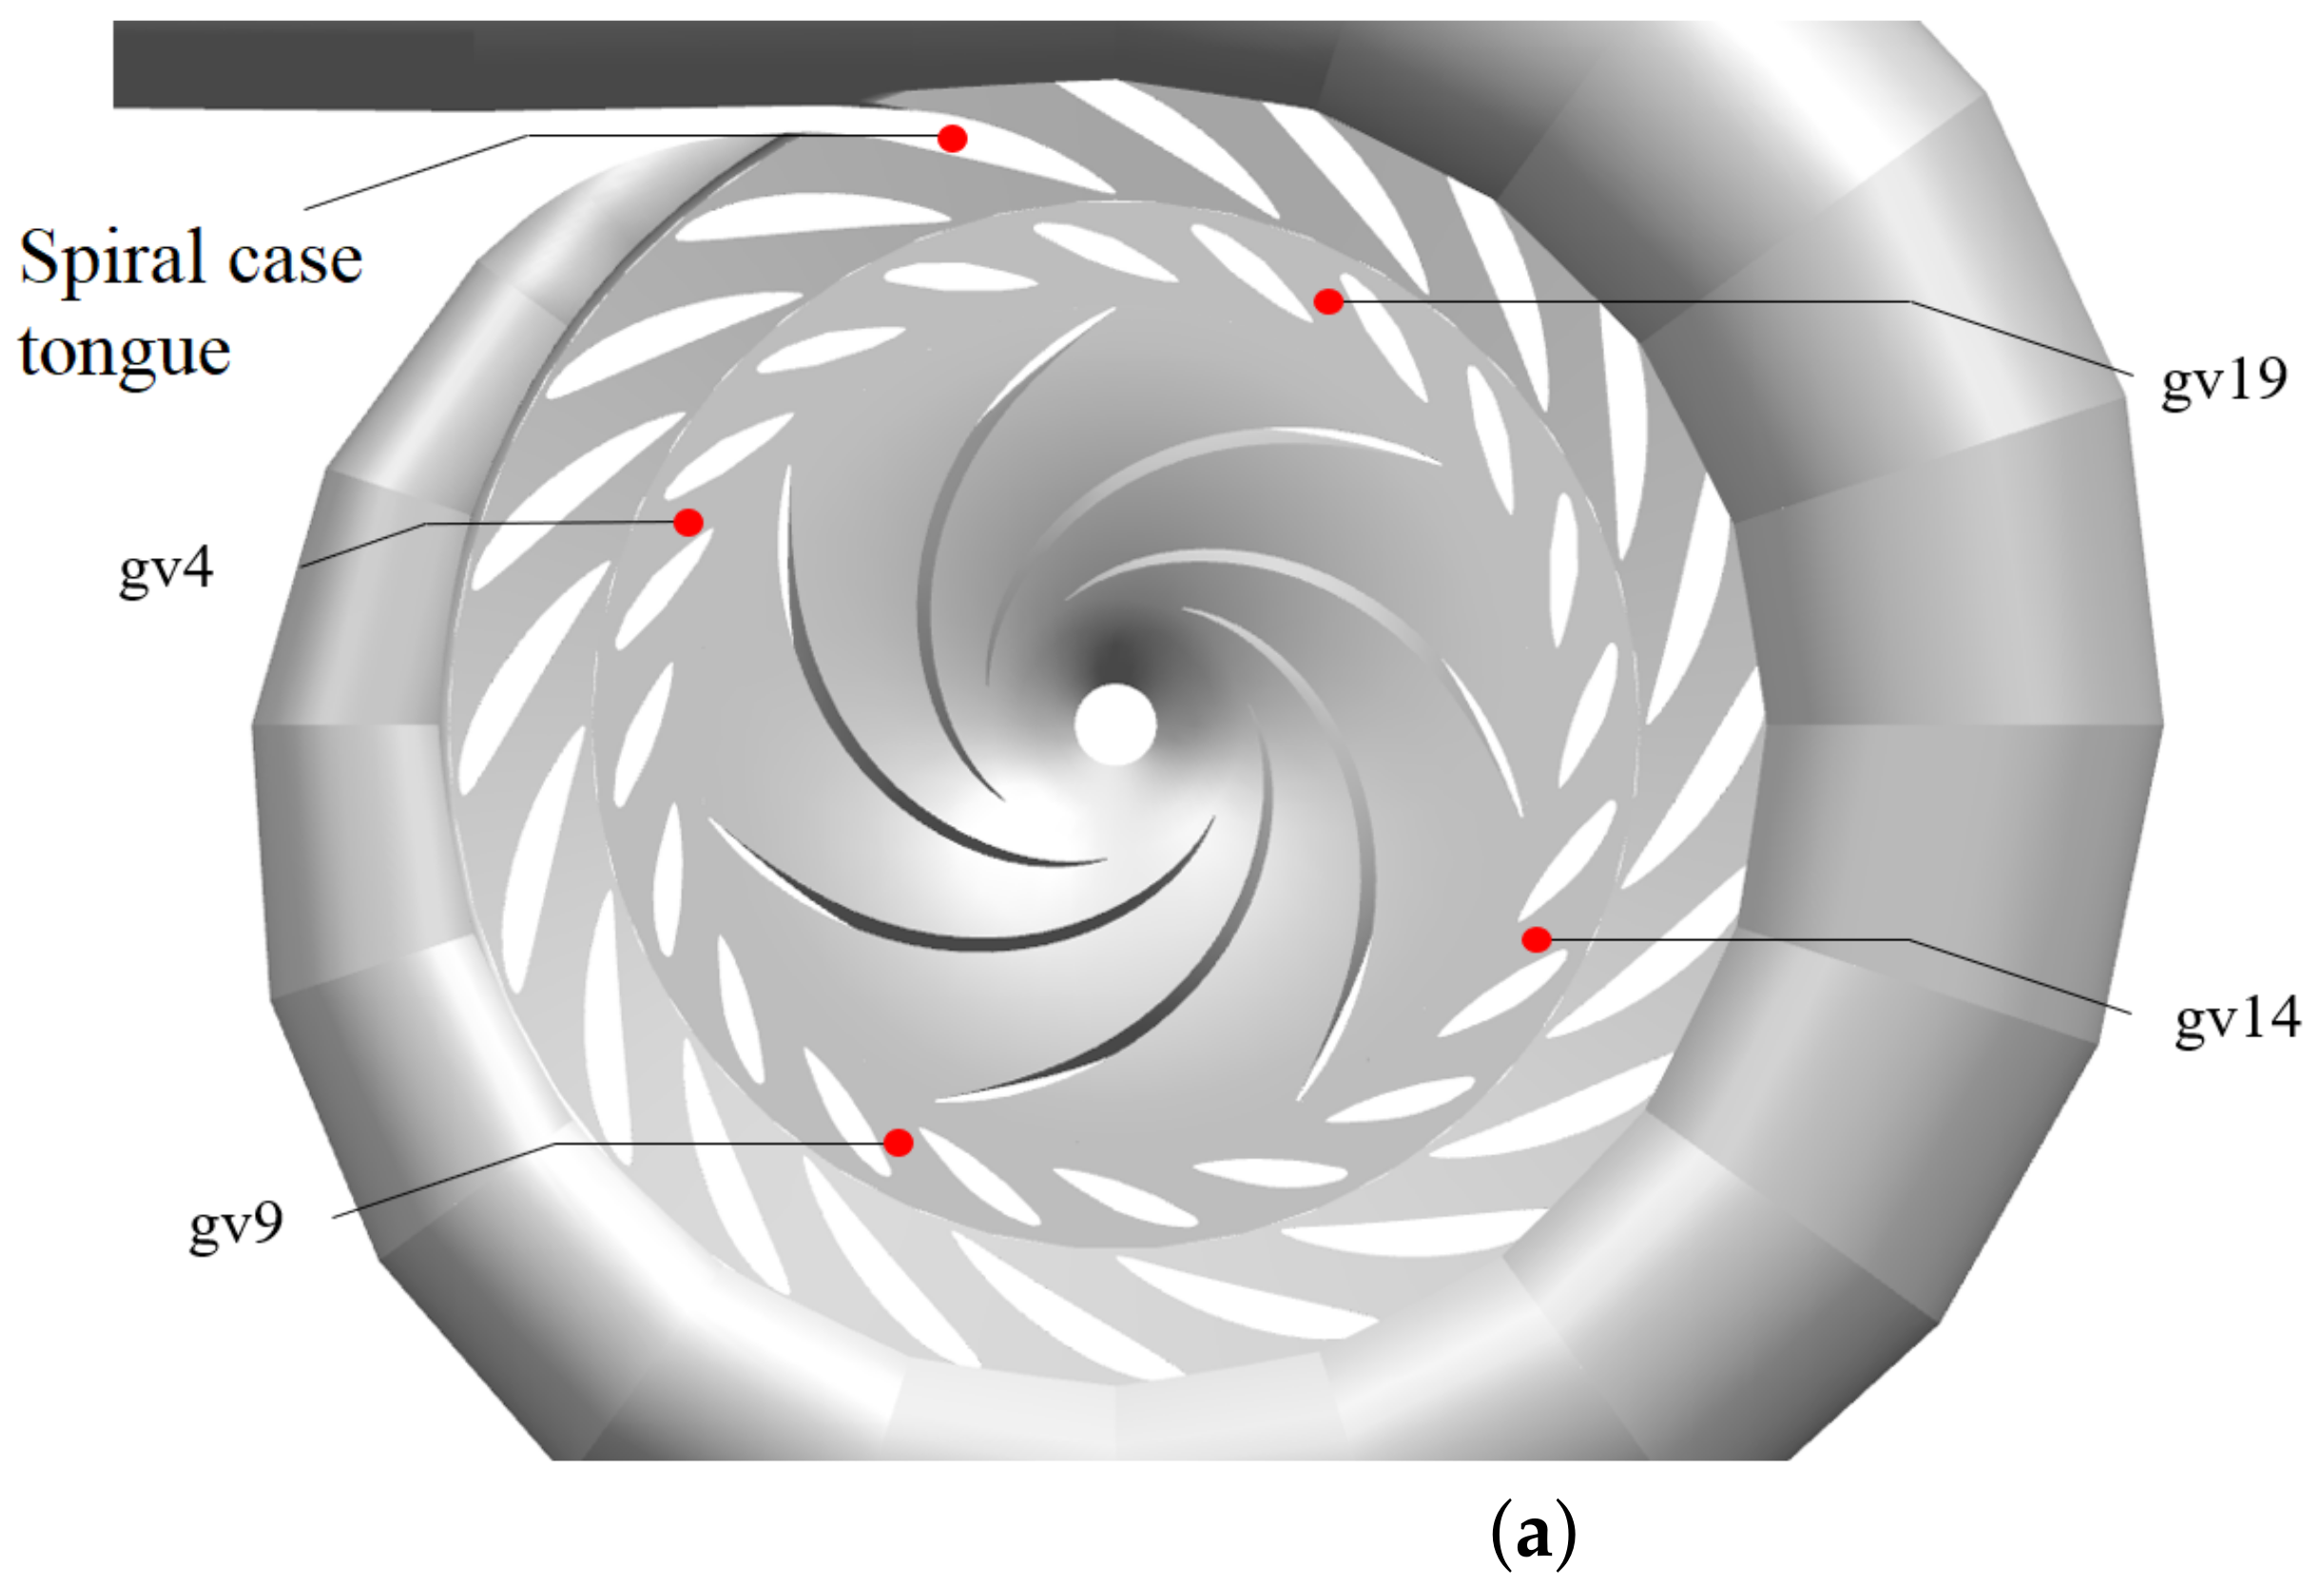
4.3.1. Layout of Pressure Monitoring Points for Numerical Calculations

Adequate monitoring points are arranged in the vaneless spaces in the CFD analyses, including three layout methods, i.e., along the passage of guide vanes, along different vertical heights, and along the circumference of different guide vanes. A total of 20 groups of monitoring points are arranged along the circumferential flow paths of guide vanes, named from gv1 to gv20. The group of points, gv9, far from spiral case tongue with sufficient flow is selected for further analysis. The monitoring points arranged along the flow passage of the guide vanes in the up section along the vertical height are named gv9-1 to gv9-5. The first two monitoring points are located in the flow passage of the guide vanes and the last three monitoring points are located in the vaneless space behind the guide vanes. Three groups of monitoring points are arranged along the vertical direction with different heights, which are close to the head cover, the horizontal middle section of the runner, and the lower ring. They are named gv9-up, gv9-mid, and gv9-down. The arrangement of monitoring points is shown in Figure 11.

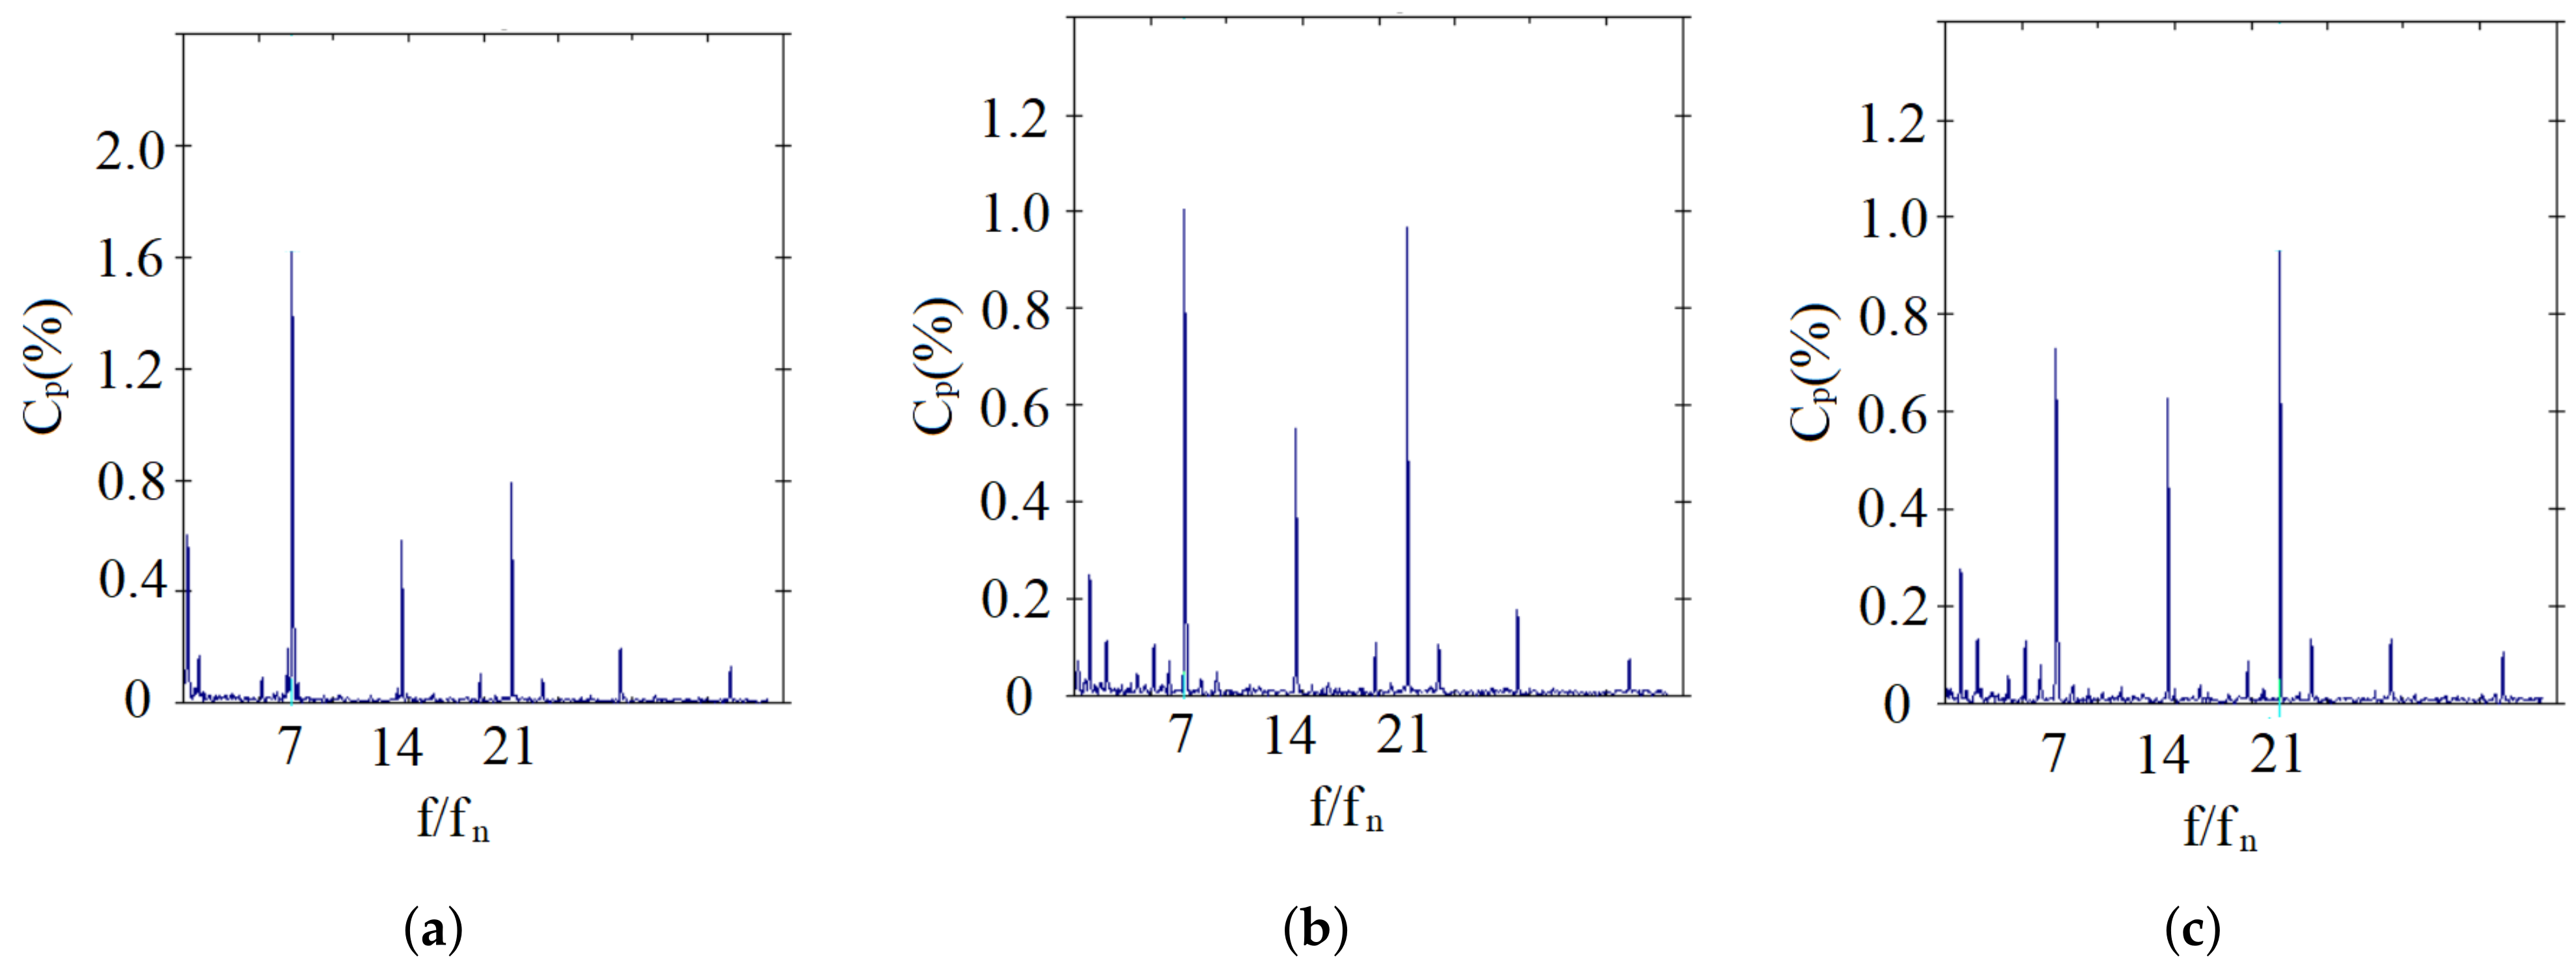
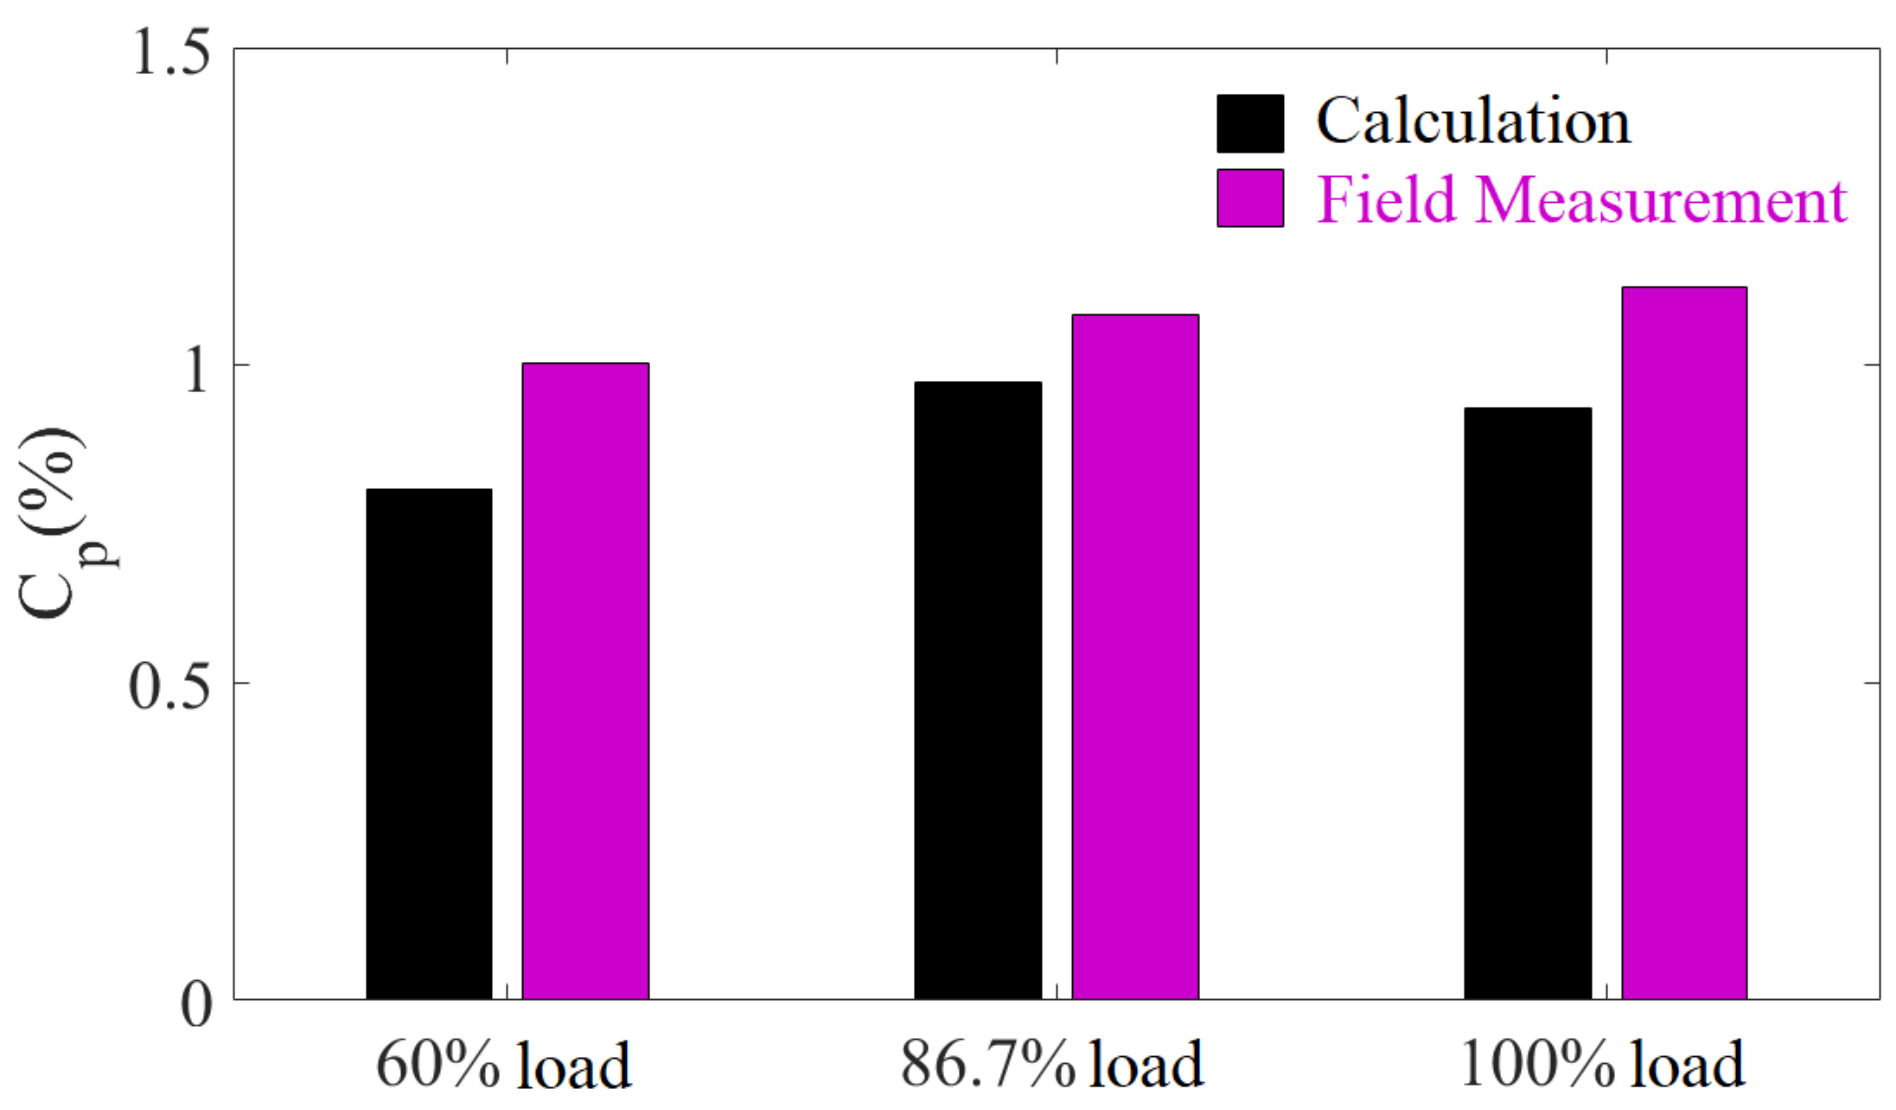
4.3.2. Pressure Fluctuations Comparison between Calculation and Measurement

The site measurement was carried out to measure the pressure fluctuations in the vaneless space of the prototype unit as described in Section 2. The monitoring point gv9-4-up in the numerical calculation model corresponds to the installed pressure transducer (Figure 2 and Figure 11). The pressure fluctuation peaks at f / f n = 7 , 14 , 21 of the calculations are consistent with the measured results, which validates the accuracy of the calculation. For the investigated PT unit, the most important excitation frequency of RSI-induced pressure fluctuation is f / f n = 21 , and it is selected to compare the calculated results with the measured one, as shown in Figure 12 and Table 3.
The following influencing factors can explain the error between the measured and simulated results.
The simplification of the 3D models of the fluid domains, such as small chamfers, can also lead to a small error in simulations.
The rated head of the pump–turbine unit is used for all numerical calculations, but during the field tests, the water levels of the upper and lower reservoirs of the PSPS under operation varied over time, resulting in slight variations in the head that did not always match the design rated head exactly.
Errors can also occur from the site measurement due to differences in sensor arrangement and human factors of the surveyor.
In this investigation, both measured results and calculated results show peak values at f / f n = 7 , 14 , 21 frequency with errors at f / f n = 21 in a range of 9.8% to 19.7%. Therefore, the calculated results of pressure fluctuations in the vaneless space are acceptable and have engineering reference value.

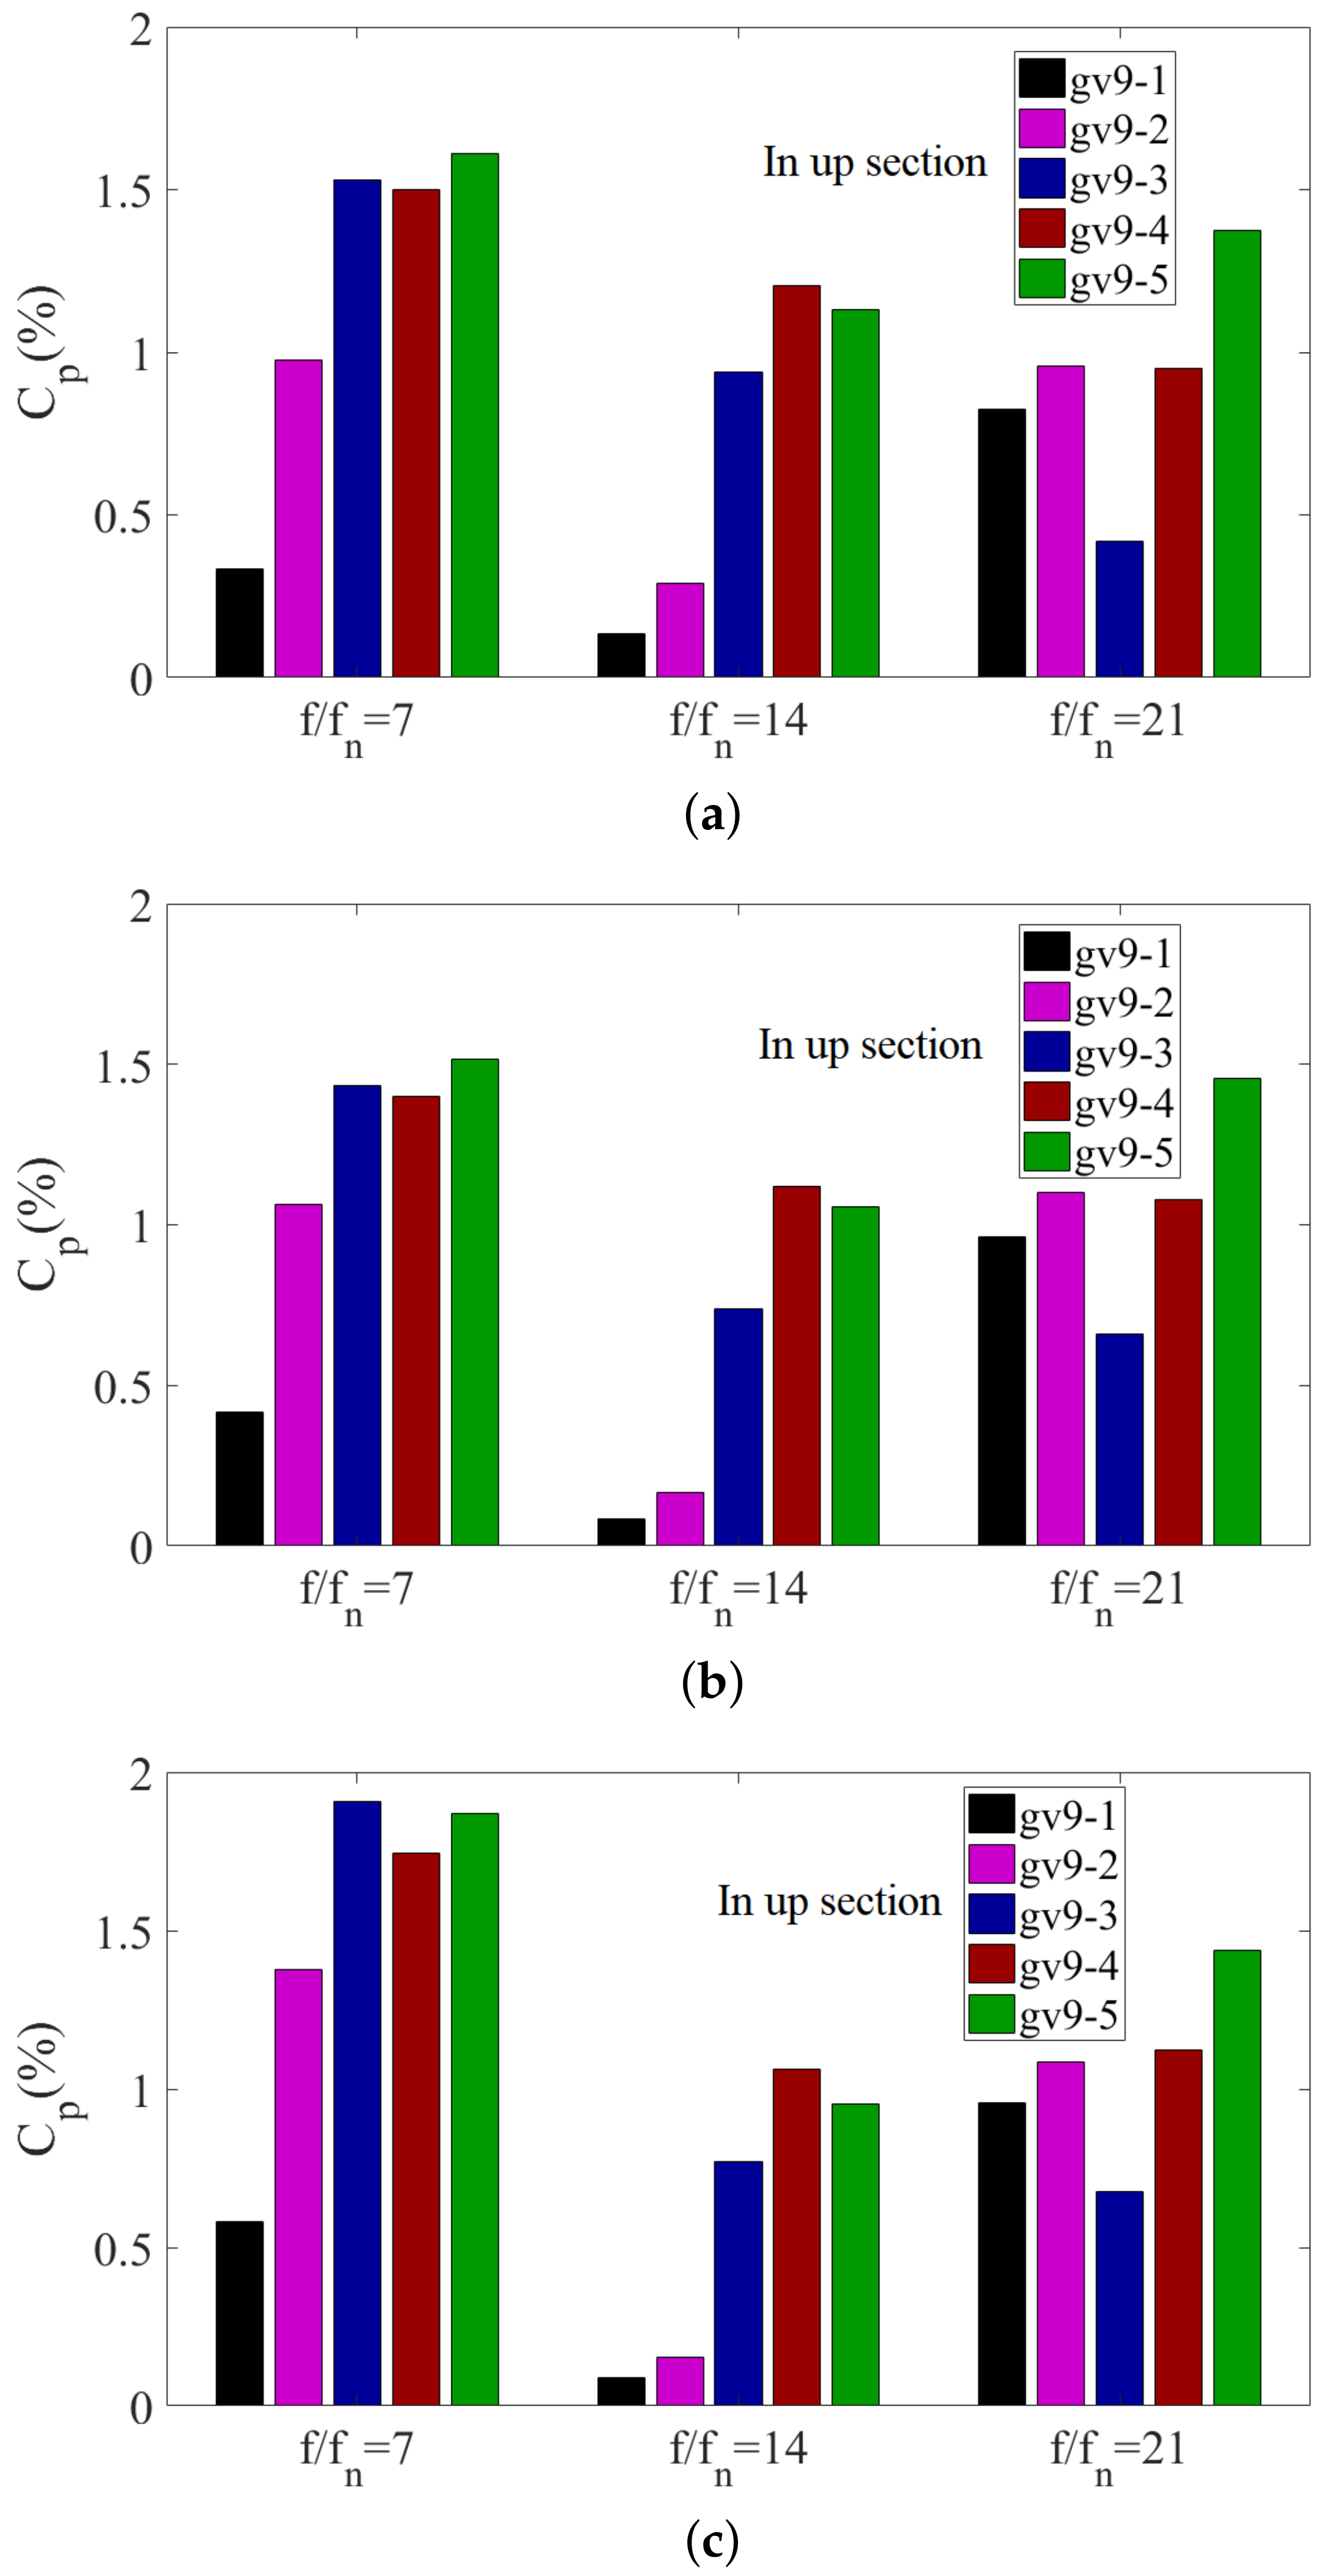
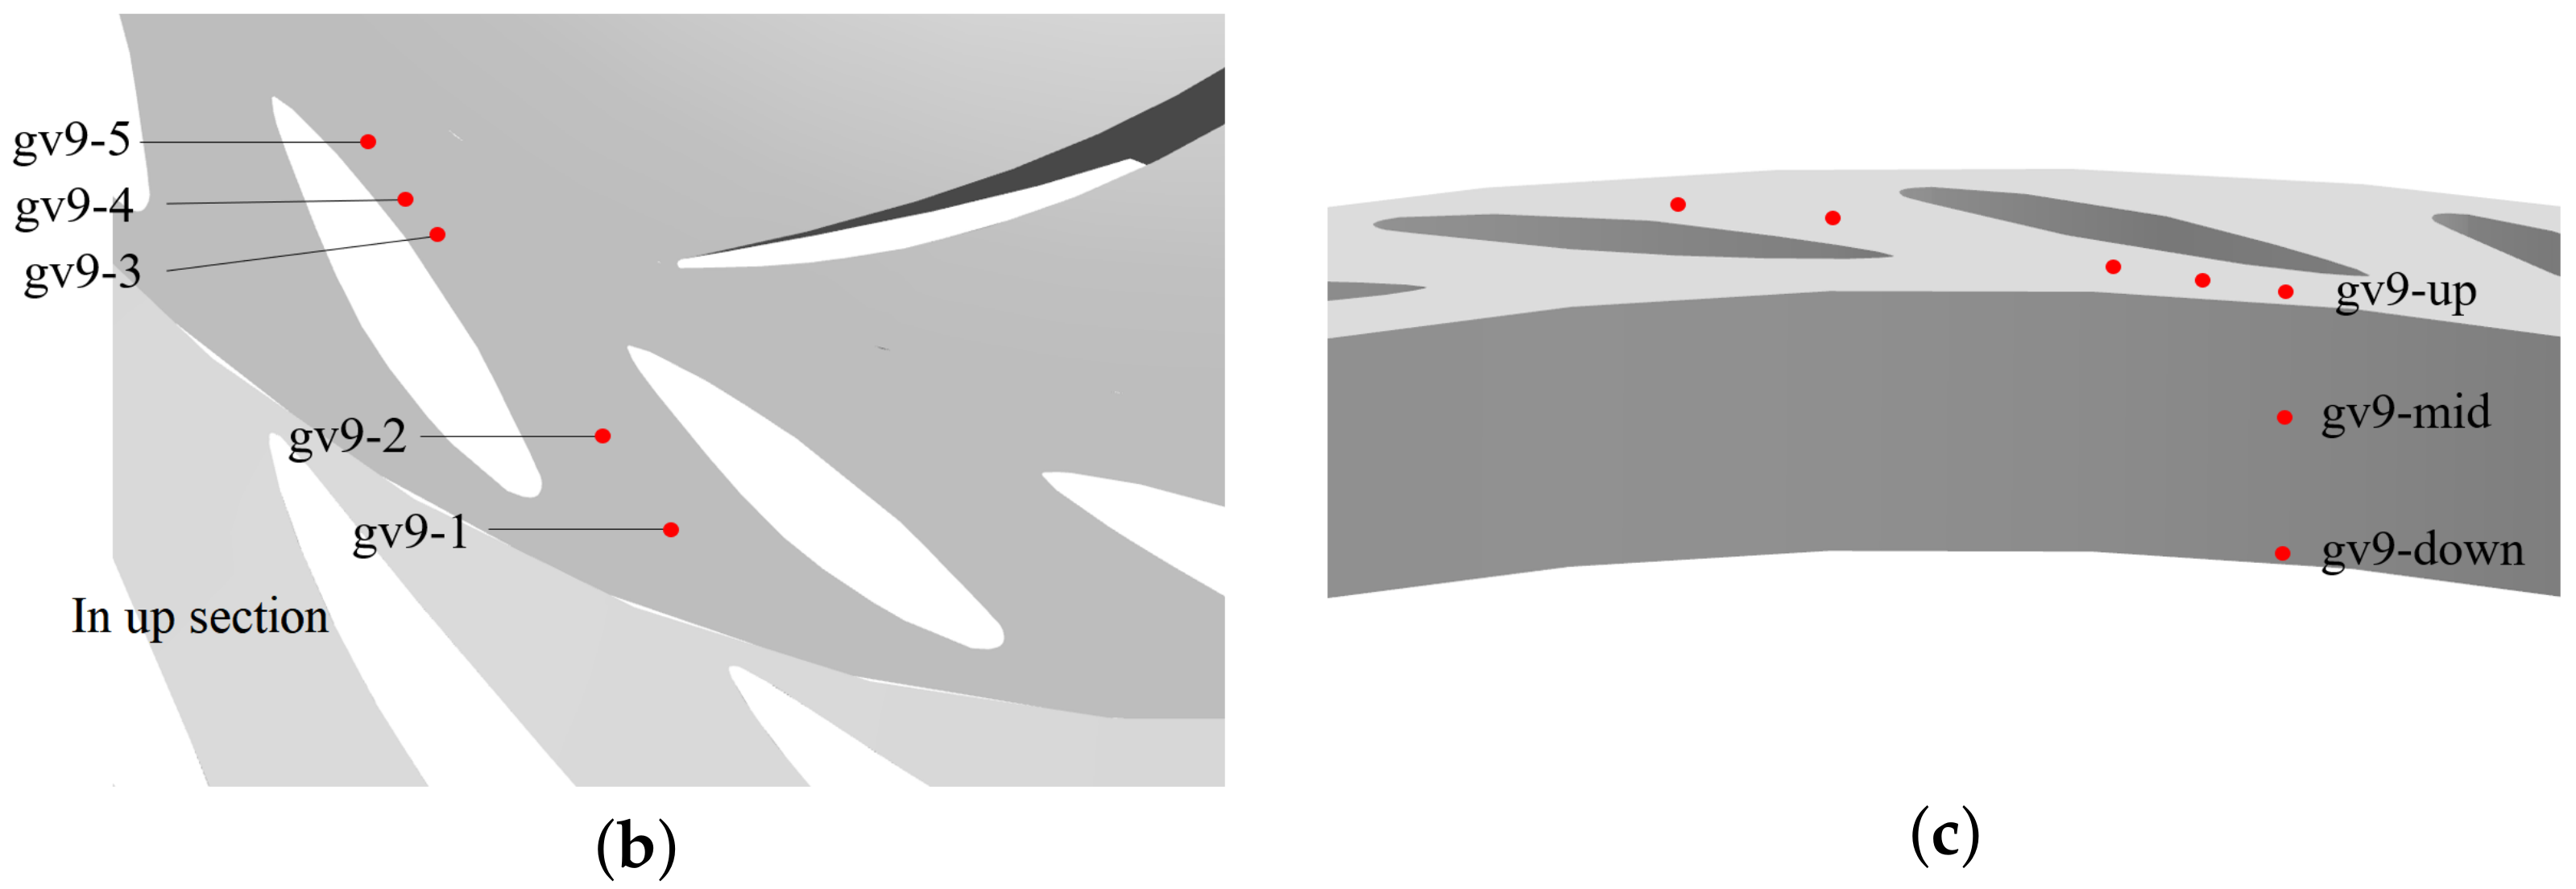
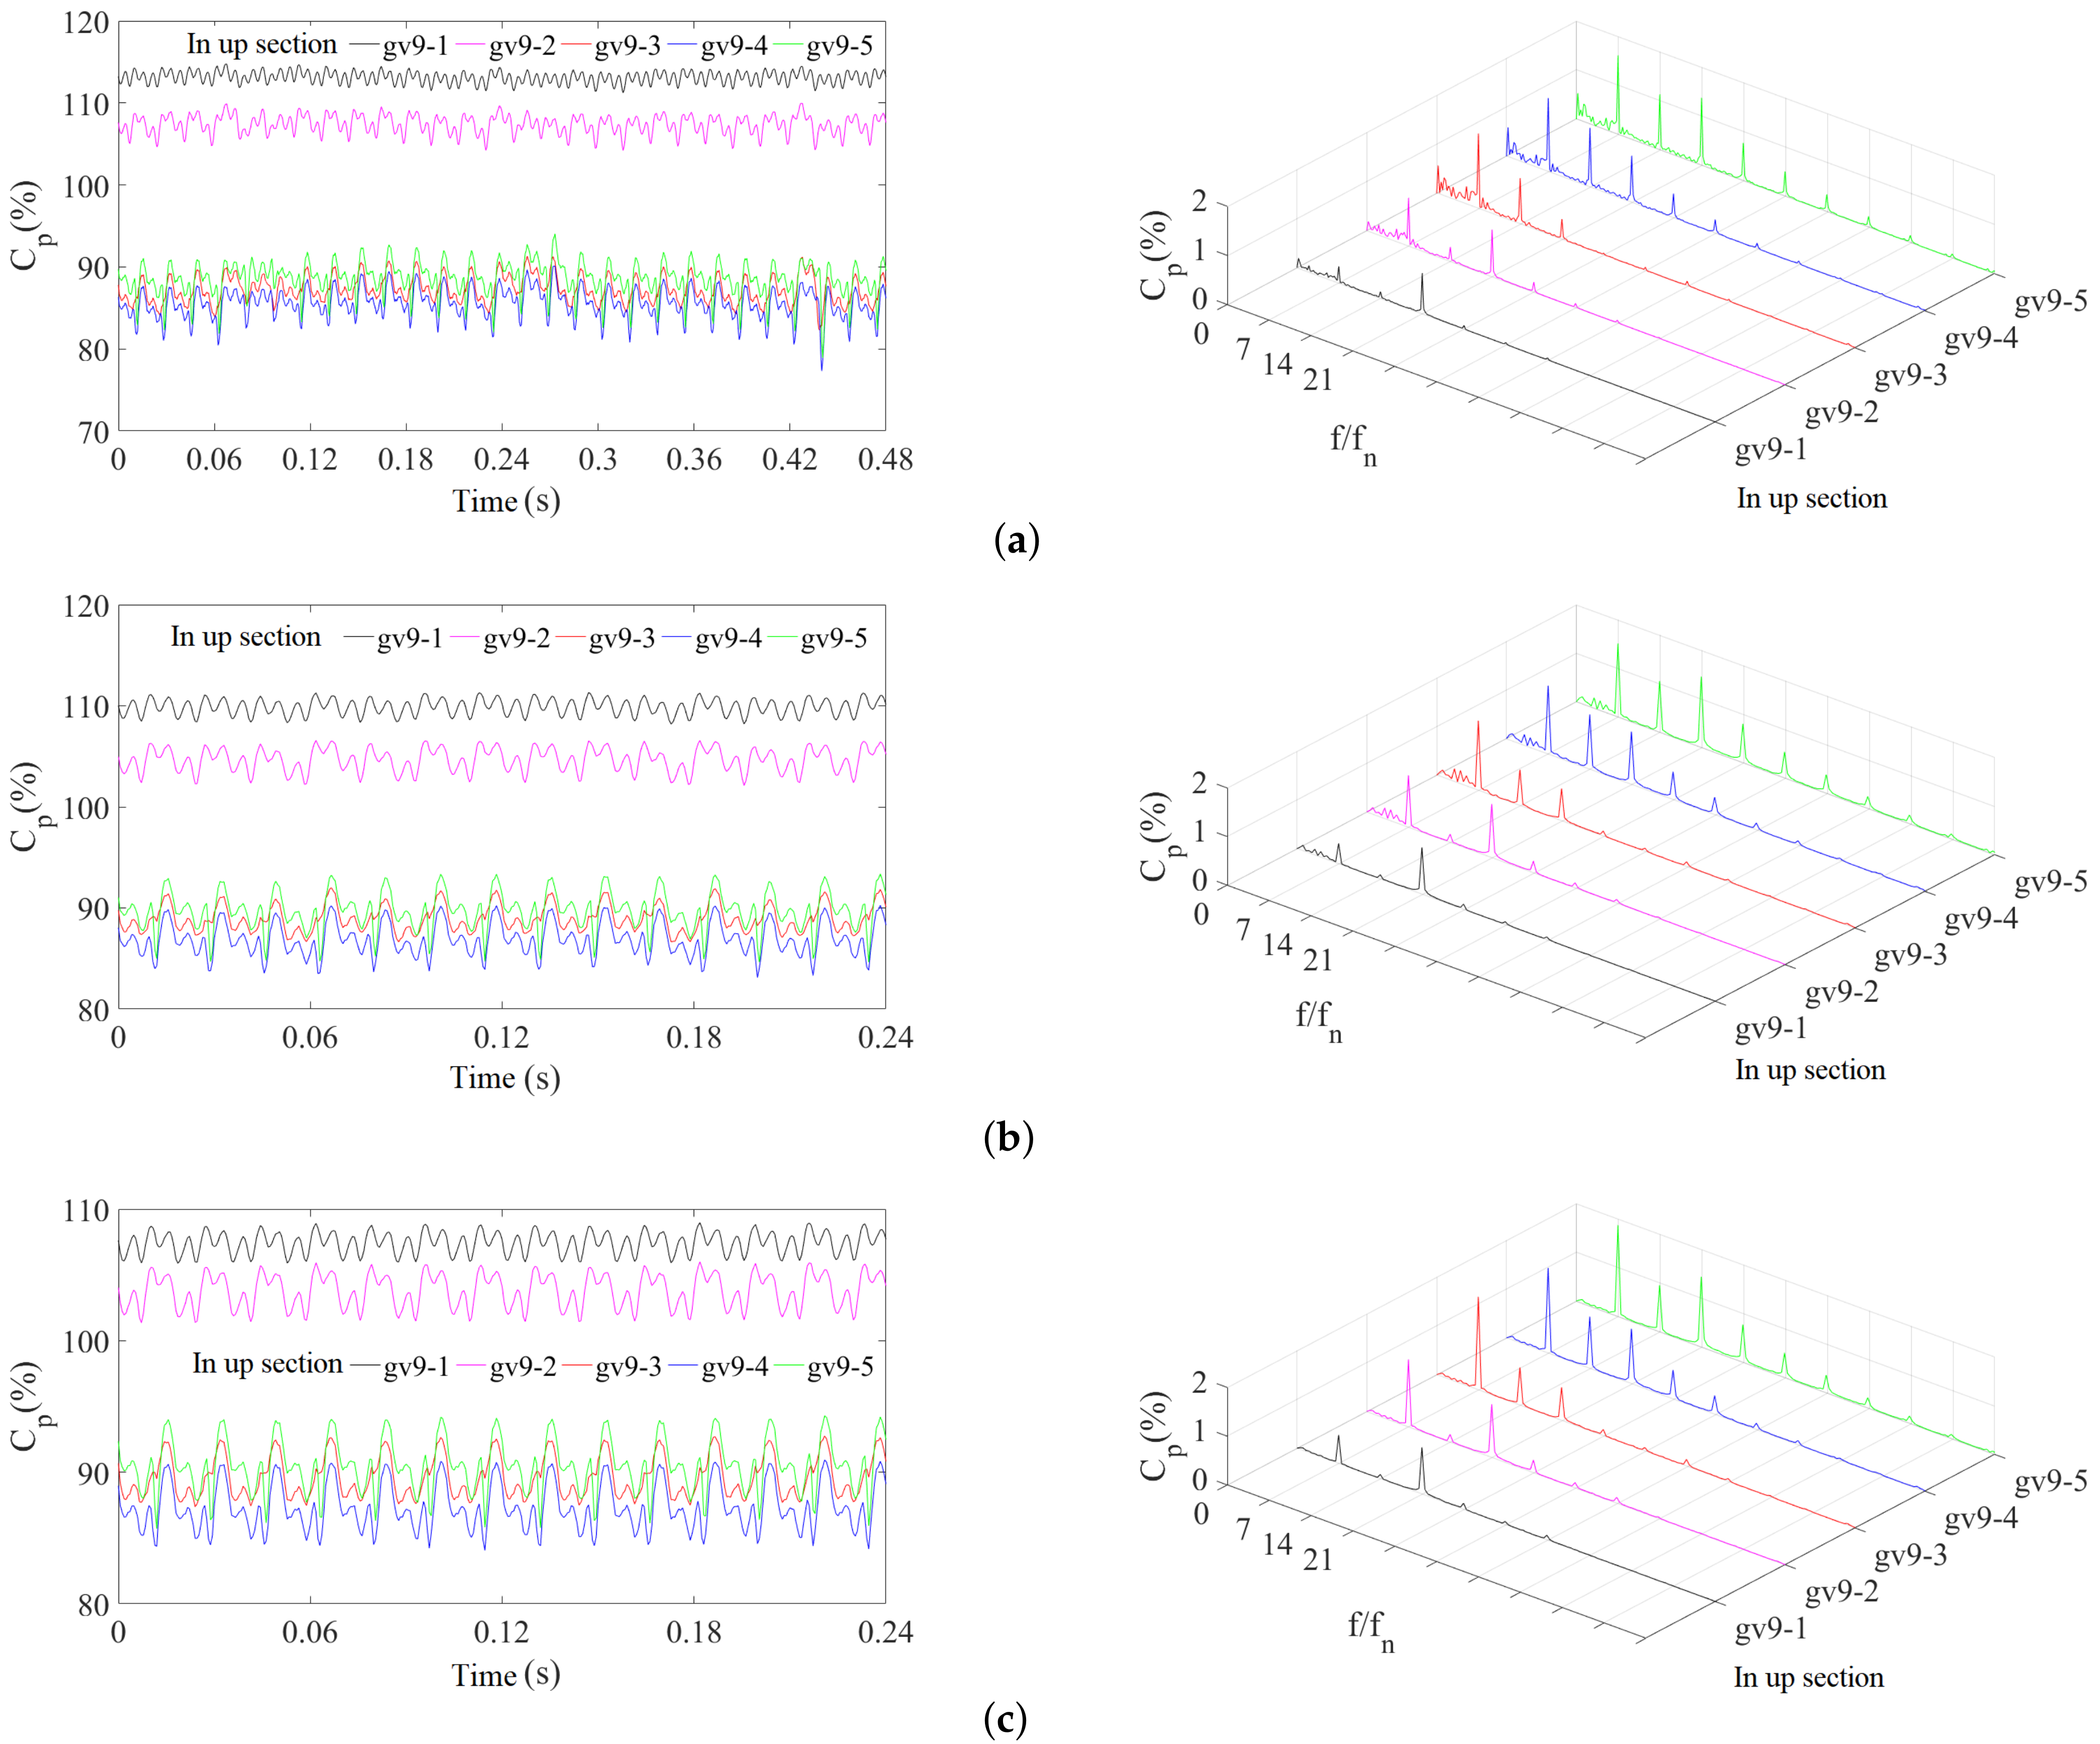
4.3.3. Pressure Fluctuations along the Guide Vane Passage

According to Equation (17), the frequencies of pressure fluctuations in the vaneless space are 7 f n and its harmonics, since the number of runner blades is seven. The pressure fluctuations of five monitoring points (gv9-1 to gv9-5), which are in the up section close to the head cover and along the flow direction of the guide vane passage (Figure 11), are analysed. To ensure the accuracy of the data analysis, the pressure signals of the last two revolutions of the runner under 86.7% and 100% load conditions and the last four revolutions of the runner under 60% load conditions were extracted and analysed. The time–domain and frequency–domain diagrams of the pressure fluctuations of these monitoring points are shown in Figure 13, and the comparison histograms of pressure coefficient peak-to-peak amplitudes at f / f n = 7 , 14 , 21 are shown in Figure 14.
It can be seen from the time–domain diagrams of three load cases in Figure 13 that the average pressure at each monitoring point decreases gradually along the flow direction, but the pressure fluctuations increase gradually. The waveforms of the monitoring points upstream of the guide vane (gv9-1 and gv9-2) are different from those downstream of the guide vane (gv9-3, gv9-4, and gv9-5).
All monitoring points contain rich frequency information. The frequency–domain diagrams and histograms in Figure 13 and Figure 14 show that the dominant frequency of pressure fluctuations of the measuring point at the upstream is 21 f n and the second frequency is 7 f n . The maximum peak-to-peak values of the signals of the monitoring points downstream appear at 7 f n , which are more severely affected by the influence of the runner blades. For the monitoring points downstream, the closer to the runner, the stronger the interference by rotating blades.
The 21 f n in the spectrum is mainly formed by the interference between the pressure field transmitted upstream by the runner and the pressure field formed by the wakes of the guide vanes. Therefore, the spatial expression of its intensity is not only related to the distance to the leading edges of the runner blades but also related to the distance to the trailing edges of the guide vanes. Among the five monitoring points, gv9-5 is most affected by the RSI, and the amplitude of 21 f n exceeds that of 14 f n . Monitoring point gv9-3 is relatively far away from the trailing edge of the guide vane and is less affected by wake interference.
By analyzing the three load cases, the pressure fluctuations under 60% load show clear low-frequency components that are related to the vortices in the draft tube and in the vaneless space. On the one hand, the high-energy draft tube vortex under part load, e.g., 60% load, can spread upstream through the runner channel to the vaneless space. On the other hand, when the guide vane opening is small under part load, the flow injection angle from the trailing edges of the guide vanes to the leading edges of the runner blades is larger, and the vortex intensity after passing through the guide vane is enhanced, which leads to a large number of low-frequency pressure fluctuations in the vaneless space. However, under 86.7% load and 100% load, the energy intensity of the vortices in the draft tube and in the vaneless space is insufficient. Thus, the closer the operating conditions are to the design condition, the fewer low-frequency signal components of pressure fluctuations.

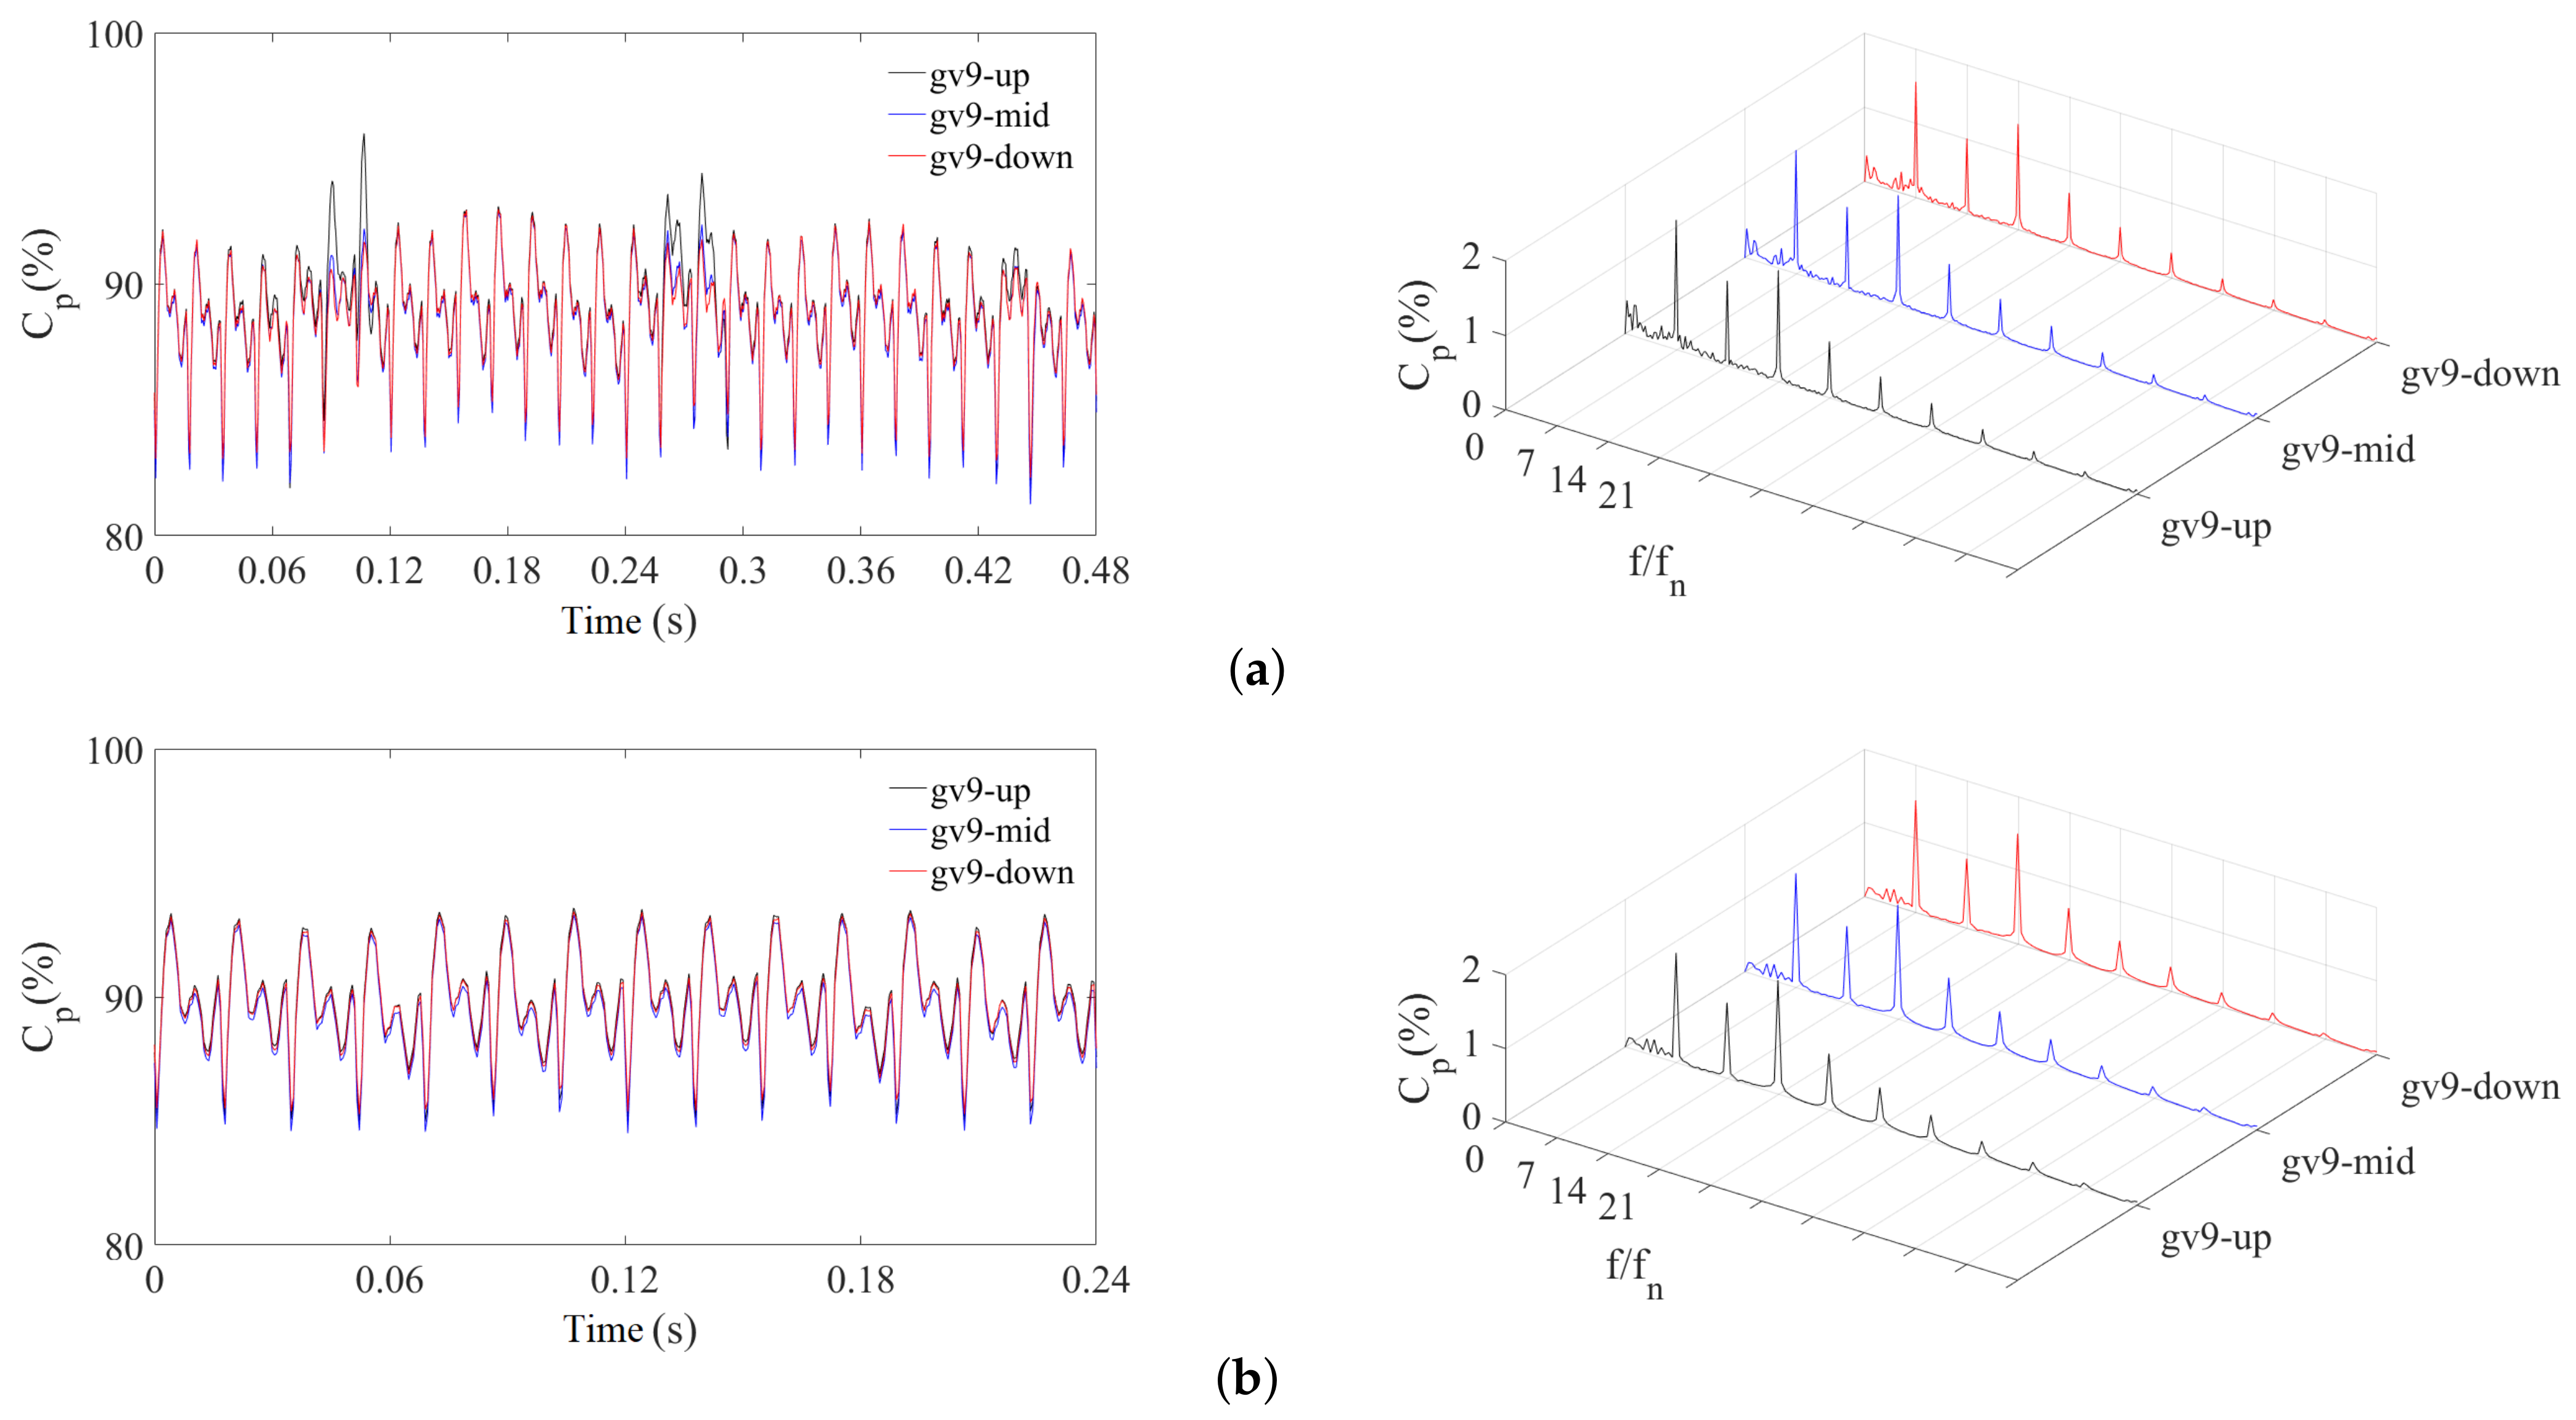
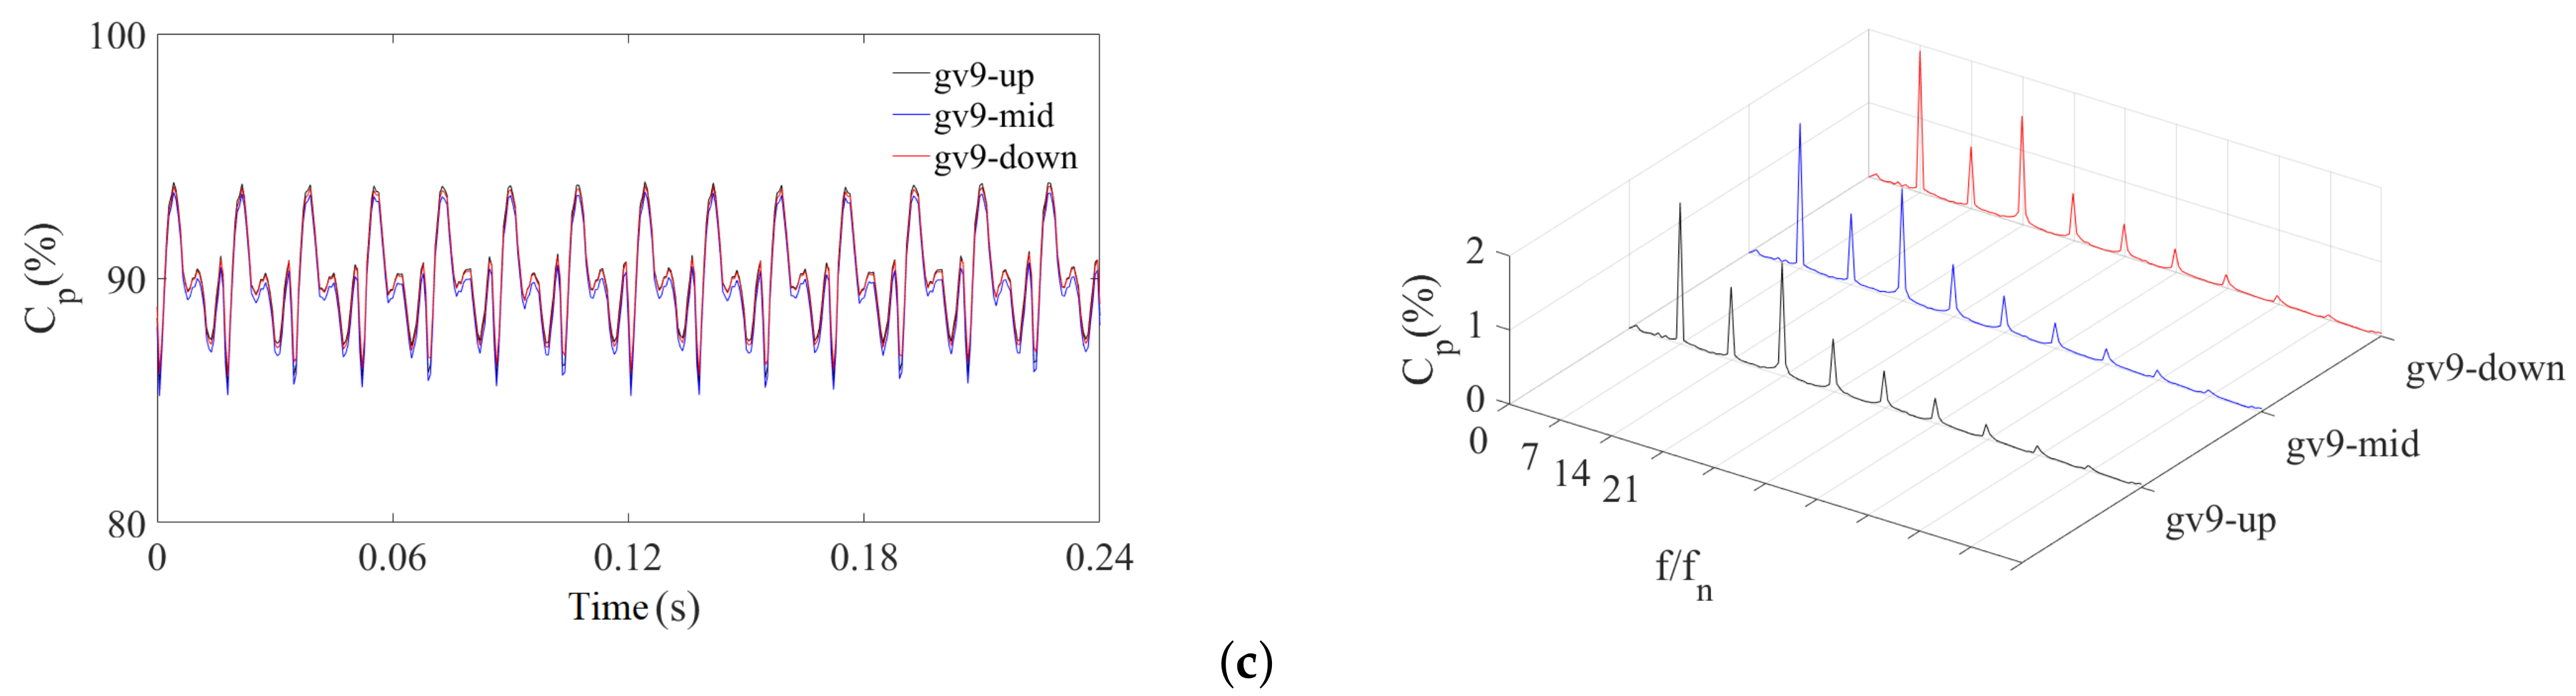
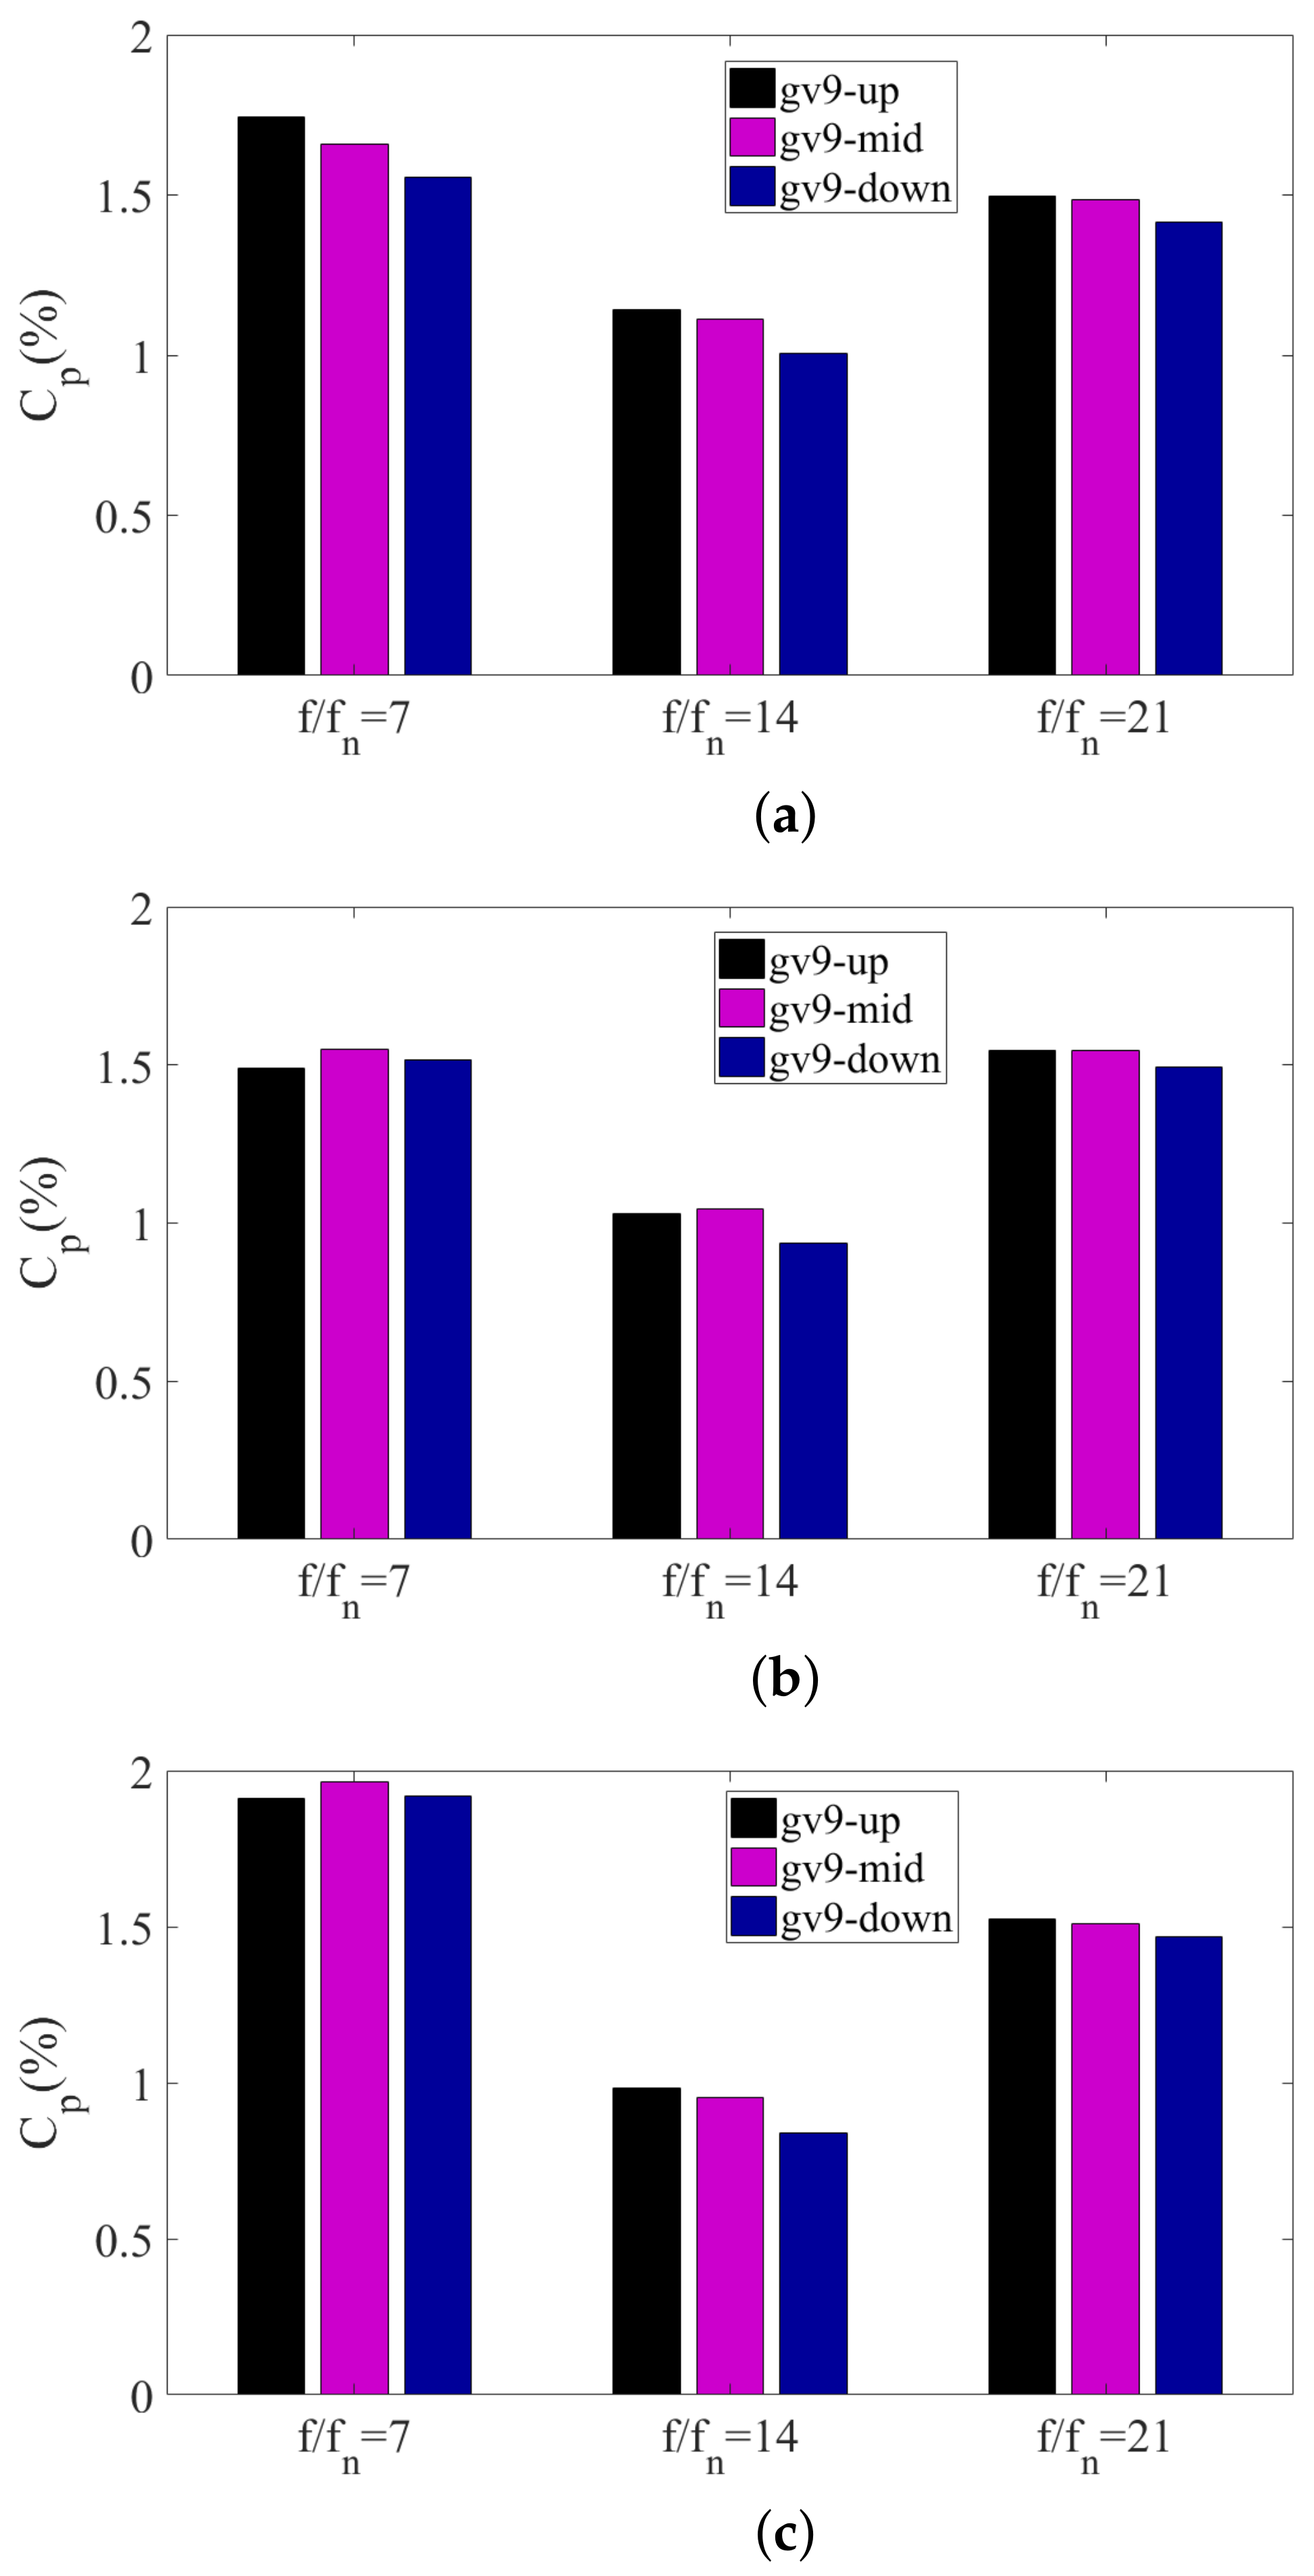
4.3.4. Pressure Fluctuations along with the Vertical Height

Three monitoring points (gv-up, gv-mid, and gv-down) corresponding to the monitoring point of gv9-5 but with different vertical heights are chosen to investigate the difference in pressure fluctuations along with the vertical height (Figure 11). The time–domain and frequency–domain diagrams of pressure fluctuations at different loads are shown in Figure 15 and the comparisons of pressure fluctuation amplitudes corresponding to 7 f n and its harmonics are shown in Figure 16.
The pressure fluctuations at the three monitoring points with different vertical heights under 86.7% load and 100% load show a high consistency. It can be considered that the pressure fluctuations in the vaneless space are less affected by the vertical height when working close to the rated operating condition. At 60% load condition, the waveforms of the pressure fluctuations for the monitoring points are modulated by the low-frequency components. The pressure fluctuation waveforms at the middle and lower measurement points (gv-mid and gv-down) are similar, while the pressure fluctuations at the upper measurement point (gv-up) are more intense, with several high peaks during the rotation of the runner (refer to the left sub-figure of Figure 15a), and these high peaks are related to the draft tube vortex since the frequency of these high peaks is the typical frequency range of the draft tube vortex ropes. Therefore, when operating close to the design operating point, the pressure fluctuations in the vaneless space are less affected by the vertical height. When operating under low-load conditions, the low-frequency pressure waves caused by the draft tube vortex spread into the bladeless space, resulting in inconsistent pressure fluctuations in the vertical direction.

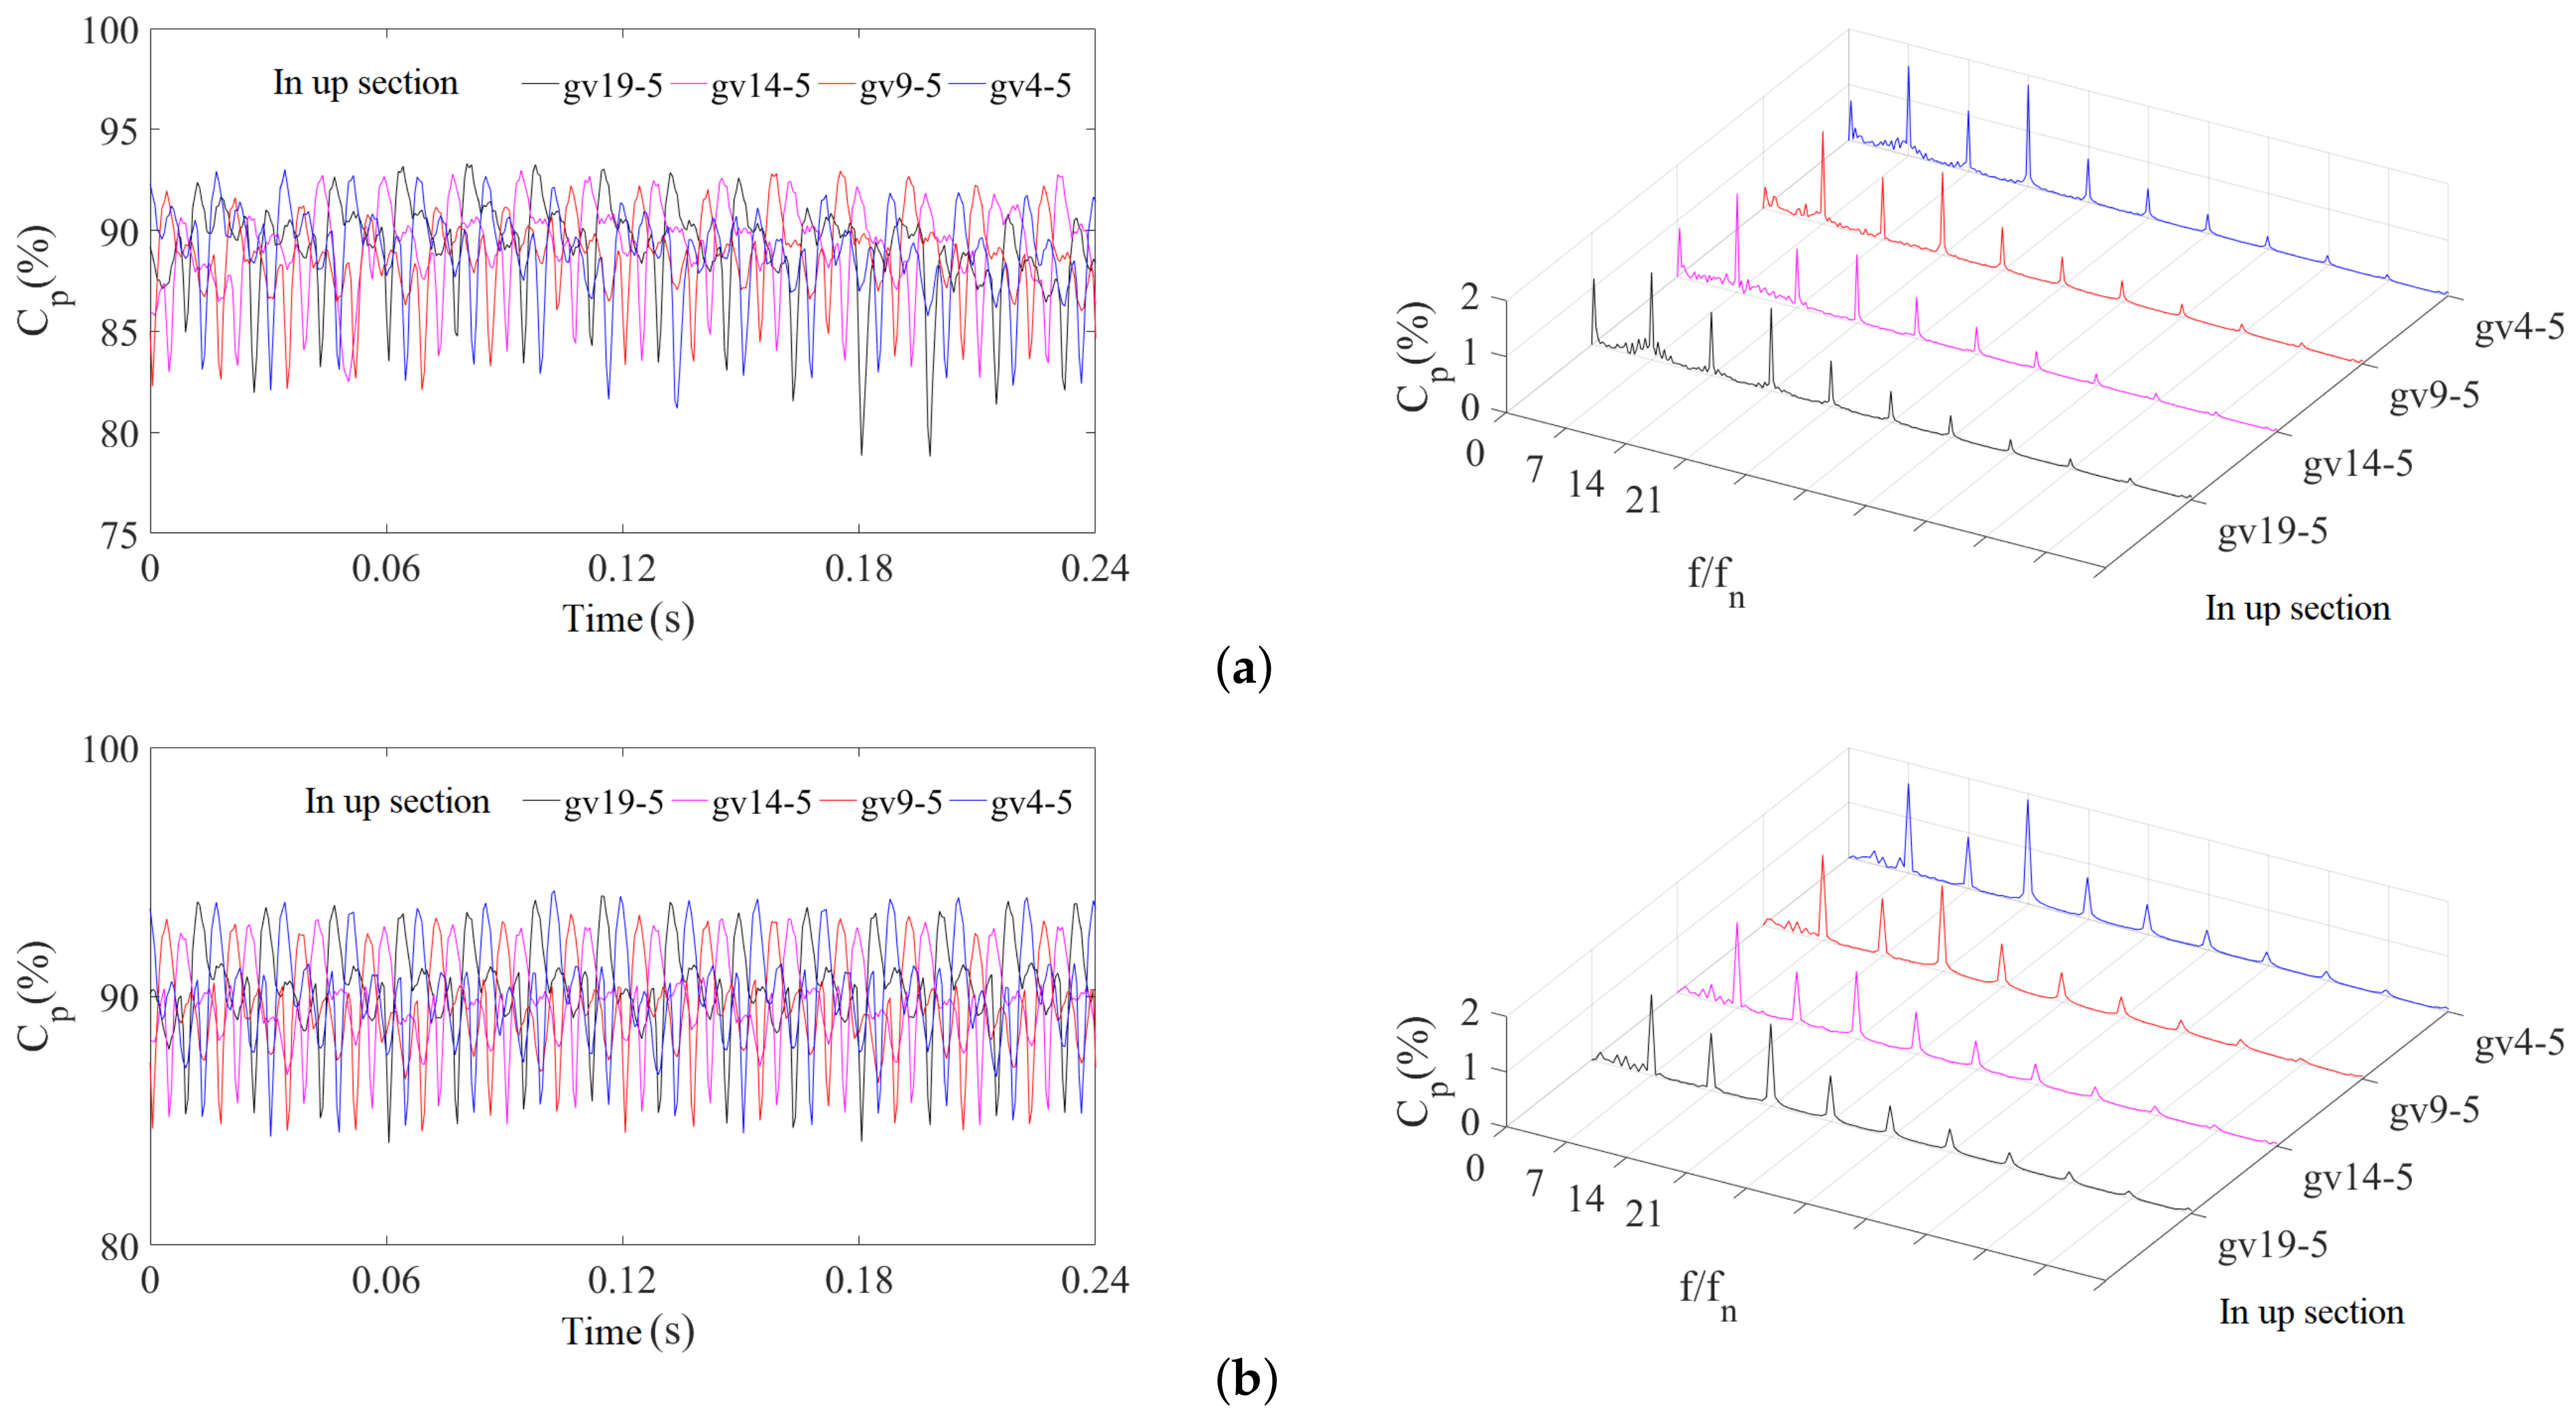
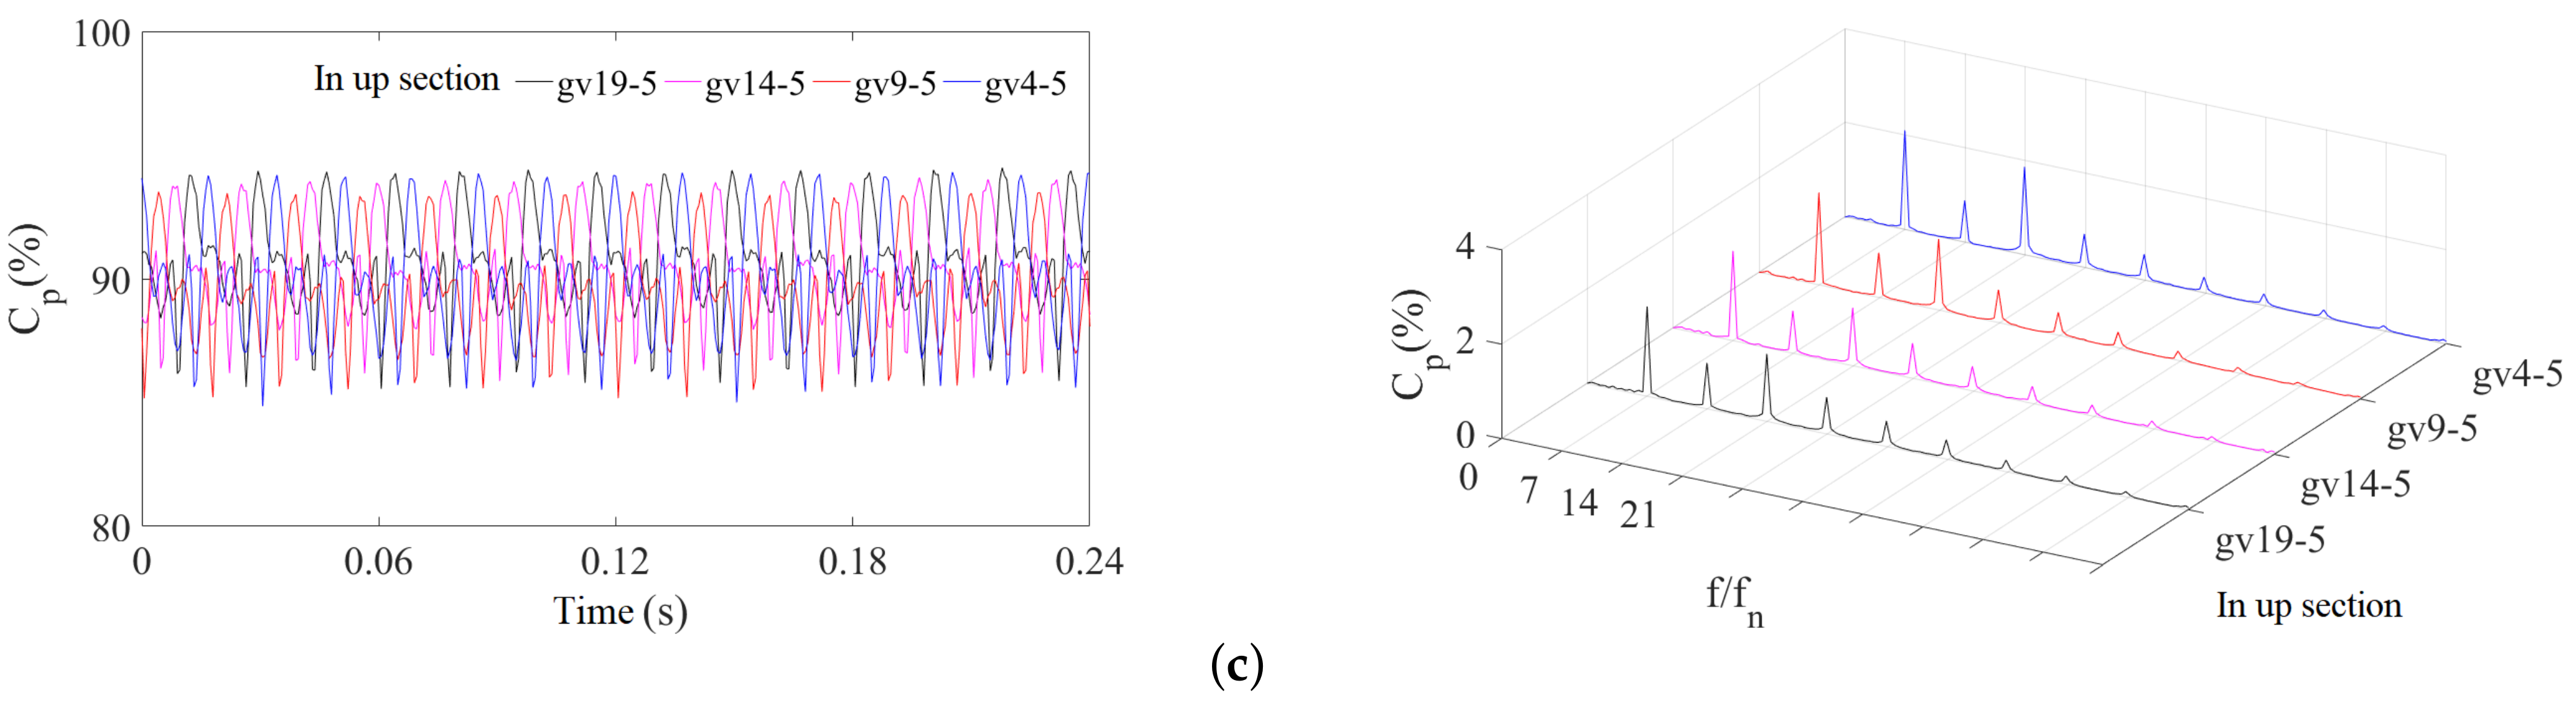
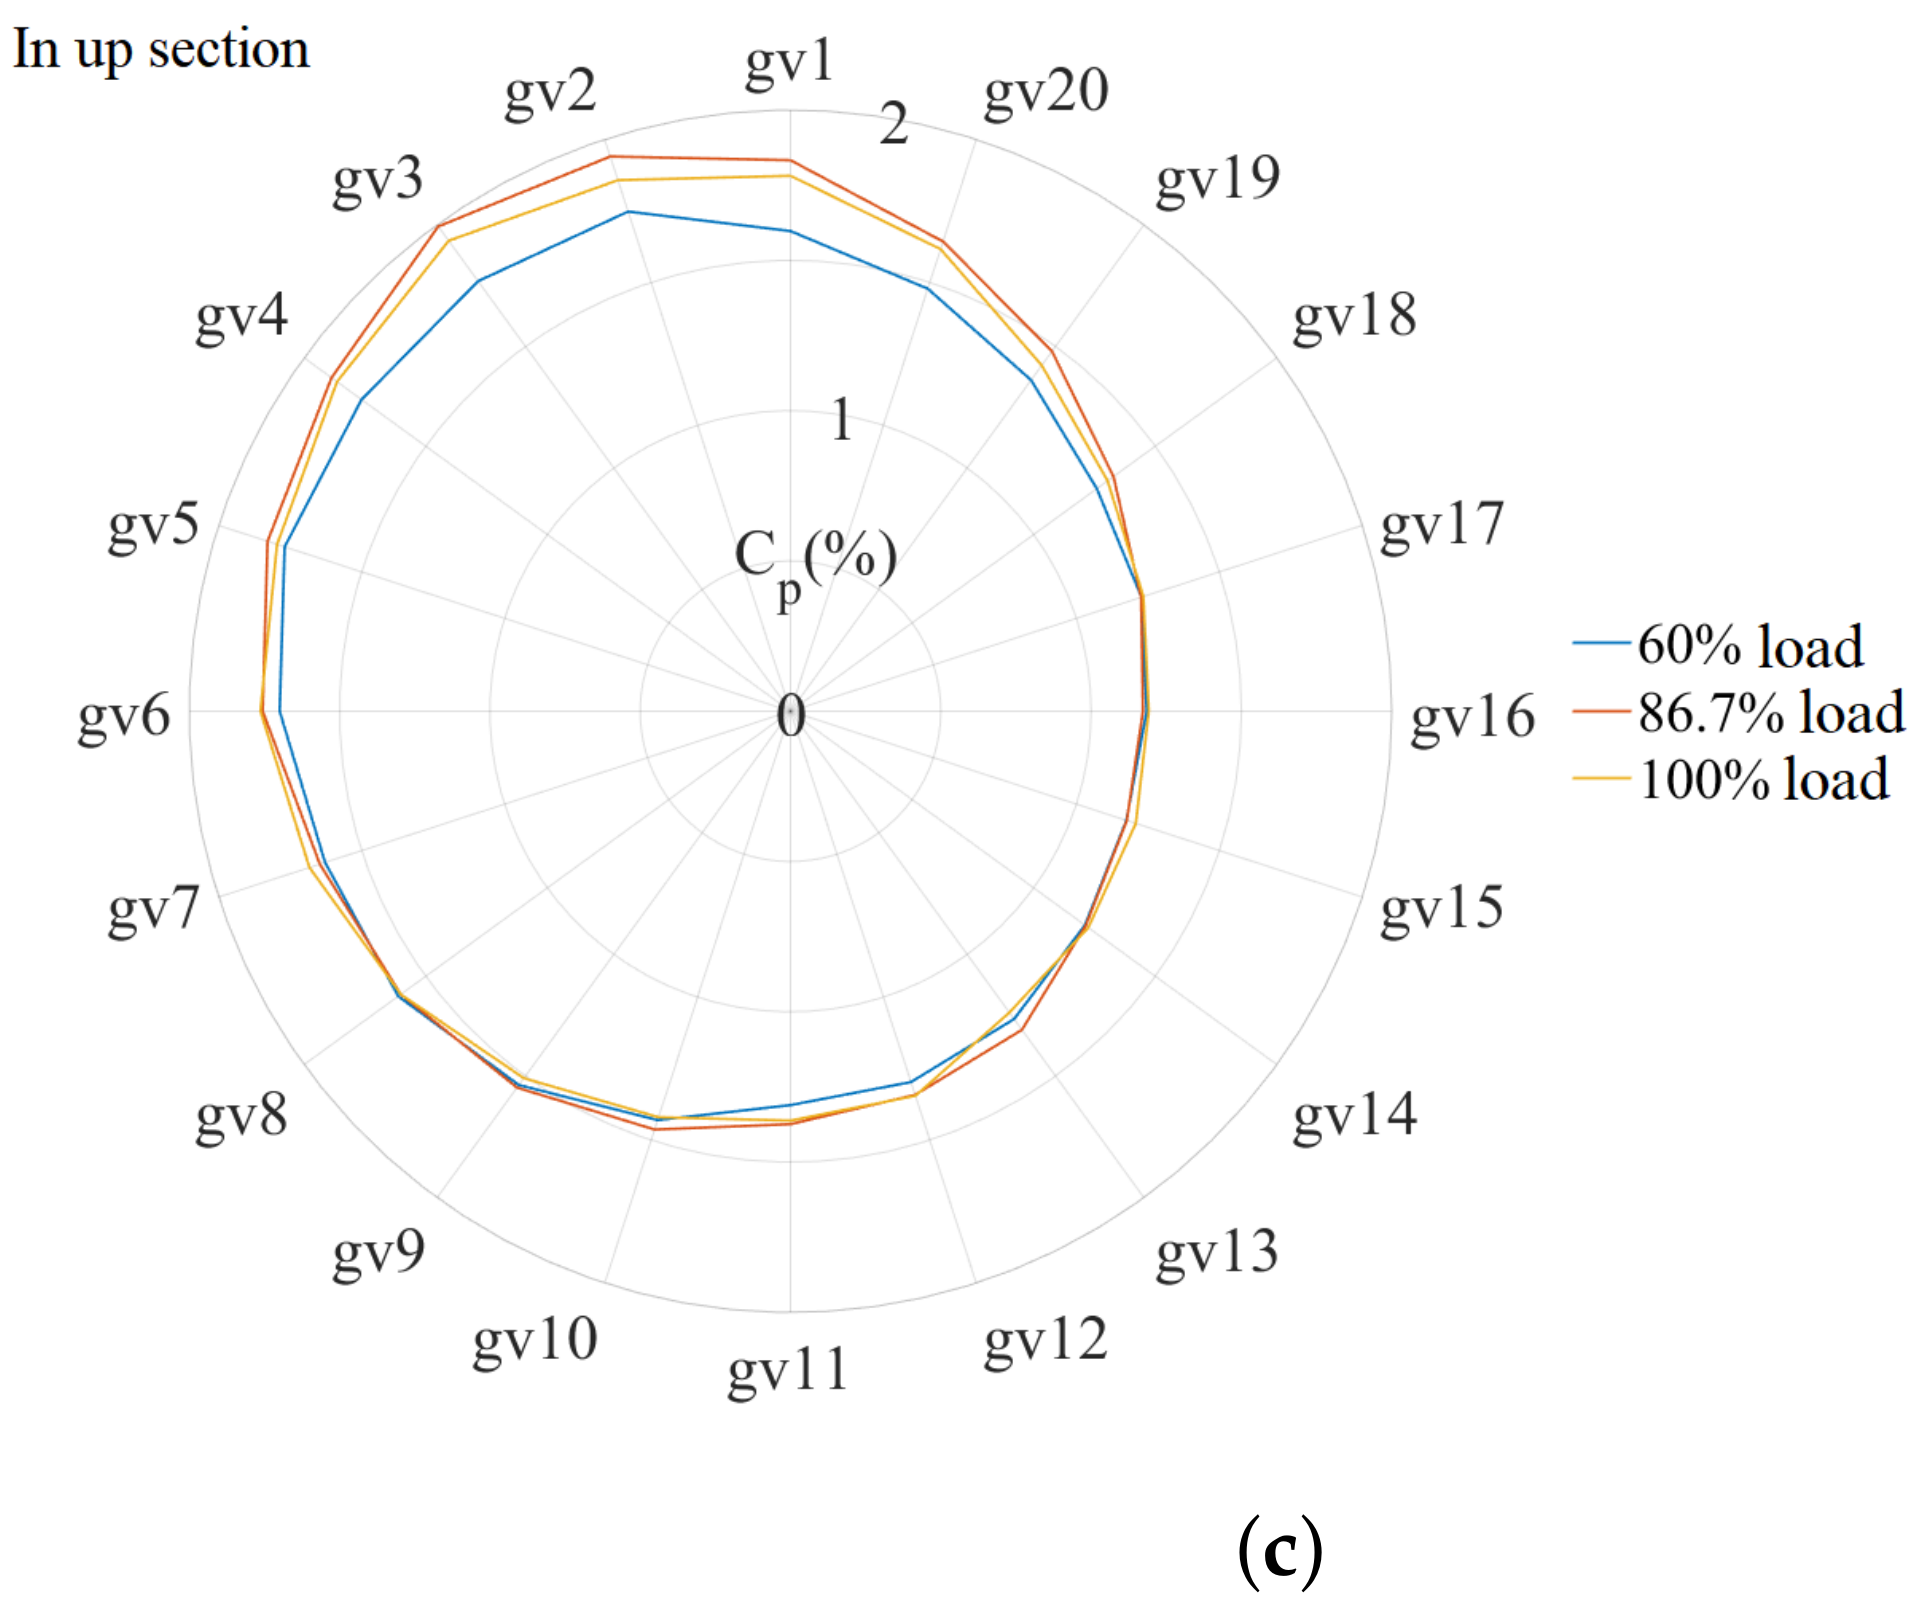
4.3.5. Pressure Fluctuations along the Circumferential Direction

The relative position of the spiral case tongue and the guide vanes is shown in Figure 11. The location of gv20 corresponds to that of the spiral case tongue. Figure 17 shows the time–domain and frequency–domain diagrams of pressure fluctuations at four monitoring points (gv19, gv14, gv9, and gv4), which are spaced at 90 degrees along the circumference of the vaneless space and in the up section along the vertical height (Figure 11).
There is a phase difference between the pressure fluctuations at each monitoring point in the time–domain diagram. According to the Equations (15) and (18), the pressure fluctuation frequency generated by RSI is 21 f n , which is consistent with the pressure fluctuation waveform in the time–domain diagrams.
As shown in Figure 18, the amplitudes of pressure fluctuations at all 20 monitoring points along the circumferential direction clockwise and in the up section along the vertical height (gv20 to gv1) are plotted in a polar diagram. The frequency and polar diagrams show that the pressure fluctuations in the vaneless space are related to the circumferential position. The amplitudes of 7 f n and 14 f n are mainly induced by the rotating runner, and the corresponding amplitude value of 21 f n comes from the interference between the runner and the guide vane wake.
Figure 18 also shows that the pressure fluctuation amplitudes of 7 f n and 14 f n are more evenly distributed in the circumferential direction, while the pressure fluctuation amplitudes corresponding to 21 f n are significantly different in the circumferential direction, shown as an “eccentric ellipse” (Figure 18c). Looking along the circumferential direction from gv20 to gv1, the pressure fluctuation amplitudes of 21 f n under the three loads present a “decrease–increase–decrease” pattern. The pressure fluctuation amplitudes decrease smoothly first to the minimum value at gv13, then increase smoothly to the maximum value at gv3, and decrease smoothly again to the circumferential position of gv20 which is corresponding to the spiral case tongue. The strong non-uniformity of pressure fluctuations mainly appears in 21 f n , indicating that the asymmetry of the spiral case and the stay ring in the circumferential direction has a significant impact on the guide vane wakes.

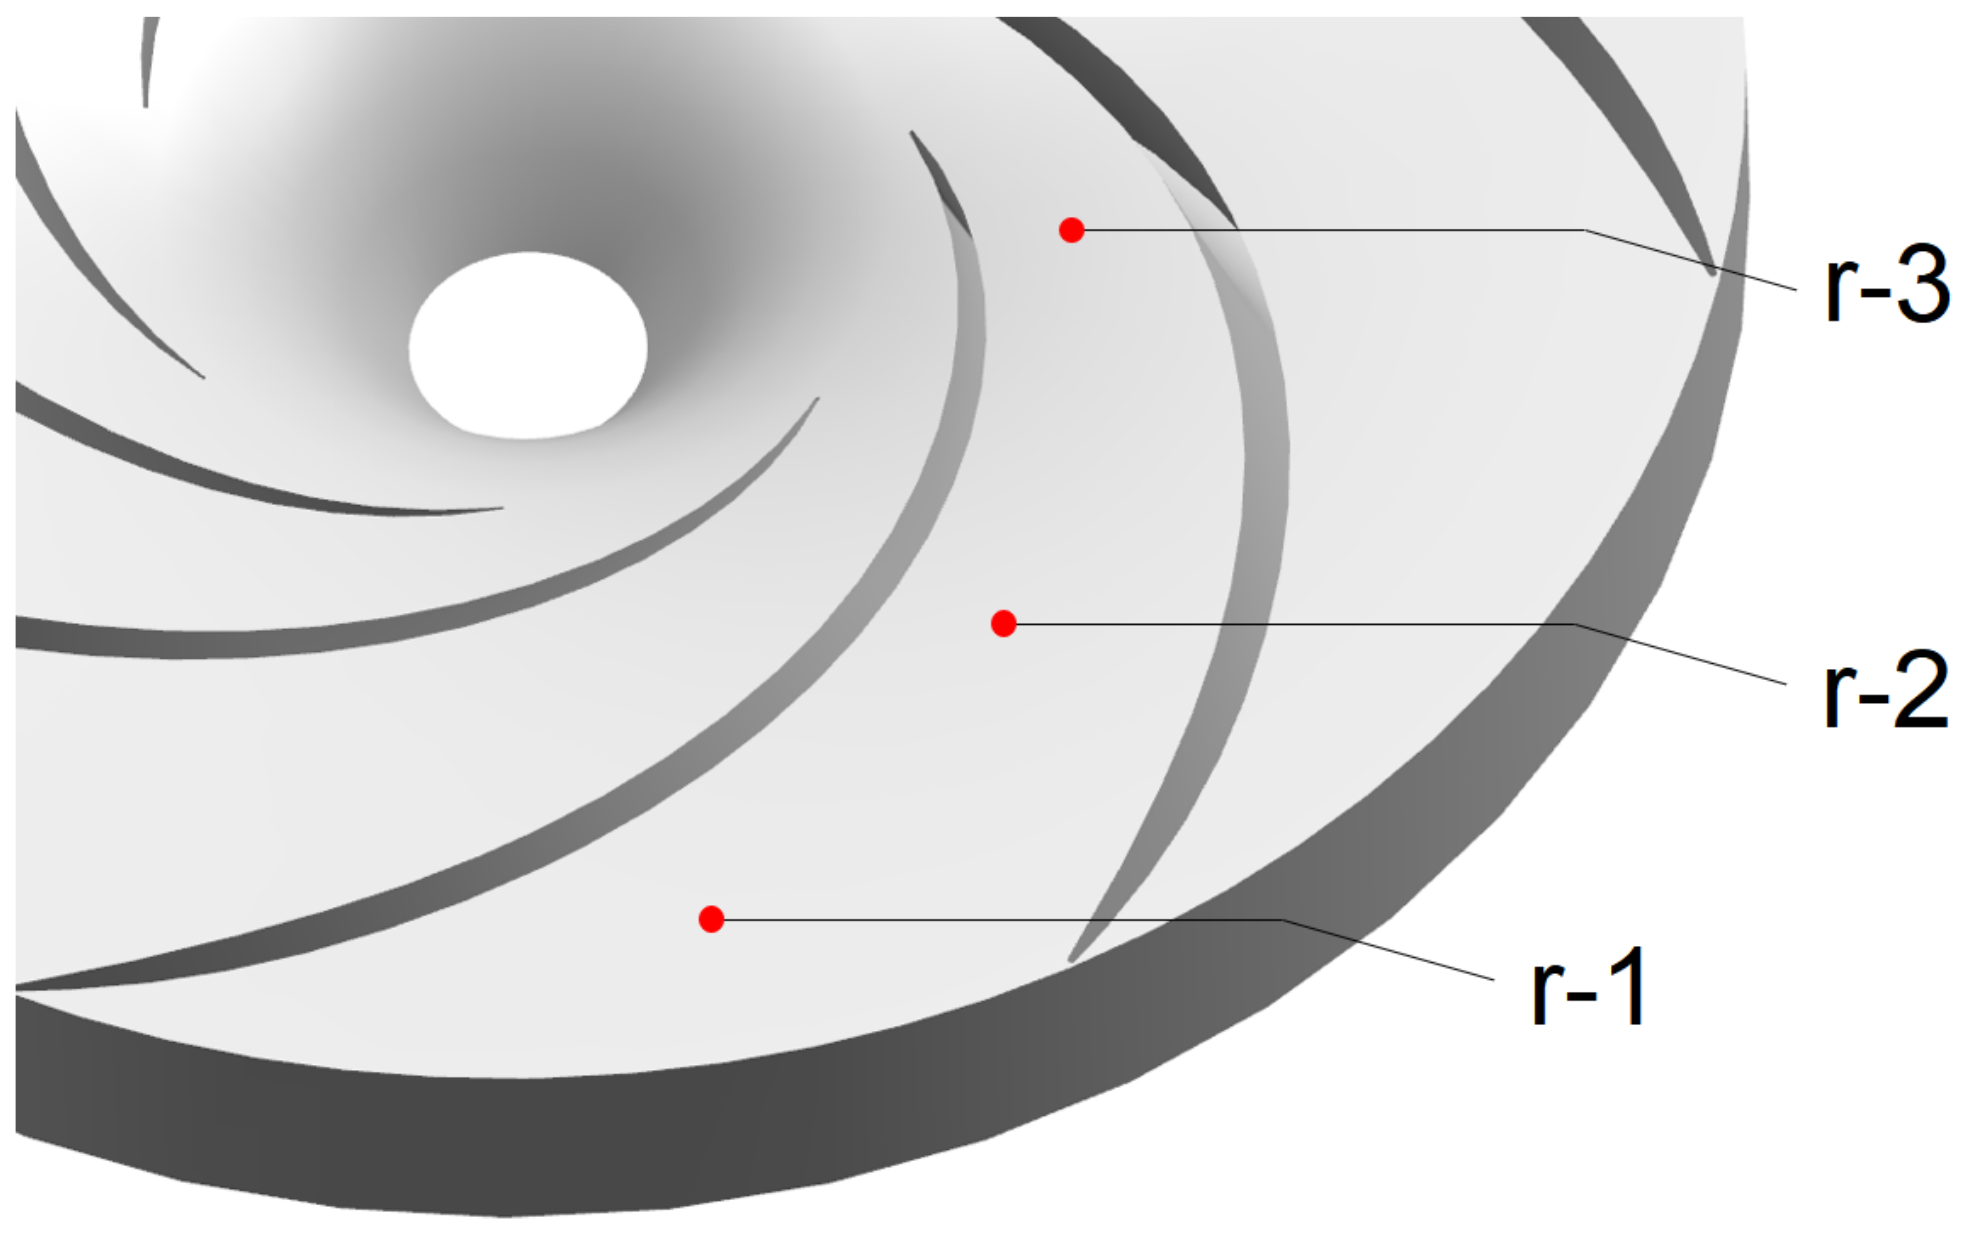
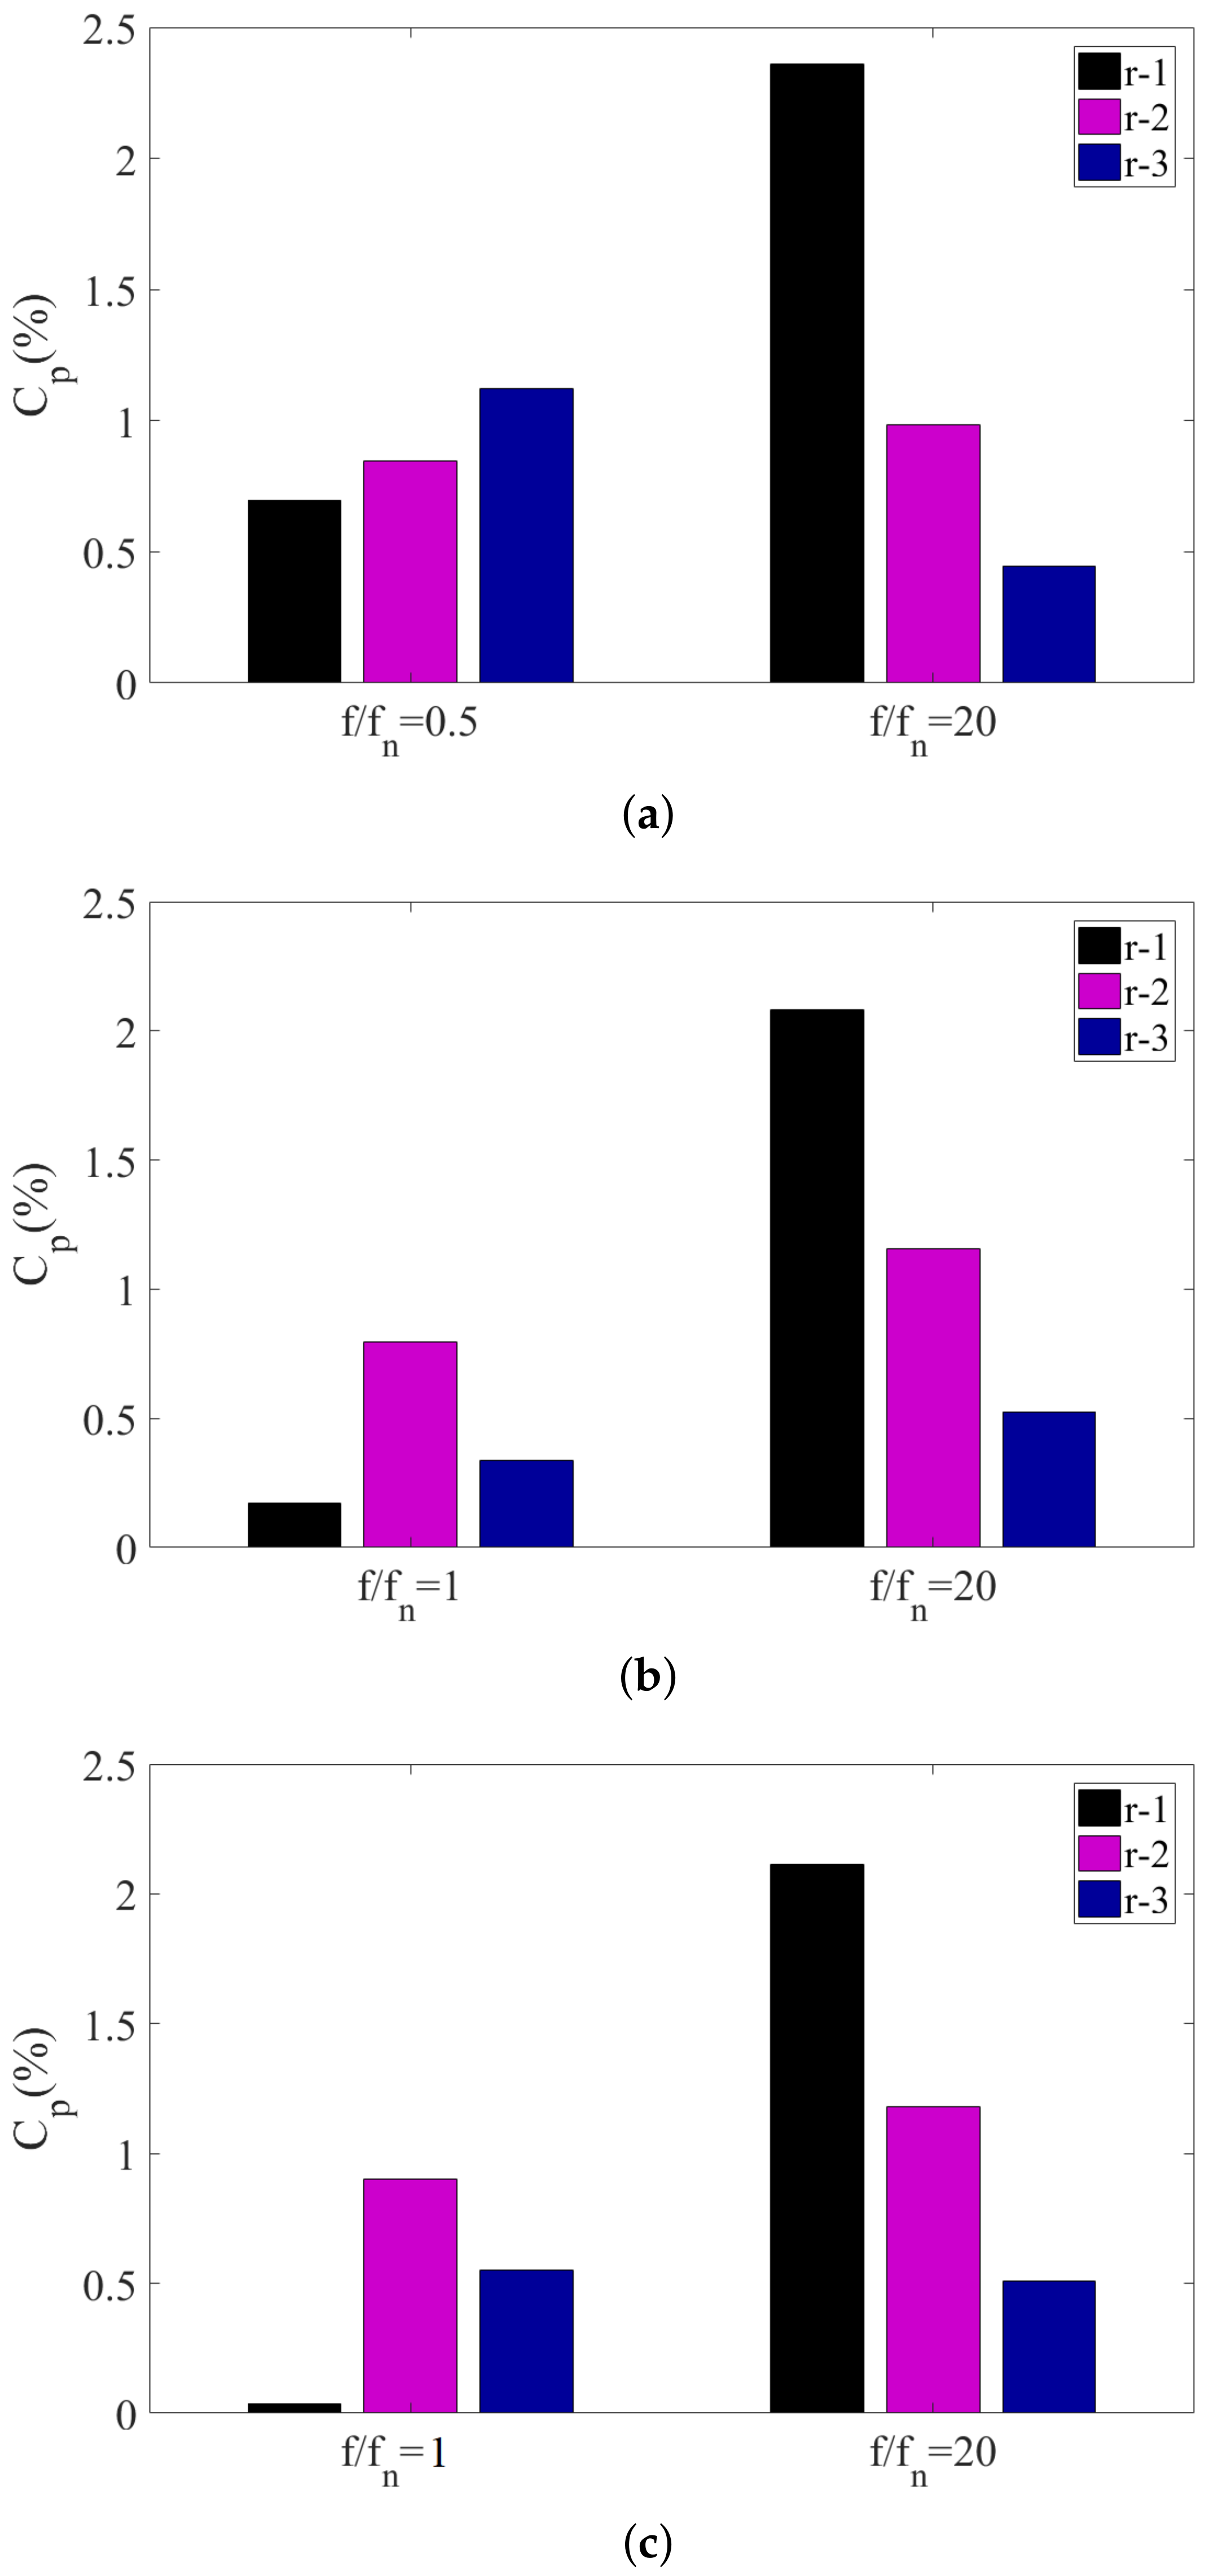
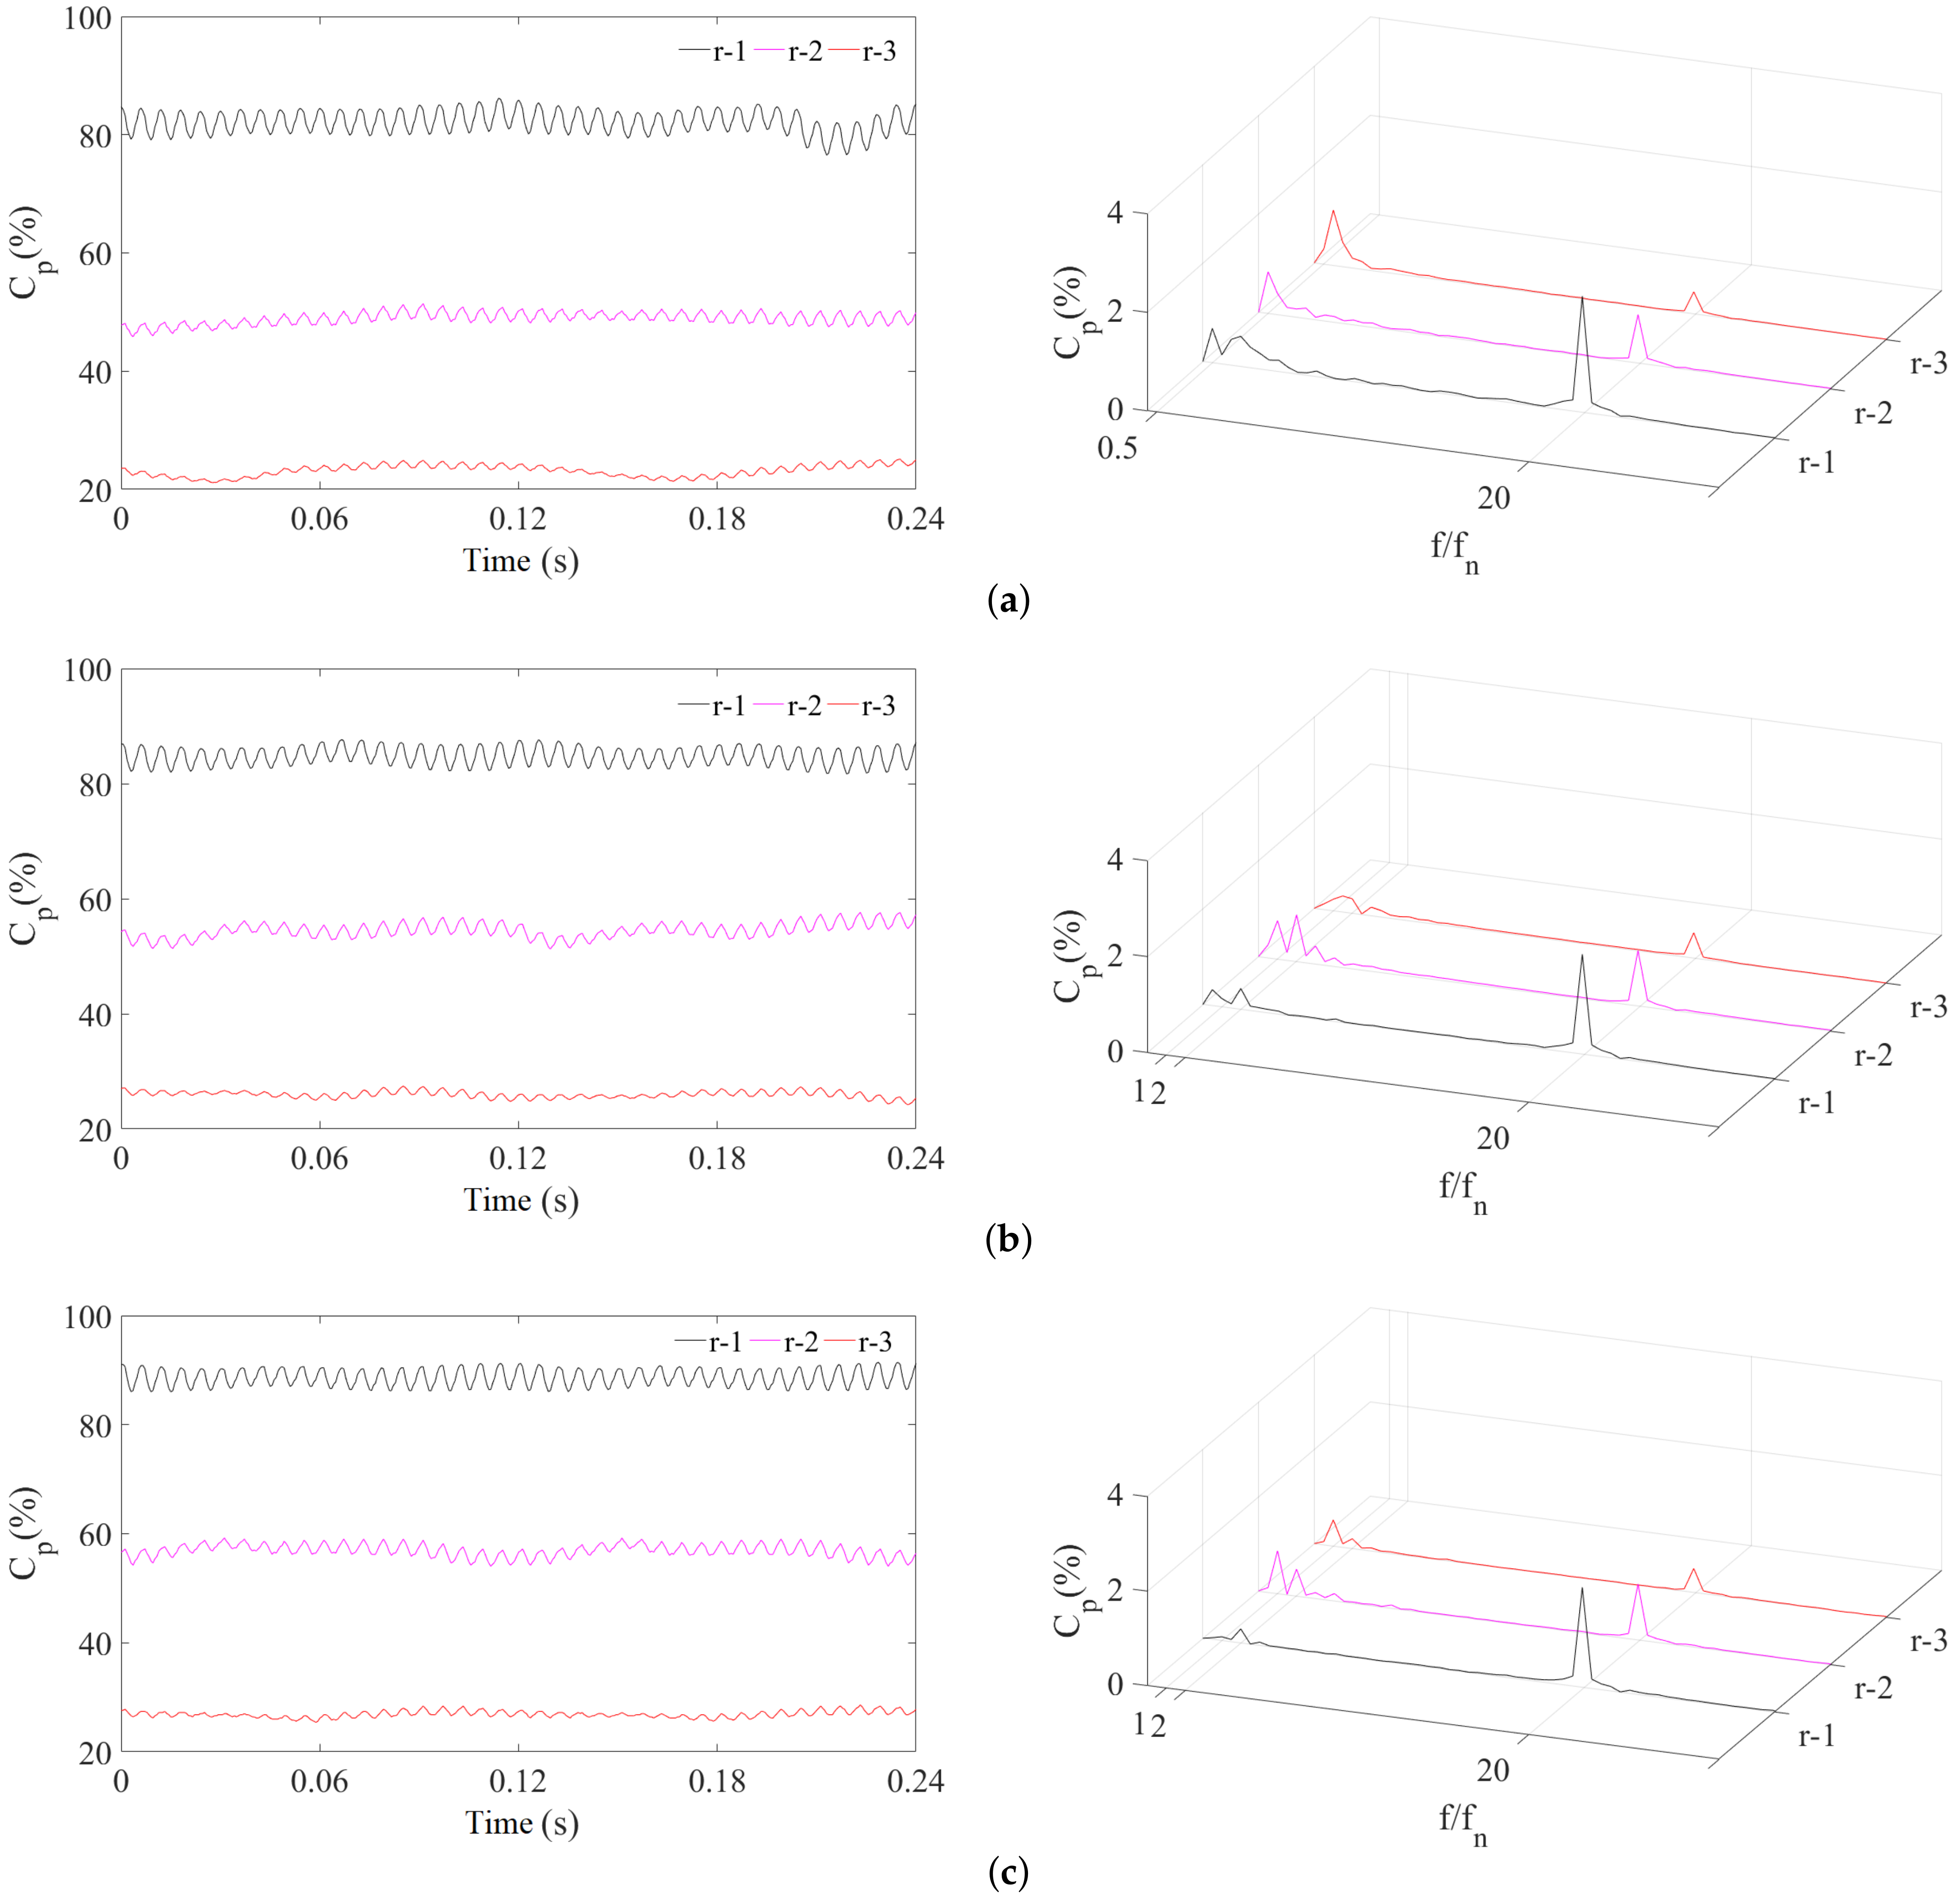
4.3.6. Pressure Fluctuations along Runner Passage Flow Direction

Three pressure monitoring points (r-1, r-2, and r-3) are arranged in the runner blade channel along the flow direction. Figure 19 shows the layout of the relative position of the monitoring points, which are located at the midpoint of the runner in the vertical height.
The time and frequency–domain diagrams of the pressure fluctuations are shown in Figure 20. According to Equation (19), the main frequency of the RSI-induced pressure fluctuations acting on the runner is 20 f n , and the pressure fluctuation amplitudes of 20 f n at 60% load are higher than 86.7% load and 100% load. The low-frequency components in the spectra of 86.7% load and 100% load correspond to the runner rotational frequency and its harmonics. At the part load condition of 60% load, the runner is also affected by the draft tube vortex, whose frequency is lower than the rotational frequency.
Figure 21 compares the low-frequency components and the pressure fluctuations of f / f n = 20 at various load cases. Since the pressure fluctuations of 20 f n on the runner are caused by the interference of the guide vanes, the amplitude of 20 f n for the measuring point close to the guide vane is larger than others far away from the guide vane, and the amplitude of 20 f n decreases along the runner flow channel.
The monitoring points in the runner also have peak values at the rotational frequency and its harmonics, which are mainly due to the pressure fluctuations caused by the rotation of the runner. At 60% load condition, the pressure fluctuations have a peak in the low-frequency band that is below the rotational frequency, and it is caused by the pressure waves of the draft tube vortex propagating from the draft tube to the upstream. However, the influence of the draft tube vortex on the pressure fluctuations in vaneless space is negligible under the other two load conditions.

5. Conclusions

In this investigation, the site measurement and numerical calculations of the prototype unit of the pump–turbine in turbine mode were carried out, and the rotor–stator interaction phenomenon under different working conditions in turbine mode was analysed in detail. The conclusions are listed below:
1.
The three-dimensional models of a prototype pump–turbine including clearances were built. The mesh independence analysis was conducted to eliminate the influence of numerical models on the calculation results. The calculated and measured operating parameters were compared, and the good agreement verified the reliability of the numerical calculation.
2.
The unsteady calculations of 60% load, 86.7% load, and 100% load conditions were performed to obtain the evolution law of pressure fluctuations in the vaneless space.
3.
Along the flow direction of the guide vane passage, 7 times and 14 times the rotational frequency of the pressure fluctuations in the vaneless space are disturbed by the rotation of the runner, and the corresponding peak values tend to increase from upstream to downstream. The pressure fluctuations of 21 times the frequency are formed by the interference between the runner rotation and the wake of the guide vane, so the amplitudes of 21 f n of the monitoring points are related to the distances to the runner blade leading edge and to the guide vane trailing edge.
4.
The pressure fluctuations along the vertical height direction in the vaneless space show high consistency at 86.7% load and 100% load conditions. At the low-load condition of 60% load, the low-frequency pressure waves caused by the intensive draft tube vortex propagate to the vaneless space and result in inconsistent pressure fluctuations in the vertical direction.
5.
The amplitudes of different frequency components of pressure fluctuations in the vaneless space along the circumferential direction show a different pattern. For the pressure fluctuations of 7 f n and 14 f n , the amplitudes are more evenly distributed along the circumferential direction. However, non-uniform pressure fluctuations of 21 f n in the circumferential direction are caused by the circumferential asymmetry of the spiral case and the stay ring.
6.
Different frequency components of pressure fluctuations along the runner channel can be observed. The dominant pressure fluctuation frequency induced by the RSI acting on the runner is 20 f n . The amplitudes of 20 f n at the low-load condition of 60% load are higher than those of 86.7% load and 100% load, and the amplitudes of 20 f n decrease along the runner flow channel from upstream to downstream. At 60% load, the low-frequency pressure waves generated by the draft tube vortex also propagate upstream and affect the pressure fluctuations in the runner blade passages.
7.
It is recommended to design the runner with inclined inlets to reduce the amplitudes of RSI-induced pressure fluctuations and to avoid operating the pump–turbine units under partial load for long periods of time to reduce the risk of pressure-fluctuation-induced severe vibration on the structures.

Author Contributions

Conceptualization, Z.W. and X.H.; methodology, Q.H. and X.H.; software, H.Y. and Q.H.; validation, H.Y. and M.Y.; investigation, H.Y., Q.H., X.H., M.Y. and H.B.; writing—original draft preparation, H.Y., Q.H. and X.H.; writing—review and editing, H.Y., Q.H., X.H., M.Y. and H.B.; supervision, Z.W. All authors have read and agreed to the published version of the manuscript.

Funding

This work was supported by National Natural Science Foundation of China (No.: 51876099).

Institutional Review Board Statement

Not applicable.

Informed Consent Statement

Not applicable.

Data Availability Statement

Not applicable.

Acknowledgments

The authors gratefully acknowledge the financial support of the project: Research on Lifetime Prediction of Non-rotating Parts of Pump–Turbine Unit Based on Rotor–Stator Interaction (RSI), Fluid–Structure Coupling and Fracture Mechanics—Research project on RSI mechanism and its Influence on Non-rotating Parts of Pump–Turbine Unit of Branch Company of Maintenance & Test, CSG Power Generation Co., Ltd.

Conflicts of Interest

The authors declare no conflict of interest.

Abbreviations

The following abbreviations are used in this manuscript:
CFDComputational fluid dynamics
PSPSPumped-storage power station
RANSReynolds-averaged Navier–Stokes
PIVParticle image velocimetry
PTPump–turbine
RSIRotor–stator interaction
SSTShear stress transport

References

  1. Frunzăverdel, D.; Muntean, S.; Mărginean, G.; Câmpiani, V.; Marşavina, L.; Terzi, R.; Şerban, V. Failure analysis of a Francis turbine runner. IOP Conf. Ser. Earth Environ. Sci. 2010, 12, 012115. [Google Scholar] [CrossRef]
  2. Egusquiza, E.; Valero, C.; Huang, X.; Jou, E.; Guardo-Zabaleta, A.; Rodriguez, C. Failure investigation of a large pump–turbine runner. Eng. Fail. Anal. 2012, 23, 27–34. [Google Scholar] [CrossRef] [Green Version]
  3. Guillaume, R.; Deniau, J.L.; Scolaro, D.; Colombet, C. Influence of rotor-stator interaction on the dynamic stresses of Francis runners. In Proceedings of the 26th IAHR Symposium on Hydraulic Machinery and Systems, Beijing, China, 19–23 August 2012; Volume 15, p. 052011. [Google Scholar] [CrossRef]
  4. Flores-Domínguez, M.; Urquiza, G.; Rodríguez, J. A Fatigue Analysis of a Hydraulic Francis Turbine Runner. World J. Mech. 2012, 2, 28–34. [Google Scholar] [CrossRef] [Green Version]
  5. Dorji, U.; Ghomashchi, R. Hydro turbine failure mechanisms: An overview. Eng. Fail. Anal. 2014, 44, 136–147. [Google Scholar] [CrossRef]
  6. Huang, X.; Chamberland-Lauzon, J.; Oram, C.; Klopfer, A.; Ruchonnet, N. Fatigue analyses of the prototype Francis runners based on site measurements and simulations. IOP Conf. Ser. Earth Environ. Sci. 2014, 22, 012014. [Google Scholar] [CrossRef] [Green Version]
  7. Egusquiza, E.; Valero, C.; Presas, A.; Huang, X.; Guardo, A.; Seidel, U. Analysis of the dynamic response of pump-turbine impellers. Influence of the rotor. Mech. Syst. Signal Process. 2015, 68, 330–341. [Google Scholar] [CrossRef]
  8. Lyutov, A.; Kryukov, A.; Cherny, S.; Chirkov, D.; Salienko, A.; Skorospelov, V.; Turuk, P. Modelling of a Francis Turbine Runner Fatigue Failure Process Caused by Fluid-Structure Interaction. IOP Conf. Ser. Earth Environ. Sci. 2016, 49, 072012. [Google Scholar] [CrossRef] [Green Version]
  9. Luna-Ramírez, A.; Campos-Amezcua, A.; Dorantes-Gómez, O.; Mazur-Czerwie, Z.; Muñoz-Quezada, R. Failure analysis of runner blades in a Francis hydraulic turbine—Case study. Eng. Fail. Anal. 2016, 59, 314–325. [Google Scholar] [CrossRef]
  10. Ghomashchi, R. Justification of the hydraulic turbines lifetime from the standpoint of the fracture mechanics. Procedia Struct. Integr. 2018, 13, 971–975. [Google Scholar] [CrossRef]
  11. Salary, A.; Verlinski, S.; Levonyan, H.; Tyagunov, A.; Tarasov, D. Fluid structure interaction analysis on failure of Francis turbine runner blades. Arpn J. Eng. Appl. Sci. 2018, 13, 1906–1911. [Google Scholar]
  12. Nicolet, C.; Ruchonnet, N.; Avellan, F. One-Dimensional Modeling of Rotor Stator Interaction in Francis pump–turbine. In Proceedings of the 11th International Symposium on Transport Phenomena and Dynamics of Rotating Machinery, ISROMAC-11.2, Honolulu, HI, USA, 6 February–2 March 2006. [Google Scholar]
  13. Nicolet, C.; Ruchonnet, N.; Alligne, S.; Koutnik, J.; Avellan, F. Hydroacoustic Simulation of Rotor-Stator Interaction in Resonance Conditions in Francis Pump-Turbine. In Proceedings of the 25th IAHR Symposium on Hydraulic Machinery and Systems, Timişoara, Romania, 20–24 September 2010; Volume 12. [Google Scholar] [CrossRef]
  14. Minakov, A.V.; Platonov, D.V.; Dekterev, A.A.; Sentyabov, A.V.; Zakharov, A.V. The numerical simulation of low frequency pressure pulsations in the high-head Francis turbine. Comput. Fluids 2015, 111, 197–205. [Google Scholar] [CrossRef]
  15. Franke, G.; Fischer, R.; Powell, C.; Seidel, U.; Koutnik, J. On pressure mode shapes arising from rotor/stator interactions. Sound Vib. 2005, 39, 14–18. [Google Scholar]
  16. Dan, C.G.; Jean-Louis, K. Experimental Analysis of the rotor–stator Interaction in a pump–turbine. In Proceedings of the 23rd IAHR Symposium on Hydraulic Machinery and Systems, Yokohama, Japan, 17–21 October 2006. [Google Scholar]
  17. Zobeiri, A.; Kueny, J.; Farhat, M.; Avellan, F. Pump-Turbine Rotor-Stator Interaction in Generating Mode: Pressure Fluctuation in Distributor Channel. In Proceedings of the 23rd IAHR Symposium on Hydraulic Machinery and Systems, Yokohama, Japan, 17–21 October 2006. [Google Scholar]
  18. Li, D.Y.; Gong, R.Z.; Wang, H.J.; Wei, X.Z.; Liu, Z.S.; Qin, D.Q. Analysis of Rotor–Stator Interaction in Turbine Mode of a Pump–Turbine Model. J. Appl. Fluid Mech. 2016, 9, 2559–2568. [Google Scholar] [CrossRef]
  19. Hasmatuchi, V.; Farhat, M.; Roth, S.; Botero, F.; Avellan, F. Hydrodynamics of a Pump-Turbine Operating at Off-Design Conditions in Generating Mode: Experimental Investigation. In Proceedings of the Conference: SHF Conference on Cavitation & Hydraulic Machines, EPFL, Lausanne, Switzerland, 26–27 May 2011. [Google Scholar]
  20. Liu, B.; Wang, H.; Liu, H.; Yu, H.; Jiang, H.; Chen, M. Experimental Investigation of Unsteady Flow Field in the Tip Region of an Axial Compressor Rotor Passage at Near Stall Condition With Stereoscopic Particle Image Velocimetry. J. Turbomach. 2004, 126, 360–374. [Google Scholar] [CrossRef]
  21. Chow, Y.; Uzol, O.; Katz, J. Flow Nonuniformities and Turbulent “Hot Spots” Due to Wake-Blade and Wake-Wake Interactions in a Multi-Stage Turbomachine. J. Turbomach. 2002, 124, 553–563. [Google Scholar] [CrossRef]
  22. Hasmatuchi, V.; Roth, S.; Botero, F.; Avellan, F.; Farhat, M. High-speed flow visualization in a pump-turbine under off-design operating conditions. IOP Conf. Ser. Earth Environ. Sci. 2010, 12, 012059. [Google Scholar] [CrossRef]
  23. Presas, A.; Luo, Y.; Wang, Z.; Guo, B. Fatigue life estimation of Francis turbines based on experimental strain measurements: Review of the actual data and future trends. Renew. Sustain. Energy Rev. 2019, 102, 96–110. [Google Scholar] [CrossRef]
  24. Huang, X.; Oram, C.; Sick, M. Static and dynamic stress analyses of the prototype high head Francis runner based on site measurement. IOP Conf. Ser. Earth Environ. Sci. 2014, 22, 032052. [Google Scholar] [CrossRef] [Green Version]
  25. Rodriguez, C.; Mateos-Prieto, B.; Egusquiza, E. Monitoring of Rotor-Stator Interaction in Pump-Turbine Using Vibrations Measured with On-Board Sensors Rotating with Shaft. Shock Vib. 2014, 2014, 276796. [Google Scholar] [CrossRef] [Green Version]
  26. Agnalt, E.; Iliev, I.; Solemslie, B.W.; Dahlhaug, O.G. On the Rotor Stator Interaction Effects of Low Specific Speed Francis Turbines. Int. J. Rotating Mach. 2019, 2019, 5375149. [Google Scholar] [CrossRef]
  27. Zuo, Z.; Liu, S.; Sun, Y.; Wu, Y. Pressure fluctuations in the vaneless space of High-head pump-turbines—A review. Renew. Sustain. Energy Rev. 2015, 41, 965–974. [Google Scholar] [CrossRef]
  28. Hu, J.; Yang, J.; Zeng, W.; Yang, J. Effect of the Speed Factor On the Amplitude of the Blade Passing Frequency in the Vaneless Space of a Pump Turbine in Turbine Mode. J. Fluids Eng. 2021, 143, 111203. [Google Scholar] [CrossRef]
  29. Tanaka, H. Vibration Behavior and Dynamic Stress of Runners of Very High Head Reversible Pump-turbines. Int. J. Fluid Mach. Syst. 2011, 4, 289–306. [Google Scholar] [CrossRef]
  30. Lais, S.; Liang, Q.; Henggeler, U.; Weiss, T.; Escaler, X.; Egusquiza, E. Dynamic Analysis of Francis Runners—Experiment and Numerical Simulation. Int. J. Fluid Mach. Syst. 2009, 2, 303–314. [Google Scholar] [CrossRef] [Green Version]
Figure 1. Three-dimensional model of the investigated pump–turbine (PT) unit.
Energies 15 05523 g001
Figure 2. Pressure transducer location in the sectional view of the flow channel.
Energies 15 05523 g002
Figure 3. Field measurement results of pressure fluctuations in the vaneless space at three load conditions. (a) 60% load. (b) 86.7% load. (c) 100% load.
Energies 15 05523 g003
Figure 4. Mesh of the spiral case and stay vanes domains.
Energies 15 05523 g004
Figure 5. Mesh of the runner domain.
Energies 15 05523 g005
Figure 6. Meshes of the guide vane domain (left) and the upper and lower labyrinth seals (right).
Energies 15 05523 g006
Figure 7. Mesh of the draft tube domain.
Energies 15 05523 g007
Figure 8. Mesh independence analysis.
Energies 15 05523 g008
Figure 9. Efficiency comparison between calculation and measurement.
Energies 15 05523 g009
Figure 10. Velocity and pressure distributions in the middle section of the turbine flow channel under different loads in turbine mode. (a) 60% load condition. (b) 86.7% load condition. (c) 100% load condition.
Energies 15 05523 g010
Figure 11. Layout of pressure-monitoring points for numerical calculations. (a) Monitoring points along the circumference. (b) Along passage of guide vane. (c) Along vertical heights.
Energies 15 05523 g011aEnergies 15 05523 g011b
Figure 12. Comparison between the calculated and measured results.
Energies 15 05523 g012
Figure 13. Time–domain and frequency–domain diagrams of pressure fluctuations of the monitoring points along the flow direction in guide vane passage. (a) 60% load condition. (b) 86.7% load condition. (c) 100% load condition.
Energies 15 05523 g013
Figure 14. Amplitudes of pressure fluctuations at the monitoring points along the flow direction in guide vane passage. (a) 60% load condition. (b) 86.7% load condition. (c) 100% load condition.
Energies 15 05523 g014
Figure 15. Time–domain and frequency–domain diagrams of pressure fluctuations of the monitoring points along with the vertical height. (a) 60% load condition. (b) 86.7% load condition. (c) 100% load condition.
Energies 15 05523 g015aEnergies 15 05523 g015b
Figure 16. Amplitudes of pressure fluctuations at the monitoring points along with the vertical height. (a) 60% load condition. (b) 86.7% load condition. (c) 100% load condition.
Energies 15 05523 g016
Figure 17. Time–domain and frequency–domain diagrams of pressure fluctuations of the monitoring points along the circumferential direction. (a) 60% load condition. (b) 86.7% load condition. (c) 100% load condition.
Energies 15 05523 g017aEnergies 15 05523 g017b
Figure 18. Polar diagram of the amplitudes of pressure fluctuations of the monitoring points along the circumferential direction. (a) f / f n = 7 . (b) f / f n = 14 . (c) f / f n = 21 .
Energies 15 05523 g018aEnergies 15 05523 g018b
Figure 19. Relative position of pressure monitoring points in runner.
Energies 15 05523 g019
Figure 20. Time–domain and frequency–domain diagrams of pressure fluctuations of the monitoring points along the runner passage. (a) 60% load condition. (b) 86.7% load condition. (c) 100% load condition.
Energies 15 05523 g020
Figure 21. Amplitudes of pressure fluctuations at the monitoring points along the runner passage. (a) 60% load condition. (b) 86.7% load condition. (c) 100% load condition.
Energies 15 05523 g021
Table 1. Basic parameters of the pump–turbine (PT) unit.
ParametersValues
Rated power P r 300 MW
Rated head H r 510 m
Rated rotational speed n r 500 rpm
Rated rotational frequency f n 8.33 Hz
Runner diameter D 1 3.9 m
Dimensionless specific speed N s 220
Number of runner blades N b 7
Number of guide vanes N g v 20
Number of stay vanes N s v 20
Table 2. Measurement parameters of the pressure transducer.
LocationInstrumentModelRangeAccuracy Class
Vaneless spacePressure transducerMPM48010 MPa0.2
Table 3. Comparison between the calculated and measured results ( f / f n = 21 ).
Load ConditionsMeasured C p /%Calculated C p /%Error (%)
60% load0.8051.00219.7
86.7% load0.9741.0809.8
100% load0.9331.12316.9
Publisher’s Note: MDPI stays neutral with regard to jurisdictional claims in published maps and institutional affiliations.

