1. Introduction
Hydrogen is a significant energy carrier that can store renewable energy seasonally [
1]. Hydrogen is primarily produced by steam reforming of fossil hydrocarbons. Hydrogen production is energy intensive. It must be produced using renewable resources for sustainability. Renewable energy such as solar can be stored by hydrogen evolution from water or biomass. However, the solar-to-hydrogen evolution rate is far from competitive against conventional steam reforming with or without carbon capture, utilisation, and storage (CCUS) and is an intractable challenge. This study proposes a hybrid photocatalytic and biosynthesis system for an efficient solar-to-hydrogen evolution.
Fossil-independent hydrogen energy carriers and CCUS are significant for net-zero goals; however, they are energy-intensive. Photocatalytic hydrogen evolution reaction (HER) can produce fossil-independent green hydrogen. Using low-value lignocellulosic feedstocks in photocatalytic HER, the hydrogen evolved can be stored in the carbon dioxide (CO2) fixing cycle by a photosynthetic organism, Ralstonia eutropha, leading to an energy-efficient hybrid HER and bioproduct synthesis system. A novel integrated strategy couples photocatalytic HER from biomass (fossil-independent unavoidable non-food organic waste resources), water-splitting, and hydrogen storage in the CO2-fixing Calvin–Benson–Bassham (CBB) autotrophic metabolism of R. eutropha. Biosynthesis by CO2 fixation includes the production of poly(3-hydroxybutyrate) (PHB), a high-quality biocompatible polymer with implanted medical device applications.
Liu et al. examined the Co–P alloy cathode to drive HER and the CoP
i catalytic anode to drive the
oxygen evolution reaction (OER) [
2]. Photoexcited cobalt ions (Co
2+) generated an applied potential of +2.2 V that split water to reduce CO
2 by
R. eutropha, producing PHB and fusel alcohols. The engineered wildtype H16 strain interfaced with the Co-P/CoP
i catalytic system drove CO
2 fixation to biosynthesis in a nutrient-starved environment. Furthermore, a composite of 4 wt.% CoP with Mn
0.5Cd
0.5S was shown to have a higher HER than Co-P [
3]. Its bandgap was +1.73 V (versus normal hydrogen electrode (NHE) at pH = 0) [
3]. Lowering the cobalt concentration enhanced biocompatibility [
2] and reduced the unethical sourcing from informal wageless settings [
4]. CdS with a bandgap of +2.4 V (vs. the standard hydrogen electrode (SHE) at pH = 0) is the primary semiconductor in photocatalytic water-splitting [
5]. Its conduction band at –0.5 V (vs. NHE at pH = 0) and valence band at +1.9 V (vs. NHE at pH = 0) are sufficient for HER and oxidising lignocelluloses [
6,
7]. Given the correct band positions of the coupled photocatalysts and compatible redox charge mediator choice (usually, Fe
3+/Fe
2+ and
I
– with +0.77 V and +1.09 V vs. SHE at pH = 0), the highest apparent quantum yield (ratio of the photon emitted to the photon absorbed) obtained is 6.8% in the Z-scheme photocatalytic water-splitting system with a solar-to-hydrogen efficiency of less than 10% [
5].
Improvements in the existing water-splitting biosynthetic systems are possible through the choice of photocatalyst and the addition of biomass as a substrate, as evaluated through H
2 evolution and CO
2 storage efficiencies in this study. Although photocatalytic water-splitting biosynthesis [
2] and photocatalytic lignocellulosic reforming [
6,
7] systems have been investigated, their integration has not been explored. Thus, this paper studies the proof of principle of the novel integration of photocatalytic HER and hydrogen storage in the CO
2-fixing CBB autotrophic metabolism of
R. eutropha. The methodology involves mechanistic and process performance analyses in the pursuit of material guidance.
The paper is structured as follows: the literature review primarily comprises experimental investigations as there is no theoretical study reported so far. The methodology discussed thereafter draws on insights from experimental studies to develop a novel and generic mechanistic model of the system comprising HER and biosynthesis. The results and discussion analyse the theoretical maximum yield of hydrogen and the theoretical maximum efficiencies of solar-to-CO2 fixation and solar-to-hydrogen generation. The final section concludes the study findings.
2. Literature Review of Experimental Evidence
Photocatalyst/semiconductor choices: The OER photocatalysts with a bandgap of +2 V to +3 V (vs. SHE at pH = 0) and the HER photocatalysts with a bandgap of –1 V to –2.2 V (vs. SHE at pH = 0) are shown in
Table 1. Only a few semiconducting materials have been reported supporting photocatalytic water-splitting: CdS, CdSe, TaON, Ta
3N
5, and g-C
3N
4, with a bandgap of 1.7–2.7 eV [
5].
Physical and electrochemical characterisations of CdS photocatalysts: CdS nanomaterials have proven their application for photocatalytic water-splitting, while also utilising organic as a sacrificial agent or oxidising substrate. The UV/Vis diffuse reflectance spectra were compared between pure CdS and various catalyst coated/deposited CdS. The intrinsic bandgap of CdS remained unchanged, suggesting that the catalyst does not substitute Cd in CdS lattice and is only deposited by modifying the surface of the photocatalyst. The absorption intensity in the visible region increased with the increase in the deposited Pt catalyst on CdS starting at 530 nm [
8]. MoSe
2/CdS composites also showed an absorption edge at around 520 nm, corresponding to a bandgap of about 2.4 eV [
9]. The absorption edge of CdS did not shift with MoSe
2 loading, inferring that the MoSe
2/CdS composites retained the intrinsic bandgap of CdS. The absorption intensity increased in the visible-light region, making the composites more efficient than pure CdS. More Pt or MoSe
2 or CdO
x catalyst nanoparticles were exposed to the surface of the samples; hence, a stronger absorption intensity was observed due to the surface deposition of the catalyst. The absorption edge for pure g-C
3N
4 was about 460 nm, ascribed to a bandgap of 2.7 eV, while pure CdS nanorods exhibited a sharp absorption edge at around 530 nm, corresponding to a bandgap of 2.3 eV [
10]. The absorption spectrum of CdS/g-C
3N
4 crisscrossed silicon nanorods showed enhanced light absorption intensity in the 530–650 nm visible range, attributed to the interactions between CdS and g-C
3N
4. CdS nanocrystals and Ni@NiO nanoparticles grown on the surface of g-C
3N
4 showed a remarkable increase in absorbance in the visible region 450–700 nm [
11]. Compared with pure CdS and CoFe
2O
4, the hybrid nanocomposite CdS/CoFe
2O
4/rGO showed much stronger absorption at all wavelengths 200–800 nm with the estimated bandgap of 1.58 eV [
12]. CdS nanoparticle/CeO
2 nanorod composites also showed a lower absorption edge than CdS and increased absorbance than CeO
2 [
13]. The TiO
2 nanorod/CdS nanoparticle composites showed an absorption edge of 428 nm, 435 nm, 486 nm, and 442 nm for the composites with 20%, 30%, 40%, and 50% TiO
2 contents. The corresponding bandgap energies (eV) were 2.89, 2.85, 2.55, and 2.81. The absorption spectrum of the TiO
2 (40%) @CdS was 400–780 nm [
14]. ZnO–Au@CdS core–shell nanorod arrays also showed higher absorbance and lower absorption onset (400 nm) than their corresponding binary nanocomposites [
15]. As a result of broadening the hybrid structure, the visible-light range absorbance, solar energy utilisation efficiency, electron–hole pair separation, and hydrogen evolution efficiency were increased.
Only a few studies used transmission electron microscopy (TEM), X-ray photoelectron spectroscopy (XPS), X-ray diffraction, and Raman spectroscopy of CdS and composites to characterise the materials. Ligand-free CdS quantum dots, with a diameter of ~5 nm, were used to prepare CdS/CdO
x, which showed a decrease in particle size by 0.6 nm and a change in surface charge, indicating Cd–O
− formation on the particle surface [
6]. Pure CdS nanoparticles were found in aggregated forms of 10–20 nm [
7]; due to the small size and surface effect, CdS nanoparticles were combined [
12]. CdS nanorods with a length of 200–500 nm and a diameter of 60 nm prepared by the solvothermal process were characterised by field-emission scanning electron microscopy (FESEM) [
8]. Furthermore, the TEM analysis of 0.5 wt.% Pt/CdS showed a uniform dispersion of Pt catalyst with an average size of 1.75 nm on the CdS nanorod surface [
8].
The XPS analysis of the Cd (3
d) region of CdS quantum dots showed an expected lowering of binding energy (eV) with increasing strength of KOH from neutral to 10 M, and from 405 and 412 to 404 and 411 for the Cd 3
d5/2 and 3
d3/2 regions in CdS
27, after isolation from the aqueous solution containing KOH [
6]. The XPS peaks of Cd 3
d, Si 2
p, and O 1
s orbitals showed lower binding energies in the CdO
x/CdS/SiC composite than in CdS/SiC composite [
7]. The lower binding energy in the former was expected due to the CdO/Cd(OH)
2 environments, indicating some Cd–S bond conversions into Cd–O bonds. The XPS analysis of the Cd (3
d) orbital in the pure CdS in [
8] was very similar to that in [
6], with Cd 3
d5/2 and 3
d3/2 peaks located at the binding energies (eV) of 404.5 and 411.3. These peaks were 404.7 eV and 411.5 eV in the case of 0.5 wt.% Pt/CdS. The peak separation was the same in the two cases of pure CdS and 0.5 wt.% Pt/CdS. Such electron migrations occurred for the Fermi-level equilibrium from the n-type CdS semiconductor ranging from a Fermi level of −0.9 V (vs. NHE) to the metallic Pt with a Fermi level of +1.0 V (vs. NHE) [
8]. Furthermore, XRD analysis showed no change in the position and width of diffraction peaks between the pure CdS and 0.5 wt.% Pt/CdS [
8]. Thus, the phase structure and crystallinity of hexagonal CdS did not change in the sonochemical Pt deposition process. Moreover, the characteristic diffraction peaks of metallic Pt could not be detected even with its high loading, suggesting high Pt dispersion on CdS. The Raman spectroscopy gave characteristic Raman peaks of 300 cm
−1, 600 cm
−1, and 900 cm
−1 that remained intact in CdS/CeO
2 (1:1) composite [
13] and TiO
2 nanorods–CdS nanoparticles [
14], maintaining their crystalline structures. Furthermore, the two vibrational bands were assigned to scattering and double scattering on the longitudinal optical phonon of CdS [
6]. Because of CdO
x, the two bands were located at 260 cm
−1 and 292 cm
−1, and the scattering peak on the low-frequency side was also broadened.
Table 2 shows the UV/Vis diffuse reflectance spectra, binding energy from the XPS analysis, and Raman shift of the most promising CdS semiconductor systems.
Photocatalytic hydrogen yields:Figure 1 shows the highest set of photocatalytic hydrogen evolution rates (>0.36 mmol
·h
−1) using CdS-based semiconductors [
6,
7,
8,
9,
11,
13].
Only two studies concerning CdS photocatalyst showed hydrogen evolution from lignocelluloses greater than 0.36 mmol
·h
−1 [
6,
7]. An organic waste substrate could elude reactive oxygen species in the recombination cycle in HER [
7]. The substrate was a low- or no-cost, easily oxidised fossil-free organic waste, using residue resources, such as unavoidable non-food cellulosic and lignocellulosic resources [
16,
17]. CdS/CdO
x quantum dots were prepared with semiconducting CdS at the core with CdO
x surface coating to avoid photocorrosion and provide enough of a valence band to oxidise lignocelluloses [
6].
The hydrogen evolution using CdS/CdO
x quantum dots (0.5 µM) in 2 mL of 10 M KOH from 50 mg·mL
−1 α-cellulose, 0.1 M glucose, 25 mg·mL
−1 hemicellulose, 0.25 mg·mL
−1 lignin, 50 mg·m:
−1 fresh lignocellulose (wood, bagasse, sawdust, and grass), and 50 mg·mL
−1 waste lignocellulose (waste paper, cardboard and newspaper) (in mmol·
·h
−1) was 4.4, 2, 0.26, >5, and 1–9, respectively [
6]. Hydrogen evolution using Pt 0.5 wt.%-deposited CdO
x/CdS/SiC (50 mg) in 100 mg of α-cellulose and 5 mL of 10 M NaOH was 361.5 µmol
·h
−1 [
7]. Under the same conditions, the hydrogen evolution from albumin and keratin (100 mg) was 654.2 and 446.3 µmol
·h
−1. The studies agreed on lignocellulose pre-treatment and neutralisation in situ or a one-pot 10 M KOH/NaOH solution [
6,
7], decomposing (1–4)-glycosidic bonds [
16], releasing accessible sugar monomers or monosaccharides [
16] to form Cd–O–R bonds with the CdS/CdO
x surface [
6], and leading to
in oxidised carboxylic acid products [
6,
7,
18] (shown in Equations (5)–(6) and (5a)–(6b)).
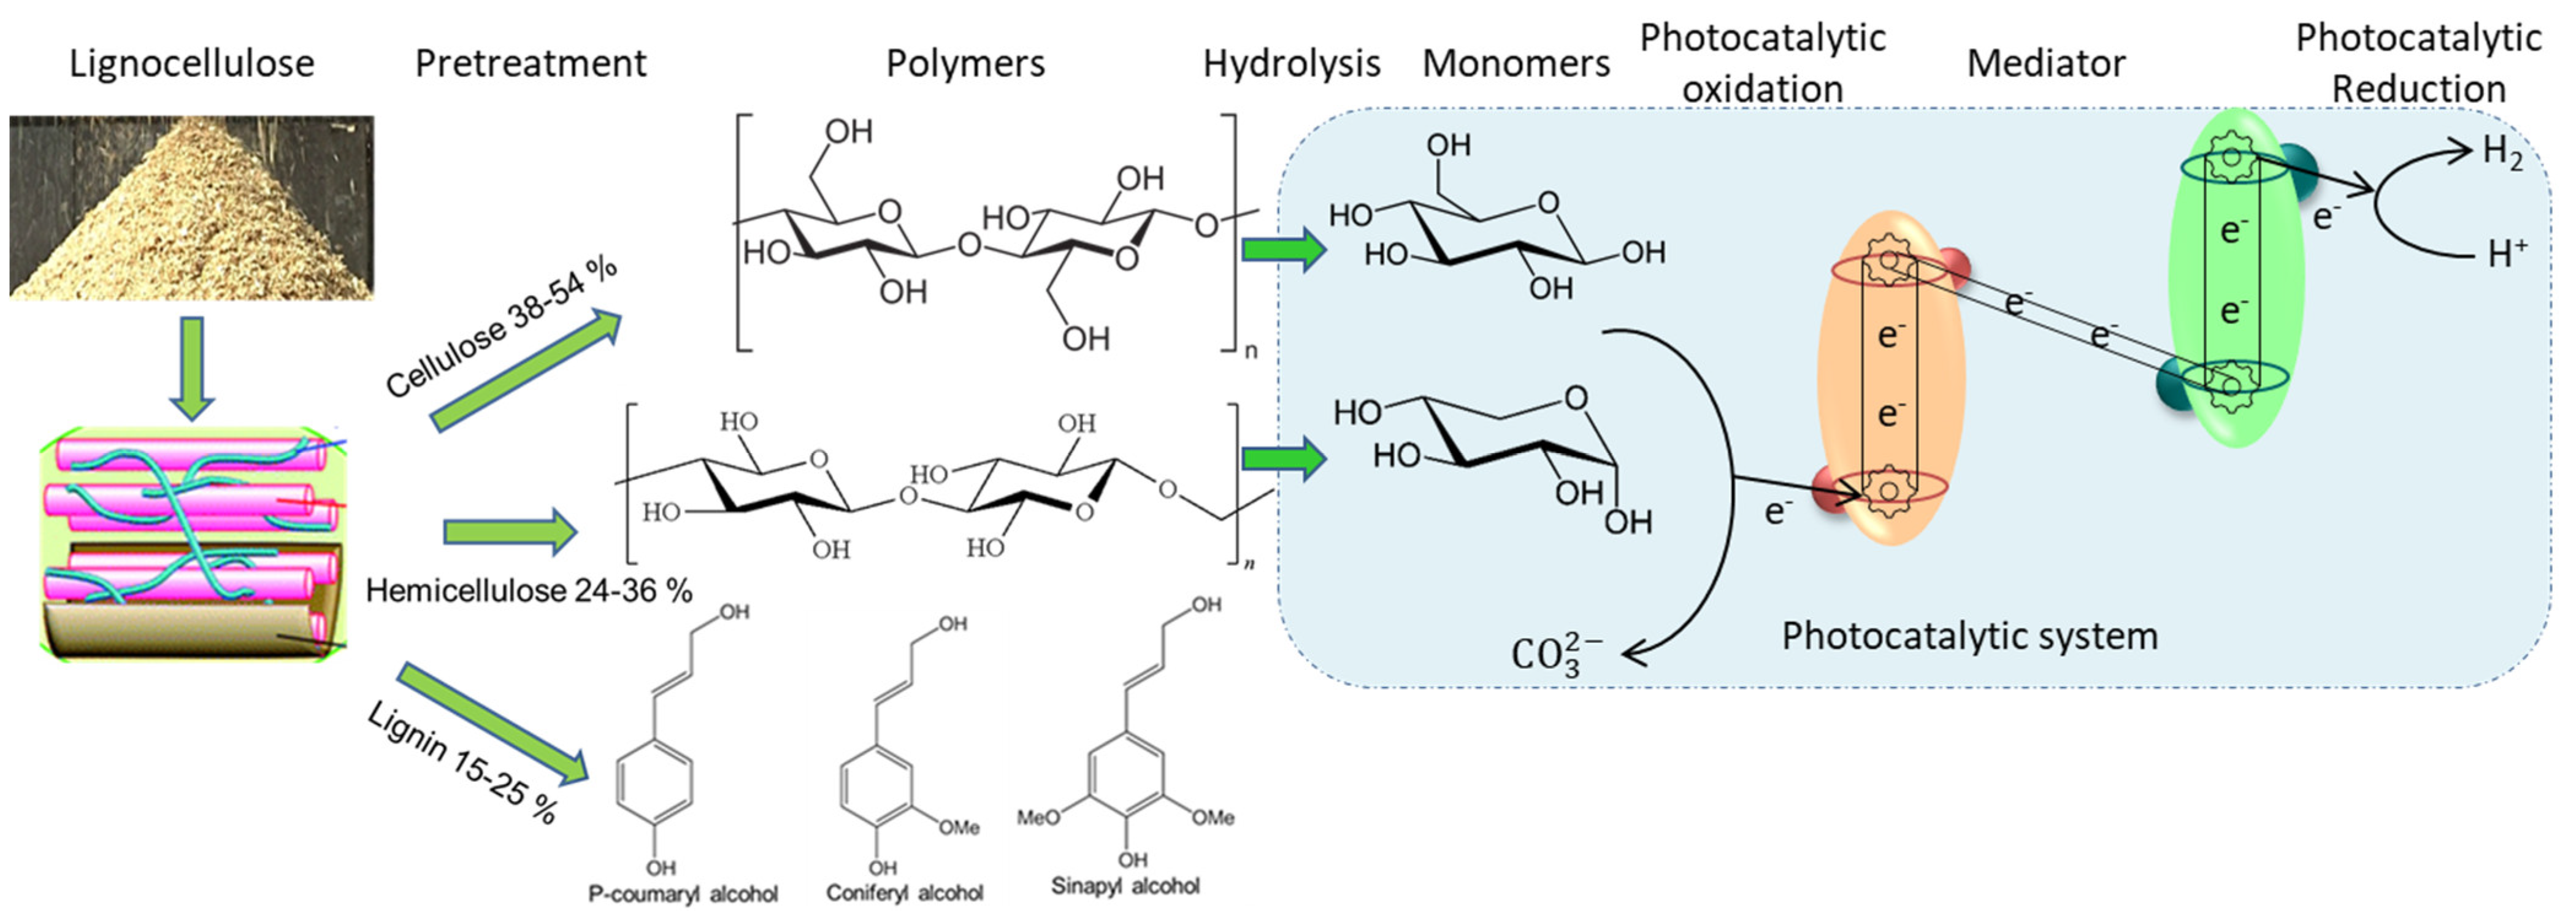
3. Materials and Methods
This study proposes the integrated photocatalytic bio-electrosynthesis system configuration shown in
Figure 2 and derives the mechanistic model for mass and energy balances across the system, as discussed below. The proposed mechanistic model is generic and can be applied to all experimental studies and novel approaches.
Photocatalytic HER mechanism: Semiconductor materials with a photocatalytic surface coating absorb photon energy. The absorbed solar energy can harvest protons and electrons from water and other resources, e.g., biomass. A dual photocatalytic system consists of an oxygen evolution photocatalytic semiconductor and a hydrogen evolution photocatalytic semiconductor. The Z-scheme photocatalytic system mechanism and lignocellulose decomposition are illustrated in
Figure 3.
The photoexcited electron in the oxygen evolution photocatalyst (OEP) jumps the bandgap, leaving positively charged holes in the valence band of the oxygen evolution photocatalyst (Equation (1)).
A mediator transmits electrons from the oxygen evolution photocatalyst through redox (electron acceptor–electron donor) to the hydrogen evolution photocatalyst (Equation (2)).
The photoexcited electron in the hydrogen evolution photocatalyst (HEP) jumps the bandgap, leaving positively charged holes in the conduction band of the hydrogen evolution photocatalyst, inducing continuous harvesting of electrons from the substrate/water resource (Equation (3)).
The photoexcited electron in the conduction band of the hydrogen evolution photocatalyst reduces protons harvested from the substrate/water resource (Equation (4)).
Equation (5) shows an instance of α-cellulose (substrate) hydrolysis to depolymerisation into glucose monomers. The photoinduced positively charged holes in the valence band of the oxygen evolution photocatalyst oxidise the monomers and water into carbonates and harvested protons, relaying a continuous flow of electrons (Equation (6)) (
Figure 3). Equations (5a) and (6a) show the photocatalytic decomposition and oxidation of hemicelluloses. Thus, the combined complete generic photocatalytic oxidation reaction of organic substrates and photo-electrolytic hydrogen evolution is shown in Equations (6b–6c). Equation (6b) corroborates that the end-product of complete lignocellulosic oxidation is H
2CO
3, while Equation (6c) corroborates that the end-product of complete lignocellulosic oxidation is
, as observed in [
6,
7,
18].
Biosynthesis mechanism: Produced hydrogen can be stored alongside atmospheric CO
2 by autotrophic metabolic biosynthesis, thus preventing recombination of e
– and h
+. The Z-scheme dual photocatalyst system comprises an oxygen evolution photocatalytic semiconductor, an electron relaying mediator, and a hydrogen evolution photocatalytic semiconductor, acting as an anode (
Figure 3), interfaced with a biocathode to integrate biosynthesis (
Figure 4). Integration of biosynthesis stores the evolved hydrogen, helping the flow of photoexcited electrons (
Figure 2).
The CBB metabolism is a prevailing route to biosynthesis. Ribulose-1,5-bisphosphate and atmospheric CO
2 with energy inputs from ATP (adenosine triphosphate) and NAD(P)H (nicotinamide adenine dinucleotide phosphate) are converted into glyceraldehyde 3-phosphate (Equations (7) and (8)). Glyceraldehyde 3-phosphate produced gives back ribulose-1,5-bisphosphate and glucose, which, through acyl-CoA and acetyl-CoA, by concerted actions of β-ketoacyl-CoA thiolase and acetoacetyl-CoA reductase, is reduced into 3-hydroxybutyric acid, polymerised by PHB polymerase into PHB (Equations (9)–(11)).
4. Results and Discussion
This section has two subsections focusing on the theoretical hydrogen yield from lignocellulosic composition using the photocatalytic HER mechanism shown in Equations (1)–(6), and the overall hydrogen and CO2 fixing efficiencies using the biosynthesis mechanism shown in Equations (7)–(11). It must be noted that the mechanisms in Equations (1)–(11) are generic. Thus, instead of focusing on one case, the equations are applied for mass and energy balance calculations to focus on the highest hydrogen yield and the highest efficiencies of solar-to-CO2 fixation and solar-to-hydrogen generation.
Photocatalytic hydrogen yield: The ratio of hydrogen in the product and hydrogen in the reacted biomass is obtained from Equation (6b),
, where
x,
y, and
z indicate the number of C, H, and O atoms in one mole of the converted biomass. For example, for α-cellulose,
x = 6,
y = 10, and
z = 5, the hydrogen yield (based on carbonic acid as the oxidation product of the converted α-cellulose) is 2.4 (
Table 3). The ratio of hydrogen in the product and hydrogen in the participating water is obtained from Equation (6b),
. For lignin (1), modelled as phenol,
x = 6,
y = 6, and
z = 1, the hydrogen yield from reacted water is 0.82 (
Table 3). The weighted average hydrogen yield is applied for lignocelluloses (1)–(3). With the aqueous solution containing 10 M KOH/NaOH,
is observed [
6,
7]. In that case, hydrogen yield from reacted biomass and water is
and
, leading to all hydrogen evolution from the reacted biomass and water (Equation (6c)). Thus, in the case of the converted α-cellulose’s complete oxidation into
, hydrogen yield from the reacted biomass and water is
and
. The α-cellulose releases 2.6 times more hydrogen than water, given by the ratio
(Equation (6c)). Equations (6b,c) show 24 harvested electrons per mole of α-cellulose.
Table 3 shows the contributions of biomass and water in HER (Equation (6b)).
A linear profile is obtained between the harvested number of electrons (
y) from the studied (converted) biomass and the harvested number of protons (
) from (participating) water under the complete oxidation conditions (Equations (6b) and (6c)), as shown in
Figure 5. Lignin (1) as phenol and its corresponding lignocellulose (1) in
Table 3 are not included due to them being outliers. The minimum ratio between protons harvested from water and electrons from biomass is 1.4. Thus, electrons harvested by complete oxidation of the participating lignocellulosic oxidising agent into carbonates can increase the protons harvested from electrolytic water by 40%, showing the essence of lignocellulose dosing in photoelectrolytic hydrogen evolution.
With known biomass ultimate analysis, Equations (6b,c) can predict the theoretical maximum number of electrons that can be harvested from lignocellulosic oxidation. Note that the mechanism in Equations (1)–(6c) gives the highest proton/electron evolutions from biomass and water participating in the reactions from the complete conversions of biomass or water. The reported hydrogen yields [
19] are, thus, far from the highest achievable green photocatalytic hydrogen yield.
Atmospheric CO2 fixation or capture and evolved hydrogen storage (via biosynthesis) efficiencies: The advantage of an integrated solar-to-hydrogen and CO
2-fixation strategy is that evolved hydrogen is readily stored with direct CO
2 capture from air via the efficient autotrophic CBB metabolism (of engineered
R. eutropha H16 (
Cupriavidus necator) [
20]) into bioproducts. This integrated/hybrid strategy mimics a microbial electrosynthesis configuration [
21], as shown in
Figure 2. In CBB, carboxylation of three moles of ribulose-1,5-bisphosphate with three moles of CO
2 by ribulose-1,5-bisphosphate carboxylase/oxygenase evolves six moles of 3-phosphoglycerate (Equation (7)) (
Figure 4). NAD(P)H transmits photocatalytically harvested proton/hydrogen to reduce 3-phosphoglycerate into glyceraldehyde 3-phosphate with energy input from ATP (equimolar reaction) (Equation (8)) (
Figure 4). Glyceraldehyde 3-phosphate, through acyl-CoA and acetyl-CoA, by concerted actions of β-ketoacyl-CoA thiolase and acetoacetyl-CoA reductase, is reduced into 3-hydroxybutyric acid, polymerised by PHB polymerase into PHB [
22,
23] (Equations (9)–(11)) (
Figure 4). The autotrophic metabolism to PHB synthesis is limited by ribulose-1,5-bisphosphate carboxylase/oxygenase, overcome by adding it from
Synechococcus elongatus PCC 7942 [
20,
23], resulting in 99.7% PHB yield [
23].
Nine moles of ATP and six moles of NAD(P)H fix three moles of atmospheric CO
2 (Equations 7-11). It requires an applied potential of 1.7–2.4 V (although a hybrid nanocomposite CdS/CoFe
2O
4/rGO shows a much lower bandgap of 1.58 eV [
12]). Thus, 1.7–2.4 V or 328,049–463,128 Joules (applying the Nernst equation) are needed to evolve and store one mole of hydrogen and capture one mole of CO
2 from the atmosphere in the integrated system (
Figure 2). Thus, 1 kWh of solar energy can capture 342–483 g of CO
2, which exceeds the reported water-splitting biosynthetic system’s capture of 180 g of CO
2 per kWh [
2]. Thus, 1.9-2.7 times more CO
2 can be captured from the atmosphere. Compared to physical/physicochemical absorption with solvent recovery to capture CO
2, 21.5 moles·kWh
−1 [
24], our integrated photocatalytic microbial electrosynthesis is 36–51% more efficient. The increased direct air capture of CO
2 results from broadening of hybrid nanostructure of the photocatalyst/semiconductor and engineered
R. eutropha H16 (
Cupriavidus necator) with added
Synechococcus elongatus PCC 7942.
Moreover, 1 kWh of solar energy also generates and stores 16–22 g of H
2 in the integrated system (
Figure 2). Considering the 115 MJ/kg energy content of hydrogen [
25], the HER energy efficiency is 50–70% compared to >90% in steam electrolysis [
26,
27]. With solar power generation efficiency as high as 47.1% under concentrated illumination [
28], the solar-to-hydrogen energy efficiency reaches 23–33% (0.471 × 0.5 and 0.471 × 0.7). Our intensified process’s solar-to-hydrogen efficiency of 33% thus exceeds the current maximum efficiency reported at 12.3% [
19]. This increase in hydrogen evolution results from lignocellulose dosing into the photoelectrolytic system. Lignocellulose decomposition into accessible sugars, electron harvesting from sugars and electron-hole separation by appropriate OEP/HEP/bandgap selection are key to the success of photocatalytic hydrogen production. Thus, the theoretical maximum yield of hydrogen and the theoretical maximum efficiencies of solar-to-CO
2 fixation and solar-to-hydrogen generation are established for future experimental targets.


