Article

Steam Electrolysis vs. Co-Electrolysis: Mechanistic Studies of Long-Term Solid Oxide Electrolysis Cells

by
Stephanie E. Wolf
1,2,*,
Vaibhav Vibhu
1,*,
Eric Tröster
1,
Izaak C. Vinke
1,
Rüdiger-A. Eichel
1,2 and
L. G. J. (Bert) de Haart
1
1
Institute of Energy and Climate Research, Fundamental Electrochemistry (IEK-9), Forschungszentrum Jülich GmbH, 52425 Jülich, Germany
2
Institute of Physical Chemistry, RWTH Aachen University, 52074 Aachen, Germany
*
Authors to whom correspondence should be addressed.
Energies 2022, 15(15), 5449; https://doi.org/10.3390/en15155449
Submission received: 29 June 2022 / Revised: 23 July 2022 / Accepted: 24 July 2022 / Published: 27 July 2022
(This article belongs to the Special Issue High Temperature Electrolysis)

Abstract

:
High-temperature electrolysis using solid oxide electrolysis cells (SOECs) is an innovative technology to temporarily store unused electrical energy from renewable energy sources. However, they show continuous performance loss during long-term operation, which is the main issue preventing their widespread use. In this work, we have performed the long-term stability tests up to 1000 h under steam and co-electrolysis conditions using commercial NiO-YSZ/YSZ/GDC/LSC single cells in order to understand the degradation process. The electrolysis tests were carried out at different temperatures and fuel gas compositions. Intermittent AC- and DC- measurements were performed to characterize the single cells and to determine the responsible electrode processes for the degradation during long-term operation. An increased degradation rate is observed at 800 °C compared to 750 °C under steam electrolysis conditions. Moreover, a lower degradation rate is noticed under co-electrolysis operation in comparison to steam electrolysis operation. Finally, the post-test analyses using SEM-EDX and XRD were carried out in order to understand the degradation mechanism. The delamination of LSC is observed under steam electrolysis conditions at 800 °C, however, such delamination is not observed during co-electrolysis operation. In addition, Ni-depletion and agglomeration are observed on the fuel electrode side for all the cells.

1. Introduction

The electrochemical production of H2 and syngas through steam- and co-electrolysis with renewable electricity using solid oxide electrolysis cells (SOECs) is a key technology to transform vital sectors such as the mobility and chemical industries towards sustainability. These sustainably produced gases can be used in the industrially significant Fischer Tropsch process for the production of carbon-neutral synthetic fuels, as well as starting materials for platform chemicals.
A SOEC consists of two porous electrodes and a dense oxide ion-conducting electrolyte. The electrochemical reduction reaction takes place on the negatively charged fuel electrode side. Oxide ions migrate to the oxygen electrode side through the electrolyte, where they are reoxidized to gaseous oxygen (O2). Both steam (H2O) and carbon dioxide (CO2) can be used as fuels in SOECs to produce hydrogen (H2) (Equation (1)) and carbon monoxide (CO) (Equation (2)), respectively. Moreover, in co-electrolysis mode, a mixture of H2O and CO2 is converted directly into syngas (CO + H2). Depending on the process equilibrium, the (reverse) water gas shift reaction ((R)WGS) takes place on the fuel side (Equation (3)) [1].
H2O + 2e → H2 + ½ O2−
CO2 + 2e → CO + ½ O2−
CO2 + H2 → H2O + CO
To reach sufficient ionic conductivity of SOEC materials, elevated temperatures over 600 °C are essential. The most common SOECs are therefore operated between 650 and 900 °C [2,3,4]. Compared to the competing polymer electrolyte membrane (PEM) and alkaline electrolyzers, which are typically operated at 60 to 200 °C [5,6], the high SOEC operating temperatures result in advantageous thermodynamics and faster reaction kinetics. In addition, for SOEC electrolyzers, the supplied electrical energy is almost completely converted into chemical energy [7]. Thus, the technical efficiency of SOECs goes up to 100% when a significant part of the reaction energy for the high-temperature electrolysis is provided by downstream chemical processes such as the production of ammonia or synthetic fuels [6,8,9]. For alkaline and PEM electrolyzers, the process efficiency based on the hydrogen yield is up to 59–70% and 65–82%, respectively [6]. This efficiency difference results in higher achievable current densities in SOECs at the thermoneutral voltage (~1.5 A∙cm−2 at 1.29 V) compared to PEM electrolyzers (~0.5 A∙cm−2 at 1.47 V) [7].
The high operating temperature of SOECs has several advantages; however, it necessitates thermostable component materials. The materials in state-of-the-art SOEC systems are largely based on the developed solid oxide fuel cell (SOFC) technology. Several studies for these materials have shown a higher degradation rate in SOEC conditions compared to the performance loss in fuel cell mode [10,11,12,13]. For the increased economic competitiveness and wider future industrial adoption of SOEC technology, a key challenge is the long-term durability at the operating conditions. Today’s most commonly used electrolyte material for high-temperature electrolysis is 8 mol% yttria-stabilized zirconia (8YSZ), owing to its high chemical stability in reducing and oxidizing atmospheres as well as good oxide ion conductivity [14]. With respect to oxygen electrodes, La1−xSrxMnO3 (LSM) is considered a typical electrode material; however, it is a purely electronic conductor, therefore the electrode reactions are limited to the triple phase boundary (TPB). In addition, under SOEC operation conditions, a high oxygen partial pressure is developed at the electrode/electrolyte interface, leading to an irreversible increase in ohmic resistance of the cell [15] as well as delamination of the LSM electrode [16,17]. To enhance the reaction boundary, LSM is mixed with an ionic conducting materials such as YSZ. Alternatively, mixed ionic and electronic conducting (MIEC) materials such as La0.6Sr0.4CoO3−δ (LSC) and La0.6Sr0.4Co0.2Fe0.8O3−δ (LSCF) are considered as potential oxygen electrodes due to their high electronic and ionic conductivity, where also the electrode reaction takes place throughout the bulk of the electrode [18]. A Ce0.9Gd0.1O1.95 (CGO) barrier layer is normally used between the electrolyte and Sr-containing oxygen electrode in order to prevent the formation of insulating phases such as SrZrO3 and La2Zr2O7 [19]. The replacement of the LSM electrode with LSCF and a CGO inter-diffusion barrier layer on the oxygen electrode side not only enhances the electrochemical performance of the cell but also significantly reduces the degradation rate [20].
With respect to fuel electrodes, typically, cermet-based materials such as Ni-YSZ are considered owing to their high electro-catalytic activity and high electrical conductivity. In addition, the mixing of Ni and YSZ leads to improved structural stability and an enlarged triple phase boundary (TPB). These Ni-cermet-based electrodes show excellent initial performance; however, during long-term operation, they exhibit performance loss and microstructural alterations, especially in the presence of steam. According to Sun et al., the changes in fuel electrodes are the primary source of degradation under SOEC operation [21]. The major issues are the Ni depletion at the electrode/electrolyte interface in addition to the Ni agglomeration in the support layer of the electrode [22,23,24,25]. This structural instability in humidified operation conditions is considered one main degradation process leading to irreversible loss of cell performance [22,24,26,27].
To date, several studies have been performed in order to understand the performance loss and the degradation behavior of SOECs; however, the responsible electrode process for large degradation under SOEC operation is still unclear. Consequently, the electrochemical processes during long-term degradation have to be elucidated at the cell level for steam and co-electrolysis dependent on the inlet fuel and operating conditions. Long-term degradation experiments [28,29,30,31,32] through time-dependent electrochemical impedance spectroscopy (EIS) provide an in-depth understanding of the individual degradation processes. Therefore, in this work, we have focused on the same and performed long-term measurements with single cells under steam and co-electrolysis conditions up to 1000 h. The measurement temperature and the inlet fuel gas compositions were varied to distinguish the main degradation process for both electrolysis reactions dependent on measurement parameters. The current−voltage (iV) characteristics and electrochemical impedance spectroscopy (EIS) were carried out in time intervals of 96 h to elucidate the involved electrochemistry at the cell level leading to degradation, depending on the measurement conditions. Lastly, microstructural post-test analyses were conducted to validate the mechanistic impedance analysis.

2. Experiments

The experiments were performed with commercially available fuel electrode-supported single cells by the company Elcogen [33]. The total cell thickness amounted to 315 ± 35 µm and a diameter of 20 mm. The single cell was composed of a LSC (La0.6Sr0.4CoO3−δ) oxygen electrode with a thickness of 15 ± 5 µm (diameter of 10 mm), a CGO interlayer (thickness ~2 µm), an 8YSZ layer (thickness ~5 µm) and a NiO-YSZ fuel electrode. The electrode on the fuel side had a thickness of 300 ± 30 µm NiO-YSZ support and an active layer of around 10 µm. The active area of the cell was 0.79 cm2. The cells were installed in a Probostat setup (Norwegian Electro Ceramics®, NORECS, Oslo, Norway) [34]. The cells were contacted with a Pt current collector on the oxygen electrode side and with a Pt-Ni mesh on the fuel electrode side. A gold gasket was used for the sealing. The gas flow was controlled by mass flow controllers (MFC, Bronkhorst Nord®, Kamen, Germany) with a total volume flow of 9 L⋅h−1 fuel gases on the fuel electrode side. This gas flow was balanced with 9 L⋅h−1 air on the oxygen electrode side to achieve an even pressure distribution of the gas flows on the cell. After the reduction of the single cell, the obtained open circuit voltage (OCV) values deviated from theoretical values by 1% for the co-electrolysis measurement and less than 1% for the steam electrolysis measurements. This indicates minimal gas leaks during testing. Humidification on the fuel electrode side was achieved by leading the gas flow (H2, CO2) through a water bath before being led into the gas feed to the cell. The steam concentration was adjusted based on the temperature dependence of the vapor pressure. The supply channel of the anode was in direct contact with the current collector and provided a radial gas flow. All cells were reduced at 900 °C in hydrogen atmosphere, which was stepwise increased from 0% to 100% balanced with nitrogen (Table S1, supplement material). After complete reduction, the cells were kept in reducing conditions during measurements to prevent Ni reoxidation. AC- and DC-measurements were recorded with a two-electrode setup with the Potentiostat/Galvanostat Vertex.5A (Ivium Technologies®, Eindhoven, The Netherlands). One reference cell was reduced at 900 °C and immediately cooled down to room temperature in an atmosphere of 4% H2 in N2. The remaining cells were used after reduction for long-term galvanostatic durability tests and performance characterization. The cells were electrochemically characterized before the degradation experiment and then the same measurements were carried out after each 96 h until the cell reached a total operation time of 1000 h. The impedance spectra were taken under galvanostatic control with 127 points in a frequency range from 100 kHz down to 0.1 Hz using an amplitude of 50 mA under open-circuit voltage (OCV) conditions. The complex impedance diagrams were fitted using an equivalent circuit model by means of the RelaxIS® software version 3.0.20.14. The ohmic resistance RΩ, polarization resistance RP and area specific resistance (ASR) values were derived from the evaluated EIS measurement data. The degradation rate was calculated from the change in cell voltage over time. Current−voltage characteristics were taken at the beginning and the end of each long-term test. The morphologies of the materials were analyzed using a scanning electron microscope (Quanta FEG 650, FEI equipped with an EDS detector) operating at 20 kV. The cells were investigated by X-ray diffraction (XRD) at room temperature using a PANanalytical X’pert MPD diffractometer with Cu-Kα incident radiation to check any changes in the crystallographic structure after the degradation tests.

3. Results and Discussion

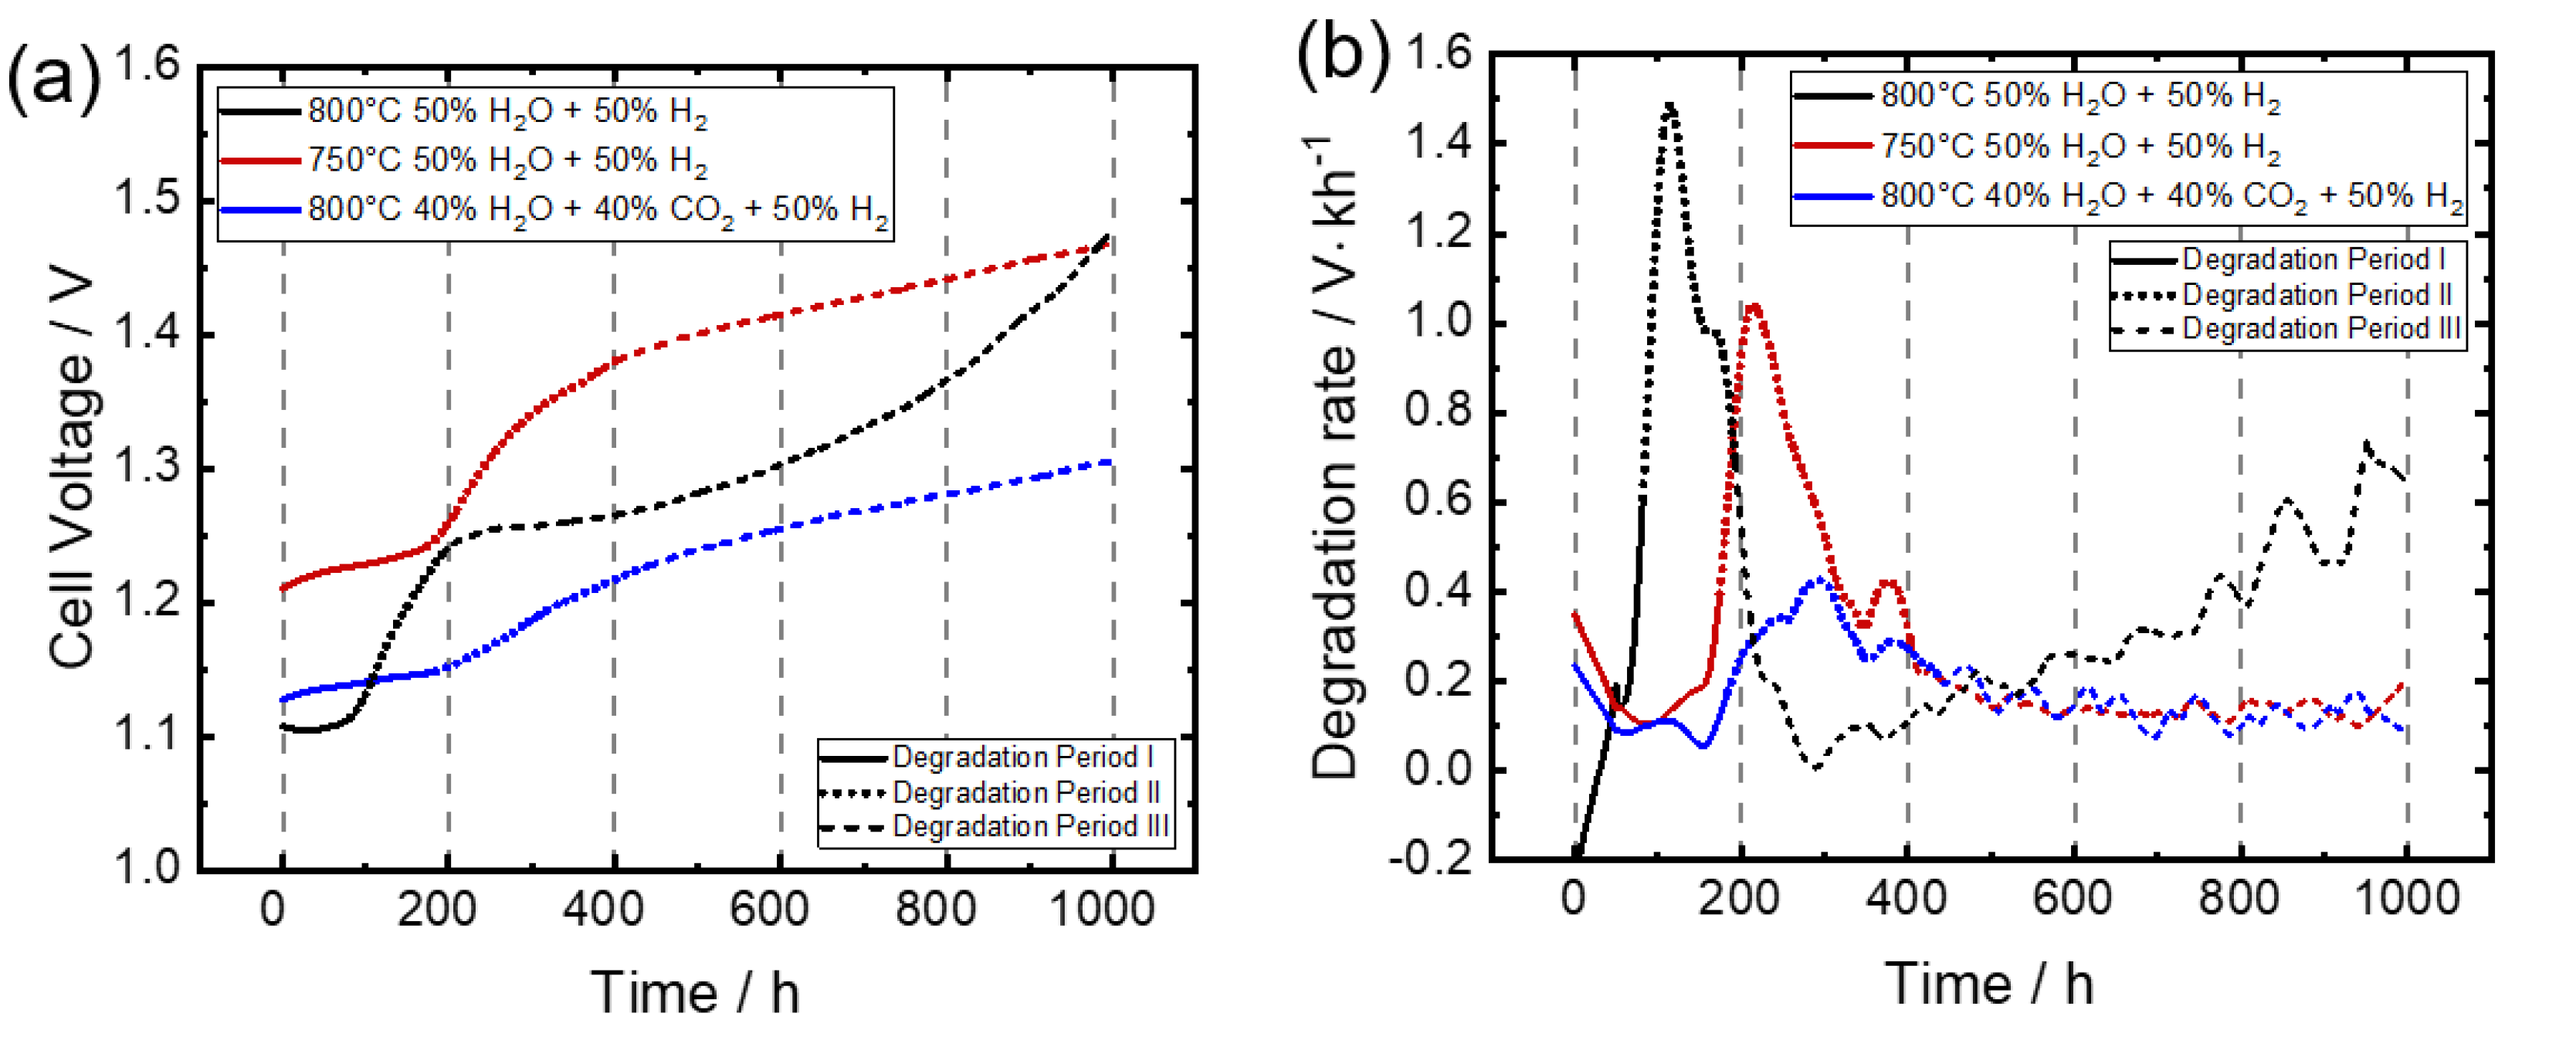
3.1. Voltage Development

The galvanostatic degradation tests were performed with a gas composition of 50% H2 + 50% H2O for steam electrolysis at 800 °C and 750 °C and with 40% H2O + 40% CO2 + 20% H2 at 800 °C for co-electrolysis under a constant current density of −1 A∙cm−2. The variation of cell voltage and the degradation rate as a function of operating time for steam and co-electrolysis are illustrated in Figure 1a,b.
It can be perceived from the graphs that all the cells displayed degradation with an increase in the cell voltage throughout the electrolysis measurements up to 1000 h. However, they showed different behavior and degradation rates with the variation of temperature and gas compositions. The degradation and subsequent increase of the cell voltage can be divided into three time periods. In the initial degradation stage (I), the voltage increased moderately. In the following, a fast degradation period (II) was observed where the voltage increased rapidly. After this, a third period (III) was observed, in which the degradation rate decreased compared to the fast degradation period.

Degradation Behavior under Different Measurements Conditions

For steam electrolysis at 800 °C, the cell voltage increased only slightly from start-up to 82 h. This was followed by a fast degradation up to around 193 h of measurement time, during which the cell voltage showed the largest increase. The degradation increased steeply during this period, leading to a voltage increase of 132 mV during this period. After the fast degradation at around 193 h, the voltage development displayed progressive degradation until the measurement end at 1000 h. An overall increase of 33% was observed in the cell voltage after 1000 h (Table 1).
The degradation test at 750 °C under steam electrolysis conditions showed higher initial cell voltage, as expected due to higher ohmic and polarization resistance. At the lower operating temperature, the initial degradation period lasted up to around 174 h. The fast degradation period lasted longer, up to around 404 h compared to the cell measured at 800 °C. In addition, the test at 750 °C showed a continuous voltage increase in the third test period. The absolute voltage increase over measurement time averaged 22% of initial cell voltage per 1000 h (Table 1). The total voltage increase at 800 °C was around 1.4 times higher than that of a cell operated at 750 °C. The results emphasize that operation temperature has a direct impact on cell degradation. Since the humidity and current density were kept constant for both tests, the large degradation rate at 800 °C therefore arises from the temperature effect. The observed degradation rate in our work was higher than the one reported in the literature by Trini et al., with 8.3%∙kh−1 under the same measurement conditions (800 °C, −1 A∙cm−2, H2/H2O (50/50)) [22]. In another work, Schefold et al. performed a long-term steam electrolysis test up to 23,000 h at 850 °C with −0.9 A∙cm−2 current density, using an electrolyte-supported single cell comprising scandia/ceria doped zirconia electrolyte (6Sc1CeSZ), CGO barrier layer, a LSCF oxygen electrode, and a nickel/gadolinia-doped ceria (Ni/GDC), and reported a significantly lower degradation rate of 0.57%∙kh−1 [35,36]. The observed lower degradation rate could be due to different cell types or components used in their work.
In comparison to steam electrolysis, co-electrolysis at 800 °C showed an initial degradation period of 184 h, followed by a moderate voltage increase of 75 mV up to 442 h. In the third period, the voltage increased continuously. The long-term test resulted in an overall increase of 16% from the initial cell voltage after 1000 h (Table 1). The degradation rate maxima in Figure 1b illustrate the degradation development. A maximum degradation rate of 1.49 Ω∙cm2∙kh−1 for steam electrolysis at 800 °C was observed after 114 h. At 750 °C operating temperature, a maximum degradation rate of 1.04 Ω∙cm2∙kh−1 for steam electrolysis was observed after 214 h. For co-electrolysis, however, the maximum degradation of 0.43 Ω∙cm2∙kh−1 was reached after around 295 h. The development of the degradation rate over time underlines that elevated temperatures are detrimental to the cells’ stability [31]. The variation of fuel gas composition, i.e., 40% H2O + 40% CO2 + 20% H2 for co-electrolysis, resulted in a lower degradation rate than steam electrolysis at 750 °C.

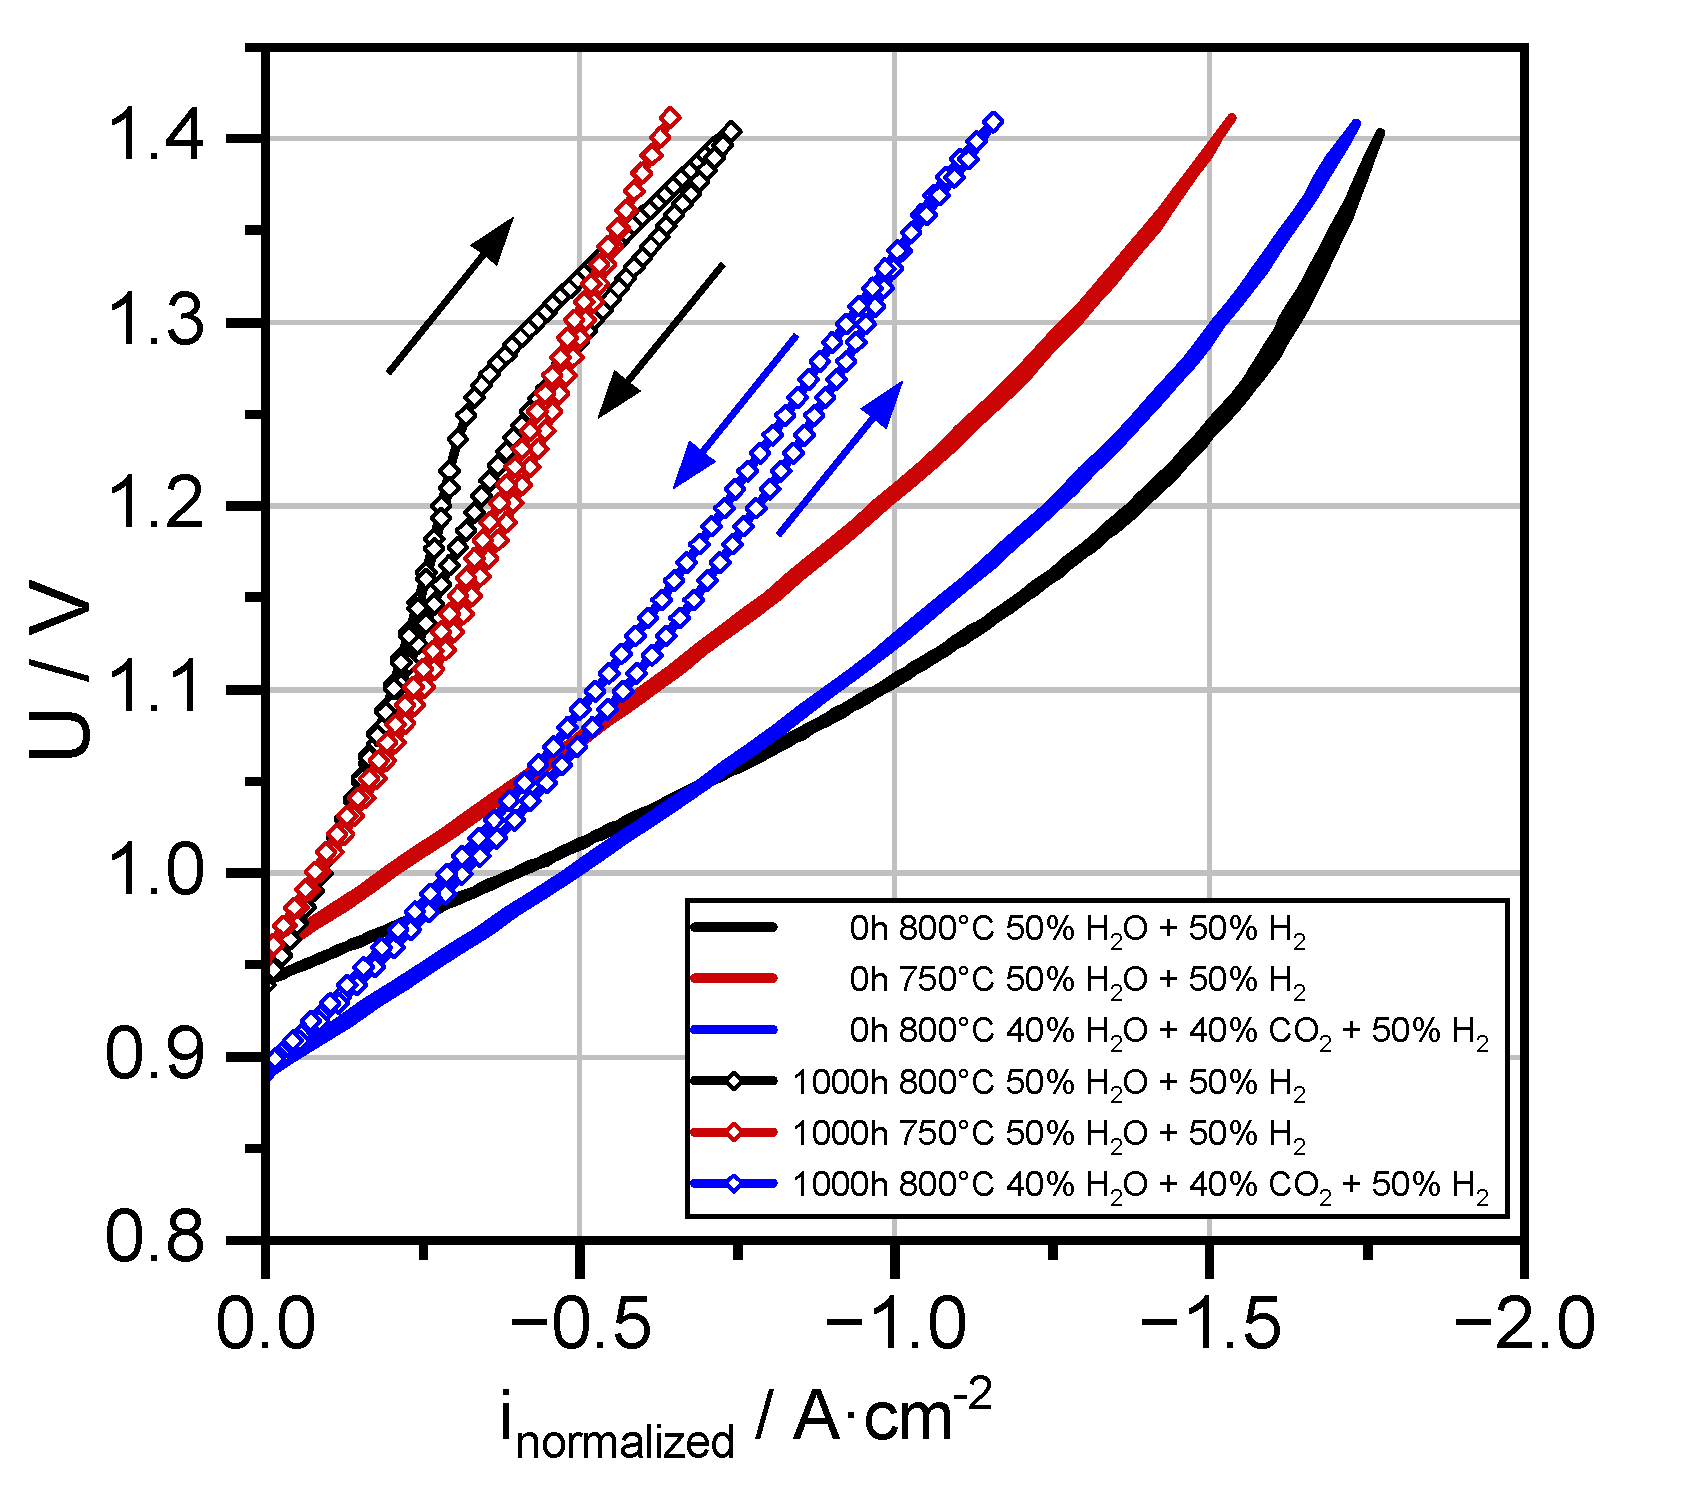
3.2. Overview of Electrochemical Performance Analysis

Cell performance was analyzed as a function of operation time by AC- and DC- measurements. The initial performance of the cells under steam and co-electrolysis conditions are compared in Figure 2. The initial current density of the three measurements varied significantly, as expected from the differing measurement conditions. At 800 °C, the iV curves for steam and co-electrolysis reached about the same maximum current density of 1.77 A∙cm−2 and 1.72 A∙cm−2, respectively, at 1.4 V. With a decrease of the operating temperature of the cell to 750 °C, only 1.52 A∙cm−2 was reached under steam electrolysis at the same voltage limit. However, the performance of the cells was significantly lower after 1000 h of electrolysis operation, as shown in Figure 2.
For instance, at 800 °C, the maximum current density was decreased by 1.03 A∙cm−2 for steam electrolysis and 0.59 A∙cm−2 in co-electrolysis conditions. At 750 °C operating temperature, the cells’ current density decreased by 0.89 A∙cm−2 for steam electrolysis and less severely compared to the observed loss at 800 °C. The comparison of the percentage performance decrease from the initial values at 800 °C for steam (58%) and co-electrolysis (34%) emphasizes the crucial impact of the feed gas on cell performance over time. Long-term galvanostatic test results at −0.75 A∙cm−2 at 750 °C by Rao et al. [37] under co-electrolysis conditions showed a higher performance loss of around 50%∙kh−1. The authors used a different gas composition of 65% H2O + 25% CO2 + 10% H2, i.e., with a higher steam content, which may cause the higher performance loss. After the degradation tests at 800 °C, the iV curves for co-electrolysis and steam electrolysis displayed hysteresis. For steam electrolysis this hysteresis was more pronounced, so the hysteresis’s origin cannot be linked to the CO2 in co-electrolysis, as suggested by Aicart [38], or low steam content [39], but to the operating temperature over time.
To further understand the degradation behavior of the cells during three long-term tests, the area-specific resistance (ASR) was calculated from impedance measurements and plotted in Figure 3 as a function of testing time.
Regardless of the difference in the initial ASR values, both cells operated under steam electrolysis conditions showed similar degradation behavior. After an initial degradation period, a sharp increase in the ASR was observed. The initial area-specific resistance of 175 mΩ∙cm2 at 800 °C increased to 730 mΩ∙cm2 after the 1000 h durability test. This corresponds to an average ASR degradation rate of 555 mΩ∙cm2∙kh−1. Decreasing the measurement temperature to 750 °C led to a lower average degradation rate of 387 mΩ∙cm2∙kh−1. In contrast to the cells operated in steam electrolysis, the ASR evolved linearly in co-electrolysis conditions over time, with an average degradation rate of 134 mΩ∙cm2∙kh−1. This indicates different degradation mechanisms occurring in the cells dependent on the fuel gas compositions. Therefore, electrochemical impedance analysis was performed in regular intervals during long-term testing to determine the dominating degradation process depending on the gas atmosphere.

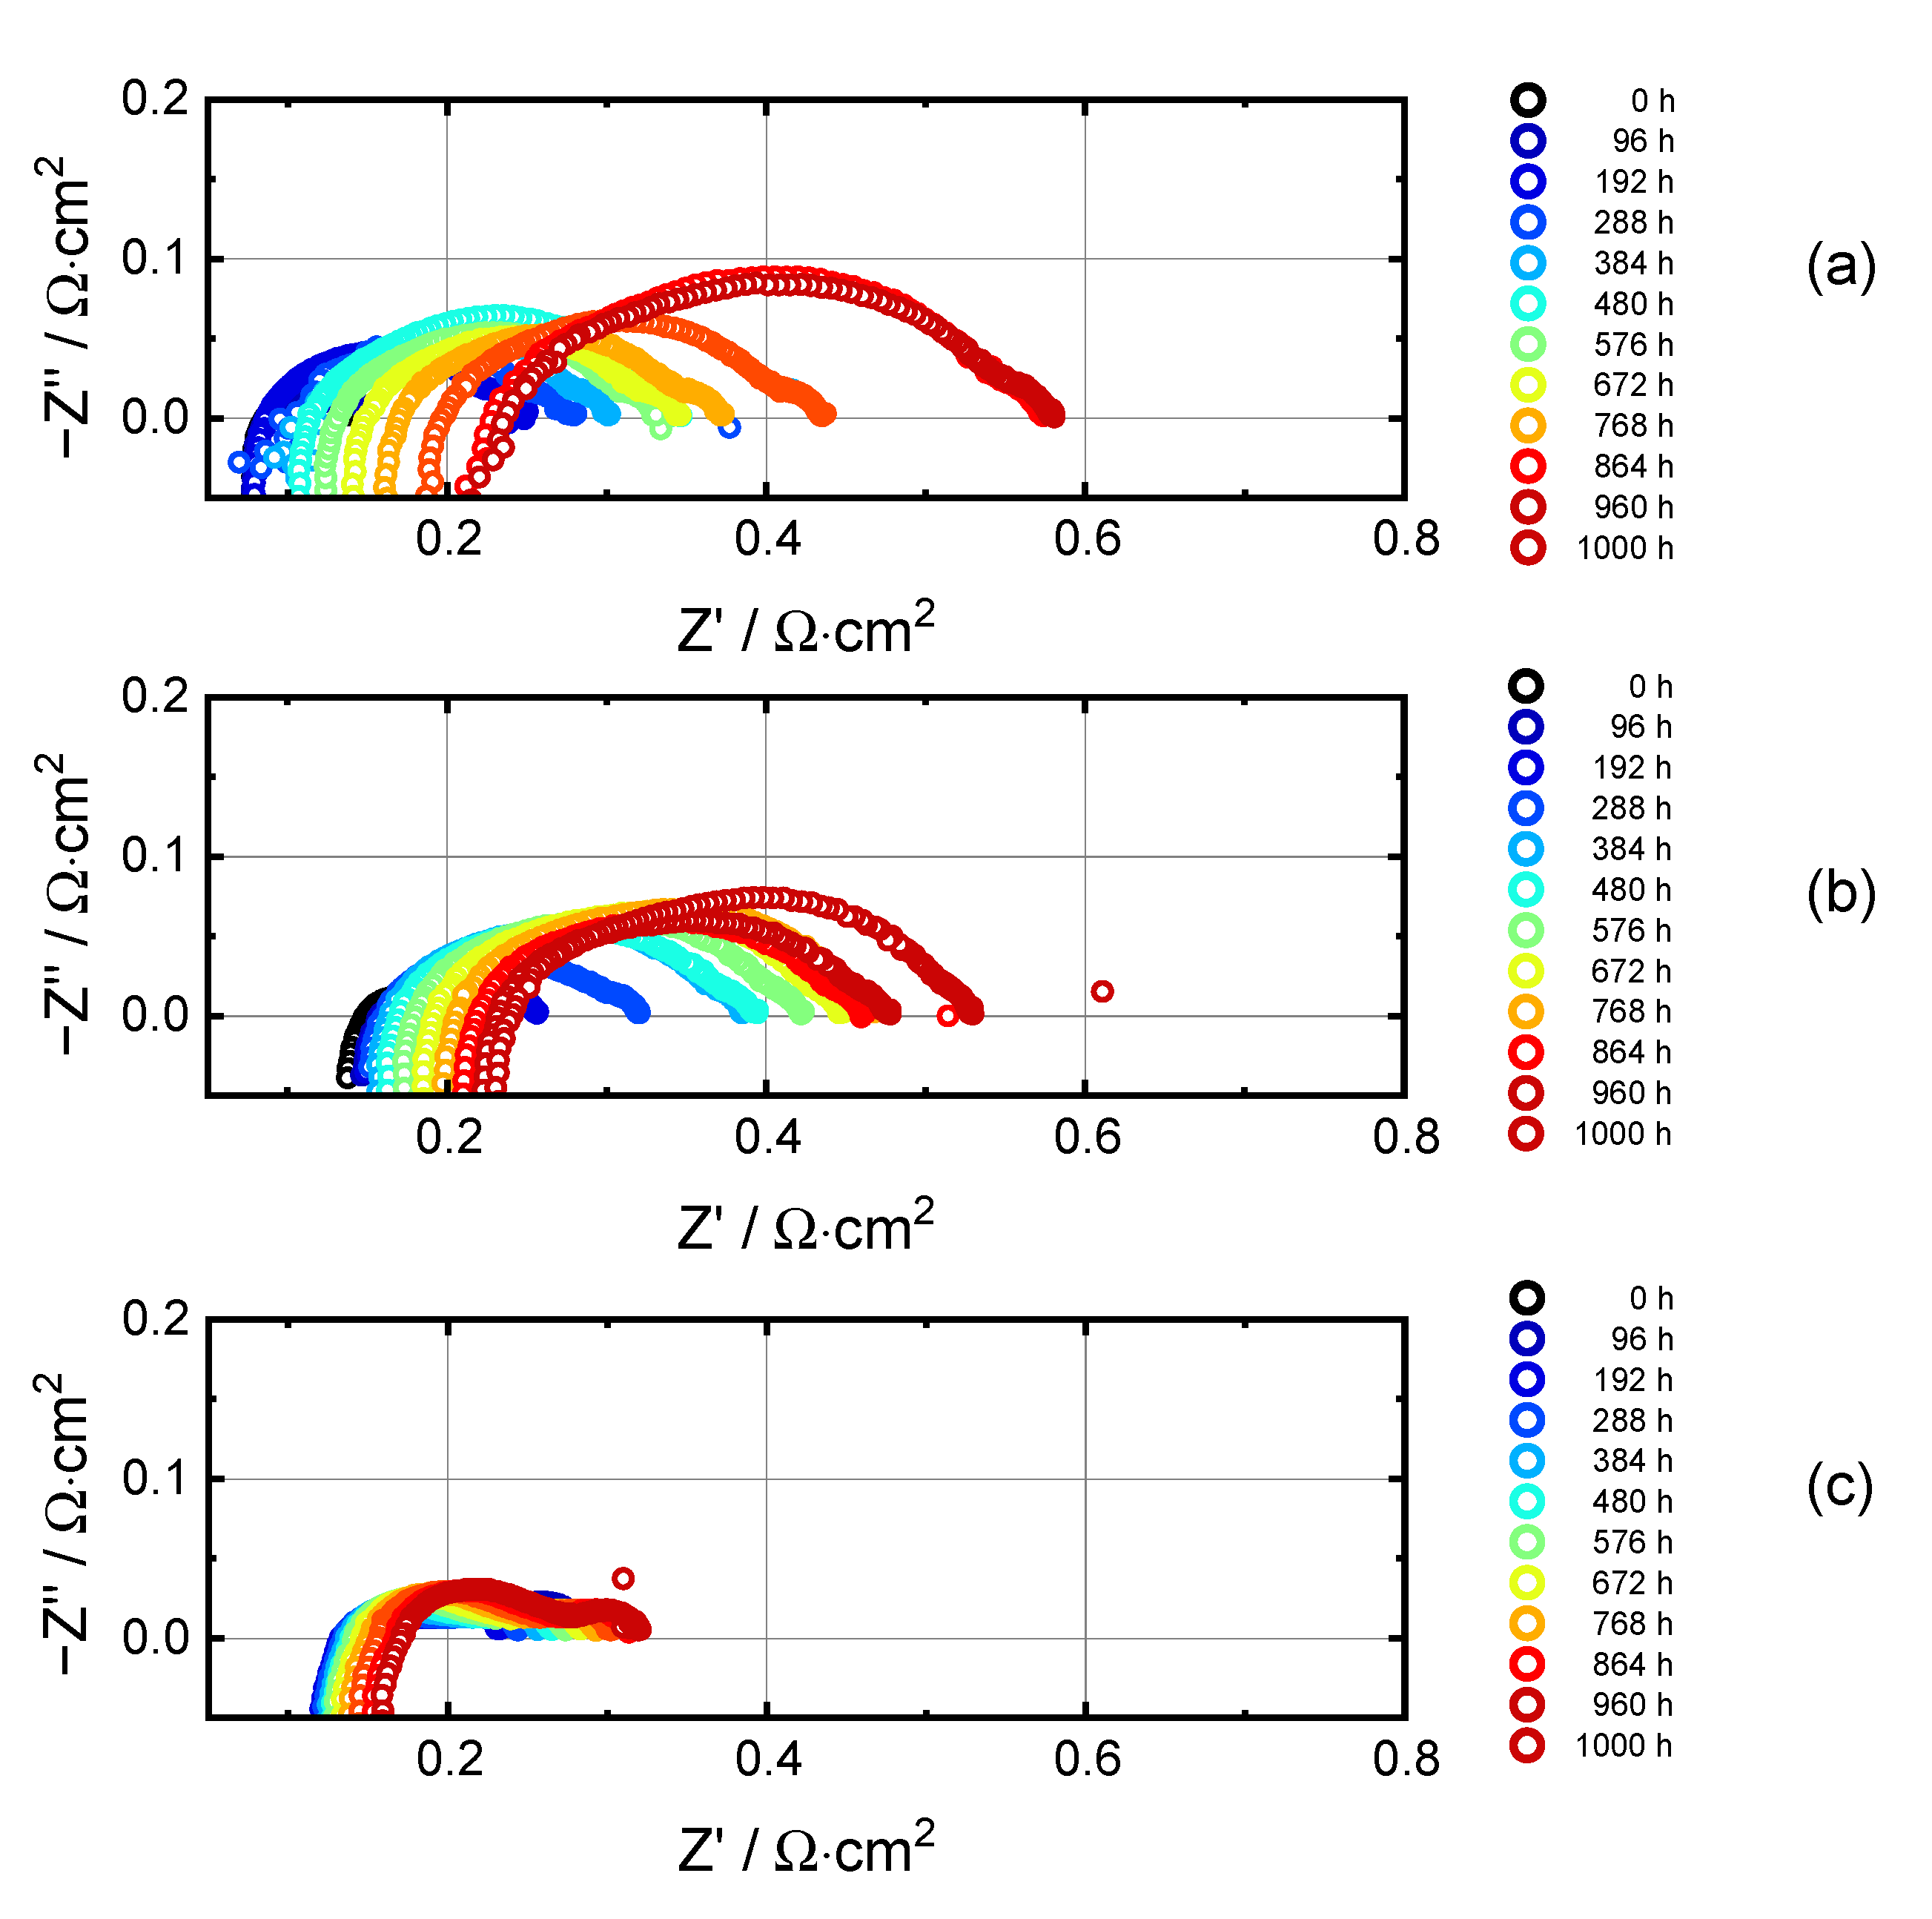
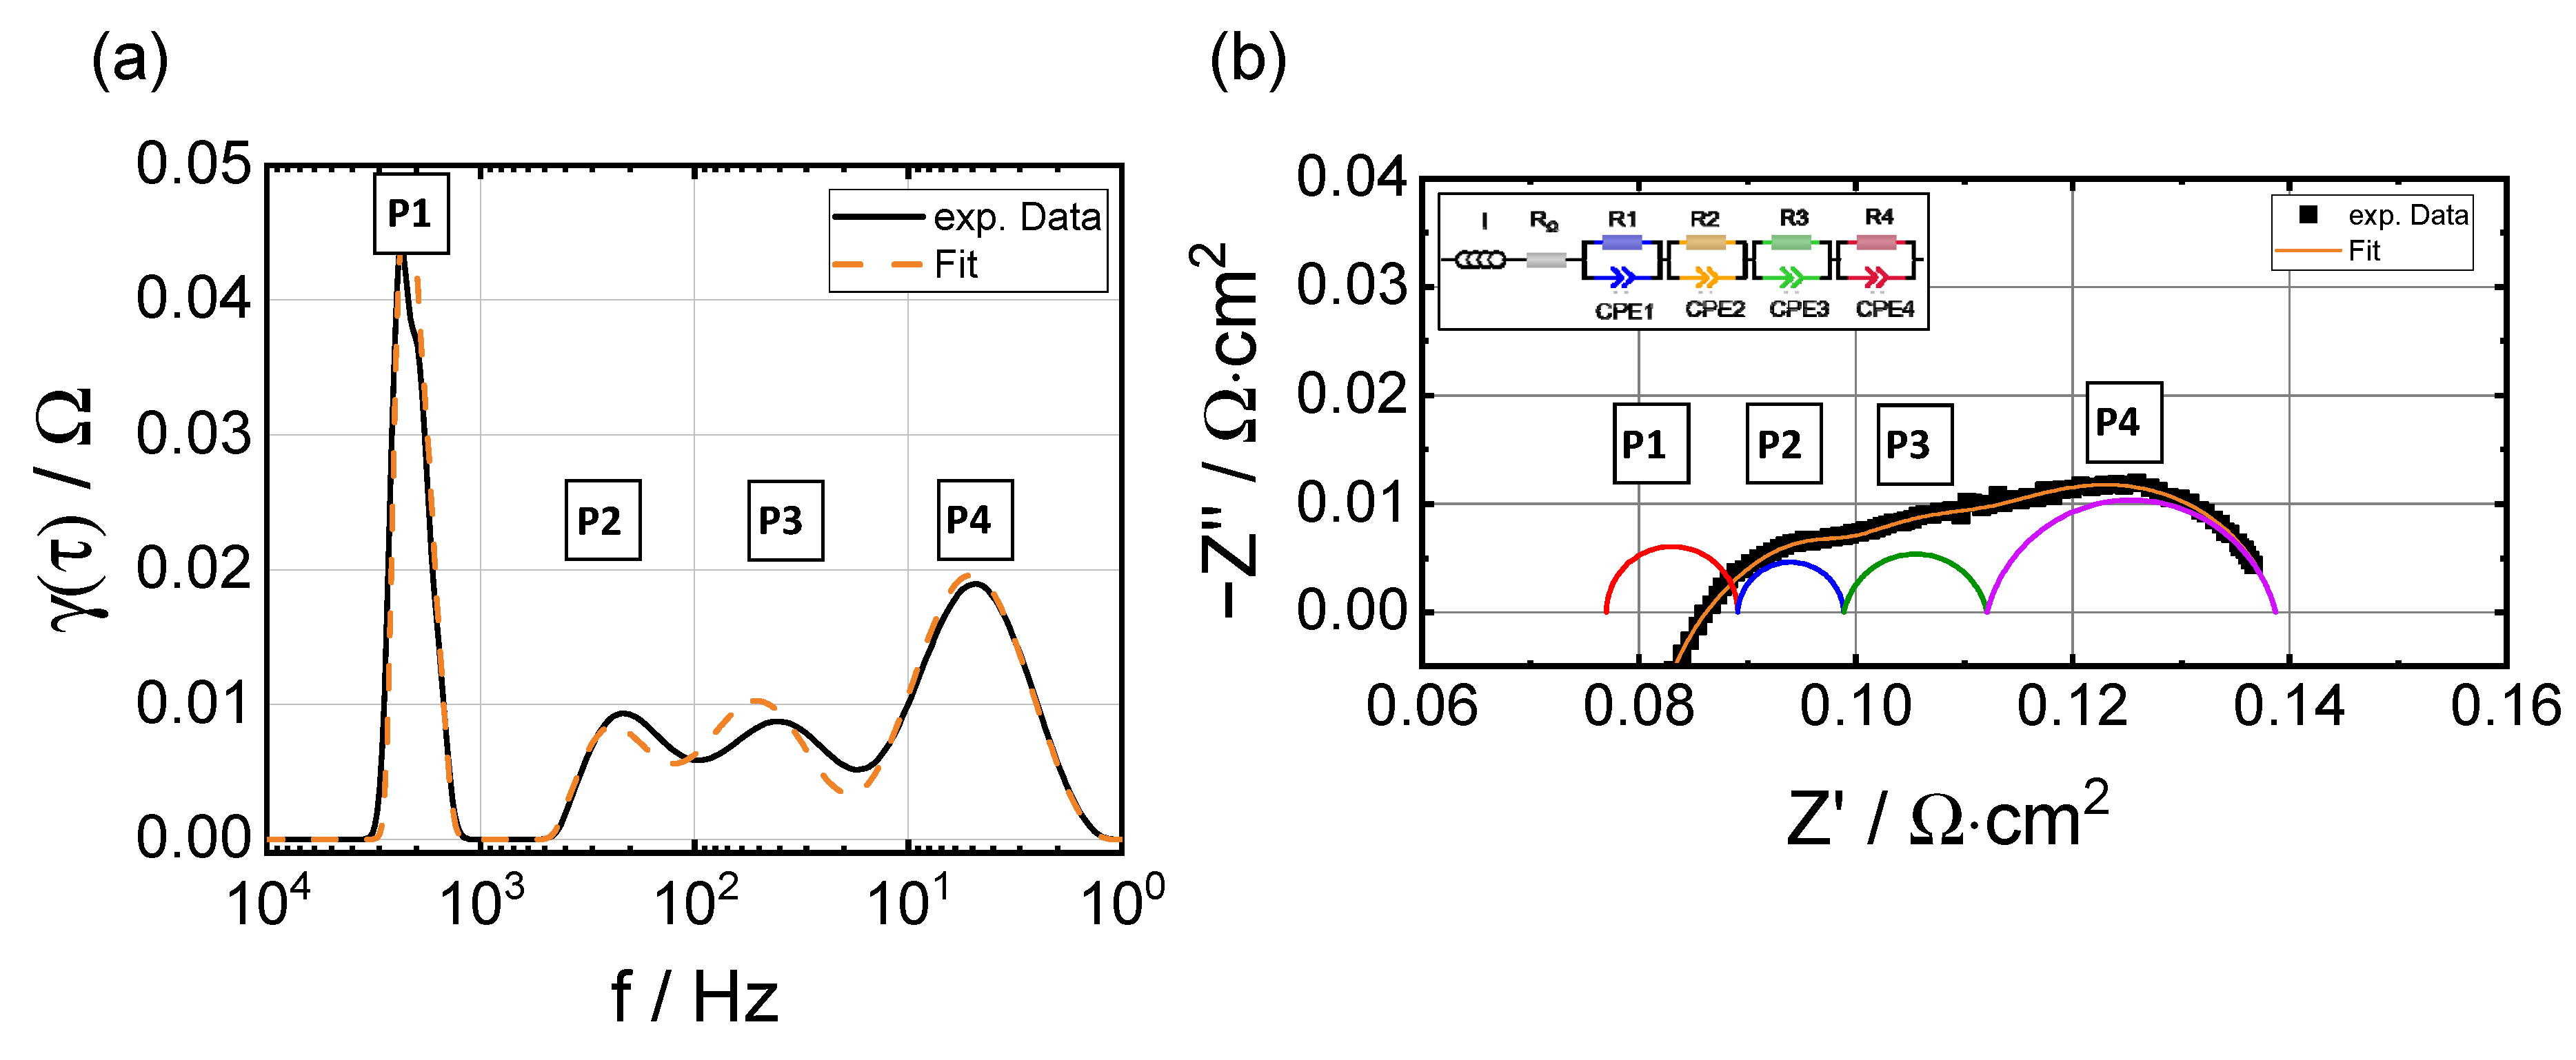
3.3. Electrochemical Impedance Analysis

Electrochemical impedance spectra were taken at OCV from 0 h to 1000 h intermitted in 96 h steps during the long-term test. To investigate the evolution of the cell performance, the impedance spectra were plotted as a function of time for steam electrolysis at 800 °C (Figure 4a), steam electrolysis at 750 °C (Figure 4b), and co-electrolysis at 800 °C (Figure 4c). The comparison of the EIS spectra before and after the durability test with frequency values is shown in Figure S1 in the supplement material.
Foremost, it is evident that both ohmic resistance (RΩ) and polarization resistance (RP) increased for all three measurements despite different measurement conditions. For the case of steam electrolysis at 800 °C (Figure 4a), RΩ remained invariant during the first 288 h of testing. Subsequently, it began to increase gradually. In contrast, the polarization resistance RP started increasing after 96 h. The differences of RΩ and RP before and after the durability tests are listed in Table 2. The impedance spectra in Figure 4a illustrate that the mid-frequency part of the impedance spectrum was influenced the most, followed by the high-frequency part.
A similar evolution of RΩ and RP, as well as comparable impedance trends, were observed for steam electrolysis at 750 °C (Figure 4b). The evolution of EIS spectra for co-electrolysis (Figure 4c), on the other hand, showed a significantly different trend, in contrast to steam electrolysis. The increase in RΩ under co-electrolysis conditions was the lowest compared to the steam electrolysis conditions (Table 2), irrespective of the elevated operating temperature. However, RP showed a gradual increase throughout the measurement up to 1000 h. In total, the increase of impedance was significantly lower for co-electrolysis compared to steam electrolysis. All impedance spectra displayed in Figure 4 showed no evident change in the low-frequency region. This suggests that the physical process observed in the low-frequency range was not influenced by cell degradation tests up to 1000 h.
To further analyze the involved electrode processes, the impedance data were fitted with an equivalent circuit model (ECM). The number of time constants for the ECM was determined by the distribution of the relaxation times (DRT) method. Figure 5a shows the DRT plots of the impedance spectra for the gas composition of 50% H2O + 50% H2 at OCV and 800 °C before the long-term test. The DRT analysis suggests four relaxation processes. Therefore, the considered ECM consists of inductance due to inductive wire effects, a serial resistor, and four RQ elements. Furthermore, the ECM was validated by DRT comparative analysis of the fit and experimental impedance data (Figure 5a). The error (chi-square) between the raw data and the fit was found to be in the order of magnitude of 10−7, thus the model with 4(RQ) was accepted [40]. Figure 5b illustrates the fitted impedance spectrum with the 4RQ model and the polarization resistance broken down to the individual physical processes.

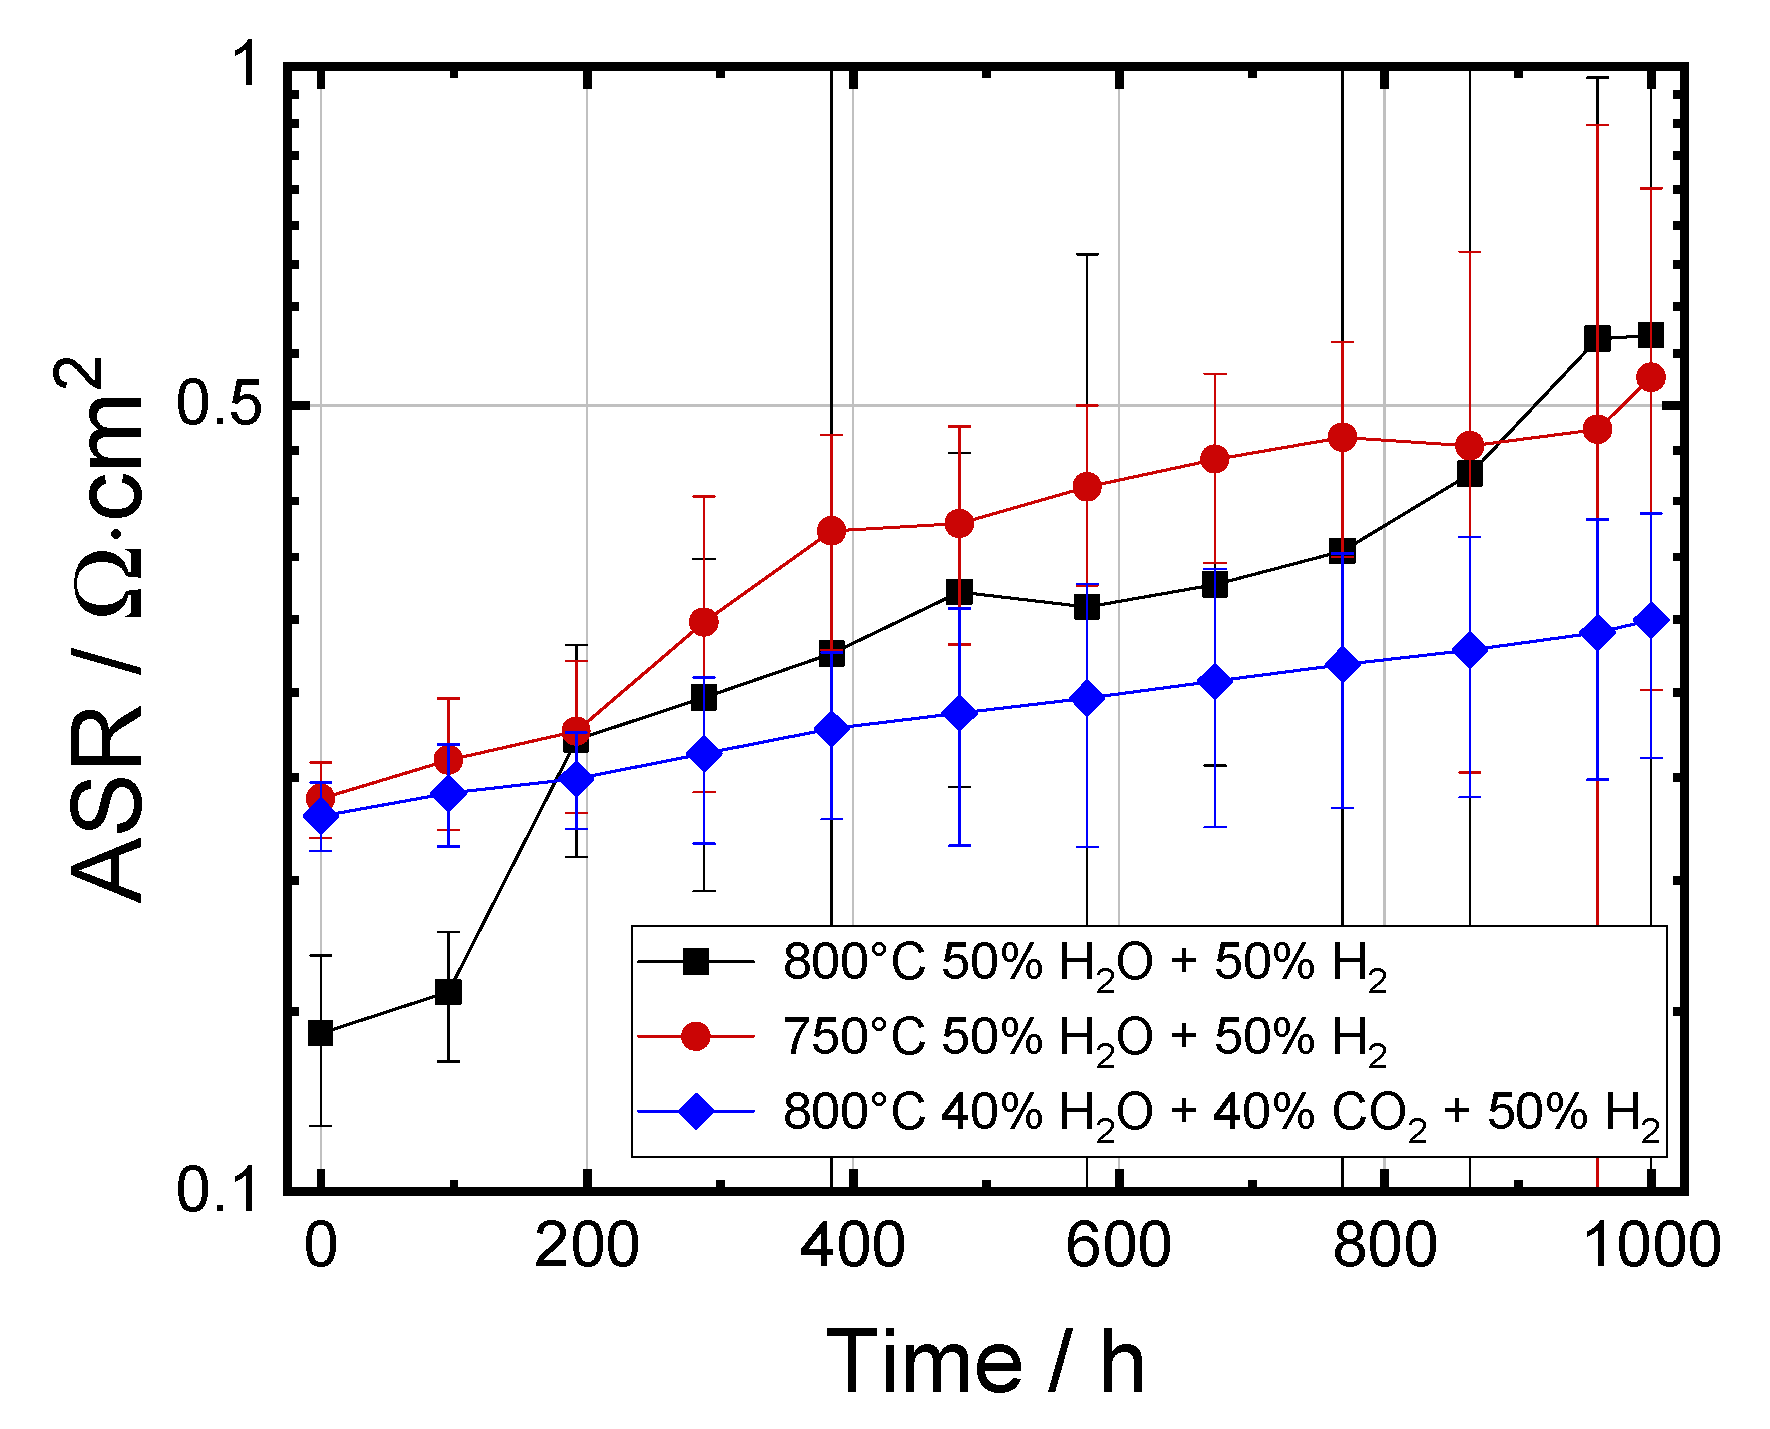
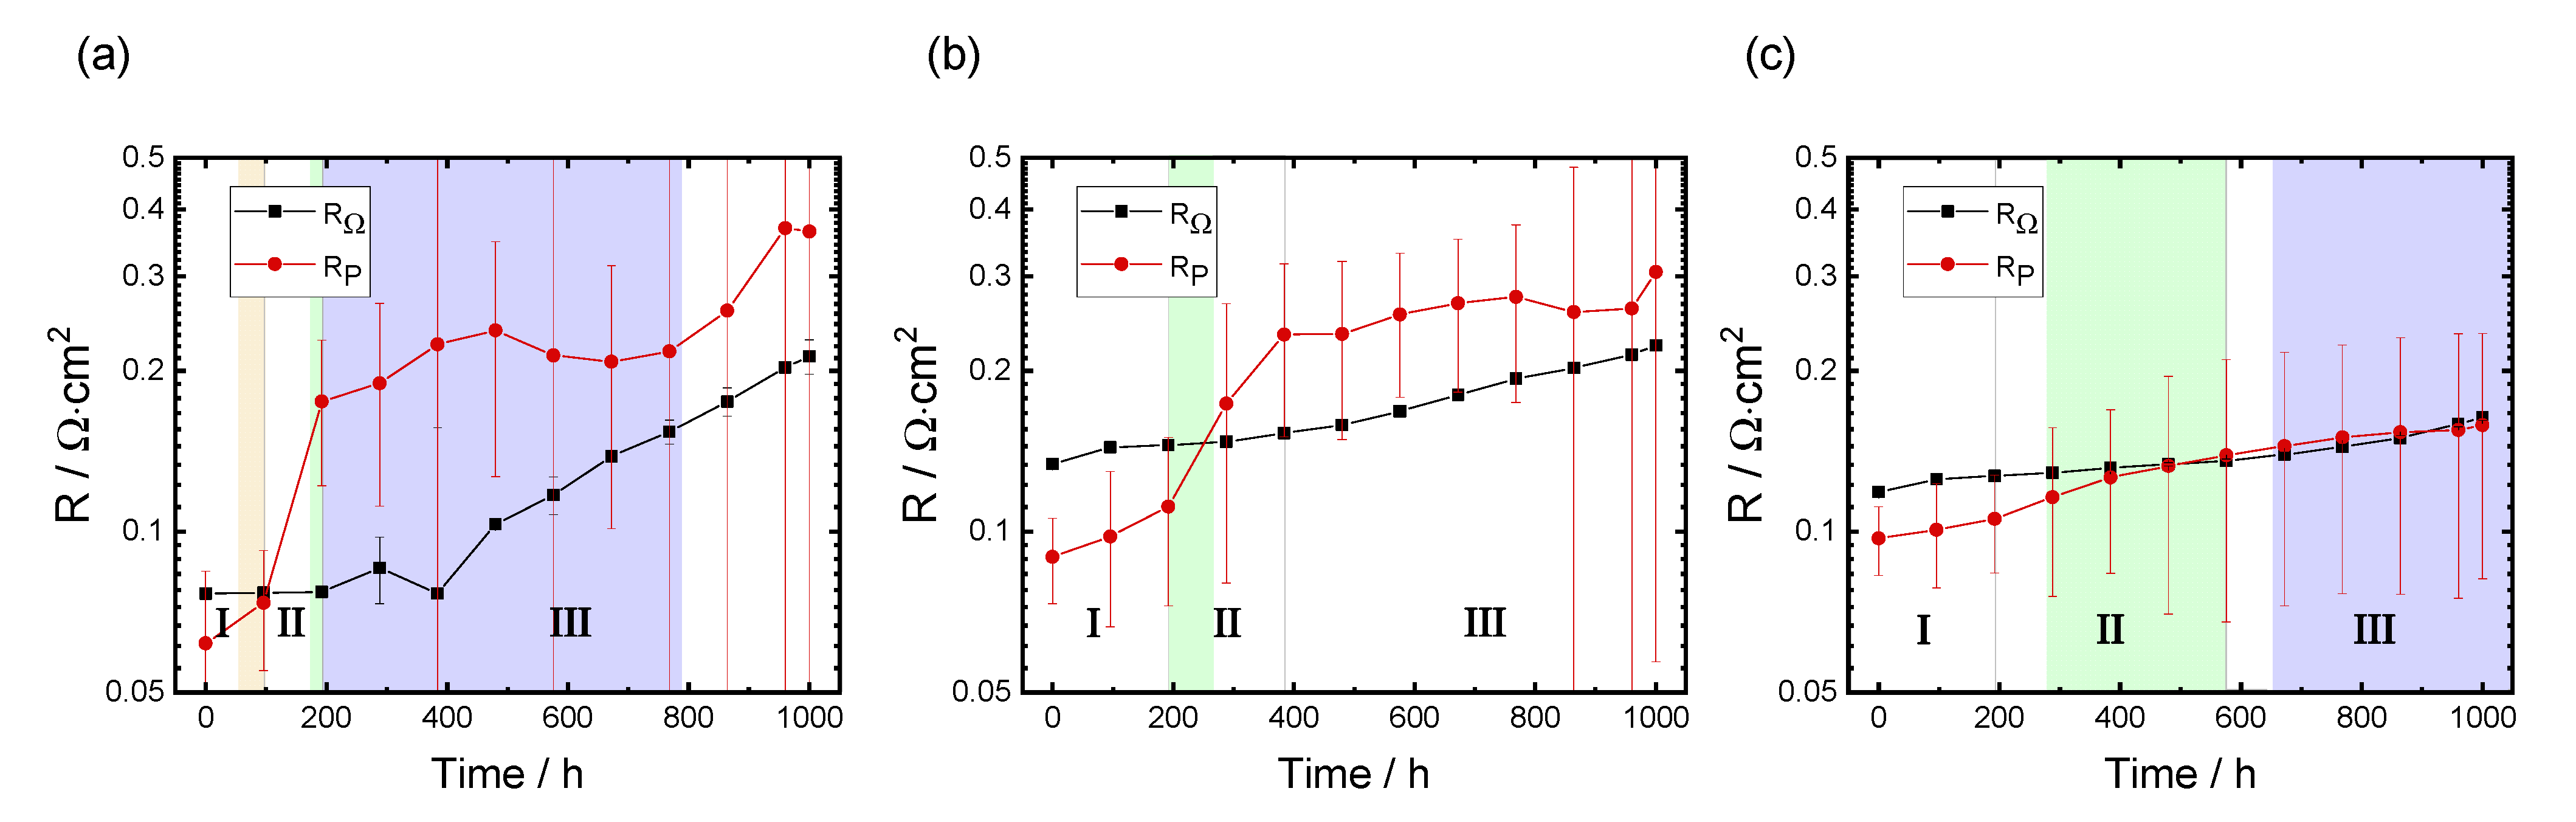
3.3.1. Evolution of RΩ and RP

The ASR evolution was broken down into the time-dependent RΩ and RP development for the three different measurement conditions, as shown in Figure 6.
In the initial degradation period for steam electrolysis at 800 °C, the RΩ remained constant within the error range (Figure 6a). However, the RP showed a different behavior; i.e., it increased sharply between 96 h to 192 h, similar to that of ASR (c.f. Figure 3). In the third degradation period, RP increased continuously up to 1000 h. At an operating temperature of 750 °C, RΩ showed almost a linear increase throughout up to 1000 h. The RP started to increase at around 200 h and exhibited a steep increase during the second degradation period from 200–384 h (Figure 6b). Thereafter, a continuous increase in RP was observed.
For co-electrolysis measurements, the RΩ showed a liner increase throughout up to 1000 h (Figure 6c). However, the increase was less steep compared to that with steam electrolysis at 750 °C. The variation of RP showed a linear behavior up to 1000 h, but interestingly, a lower increase in the total RP was observed for co-electrolysis (61.2 mΩ∙kh−1) compared to steam electrolysis at 750 °C (217 mΩ∙kh−1) and 800 °C (303 mΩ∙kh−1). This trend suggests that the cell degradation was more influenced by the RP in comparison to the RΩ and can be directly linked to the operating temperature and gas composition.

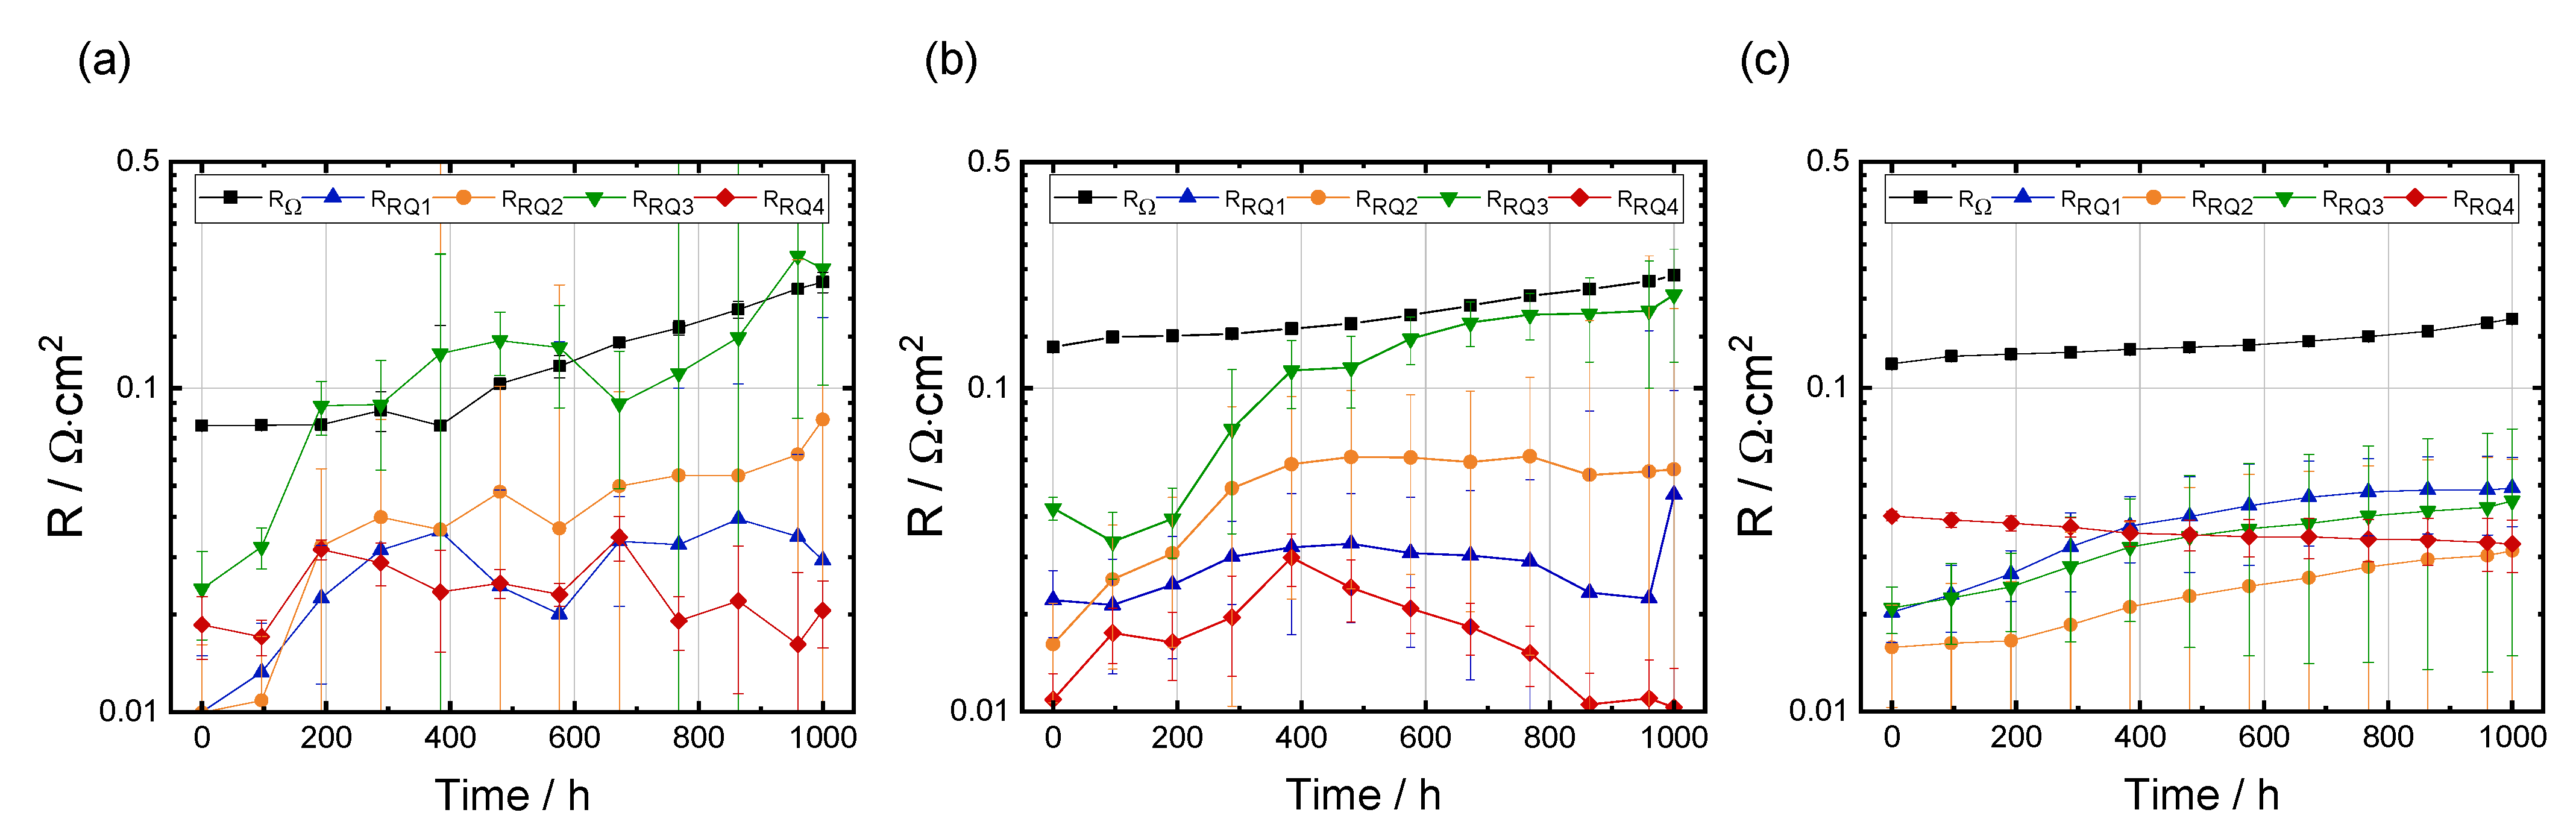
3.3.2. Breakdown of the Polarization Resistance

Following the ASR and EIS evolution analysis over time, the polarization resistance RP was investigated in more detail to determine the dominant degradation process. The variation of individual resistances for steam electrolysis at 800 and 750 °C (Figure 7a,b) showed the similar trend. The RRQ3 showed the largest increase with time among all the four resistances. Therefore, this process was the main cause of the increase in total RP. The processes modeled by RRQ1 and RRQ2 showed a lower increase in comparison to the RRQ3. In contrast, RRQ4 had no impact on the RP increase. For the co-electrolysis measurement, a different behavior was observed (Figure 7c). The processes RRQ1, RRQ2, and RRQ3 were mainly affected, however, RRQ1 showed a relatively higher increase compared to the steam electrolysis. The lower increase in the resistance of RQ1, RQ2 and RQ3 in co-electrolysis suggests the electrode processes linked to these resistances were less influenced under co-electrolysis operation conditions. The RRQ4 displayed no change over time for co-electrolysis, similar to that of steam electrolysis. The low-frequency process RQ4 (7.9–1.9 Hz) has been investigated previously through temperature as well as fuel gas variation and is associated with gas diffusion processes at the fuel electrode due to its negligible activation energy of 9.2 kJ∙mol−1 [41] and dependency on the fuel gas content [42]. Similarly, Leonide et al. [43] have also suggested that the gas diffusion processes occur with low thermal activation in this frequency range. The DRT analysis of electrochemical durability tests with a Ni-YSZ-supported single cell by Trini et al. [22] at 800 °C and −1 A∙cm−2 suggest the same development for a physical process around 10 Hz.
The process resistances RRQ1 (18.6–5.1 kHz) and RRQ2 (2.9–1.1 kHz) for steam and co-electrolysis, shown in Table 3, show an impact on cell degradation over the measurement time and are characterized by distinct thermal activation. RRQ1 displays negligible dependency on the fuel concentration, while the process-resistance RRQ2 is distinguished by distinct dependency on the steam and hydrogen partial pressures [41,43]. In fuel cell mode, these two coupled high-frequency processes were previously reported to be assigned to a charge transfer at the triple-phase boundary at the fuel side and the oxide ion transport in the YSZ matrix, according to Sonn et al. [44]. Trini et al. [22] supported this assignment of the high-frequency processes to the TPBs of the Ni/YSZ fuel electrode; therefore, these processes are related to the microstructure of the fuel electrode. This relation to the fuel electrode suggests that the resistance increase over time is connected to microstructural changes in this region. In consequence, these could cause a loss of conductivity in the fuel electrode.
The process given by RRQ3 (457–85 Hz) is mainly contributing to the increase in the polarization resistance over time and exhibits Arrhenius behavior [41]. The resistance curves of RRQ3 in Figure 7a,b show distinct temperature influence over time. Under steam electrolysis conditions at 800 °C, the resistance RRQ3 increases by around 210 mΩ∙cm2, which is higher compared to the cell at 750 °C (153 mΩ∙cm2). In co-electrolysis conditions, RRQ3 increases by 27 mΩ∙cm2. This suggests that the degradation process related to this resistance is temperature-dependent as well as fuel gas-dependent. The process RQ3 has been observed to be dependent on oxygen partial pressure as well as steam partial pressure [42,43]. The process part-dependent on oxygen partial pressure related to RQ3 is the electrochemical process at the TPBs of the LSC/CGO electrode and an oxygen electrode transport process [42]. The steam partial pressure influence of RQ3 is related to fuel electrode transport processes. In earlier studies, the overlap of these two influences has been observed [42,45]. The impact of fuel-side transport losses were shown to dominate the processes between 100 and 500 Hz [42]. A similar behavior is observed in our case, which suggests that the affected fuel side plays a dominant role in the cells’ degradation over time.

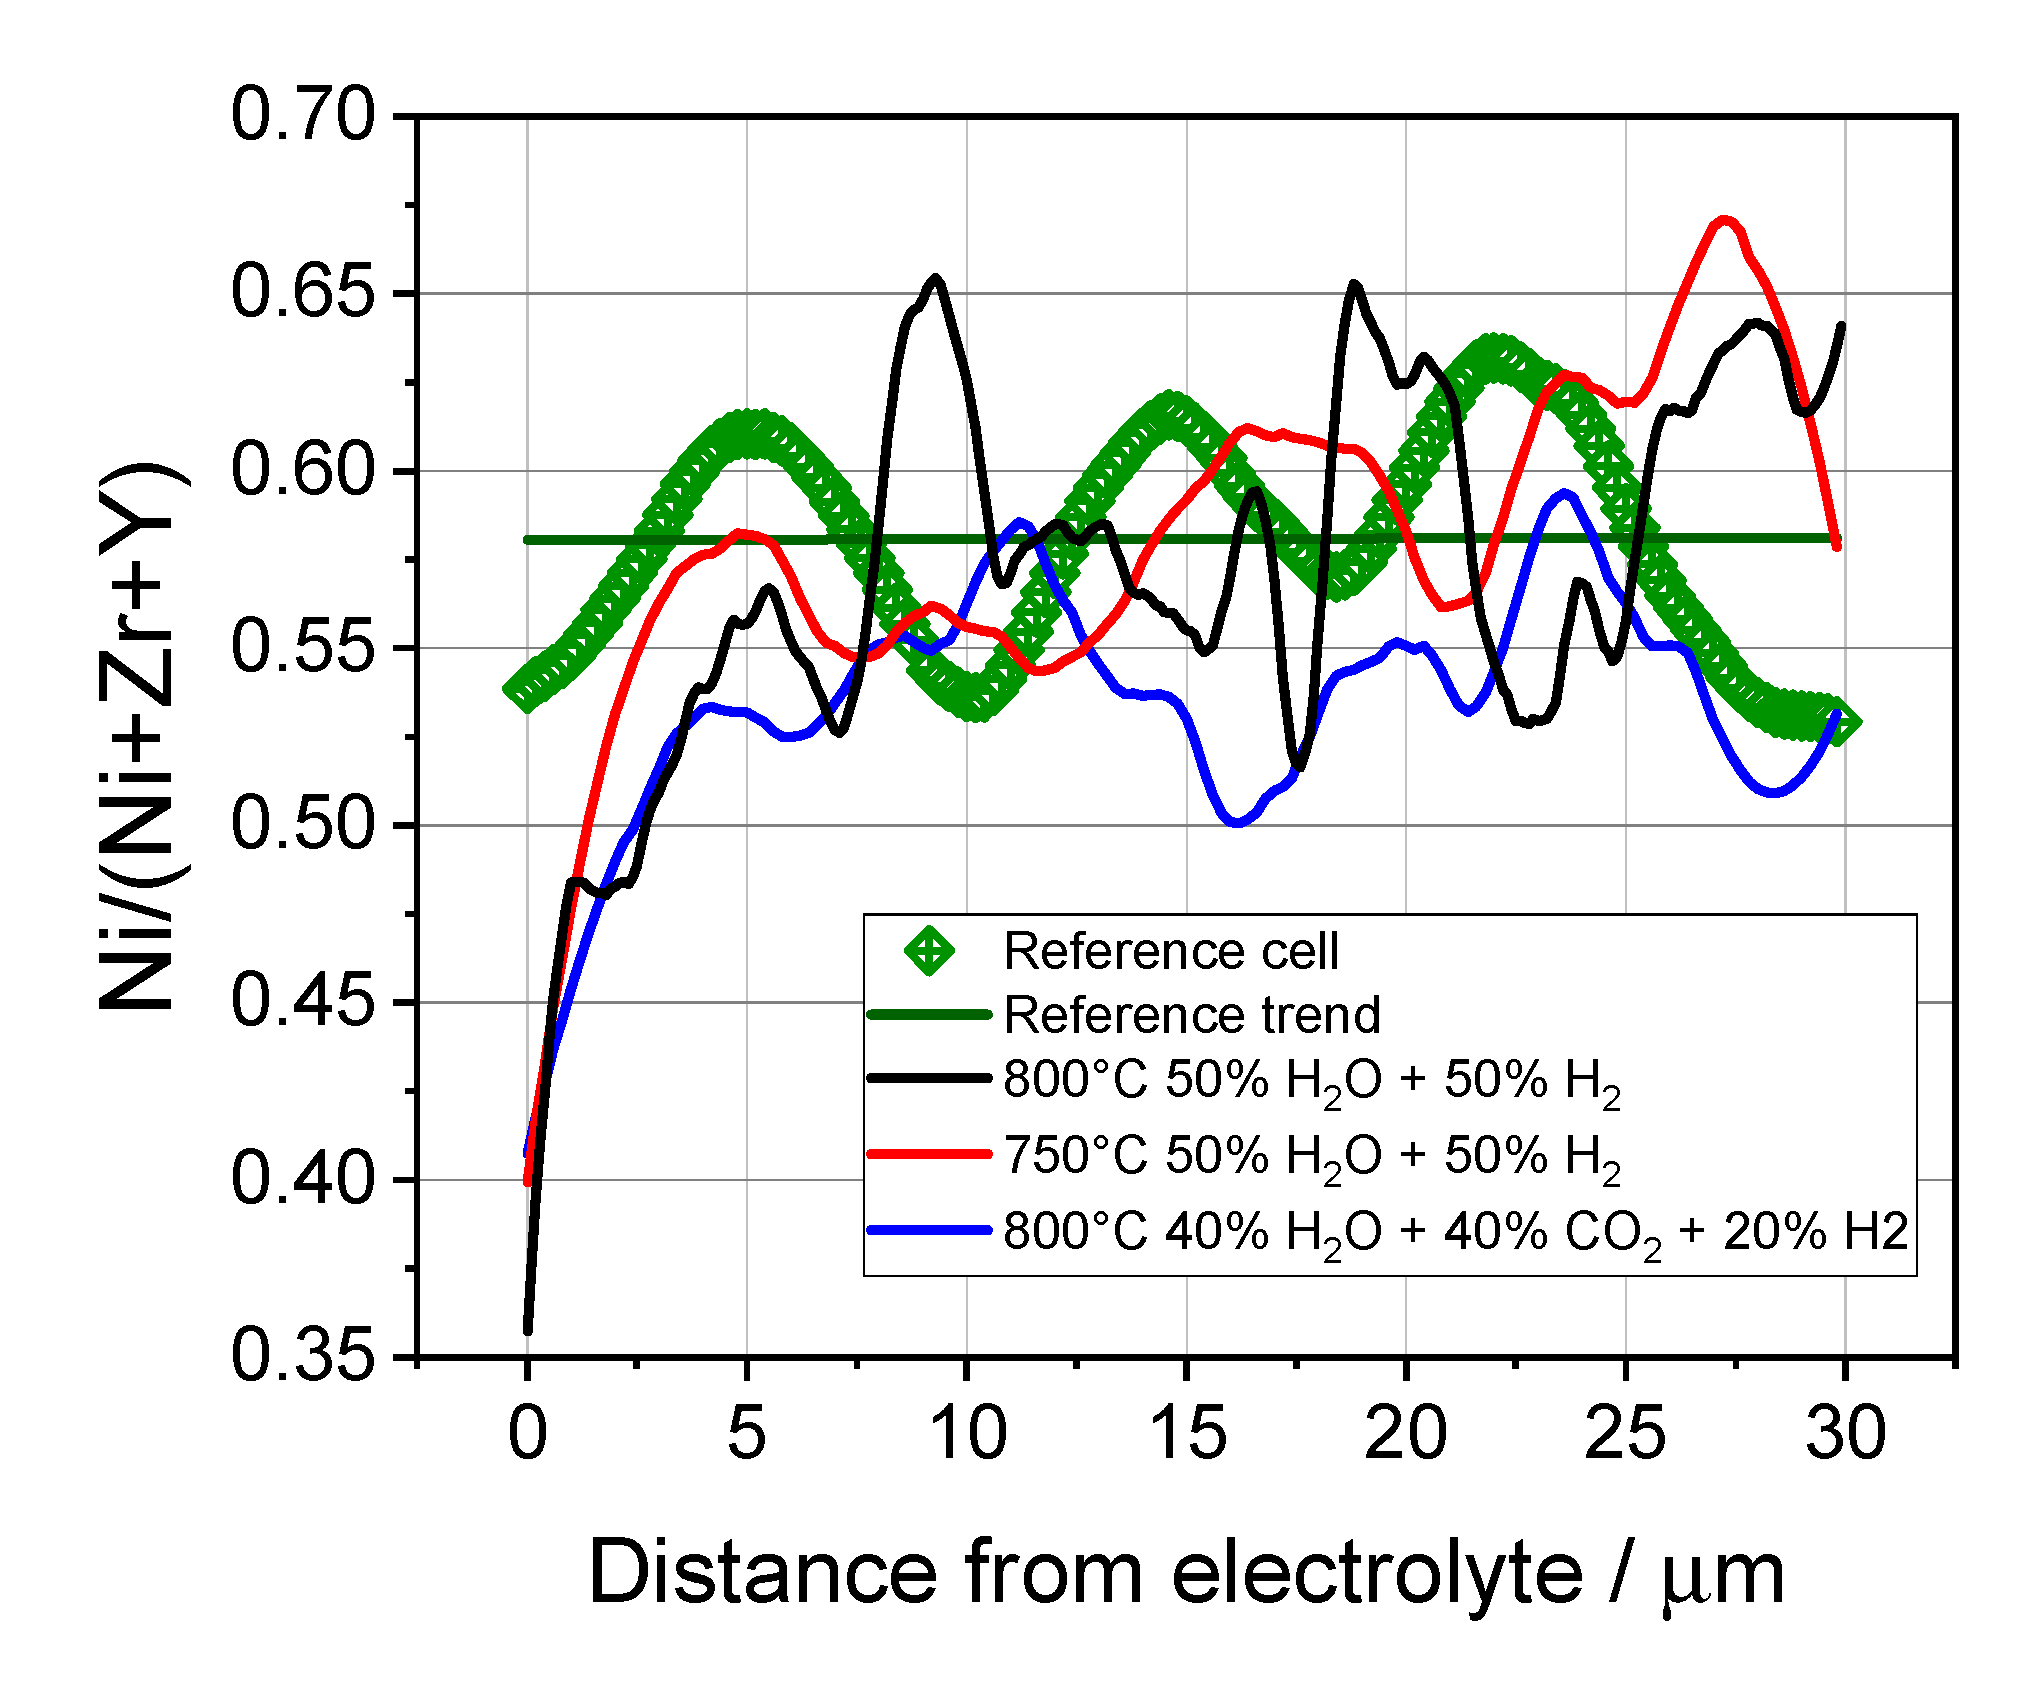
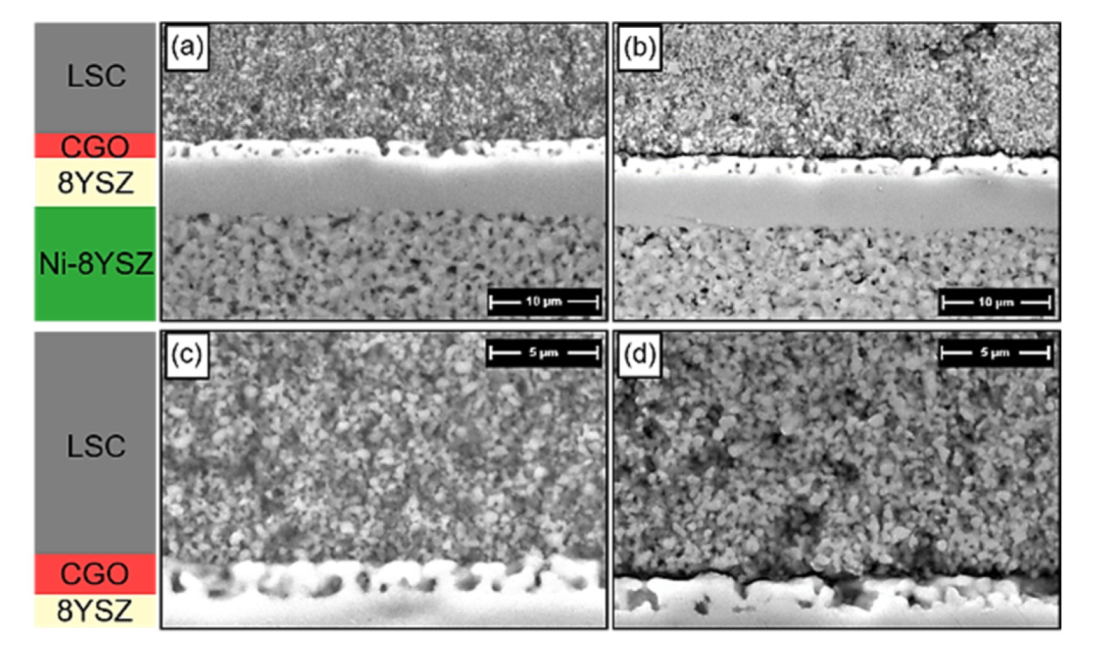
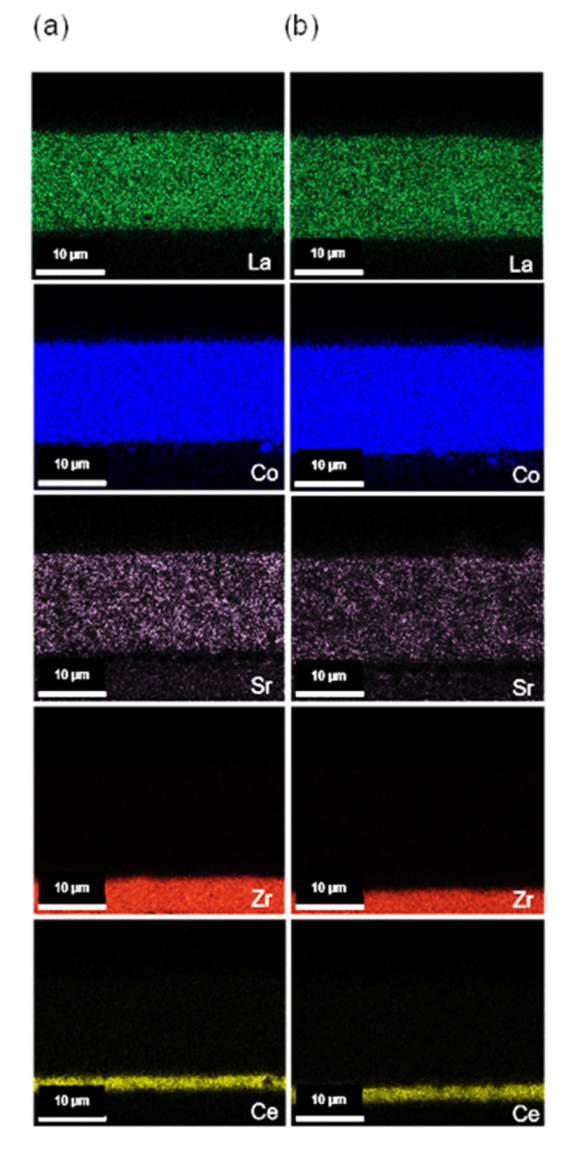
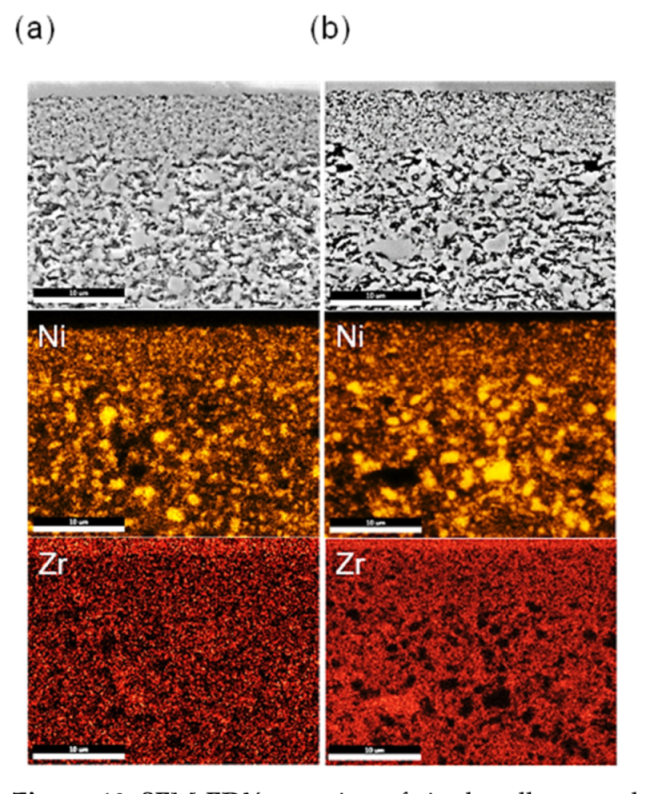
3.4. Microstructural Analysis

To further understand the degradation behavior, the single cells were investigated through in-depth SEM-EDX. The changes in the electrode microstructure as well as the adhesion between different layers were investigated after 1000 h and compared with the as-reduced cell.
Figure 8a,b shows the cross-section of the cell before and after the long-term test, where the bulk of the LSC oxygen electrode, LSC/CGO interface, CGO/YSZ interface, the bulk of the YSZ electrolyte and the Ni-YSZ fuel electrode are visible. No severe damage in the bulk of the LSC oxygen electrode, GDC layer, YSZ electrolyte, or Ni-YSZ fuel electrode was observed. However, the delamination of the LSC oxygen electrode at the LSC/CGO interface was visible for the single-cell operated under long-term electrolysis conditions. Such delamination is attributed to the evolution of oxygen, which penetrates pores of the electrolyte/electrode layer and builds up a high oxygen gradient under anodic polarization [16,17]. The oxygen electrode delamination results in an irreversible increase in ohmic resistance of the cell [15], which was observed in the increase of RΩ in Figure 6. This delamination can also lead to a large increase in the resistance (as observed for RRQ3) by hindering the charge and oxide ion transport at the TPBs of the LSC/CGO. Mostly, the delamination of the oxygen electrode is reported for LSM-based oxygen electrodes [15,16,17,46,47,48]; however, it was also observed for LSCF oxygen electrodes by Kim and Choi for electrolyte-supported cells without a CGO barrier layer after SOEC operation at 800 °C and −0.8 A∙cm−1 for 50 h [49]. The performance stability of single cells in electrolysis mode is enhanced with a CGO barrier layer. For instance, a cell with LSCF oxygen and CGO barrier layer showed a stable behavior and no delamination at 800 °C under electrolysis conditions up to 100 h with a current density of −0.8 A∙cm−2 [49,50]. In long-term tests up to 2000 h, the delamination of an LSC electrode was observed under steam electrolysis conditions despite the addition of a CGO inter-barrier layer [13]. For the long-term test with a co-electrolysis gas mixture (800 °C) as well as steam electrolysis (750 °C), the LSC oxygen electrode showed no delamination, as seen in supplementary information, Figure S2. Th SEM-EDX results show an even ion distribution before and after the durability test (Figure S3, supplement material). The XRD analysis showed as well that the LSC material did not decompose during the long-term durability tests (Figure S4, supplementary material).
The SEM-EDX analysis of the oxygen electrode for the reduced cell and the tested cell after 1000 h at 800 °C steam electrolysis is shown in Figure 9. The EDX results showed no strontium diffusion/segregation through the CGO barrier layer from the LSC electrode to the electrolyte/CGO interface, which is contrary to the LSCF oxygen electrode [51]. Besides Sr, the other elements, such as Co, La, Ce and Zr, were well distributed and located in the phase where they were expected and no cation segregation was observed. The measured cells exhibited an even ion distribution equivalent to that of the reference cell.
The fuel electrode/electrolyte interface and the bulk of the fuel electrode before and after the long-term durability test at 800 °C for steam electrolysis are depicted in Figure 10. The SEM image shows an increase in pore size and higher pore fraction close to the electrolyte/electrode interface, after long-term electrolysis test. The distribution of Ni in the active, as well as the support layer, was uneven after 1000 h under steam electrolysis conditions in comparison to the reference cell. The Ni migrated from the active layer and Ni particle agglomeration could be observed in the support layer at the interface to the active layer. Large Ni particle agglomerations evolved also around 20 µm from the electrolyte, resulting in Ni starvation, leaving only Zr and Y behind. However, this phenomenon is less severe for the cells operated under steam electrolysis at 750 °C or co-electrolysis at 800 °C, as shown in supplement material Figure S5. The depletion of Ni from the electrode/electrolyte interface and subsequent agglomeration decreased the cell performance due to a significant loss in the local density of active sites at the TPB. As seen earlier, the high-frequency processes (RQ1, RQ2), as well as the dually affected transport process RQ3, contributed to the increase of RP. Now it can be confirmed that the increase was mainly due to the change in the electrode microstructure which further impacted the charge transfer and transport reactions at the fuel electrode. Ni-depletion is well known in the cermet-based fuel electrodes [21,24,52]. Hauch et al. [53] suggested that the Ni is deposited away from the electrode/electrolyte interface by electrochemical reduction of gaseous Ni hydroxide species (Equations (4) and (5)).
Ni2+ + 2OH → Ni(OH)2(g)
Ni(OH)2(g) + 4e → Ni(s) + 2O2− + H2
The 3D reconstruction analysis of a single cell by Lay-Grindler et al. [54], operated under steam electrolysis at −0.8 A∙cm−2 and 800 °C for 1000 h, showed an increase in Ni particle size up to 1.704 µm and a decrease in the triple phase boundary (TPB) length. The comparison of steam and co-electrolysis in this work underlines that higher steam contributes to higher degradation.
Mogensen et al. [55] remarked that gaseous Ni migration below 800 °C is unlikely, because of the low reactant partial pressure. According to their hypothesis, the Ni particles migrate through the formation of gas or surface species of Ni(OH)x depending on the operating conditions. The Ni migration is described by Mogensen to be driven by the electrical potential, resulting in Ni migration along the pO2 and/or electrochemical potential gradients from positive local potential towards relative negative potential. This results in the TPB moving from the direct electrolyte/electrode interface to the electrode microstructure.
The Ni content in the Ni-YSZ active layer and support layer as a function of distance from the electrolyte was calculated from the EDX analysis for the as-reduced cell and the long-term operated cells. The Ni-content was obtained by performing three vertical EDX line scans at the cells’ cross-section after the long-term test from the electrolyte up to a 30 µm distance from the Ni-YSZ support layer. Afterward, the elements’ intensity counts were summed up and averaged in order to get an indication of the Ni content as a function of distance away from the electrolyte. The Ni/(Y + Zr + Ni) ratio was calculated for all measured cells and compared to the as-reduced reference cell and their variation as a function of distance is shown in Figure 11.
The averaged Ni content of a reduced cell was around 0.58 at the electrolyte/electrode interface, whereas for the long-term-operated cell under steam electrolysis conditions at 800 °C, the Ni content at the electrolyte/electrode interface was reduced to 0.4 and 0.36 at 750 °C and 800 °C, respectively. The cell measured in co-electrolysis conditions showed a slightly higher Ni content of 0.41 at the same level. The Ni content of all the three cells in a distance of up to 5 to 8 µm from the electrolyte was lower than the bulk content. These trends underline that all cells after SOEC operation showed Ni migration away from the electrolyte/electrode interface to the support layer. A largest Ni-depletion was observed for the single cell operated under steam electrolysis at 800 °C and the same cell showed the highest degradation rate. Similar observations were also made by Trini et al. [22] by SEM-EDX horizontal line scan analysis, in which the Ni content decreased from ~0.49 to ~0.28 after SOEC operation due to a pronounced decrease in percolating triple phase boundaries (TPBs). In addition, Sun et al. have reported the increased active electrode layer porosity within 10 μm from the electrode−electrolyte interface and densification of the neighboring support layer as a direct consequence of Ni redistribution [19]. This Ni migration was found to directly depend on the hydrogen-steam flow path. Therefore, it can be concluded that the Ni depletion and microstructural change in the fuel electrode are among the major issues that lead to a large degradation and performance loss under steam electrolysis conditions at 800 °C.

4. Conclusions

This study aimed to investigate the degradation behavior of Ni-YSZ/YSZ/GDC/LSC single cells under steam and co-electrolysis conditions. The single cells were characterized during long-term operation with a constant current load of −1 A∙cm−2 up to 1000 h at 750 °C and 800 °C under steam electrolysis conditions and at 800 °C under co-electrolysis conditions. The cells’ degradation mechanisms were analyzed after each 96 h using electrochemical impedance spectroscopy.
During long-term testing, the cell voltage was increased for all cells; however, a different behavior was observed under steam and co-electrolysis conditions. The cells’ operation under steam electrolysis conditions showed a large degradation rate (370 mV∙kh−1) compared to the co-electrolysis operation (178 mV∙kh−1) at 800 °C. The variation of measurement conditions showed that the increase in ASR was caused mainly by the increase of polarization resistance. In-depth impedance analysis revealed four different electrode processes; among them, the resistance associated with RQ3 showed the highest increase. This process combined the influence of the electrochemical process at the TPBs of the LSC/CGO electrode as well as transport losses at the fuel electrode side. The high-frequency processes connected with RQ1 and RQ2 also impacted the degradation over time. The resistances increased less severely and were linked to the charge transfer reaction at the triple-phase boundary at the fuel side and the oxide ion transport in the YSZ matrix. The low-frequency process RQ4 related to gas diffusion processes, on the other hand, exhibited nearly constant resistance over the measurement time. The post-test analysis of the measured cells up to 1000 h under steam electrolysis conditions at 800 °C showed the delamination of the LSC electrode. However, such delamination was absent for the single cells measured under co-electrolysis conditions or steam electrolysis conditions at 750 °C. In addition, Ni depletion in the active layer was observed for all the cells, however, it was more severe for steam electrolysis as compared to co-electrolysis conditions.

Supplementary Materials

The following supporting information can be downloaded at: https://www.mdpi.com/article/10.3390/en15155449/s1, Figure S1: EIS measurements with the single cells at OCV at 0 h and 1000 h with 9 l∙h−1 fuel consisting of (a) 50% H2 + 50% H2O at 800 °C and (b) 50% H2 + 50% H2O at 750 °C and (c) 40% H2O + 40% CO2 + 20% H2 at 800 °C, Figure S2: SEM-images at 20 keV of the oxygen electrode of the cell (a) after the durability test at 750 °C and 50% H2 + 50% H2O for 1000 h and (b) the durability test at 800 °C with 40% H2O + 40% CO2 + 20% H2 at for 1000 h, Figure S3: SEM-EDX mapping of single cells towards oxygen electrode side, Figure S4: XRD-image of the oxygen electrode of the cell before and after the durability tests for 1000 h, Figure S5: SEM-EDX mapping of single cells towards fuel electrode side, Table S1: Reduction of NiO in the cermet fuel electrode at 900 °C.

Author Contributions

Conceptualization, S.E.W., V.V., I.C.V. and L.G.J.d.H.; Formal analysis, S.E.W. and V.V.; Funding acquisition, I.C.V., R.-A.E. and L.G.J.d.H.; Investigation, S.E.W., V.V. and E.T.; Methodology, S.E.W., V.V., I.C.V. and L.G.J.d.H.; Project administration, I.C.V., R.-A.E. and L.G.J.d.H.; Resources, I.C.V., R.-A.E. and L.G.J.d.H.; Software, S.E.W. and I.C.V.; Supervision, V.V., I.C.V., R.-A.E. and L.G.J.d.H.; Validation, S.E.W., V.V., I.C.V. and L.G.J.d.H.; Writing—original draft, S.E.W.; Writing—review & editing, S.E.W. and V.V. All authors have read and agreed to the published version of the manuscript.

Funding

The author gratefully acknowledges funding by the German Federal Ministry of Education and Research (BMBF) within the SOC-Degradation 2.0 project: Transfer of knowledge into products for a “green hydrogen” vector—Impedance analysis of intrinsic and extrinsic degradation mechanisms in SOC cells and repeat units (FKZ 03SF0621A).

Institutional Review Board Statement

Not applicable.

Informed Consent Statement

Not applicable.

Data Availability Statement

Not applicable.

Conflicts of Interest

The authors declare no conflict of interest. The funders had no role in the design of the study; in the collection, analyses, or interpretation of data; in the writing of the manuscript, or in the decision to publish the results.

References

  1. Dittrich, L.; Nohl, M.; Jaekel, E.E.; Foit, S.; de Haart, L.; Eichel, R.-A. High-Temperature Co-Electrolysis: A Versatile Method to Sustainably Produce Tailored Syngas Compositions. J. Electrochem. Soc. 2019, 166, F971–F975. [Google Scholar] [CrossRef]
  2. Wachsman, E.D.; Lee, K.T. Lowering the temperature of solid oxide fuel cells. Science 2011, 334, 935–939. [Google Scholar] [CrossRef]
  3. Foit, S.R.; Vinke, I.C.; de Haart, L.G.J.; Eichel, R.-A. Power-to-Syngas: An Enabling Technology for the Transition of the Energy System? Angew. Chem. Int. Ed. 2017, 56, 5402–5411. [Google Scholar] [CrossRef] [PubMed]
  4. Zheng, Y.; Wang, J.; Yu, B.; Zhang, W.; Chen, J.; Qiao, J.; Zhang, J. A review of high temperature co-electrolysis of H2O and CO2 to produce sustainable fuels using solid oxide electrolysis cells (SOECs): Advanced materials and technology. Chem. Soc. Rev. 2017, 46, 1427–1463. [Google Scholar] [CrossRef] [PubMed]
  5. Carmo, M.; Fritz, D.L.; Mergel, J.; Stolten, D. A comprehensive review on PEM water electrolysis. Int. J. Hydrogen Energy 2013, 38, 4901–4934. [Google Scholar] [CrossRef]
  6. Sapountzi, F.M.; Gracia, J.M.; Weststrate, C.J.; Fredriksson, H.O.; Niemantsverdriet, J.W. Electrocatalysts for the generation of hydrogen, oxygen and synthesis gas. Prog. Energy Combust. Sci. 2017, 58, 1–35. [Google Scholar] [CrossRef] [Green Version]
  7. Mogensen, M.B. Thermodynamics of High Temperature H2O and CO2 Electrolysis; Technical University of Denmark: Lyngby, Denmark, 2020. [Google Scholar]
  8. Brisse, A.; Schefold, J.; Zahid, M. High temperature water electrolysis in solid oxide cells. Int. J. Hydrogen Energy 2008, 33, 5375–5382. [Google Scholar] [CrossRef]
  9. Shiva Kumar, S.; Himabindu, V. Hydrogen production by PEM water electrolysis—A review. Mater. Sci. Energy Technol. 2019, 2, 442–454. [Google Scholar] [CrossRef]
  10. Fang, Q.; Blum, L.; Menzler, N.H.; Stolten, D. Solid Oxide Electrolyzer Stack with 20,000 h of Operation. ECS Trans. 2017, 78, 2885–2893. [Google Scholar] [CrossRef]
  11. Hauch, A.; Ebbesen, S.D.; Jensen, S.H.; Mogensen, M. Highly efficient high temperature electrolysis. J. Mater. Chem. 2008, 18, 2331. [Google Scholar] [CrossRef]
  12. Blum, L.; Packbier, U.; Vinke, I.C.; de Haart, L.G.J. Long-Term Testing of SOFC Stacks at Forschungszentrum Jülich. Fuel Cells 2013, 13, 646–653. [Google Scholar] [CrossRef]
  13. Mawdsley, J.R.; David Carter, J.; Jeremy Kropf, A.; Yildiz, B.; Maroni, V.A. Post-test evaluation of oxygen electrodes from solid oxide electrolysis stacks☆. Int. J. Hydrogen Energy 2009, 34, 4198–4207. [Google Scholar] [CrossRef]
  14. Fergus, J.W. Electrolytes for solid oxide fuel cells. J. Power Sources 2006, 162, 30–40. [Google Scholar] [CrossRef]
  15. Knibbe, R.; Traulsen, M.L.; Hauch, A.; Ebbesen, S.D.; Mogensen, M. Solid Oxide Electrolysis Cells: Degradation at High Current Densities. J. Electrochem. Soc. 2010, 157, B1209. [Google Scholar] [CrossRef]
  16. Momma, A.; Kato, T.; Kaga, Y.; Nagata, S. Polarization Behavior of High Temperature Solid Oxide Electrolysis Cells (SOEC). J. Ceram. Soc. Japan 1997, 105, 369–373. [Google Scholar] [CrossRef] [Green Version]
  17. Brichzin, V. The geometry dependence of the polarization resistance of Sr-doped LaMnO3 microelectrodes on yttria-stabilized zirconia. Solid State Ion. 2002, 152–153, 499–507. [Google Scholar] [CrossRef]
  18. Adler, S.B. Factors governing oxygen reduction in solid oxide fuel cell cathodes. Chem. Rev. 2004, 104, 4791–4843. [Google Scholar] [CrossRef] [PubMed]
  19. The, D.; Grieshammer, S.; Schroeder, M.; Martin, M.; Al Daroukh, M.; Tietz, F.; Schefold, J.; Brisse, A. Microstructural comparison of solid oxide electrolyser cells operated for 6100 h and 9000 h. J. Power Sources 2015, 275, 901–911. [Google Scholar] [CrossRef]
  20. Hjalmarsson, P.; Sun, X.; Liu, Y.-L.; Chen, M. Influence of the oxygen electrode and inter-diffusion barrier on the degradation of solid oxide electrolysis cells. J. Power Sources 2013, 223, 349–357. [Google Scholar] [CrossRef]
  21. Sun, X.; Hendriksen, P.V.; Mogensen, M.B.; Chen, M. Degradation in Solid Oxide Electrolysis Cells During Long Term Testing. Fuel Cells 2019, 19, 740–747. [Google Scholar] [CrossRef]
  22. Trini, M.; Hauch, A.; de Angelis, S.; Tong, X.; Hendriksen, P.V.; Chen, M. Comparison of microstructural evolution of fuel electrodes in solid oxide fuel cells and electrolysis cells. J. Power Sources 2020, 450, 227599. [Google Scholar] [CrossRef]
  23. Monaco, F.; Hubert, M.; Vulliet, J.; Ouweltjes, J.P.; Montinaro, D.; Cloetens, P.; Piccardo, P.; Lefebvre-Joud, F.; Laurencin, J. Degradation of Ni-YSZ Electrodes in Solid Oxide Cells: Impact of Polarization and Initial Microstructure on the Ni Evolution. J. Electrochem. Soc. 2019, 166, F1229–F1242. [Google Scholar] [CrossRef]
  24. Trini, M.; Jørgensen, P.S.; Hauch, A.; Bentzen, J.J.; Hendriksen, P.V.; Chen, M. 3D Microstructural Characterization of Ni/YSZ Electrodes Exposed to 1 Year of Electrolysis Testing. J. Electrochem. Soc. 2019, 166, F158–F167. [Google Scholar] [CrossRef] [Green Version]
  25. Sun, X.; Liu, Y.; Hendriksen, P.V.; Chen, M. An operation strategy for mitigating the degradation of solid oxide electrolysis cells for syngas production. J. Power Sources 2021, 506, 230136. [Google Scholar] [CrossRef]
  26. Hoerlein, M.P.; Riegraf, M.; Costa, R.; Schiller, G.; Friedrich, K.A. A parameter study of solid oxide electrolysis cell degradation: Microstructural changes of the fuel electrode. Electrochim. Acta 2018, 276, 162–175. [Google Scholar] [CrossRef]
  27. Hauch, A.; Brodersen, K.; Chen, M.; Mogensen, M.B. Ni/YSZ electrodes structures optimized for increased electrolysis performance and durability. Solid State Ion. 2016, 293, 27–36. [Google Scholar] [CrossRef] [Green Version]
  28. Blum, L.; de Haart, L.; Malzbender, J.; Menzler, N.H.; Remmel, J.; Steinberger-Wilckens, R. Recent results in Jülich solid oxide fuel cell technology development. J. Power Sources 2013, 241, 477–485. [Google Scholar] [CrossRef]
  29. Blum, L.; de Haart, L.G.J.; Malzbender, J.; Margaritis, N.; Menzler, N.H. Anode-Supported Solid Oxide Fuel Cell Achieves 70,000 Hours of Continuous Operation. Energy Technol. 2016, 4, 939–942. [Google Scholar] [CrossRef]
  30. Chen, M.; Høgh, J.V.T.; Nielsen, J.U.; Bentzen, J.J.; Ebbesen, S.D.; Hendriksen, P.V. High Temperature Co-Electrolysis of Steam and CO2 in an SOC Stack: Performance and Durability. Fuel Cells 2013, 13, 638–645. [Google Scholar] [CrossRef]
  31. Chen, K.; Jiang, S.P. Review—Materials Degradation of Solid Oxide Electrolysis Cells. J. Electrochem. Soc. 2016, 163, F3070–F3083. [Google Scholar] [CrossRef]
  32. Fang, Q.; Frey, C.E.; Menzler, N.H.; Blum, L. Electrochemical Performance and Preliminary Post-Mortem Analysis of a Solid Oxide Cell Stack with 20,000 h of Operation. J. Electrochem. Soc. 2018, 165, F38–F45. [Google Scholar] [CrossRef]
  33. Elcogen, A.S. Solid Oxide Cells. Available online: https://elcogen.com/products/solid-oxide-fuel-cells/ (accessed on 23 July 2022).
  34. Schiemann, K.; Vibhu, V.; Yildiz, S.; Vinke, I.C.; Eichel, R.-A.; de Haart, L. Chrome Poisoning of Non-Manganiferous Cathode Materials in Solid Oxide Fuel Cells (SOFCs). ECS Trans. 2017, 78, 1027–1034. [Google Scholar] [CrossRef]
  35. Schefold, J.; Brisse, A.; Poepke, H. 23,000 h steam electrolysis with an electrolyte supported solid oxide cell. Int. J. Hydrogen Energy 2017, 42, 13415–13426. [Google Scholar] [CrossRef]
  36. Schefold, J.; Poepke, H.; Brisse, A. Solid Oxide Electrolyser Cell Testing Up to the Above 30,000 h Time Range. ECS Trans. 2020, 97, 553–563. [Google Scholar] [CrossRef]
  37. Rao, M.; Sun, X.; Hagen, A. A Comparative Study of Durability of Solid Oxide Electrolysis Cells Tested for Co-Electrolysis under Galvanostatic and Potentiostatic Conditions. J. Electrochem. Soc. 2018, 165, F748–F755. [Google Scholar] [CrossRef] [Green Version]
  38. Jerôme, A. Modeling and Experimental Validation of High Temperature Steam and Carbon Dioxide Co-Electrolysis. Ph.D. Thesis, Université de Grenoble, Saint-Martin-d’Hères, France, 2014. [Google Scholar]
  39. Lillmaa, K.; Maide, M.; Kanarbik, R.; Nurk, G.; Lust, E. Electrochemical Characteristics and Gas Composition Generated by La 0.8 Sr 0.2 Cr 0.5 Mn 0.5 O 3–δ Cathode at Electrolysis and Co-Electrolysis Modes. J. Electrochem. Soc. 2016, 163, F3190–F3196. [Google Scholar] [CrossRef]
  40. Tao, Y.; Ebbesen, S.D.; Mogensen, M.B. Degradation of solid oxide cells during co-electrolysis of steam and carbon dioxide at high current densities. J. Power Sources 2016, 328, 452–462. [Google Scholar] [CrossRef]
  41. Wolf, S.E.; Dittrich, L.; Nohl, M.; Duyster, T.; Vinke, I.C.; Eichel, R.-A.; de Haart, L. Boundary Investigation of High-Temperature Co-Electrolysis towards Direct CO2 Electrolysis. J. Electrochem. Soc. 2022, 169, 034531. [Google Scholar] [CrossRef]
  42. Caliandro, P.; Nakajo, A.; Diethelm, S.; van Herle, J. Model-assisted identification of solid oxide cell elementary processes by electrochemical impedance spectroscopy measurements. J. Power Sources 2019, 436, 226838. [Google Scholar] [CrossRef]
  43. André, L. SOFC Modelling and Parameter Identification by Means of Impedance Spectroscopy. Ph.D. Thesis, Universität Karlsruhe, Karlsruhe, Germany, 2010. [Google Scholar]
  44. Sonn, V.; Leonide, A.; Ivers-Tiffée, E. Combined Deconvolution and CNLS Fitting Approach Applied on the Impedance Response of Technical Ni∕8YSZ Cermet Electrodes. J. Electrochem. Soc. 2008, 155, B675. [Google Scholar] [CrossRef]
  45. Leonide, A.; Sonn, V.; Weber, A.; Ivers-Tiffée, E. Evaluation and Modeling of the Cell Resistance in Anode-Supported Solid Oxide Fuel Cells. J. Electrochem. Soc. 2008, 155, B36. [Google Scholar] [CrossRef]
  46. Graves, C.; Ebbesen, S.D.; Mogensen, M. Co-electrolysis of CO2 and H2O in solid oxide cells: Performance and durability. Solid State Ion. 2011, 192, 398–403. [Google Scholar] [CrossRef]
  47. Chen, K.; Jiang, S.P. Failure mechanism of (La, Sr)MnO3 oxygen electrodes of solid oxide electrolysis cells. Int. J. Hydrogen Energy 2011, 36, 10541–10549. [Google Scholar] [CrossRef]
  48. Kim, J.; Ji, H.-I.; Dasari, H.P.; Shin, D.; Song, H.; Lee, J.-H.; Kim, B.-K.; Je, H.-J.; Lee, H.-W.; Yoon, K.J. Degradation mechanism of electrolyte and air electrode in solid oxide electrolysis cells operating at high polarization. Int. J. Hydrogen Energy 2013, 38, 1225–1235. [Google Scholar] [CrossRef]
  49. Kim, S.J.; Choi, G.M. Stability of LSCF electrode with GDC interlayer in YSZ-based solid oxide electrolysis cell. Solid State Ion. 2014, 262, 303–306. [Google Scholar] [CrossRef]
  50. Kim, S.J.; Kim, K.J.; Choi, G.M. Effect of Ce0.43Zr0.43Gd0.1Y0.04O2−δ contact layer on stability of interface between GDC interlayer and YSZ electrolyte in solid oxide electrolysis cell. J. Power Sources 2015, 284, 617–622. [Google Scholar] [CrossRef]
  51. Vibhu, V.; Vinke, I.C.; Zaravelis, F.; Neophytides, S.G.; Niakolas, D.K.; Eichel, R.-A.; de Haart, L.G.J. Performance and Degradation of Electrolyte-Supported Single Cell Composed of Mo-Au-Ni/GDC Fuel Electrode and LSCF Oxygen Electrode during High Temperature Steam Electrolysis. Energies 2022, 15, 2726. [Google Scholar] [CrossRef]
  52. Hjalmarsson, P.; Sun, X.; Liu, Y.-L.; Chen, M. Durability of high performance Ni–yttria stabilized zirconia supported solid oxide electrolysis cells at high current density. J. Power Sources 2014, 262, 316–322. [Google Scholar] [CrossRef]
  53. Hauch, A.; Ebbesen, S.D.; Jensen, S.H.; Mogensen, M. Solid Oxide Electrolysis Cells: Microstructure and Degradation of the Ni/Yttria-Stabilized Zirconia Electrode. J. Electrochem. Soc. 2008, 155, B1184. [Google Scholar] [CrossRef] [Green Version]
  54. Lay-Grindler, E.; Laurencin, J.; Villanova, J.; Cloetens, P.; Bleuet, P.; Mansuy, A.; Mougin, J.; Delette, G. Degradation study by 3D reconstruction of a nickel–yttria stabilized zirconia cathode after high temperature steam electrolysis operation. J. Power Sources 2014, 269, 927–936. [Google Scholar] [CrossRef]
  55. Mogensen, M.B.; Chen, M.; Frandsen, H.L.; Graves, C.; Hauch, A.; Hendriksen, P.V.; Jacobsen, T.; Jensen, S.H.; Skafte, T.L.; Sun, X. Ni migration in solid oxide cell electrodes: Review and revised hypothesis. Fuel Cells 2021, 21, 415–429. [Google Scholar] [CrossRef]
Figure 1. (a) Cell voltage development under galvanostatic degradation test and (b) degradation rate as a function of time.
Energies 15 05449 g001
Figure 2. Comparison of iV curves before and after the durability tests.
Energies 15 05449 g002
Figure 3. Evolution of ASR during long-term electrolysis measurements.
Energies 15 05449 g003
Figure 4. Intermitted EIS measurements with the single cells at OCV from 0 h to 1000 h with 9 L∙h−1 fuel consisting of (a) 50% H2 + 50% H2O at 800 °C and (b) 50% H2 + 50% H2O at 750 °C and (c) 40% H2O + 40% CO2 + 20% H2 at 800 °C.
Energies 15 05449 g004
Figure 5. (a) Comparison of DRT plots of measured and fitted data, and (b) Nyquist plot fitted with 4RQ model, for steam electrolysis with 50% H2O + 50% H2 gas mixture measured at 800 °C at OCV.
Energies 15 05449 g005
Figure 6. Development of RΩ and RP as a function of time measured at OCV for the gas composition (a) 800 °C 50% H2 + 50% H2O, (b) 750 °C 50% H2 + 50% H2O, (c) 800 °C 40% H2O + 40% CO2 + 20% H2.
Energies 15 05449 g006
Figure 7. Individual resistance analysis for intermitted EIS at OCV from 0 h to 1000 h with 9 L∙h−1 fuel consisting of (a) 50% H2 + 50% H2O at 800 °C, (b) 50% H2 + 50% H2O at 750 °C, (c) 40% H2O + 40% CO2 + 20% H2 at 800 °C.
Energies 15 05449 g007
Figure 8. SEM images of the cross-section of the cells (a,c) before and (b,d) after the long-term test at 800 °C with 50% H2 + 50% H2O. SEM images focused on oxygen electrode side (c,d).
Energies 15 05449 g008
Figure 9. SEM-EDX mapping of single cells towards oxygen electrode side for La (Lα, 4.65 keV), Co (Kα, 6.92 keV), Sr (Lα, 1.81 keV), Ce (Lα, 4.84 keV), and Zr (Lα, 2.04 keV) (a) before, and (b) after 1000 h durability test at 800 °C with 50% H2 + 50% H2O.
Energies 15 05449 g009
Figure 10. SEM-EDX mapping of single cells towards the fuel electrode side for Ni (Kα, 7.47 keV), Zr (Lα, 1.81 keV) line (a) before and (b) after the long-term test up to 1000 h at 800 °C with 50% H2 + 50% H2O.
Energies 15 05449 g010
Figure 11. Comparison of Ni/(Zr + Y + Ni) (atomic ratio) mean value of the fuel electrode per cell to the distance from the YSZ electrolyte. The EDX results were measured close to the electrode/electrolyte interface (average of results computed on 30 × 4 μm2 areas).
Energies 15 05449 g011
Table 1. Overview of the absolute voltage increase after 1000 h degradation test depending on measurement conditions.
Gas Inlet/%T/°CU0h/VU1000h/V∆U/V% Degradation
50% H2 + 50% H2O8001.1061.4760.37033
50% H2 + 50% H2O7501.2091.4680.25922
40% H2O + 40% CO2 + 20% H28001.1271.3060.17916
Table 2. Changes in ohmic and polarization resistance at the beginning and the end of durability testing.
Gas Inlet/%T/°C∆RΩ/mΩ∙cm2∆RP/mΩ∙cm2
50% H2 + 50% H2O800136302
50% H2 + 50% H2O75089216
40% H2O + 40% CO2 + 20% H28004561
Table 3. Relaxation processes frequency obtained by impedance spectroscopy after 1000 h, for steam electrolysis (50% H2 + 50% H2O) and co-electrolysis (40% H2O + 40% CO2 + 20% H2) at 800 °C.
ProcessSteam Electrolysis, 800 °C (Hz)Co-Electrolysis, 800 °C (Hz)
RRQ118,6005105
RRQ229501100
RRQ345785
RRQ47.91.9
Publisher’s Note: MDPI stays neutral with regard to jurisdictional claims in published maps and institutional affiliations.

