Article

Understanding the Frequency Characteristics of Current Error and Phase Displacement of the Corrected Inductive Current Transformer

Institute of Mechatronics and Information Systems, Lodz University of Technology, 90-537 Lodz, Poland
*
Author to whom correspondence should be addressed.
Energies 2022, 15(15), 5436; https://doi.org/10.3390/en15155436
Submission received: 21 June 2022 / Revised: 14 July 2022 / Accepted: 26 July 2022 / Published: 27 July 2022
(This article belongs to the Special Issue Development of Voltage and Current Transformers in Power System)

Abstract

:
The paper presents investigations and analysis of the parameters of the magnetic part of the equivalent circuit of the inductive CT in the frequencies range from 50 Hz to 5 kHz. Therefore, a measuring circuit used to determine the values of the transverse branch elements was developed. The research performed helps to understand the obtained values of the frequency characteristics of the current error and phase displacement of the corrected inductive current transformer. Moreover, the vectorial diagrams for the 1st, 20th and 100th harmonics are provided with consideration of the influence of the applied turns number correction of the secondary winding. The obtained results show that the increase in the frequency of transformed higher harmonics may cause a decrease in the values of the current error and phase displacement for the non-corrected inductive current transformer. However, if the number of turns of the secondary winding is corrected, the behavior is reversed, where the values of the current error are higher with increased frequency. In the paper, the influence of the self-generation phenomenon of the low-order harmonics is also considered.

1. Introduction

Inductive current transformers (CTs) are one of the most popular devices used in the power system to convert high values of currents into a measurable level for metering and protection apparatus. Nonlinear loads connected to the power grid cause a distortion of the sinusoidal currents and voltages [1,2,3,4]. The advantage of Ref. [4] is that the inductive CTs are tested under the conditions of transformation of real waveforms collected from the power grid. The obtained results indicate their good meteorological performance even under off-nominal conditions. For an evaluation of their accuracy, the composite error is measured [5]. Instrument transformers are commonly used in the various types of solutions, used both at low and high voltage, and their measurement accuracy is an extremely important parameter, e.g., from the point of view of assessing the quality of electricity or use in the so-called smart grid. It is especially important to evaluate their work in the case of distortions in the sinusoidal wave, which is a consequence of the increasing use of interfering devices (e.g., inverters, rectifiers) [6,7,8]. To determine the active and reactive power with these disturbances, new requirements for inductive CTs arise. Therefore, it is important to evaluate the frequency characteristics of the current error and phase displacement for the transformation of distorted current harmonics. Moreover, all the inductive CTs used in the power grid are equipped with the applied turns number correction of the secondary winding. This solution is used to obtain lower values of the current error determined for the transformation of the sinusoidal current with a frequency 50 Hz (60 Hz) and achieving a higher accuracy class in accordance with the standard IEC 61869-2 [9].
To evaluate the inductive CTs’ accuracy for the transformation of distorted current, differential measuring systems are used [10,11]. The measurements are performed in the rated ampere turns conditions as the equivalent method to reproduce the same operating conditions as for supplying the CT with the rated primary current [12,13,14]. The advantage of this solution is that the composite error is directly determined. This decreases significantly the measurement uncertainty of the calculated values of current error and phase displacement [15]. Other popular methods to evaluate the accuracy of CTs are based on direct measurement of the primary and secondary current by the digital acquisition systems [16,17,18]. It is also possible to obtain high distorted current values by the application of the special amplifier systems [18,19,20]. The metrological performance of the inductive CTs is dependent on the magnetic core and its nonlinear magnetization characteristic [21,22,23]. The approach presented in Ref. [23] consists of the utilization of the artificial neutral network to avoid the impact of other phenomena exiting in the power grids, such as transient states, on the transformation accuracy of the inductive CTs. The studies are performed for two different CTs made from a silicon iron alloy and nanocrystalline alloy magnetic core. Moreover, in Refs. [17,24,25,26], the methods of compensation for the inductive CTs’ transformation errors are proposed. The first one [26] is based on a linear approximation of the magnetization characteristic of the magnetic core, i.e., considering only the small linear region. Therefore, using this assumption, it is possible to implement digital filters to improve the frequency response of the tested CT. Another solution [24] uses a modified least-squares error algorithm and fully trained artificial neural networks to perform online calibration of the CT installed in the power stations. This ensures the reconstruction of the secondary current in the condition of transformation of transient waves and environmental noises. However, our studies presented in Refs. [10,15] show that the nonlinearity of the magnetization characteristic of the magnetic core significantly reduces the effectiveness of compensation. This is due to the fact that low-order harmonics of the distorted primary current cause the change in the value of the magnetic flux density.
In this paper, the method to determine the active and reactive components of the excitation current, as well as the values of the resistance representing active power losses in the magnetic core and the mutual reactance of the windings, are presented. Moreover, the determined frequency characteristics of the current error and phase displacement are analyzed and their course explained via the determined equivalent circuit parameters. Therefore, to understand the courses of these characteristics, the vectorial diagrams are presented, considering the influence of the applied turns number correction of the secondary winding. The presented measurements circuit enables the determination of the magnetic properties of the inductive CTs’ magnetic core. To summarize the novelty of the paper, the main achievements are highlighted in bullet points:
  • development of the measuring circuit used to determine the magnetic part of the equivalent circuit of the inductive CT,
  • evaluation of the transverse branch parameters of the equivalent circuit in a range of frequencies, from 50 Hz to 5 kHz,
  • analysis of the values of the active and reactive component of the excitation current in the considered frequencies range,
  • correlation of the frequency characteristics of the magnetic part of the equivalent circuit parameters with the obtained frequency characteristics of the current error and phase displacement,
  • analysis of the influence of the self-generation phenomenon on the determined values of the transverse branch parameters of the equivalent circuit,
  • construction of the vectorial diagram with considered influence of the applied turns number correction of the secondary winding,
  • analysis of the change of the inductive CT vectorial diagrams with the increasing frequency of transformed distorted higher harmonics.
The problem under study concerns the source of the inductive CTs’ accuracy deterioration for the transformation distorted currents. Therefore, the vectorial diagrams clearly show the relation between the considered vectors and their positioning related to the obtained values of the current error and phase displacement in the considered frequencies range.

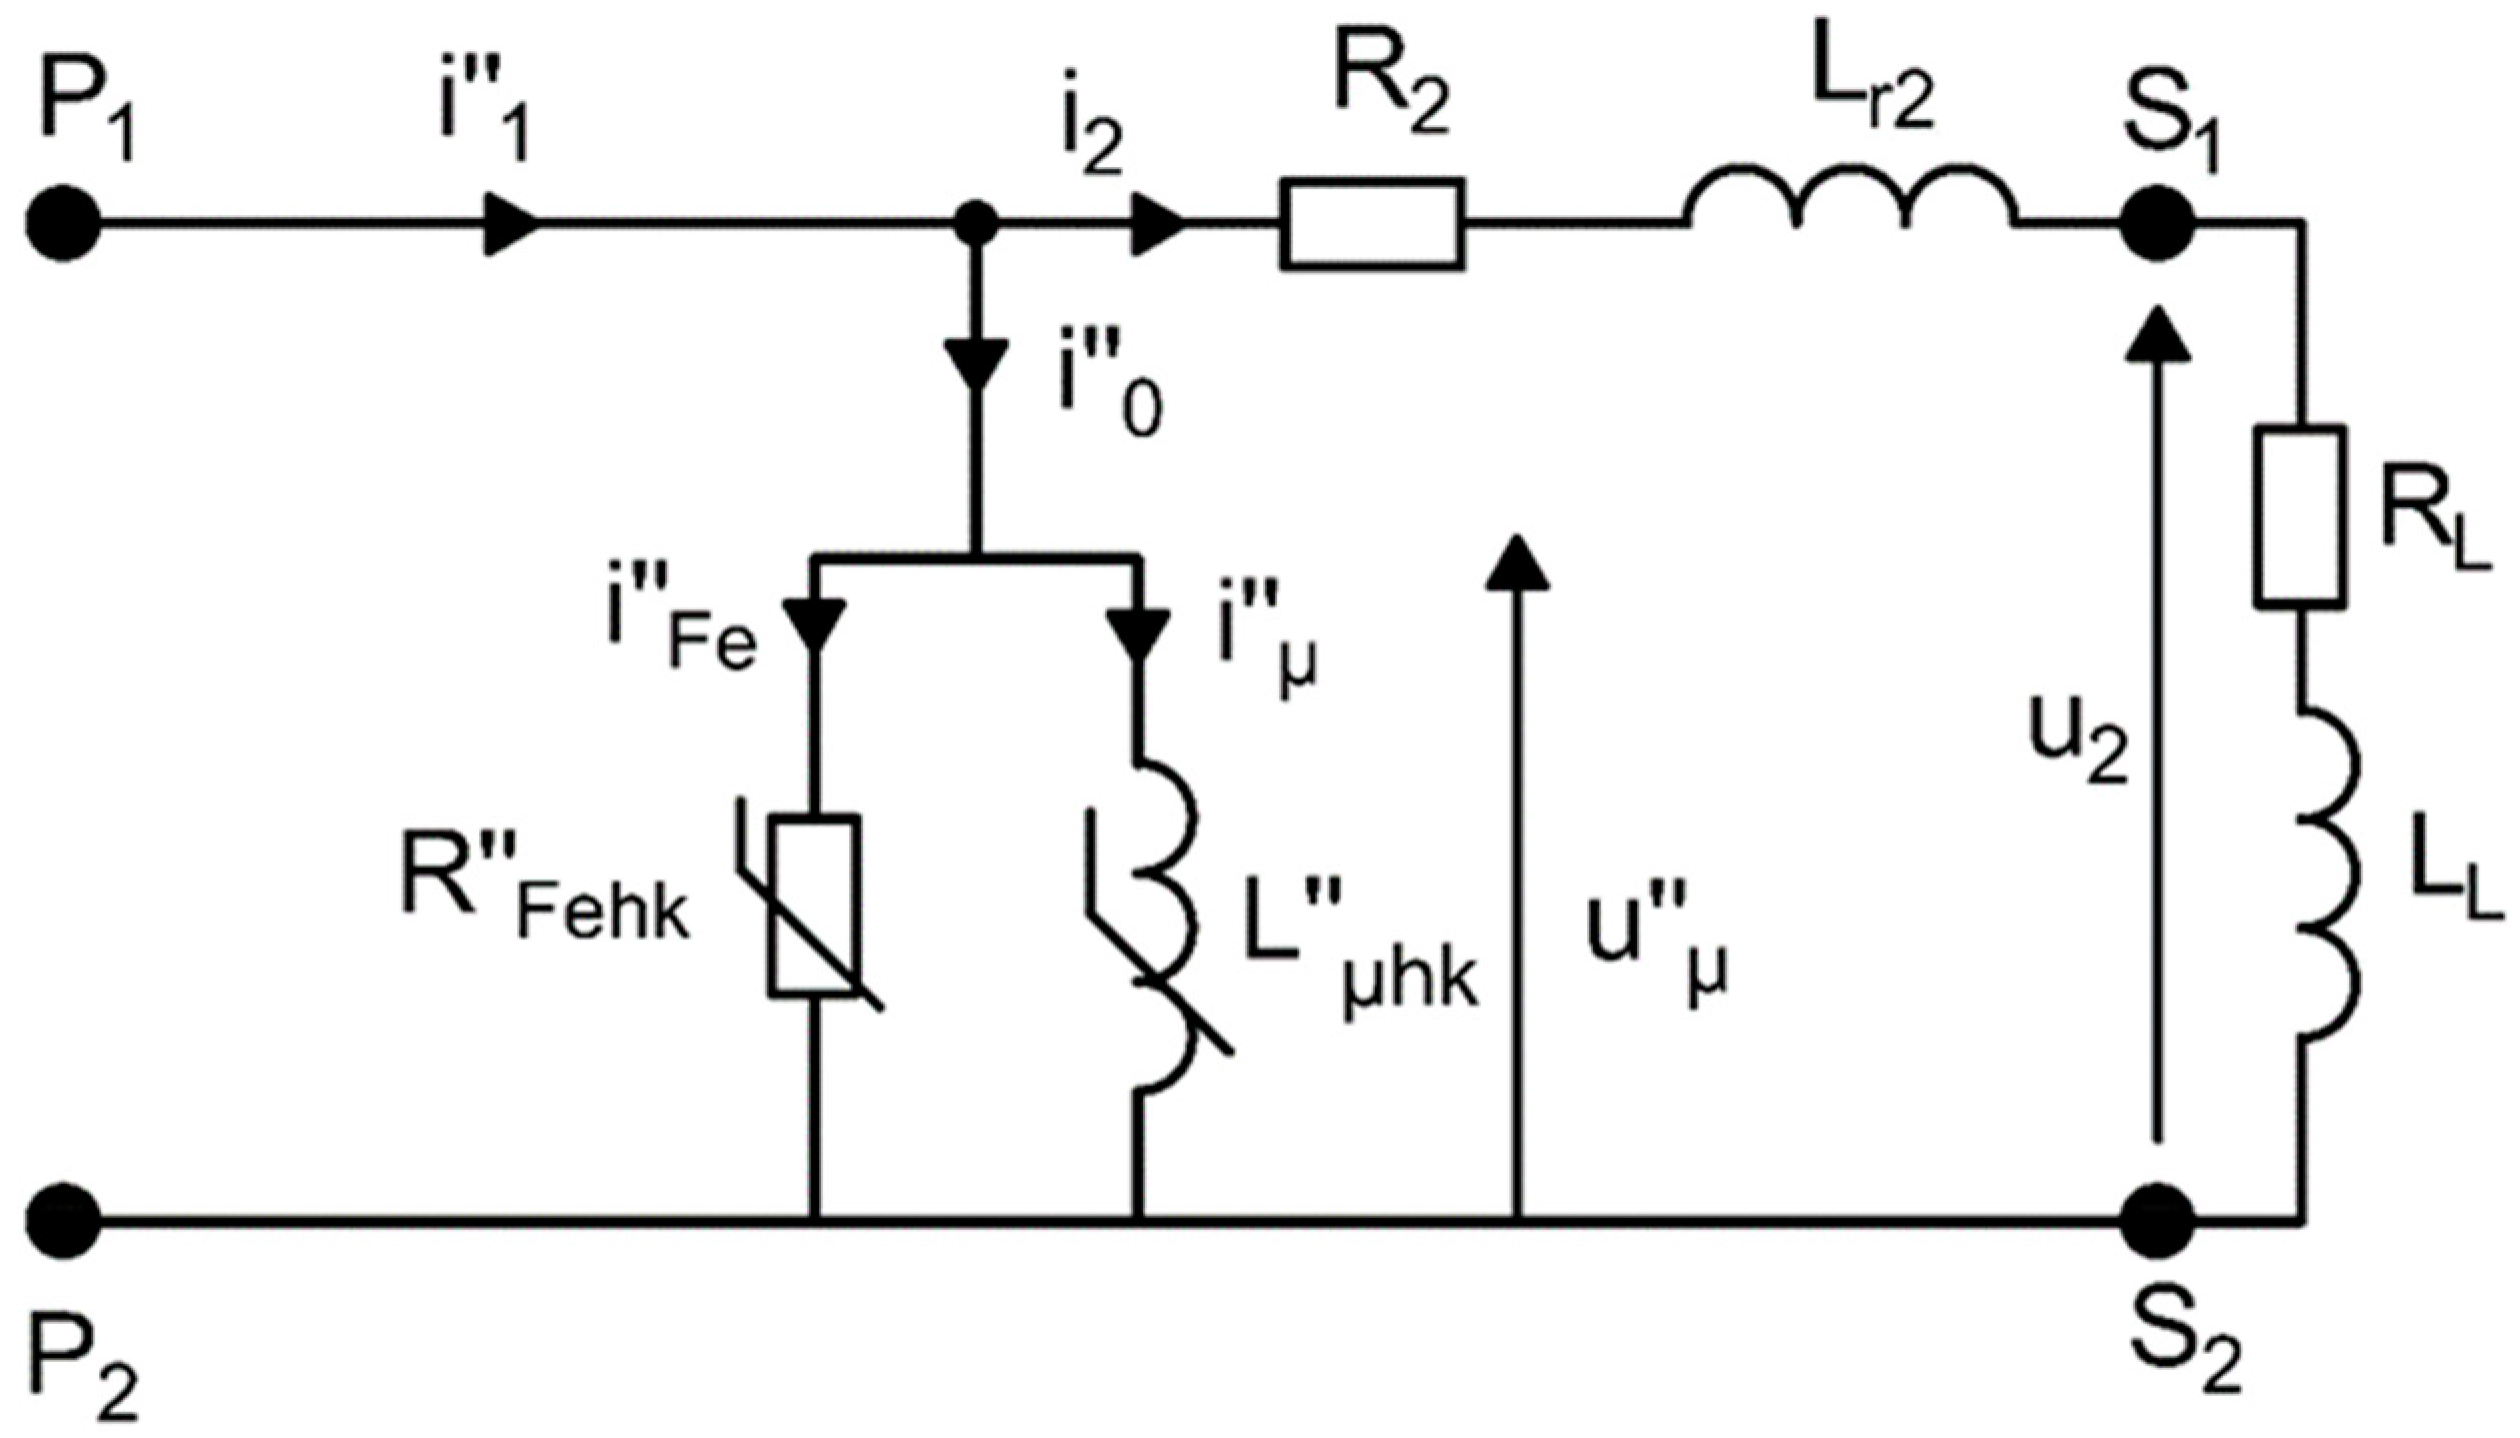
2. The Equivalent Circuit of the Inductive CT

The magnetic core’s excitation current is the main cause of the transformation errors in inductive CT. The transformation accuracy of the inductive CT depends on the value of the magnetic flux density. Its values result from the RMS values of the harmonics of the primary current and the load of the secondary winding. This is due to the nonlinear shape of the magnetization characteristics of the magnetic core [10,12,22,27,28,29,30]. Under steady-state operating conditions, the metrological characteristics of an inductive CT are not affected by the leakage inductance and primary winding resistance. This results from the fact that the primary winding can be treated as a current source. The influence of the leakage flux of the primary winding is significant only under overcurrent conditions or in transformers with a very large air gap in the magnetic core. If the inductance and resistance of the primary winding are neglected, an equivalent circuit diagram containing only the elements of the secondary circuit and the magnetizing branch is obtained. After taking into account the change in the value of the magnetic core parameters for each hk harmonic of the distorted primary current, this circuit is shown in Figure 1.
In the equivalent circuit presented in Figure 1, the following abbreviations are used (the symbol ″ indicates the quantities converted to the secondary side):
  • hk—index indicating the harmonic of hk order,
  • iμ—instantaneous value of the reactive component of the distorted excitation current,
  • i0—instantaneous value of the distorted excitation current,
  • i1—instantaneous value of the distorted primary current,
  • i2—instantaneous value of the distorted secondary current,
  • iFe—instantaneous value of the active component of the distorted excitation current,
  • Lμhk—mutual inductance of the primary and the secondary windings for the hk harmonic,
  • LL—load inductance of the secondary winding,
  • Lr2—leakage inductance of the secondary winding,
  • P1/P2—terminals of the primary winding,
  • R2—resistance of the secondary winding,
  • RFehk—resistance representing active power loss in the magnetic core for the hk harmonic,
  • RL—load resistance of the secondary winding,
  • S1/S2—terminals of the secondary winding,
  • uμ—instantaneous value of the magnetizing voltage,
  • u2—instantaneous value of the distorted secondary voltage.
The values of the equivalent circuit components representing the magnetic core RFehk and Lμhk were made dependent on the harmonic order of the transformed primary current. With the change of frequency, the values of magnetic permeability and active power loss of the magnetic core also change.
Parasitic capacitances of secondary winding were not considered in the analyzed equivalent circuit due to the low-voltage construction of the insulation system of the inductive CT and the relatively low value of the number of turns of the windings in the investigated cases (up to 2000 turns). Parasitic capacitances should be considered in the case of a high-voltage construction.

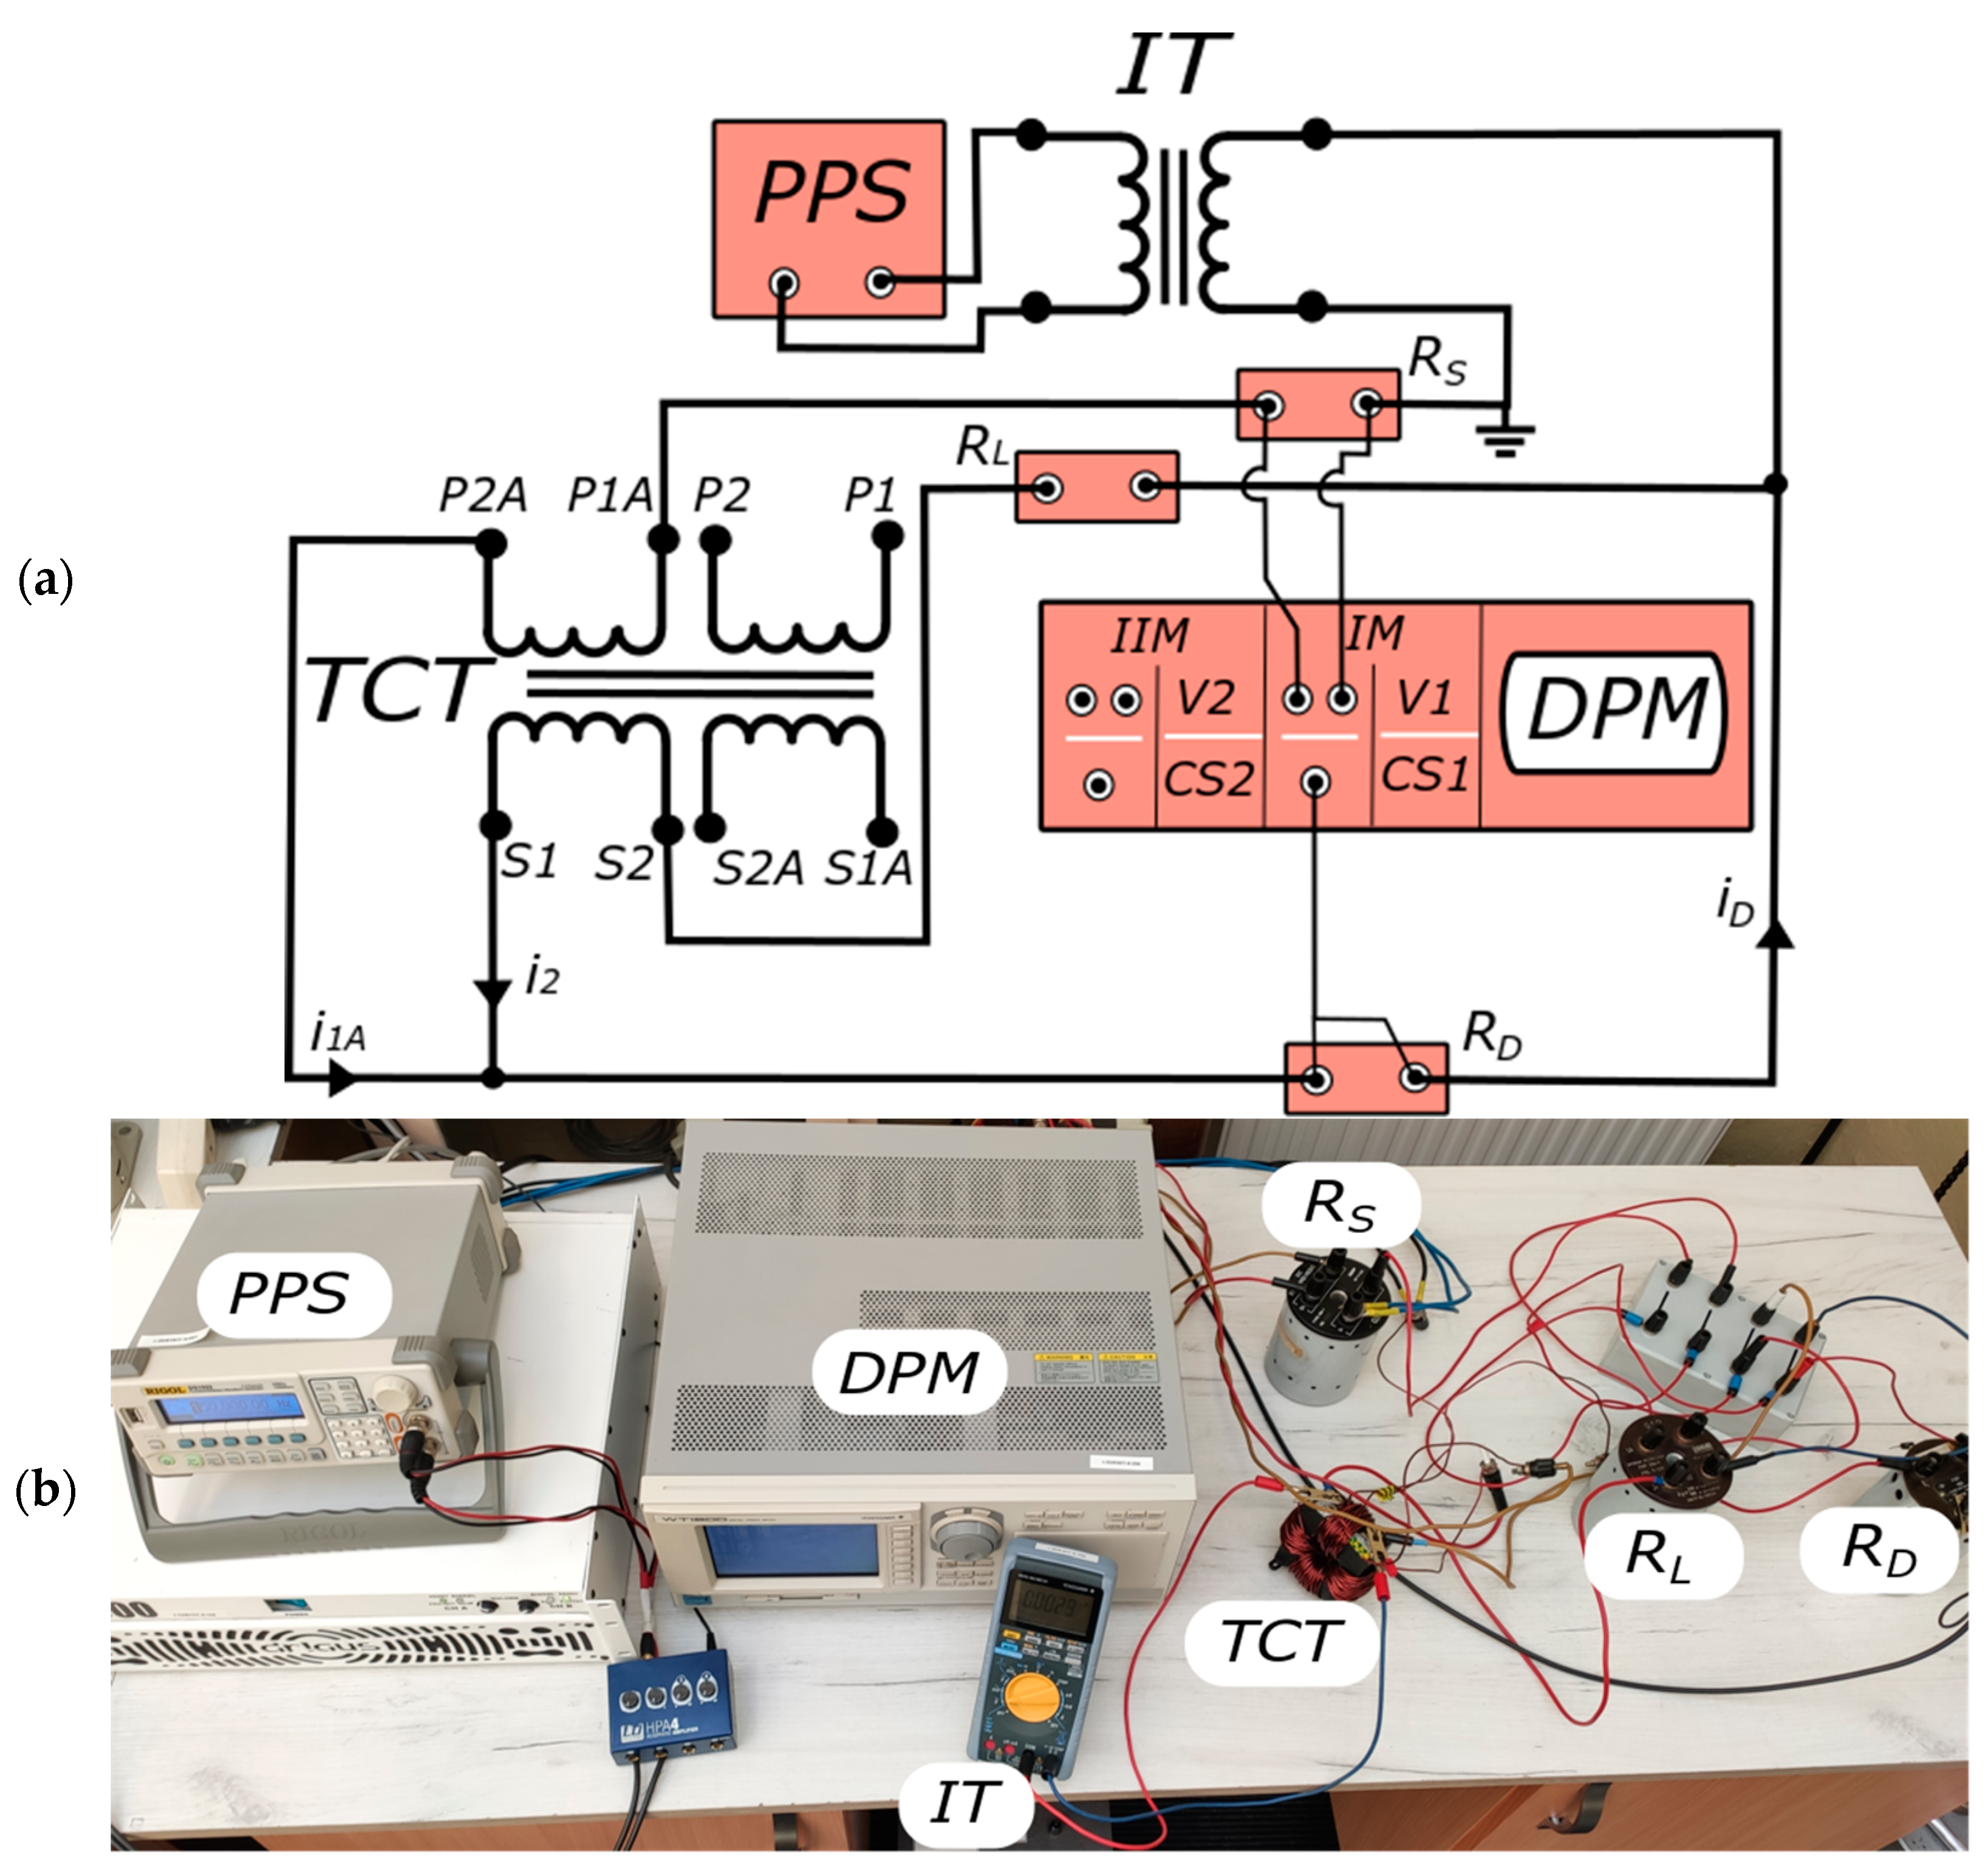
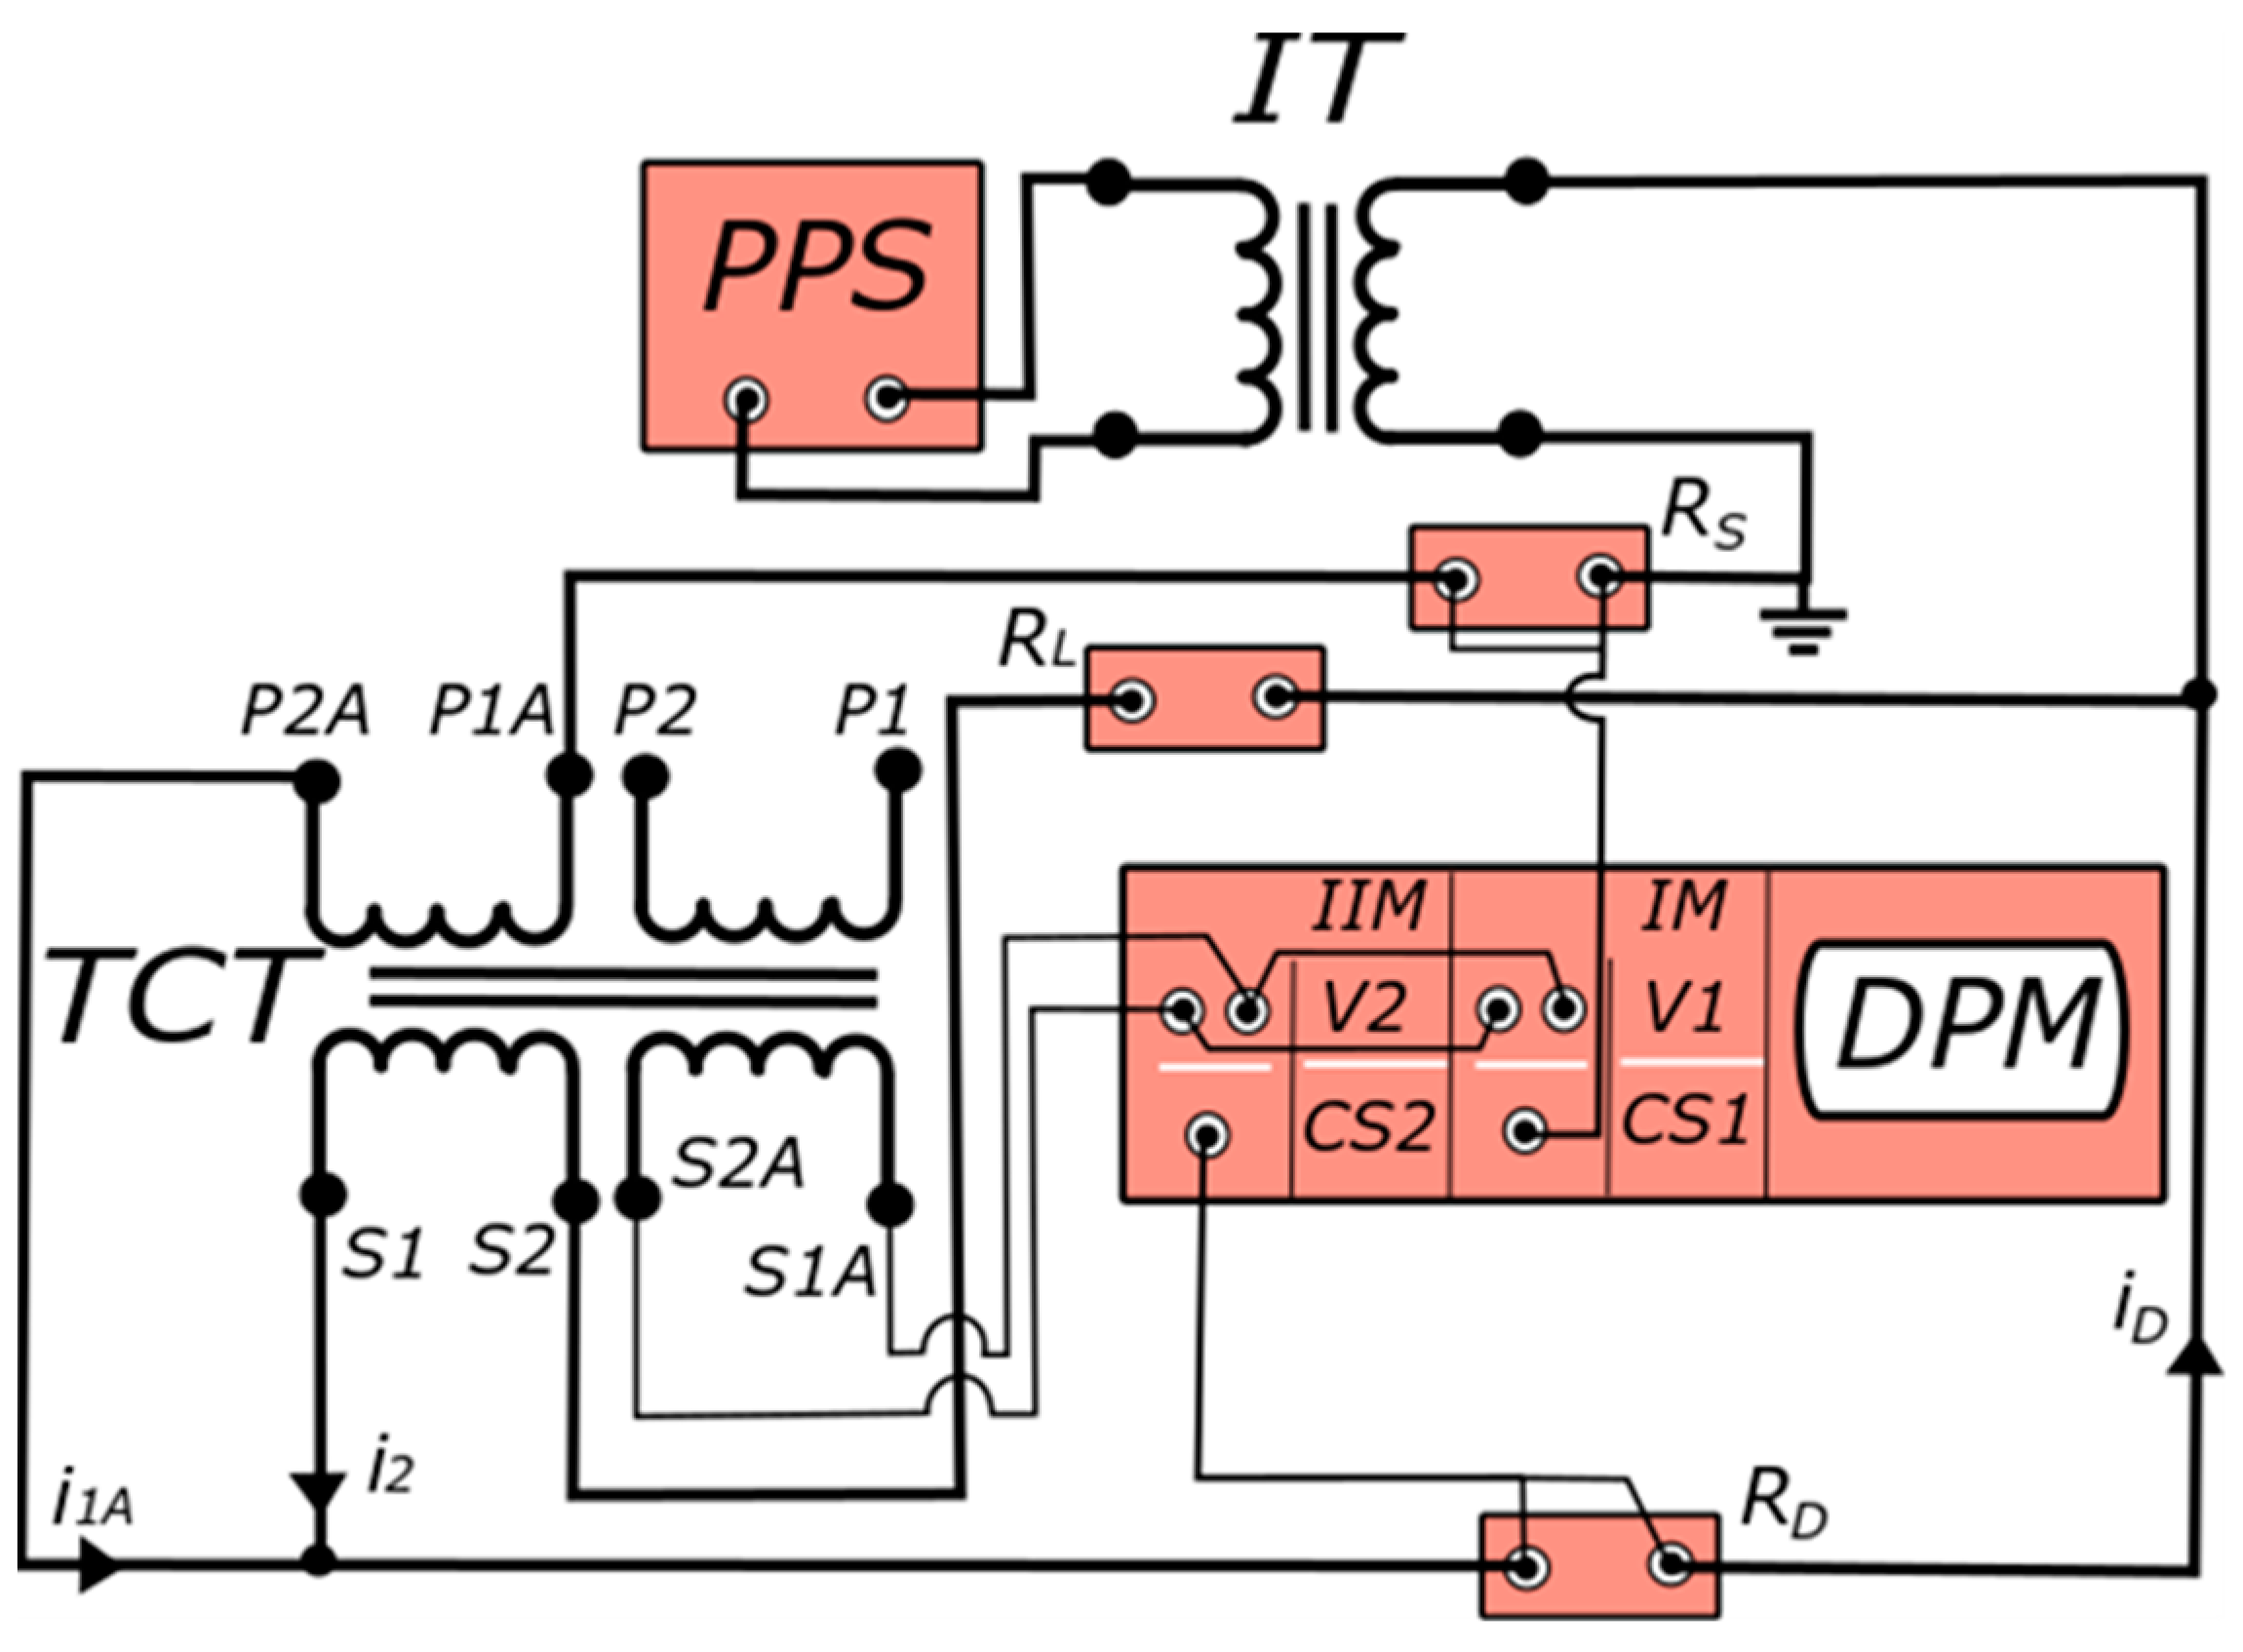
3. The Measuring Setup and Tested CT

The values of the current error and phase displacement during the transformation of the distorted current of the tested CTs are determined in the measuring setup presented in Figure 2. The tested CTs are equipped with additional primary winding (P1A/P2A). This enables the utilization of the differential connection of the secondary and primary windings and the determination of the wideband accuracy without usage of the high current test system [10,11]. Moreover, this approach enables the designation of the values of current error and phase displacement without application of the reference transducer [11,31].
In Figure 2, the following abbreviations are used:
  • DPM—digital power meter,
  • CS1/CS2DPM channels designed for connection of current/voltage probe,
  • V1/V2DPM voltage channels,
  • PPS—programable power source,
  • i1A—the instantaneous value of the current of the additional primary winding of inductive CT under conditions of rated ampere turns,
  • iD—the instantaneous value of the differential current,
  • i2—the instantaneous value of the secondary current,
  • P1/P2—terminals of the primary winding,
  • P1A/P2A—terminals of the additional primary winding,
  • RL—resistance of the load of the secondary winding under normal operating conditions,
  • RD—the non-inductive current shunt characterized by resistance equal to 10 Ω used to measure the differential current,
  • RS—the non-inductive current shunt characterized by resistance equal to 0.1 Ω used to measure the current in the additional primary winding,
  • S1/S2—terminals of the secondary winding,
  • S1A/S2A—terminals of the additional secondary winding,
  • IT—insulating transformer.
In the measuring circuit of the inductive CT 100 A/5 A, the accuracy class determined for 50 Hz is 0.2, and the rated apparent power 2.5 VA power factor 1 is tested. The wideband accuracy tests are performed in ampere-turns condition of the CTs. This means that for each tested CT, an additional primary winding is made. In the case of CT 100 A/5 A, the turns number is equal to 20. In the case of CT 300 A/5 A, the turns number is equal to 60. The digital power meter (DPM) used enables the simultaneous measurement, in the first module, of the RMS values of the primary current in the additional primary winding. Moreover, the RMS values of the differential current are also measured with utilization of the current shunt RD. Therefore, after the designation phase angle between these currents, the values of the current error and phase displacement are determined. Each measurement is performed for a single higher harmonic with utilization of the fast Fourier transformation of distorted current. The tested CT is supplied by the programable power supply (PPS), which is composed of the arbitrary waveform generator and the wideband amplifier [20]. This solution enables the generation of distorted current with the programable level and phase angle of each harmonic. To avoid the coupling of the measurement system with the external power grid, the insulating transformer (IT) is utilized. The current shunt (RL) represents the load of the tested CT’s secondary winding. Then, the frequency characteristics of the values of the current error and phase displacement are evaluated for each harmonic in the frequency range from 50 Hz to 5 kHz. Additionally, in the case of the low-order higher harmonics, the influence of self-generation is considered. This means that due to the nonlinearity of the magnetization curve of the magnetic core, low-order higher harmonics are generated in the secondary current even if the CT is transforming sinusoidal primary current. The values of the current error and phase displacement may achieve increased or decreased values depending on the phase angle between the transformed and self-generated harmonic. Considering the resistance of the current shunts (RS) used, the composite error can be determined from the equation
ε % I h k = U D h k R S R D U S h k 100 % ,
where
  • UDhk—the rms value of the hk harmonic of voltage on RD current shunts associated with the differential current,
  • UShk—the rms value of the hk harmonic of voltage on the RS current shunt associated with the current in additional primary winding.
Considering the phase angle between the measured hk harmonic of both voltages, the RMS value of the hk harmonic of the secondary current can be determined from the equation
  I 2 h k = ( U S h k R S ) 2 + ( U D h k R D ) 2 2 U S h k R S · U D h k R D cos φ h k ,
where
  • φhk—phase angle between the hk harmonic of two measured voltages of current shunts.
Therefore, the percentage value of the current error of the tested CTs for each hk higher harmonic of the distorted current can be determined from the equation
Δ I h k = I 2 h k U S h k R S U S h k R S · 100 % ,
The determined hk values of the composite and the current errors allow for the calculation of the phase error of the tested CTs for each hk higher harmonic of the distorted current:
δ φ h k = a r c s i n ( ε % h k 2 Δ I h k 2 100 % ) ,
The measurement uncertainties are analyzed in detail in Ref. [15]. Moreover, these calculations are convergent with the method described in the guidelines and the recommendations of JCGM [32]. The values of the expanded measurement uncertainty determined separately for the current error and phase displacement at the beginning and end of the considered frequencies range are equal to:
  • current error: (0.1 ± 0.003)% for 50 Hz and (0.1 ± 0.017)% for 5 kHz,
  • phase displacement: (0.1 ± 0.002)° for 50 Hz and (0.1 ± 0.01)° for 5 kHz.
In the second module of the DPM used, the RMS values of magnetization voltage Uμ and differential current are measured. The parameters of the equivalent circuit of the tested CTs are determined in the measuring setup presented in Figure 3. To achieve this scope, the tested CTs are equipped with additional secondary winding (S1A/S2A). These windings are used to designate the RMS values of the magnetization current of the tested CTs. The numbers of turns of these windings are the same as for the additional primary windings.
In the measurement circuit presented in Figure 3, the differential connection is made between the additional primary winding and the secondary winding of the tested CT. The additional secondary winding is operating at the non-load state and provides the measurement of the RMS value of the magnetization voltage Uμhk. This approach enables the designation of the phase angle βhk (Figure 4) between the differential current IDhk and the magnetization voltage Uμhk required for the vectorial diagram. The utilization of the second module of the DPM enables the determination of the values of the phase angle αhk (Figure 4) between the magnetization voltage Uμhk and the primary current I1hk flowing in the additional primary winding. Moreover, to properly designate the values of the equivalent circuit, the turns correction applied to the secondary current has to be considered. The method to determine the turns correction of mass-produced inductive CTs was described in Ref. [33]. If the turns correction is applied, only the values of the composite and current errors are changed. The value of phase displacement is not influenced by the turns correction. In Figure 4, the vectorial diagrams of operation of the inductive CT are presented.
In Figure 4, the following abbreviations are used:
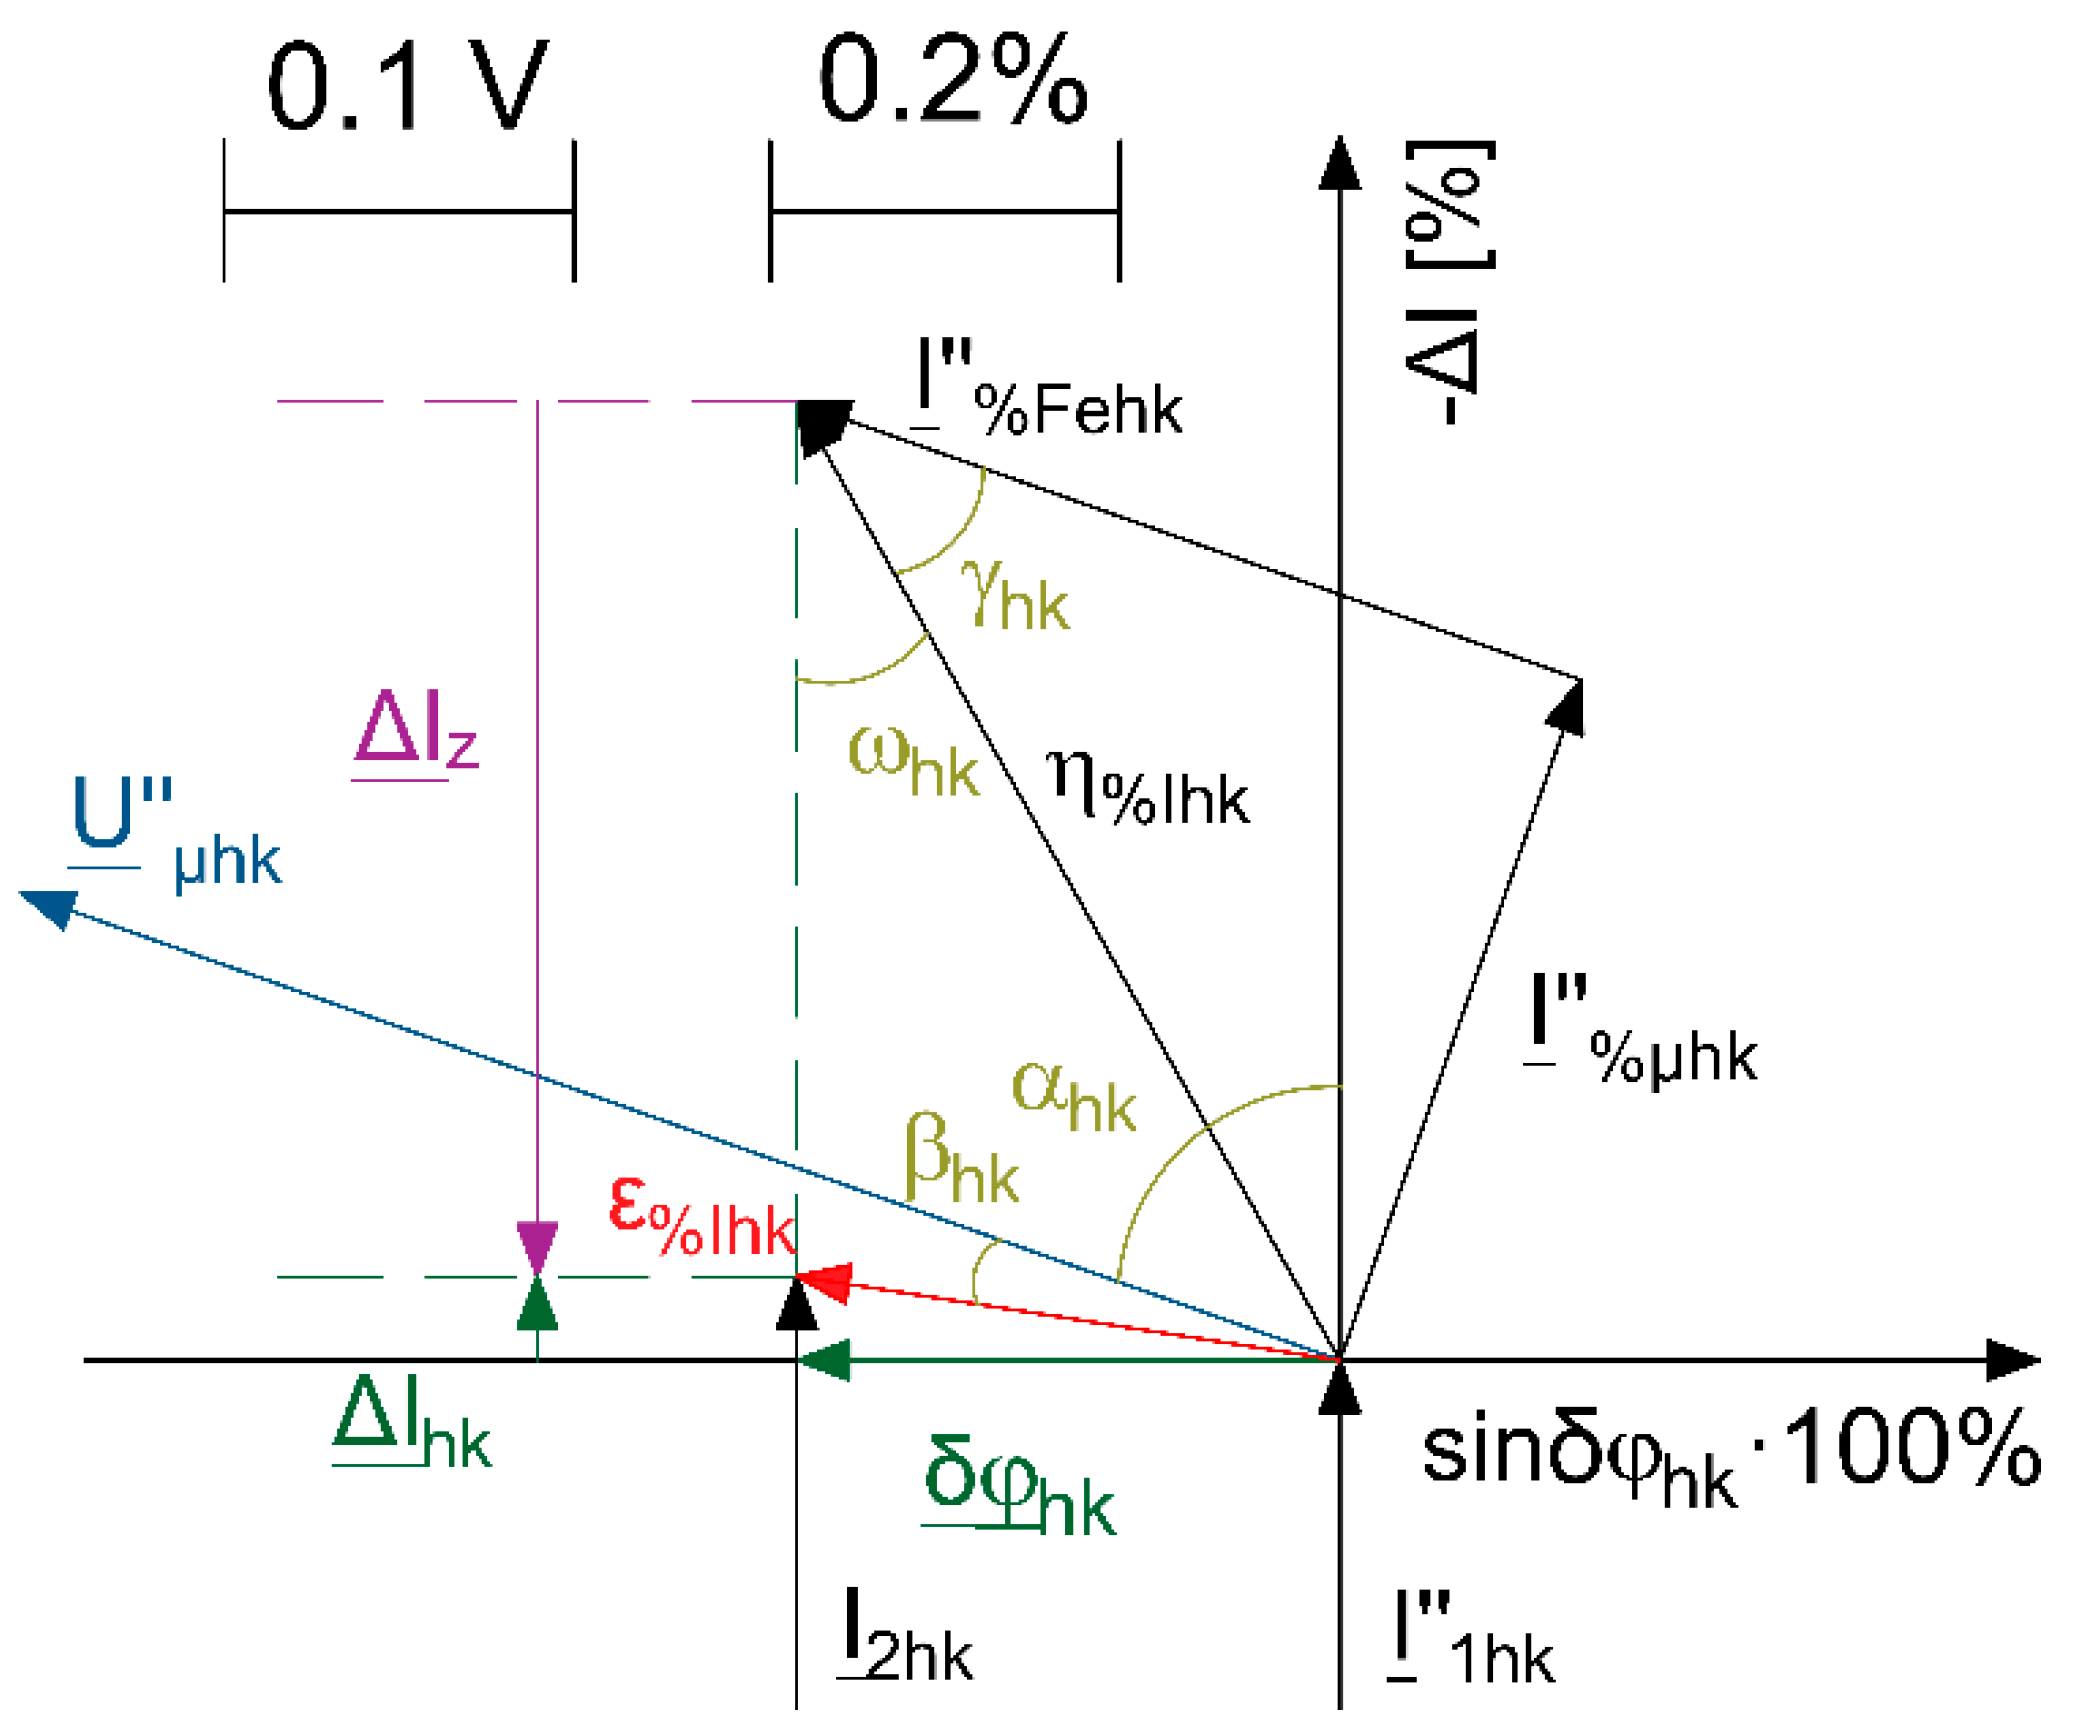
  • I%µhk—vector of the hk harmonic reactive component of the distorted excitation current expressed as a percentage of the primary current converted to the secondary side,
  • I%Fehk—vector of the hk harmonic active component of the distorted excitation current expressed as a percentage of the primary current converted to the secondary side,
  • I1hk—vector of the hk harmonic of the distorted primary current,
  • I2hk—vector of the hk harmonic of the distorted secondary current,
  • Uµhk—vector of the hk harmonic of the distorted magnetizing voltage,
  • αhk—value of the phase angle between hk harmonics of the distorted magnetizing voltage Uµhk and the distorted primary current I1hk,
  • βhk—value of the phase angle between hk harmonics of the distorted magnetizing voltage Uµhk and the composite error ε%Ihk,
  • γhk—value of the phase angle between hk harmonics of the active component of the distorted excitation current I%Fehk and the composite error η%Ihk,
  • ωhk—value of the phase angle between hk harmonics of the distorted secondary current I2hk and the composite error η%Ihk,
  • ΔIhk—vector of the hk harmonic of the current error of the inductive CT,
  • ΔIz—vector of the hk harmonic representing the change of current error of inductive CT caused by the turns ratio correction,
  • δφhk—vector of the phase shift between hk harmonic of the secondary current and hk harmonic of the converted primary current of the CT,
  • ε%Ihk—vector of the hk harmonic of the composite error of inductive CT after utilization of the turns ratio correction,
  • η%Ihk—vector of the hk harmonic of the composite error of inductive CT before utilization of the turns ratio correction.
The value of composite error before the applied turns correction of the secondary winding can be determined from equation
η % I h k = ( Δ I h k + Δ I Z ) 2 + ( sin δ φ h k · 100 % ) 2 ,
Considering the measurements performed in the circuit presented in Figure 3 and the relations of each vector presented in Figure 4, the phase angle ωhk between the current I2hk and the composite error without the turns number correction η%Ihk is determined from equation
ω h k = cos 1 ( Δ I Z 2 + η % I h k 2 ε % I h k 2 2 · Δ I Z · η % I h k ) ,
Next, the phase angle γhk is equal to
γ h k = α h k ω h k ,
The value of the hk harmonic of the excitation current active component of the magnetic core is determined from equation
I F e h k = I 1 h k · η % I h k · cos γ h k ,
The value of the hk harmonic of the excitation current reactive component of the magnetic core is determined from equation
I μ h k = I 1 h k · η % I h k · sin γ h k ,
The value of the inductance of the magnetic core is calculated from equation
X μ h k = U μ h k I μ h k ,
The value of the resistance of the magnetic core is calculated from equation
R F e h k = U μ h k I F e h k ,

4. The Frequency Characteristics of the Values of Current Error and Phase Displacement

In Figure 5 and Figure 6, the frequency characteristics of current errors (a) and phase displacement (b) of the mass-produced CT with a rated current ratio of 100 A/5 A are shown. The measurements were performed for the rated resistive load of the secondary winding (Figure 5) and for 25% of it (Figure 6). The results are presented, considering four values of primary currents corresponding to 5%, 20%, 100% and 120% of the rated primary current. The results of the tests and analyses concern the transformation of the distorted current containing a single higher harmonic from 100 Hz to 5 kHz and a fundamental frequency harmonic equal to 50 Hz. In relation to the self-generated higher harmonic, considering the phase angle of the transformed higher harmonic, the current error and phase displacement for a given primary current may obtain decreased (marked −) or increased (marked +) values.
Significant values of the current error and phase displacement are observed in the range up to the 10th harmonic result from the generation of higher harmonics in the secondary current of the investigated CT as a result of the nonlinearity of the magnetization characteristics of the magnetic core. In this case, the highest values of the current error occur during the transformation condition of 5% of the rated primary current when the secondary winding is loaded with the rated power. The positive sign of the current error results from the applied turns number correction that shifts the value of the current error in the positive direction. The increase in the load of the secondary winding causes the values of the current error to shift toward negative values. The highest values of the phase displacement are obtained for 5% of the rated primary current with the rated power load. This is due to the low initial magnetic permeability of the utilized magnetic material of the magnetic core. The increase in the resistive load value leads to the increase in the phase displacement. This change depends on the operating point on the magnetization characteristic and local changes in its slope. The increase in the frequency of the transformed harmonic causes the current error to increase toward positive values, which is due to the applied turns number correction. The decrease in the magnetic core excitation current in the analyzed frequency range up to 5 kHz results from the increase in the mutual reactance of windings and resistance representing active power losses in the magnetic core. The increasing value of the core excitation current at the increased value of the secondary winding load reduces the value of the differential current resulting from the difference between the rated current ratio and the actual turns ratio of the tested CT. Therefore, the frequency characteristic of the current error shifts toward negative values. Considering the phase displacement, this causes a decrease in its value with the frequency of the transformed higher harmonic of the distorted current. The phase displacement determined for higher harmonics from the 10th does not depend on the load value of the secondary winding. The phase displacement results from the quotient of the active component and the reactive component of the core excitation current. At the same time, in the analyzed case, the ratio of these two quantities is maintained both for the rated power load and its 25%. If the load resistance increases, the values of the magnetic flux density and active power loss in the magnetic core also increase. Moreover, if there is a decrease in the slope of the magnetizing characteristic curve, there is a decrease in the magnetic permeability of the magnetic core. Then, the load on the secondary side will not affect the phase displacement.
The increase in the load of the secondary winding for non-corrected CTs leads to increase in the value of the current error toward negative values. This is related to the increased value of the secondary voltage, and thus, the increased magnetic flux density in the magnetic core of the CT. Its value determines the operating point on the magnetizing characteristic curve; therefore, with the increase in the value of the magnetic flux density, the value of the magnetic field strength and the associated value of the core excitation current also increase.

5. Analysis of the Values of the Equivalent Circuit Components Representing Magnetic Core Parameters Determined for Distorted Current Harmonics

This subsection presents the changes of the values of mutual reactance of windings and resistance representing active power losses in the magnetic core for each harmonic of the transformed distorted current of the tested CT. Measurements were recorded with the use of a digital power meter in the measuring system from Figure 3. The course of changes of the values of these parameters together with the harmonic frequency determine the accuracy of the transformation of a given harmonic by the tested CT. The analyses were carried out for the distorted current consisting of the superposition of the main frequency 50 Hz component and the single higher harmonic ranging from 100 Hz to 5 kHz. Figure 7 presents the change, with the frequency of the transformed harmonic, of the mutual reactance of windings of a 100A/5A CT. The tests were performed for four values of the distorted primary current with the rated resistive load.
In order to determine the values of mutual reactance of windings in the measuring system presented in Figure 3, the secondary voltage of the additional secondary winding operating in the idle state and the differential current between the additional primary winding and the secondary winding were measured with utilization of the digital power meter. Then, the application of formulae (5)–(10) enabled the determination of the values of the mutual reactance and the resistance associated with the active power losses of the magnetic core. Due to the merging of the transformed and the self-generated harmonic in the distorted secondary current, the value of reactance may take on decreased (marked −) or increased (marked +) values for a given primary current. From the 30th harmonic, as the frequency resulting from the order of the transformed harmonic of the distorted current increases, the value of the mutual reactance of the windings increases. The noticeable change between the curves determined for four RMS values of the primary current results from the change of the magnetic flux density of the magnetic core.
The change with the frequency of the transformed harmonic of the values of resistance representing the active power losses in the magnetic core of 100A/5A CT is presented in Figure 8. Due to the merging of the transformed and the given self-generated harmonic to the distorted secondary current, the value of the resistance representing the active power losses for a given primary current may assume decreased (marked −) or increased (marked +) values. The increase in the frequency of the transformed harmonic causes an increase in the active power losses. In the initial range up to the 5th harmonic, there is a local change of the value of resistance representing active power losses. In the case when there is an increase in the value of magnetic flux density caused by the self-generated harmonic, the active power losses also increase. In the case when there is a decrease in the value of magnetic flux density caused by the self-generated harmonic, the active power losses also decrease.
Fundamental harmonic is characterized by the lower values of resistance, and this causes the CT to achieve higher transformation error values. However, it has to be pointed out that the determined equivalent parameters of the transverse branch of the equivalent circuit presented in Figure 1 are determined for the CT without applying the secondary turns number correction. Considering that, the values of the current errors for higher harmonics reach lower values than for the fundamental harmonic.
Figure 9 presents the changes of the value of reactive and active components of the core excitation current of 100 A/5 A CT with the change of frequency of the transformed harmonic.
The course of changes of the reactive component of the magnetic core excitation current of 100 A/5 A transformer indicates a lack of dependence of the current error value on the frequency of transformed higher harmonics. In the case of the active component of the core excitation current, its value linearly increases with the frequency of the transformed harmonic. The ratio of the reactive and active components for specific higher harmonics determines the course of changes of their phase displacement. Therefore, a linear change of the phase displacement occurs (Figure 5b).

6. The Vectorial Diagrams for Tested CT

To substantiate the course of the frequency characteristics of the current error and phase displacement of the transformation of a given harmonic of the distorted current, the vectorial diagrams specifying their values for selected operating conditions of the tested CT were produced. The vectorial diagrams were produced in accordance with the equivalent circuit of the CT presented in Figure 1 for the distorted current with the rated load power of 100 A/5 A and a 10% level of the higher harmonic. In the case of the CT with the applied turns number correction or other transformation error compensation, it is not possible to construct a vectorial diagram on the basis of the equivalent parameters measured during their operation (mutual reactance of windings and resistance representing active power losses in the magnetic core, as well as leakage reactance and resistance of secondary winding). This is due to the change of the value of the differential current in relation to the magnetic core excitation current of the tested CT. The relevant values can be determined in the idle state; however, it is necessary to determine them for the relevant operating conditions of the CT resulting from the RMS values and phase shift of a given harmonics (up to the 13th) of the distorted primary current and the value and power factor of the load of the secondary winding [10]. In order to justify the determined courses of characteristics of the current error and phase displacement for the transformation of harmonics of the distorted current, the vectorial diagrams were constructed. The procedure is described in detail in Figure 4.
Figure 10 shows the vectorial diagrams of the tested CT during the transformation of the rated distorted current with the rated resistive load of the secondary winding for the 1st, 20th and 100th harmonic, with a level of 10% of a single higher harmonic.
In the vectorial diagrams presented in (a) to (c), respectively, the abbreviations were used as in Figure 4, taking as the index hk the values of the 1st, 20th and 100th harmonics.
For the first harmonic, the value of the secondary winding leakage reactance is practically negligible. Then, it can be assumed that the phase displacement δφh1 is equal to the vector of the reactive component of the core excitation current η%Ih1 expressed as a percentage of the primary current I%h1. The current error vector Ih1 is equal to the active component I″%Feh1 of the core excitation current η%Ihk1 expressed as a percentage of the primary current I%Feh1. For the 20th harmonic, the value of the leakage reactance of the secondary winding increases 20 times and causes a counterclockwise rotation of the vectors of the active I%Feh20 and reactive I%μh20 components of the core excitation current η%Ih20. This causes a shift of the phase displacement δφh20 in the negative direction and a reduction in the current error value ΔIh20 in spite of the already occurring increase in the RMS values of active I%Feh20 and reactive I%μh20 components of the excitation current η%Ih20 with the frequency of the transformed harmonic of the distorted current. For the 100th harmonic, the value of the leakage reactance of the secondary winding increases 100 times in comparison with its value for the main component of the distorted current. There is a further counterclockwise rotation of the active I%Feh100 and reactive I%μh100 components of the core excitation current η%Ih100. Therefore, with the frequency of the transformed harmonic, the values of the current error decrease ΔIh100, and the phase displacement δφh100 changes the sign. In Figure 10, vector Iz represents the change of the current error ΔIhk due to the application of the secondary winding turns number correction. The vectorial diagrams were produced on the basis of the calculated RMS values of the active I″%Fehk and reactive η%Ihk components of the core excitation current η%Ihk determined in the presented method (Figure 4) and the values of the uncorrected current error of the tested CT. The value of Iz (equal to 0.5%) resulting from the determined turns number correction according to the method in Ref. [33] was added to the value of the current error ΔIhk of the 100 A/5 A CT. Therefore, in order to determine from the vectorial diagram the values of the current error ΔIhk after the applied correction, it is necessary to add Iz to the determined value of the current error before correction.

7. Conclusions

The results and analysis presented in the paper help to understand the course of the frequency characteristics of the current error and phase displacement of the corrected inductive CT. To avoid the influence of the applied turns number correction, the values of the active and reactive component of the excitation current have to be determined in accordance with the proposed method. The main source of the transformation error of inductive CTs for the distorted current is the magnetic core. Therefore, the determined frequency characteristics of resistance associated with active power losses and mutual reactance of the windings with the considered self-generation phenomenon explain the obtained values of the current error and phase displacement. It should be noted that the present results are determined in a specified operating point of the tested CT. Thus, they explain the course of the frequency characteristic only for this specified case. The change of the operating point of the tested CT on the magnetization curve of the magnetic core requires performing similar steps and analysis to obtain the equivalent circuit parameters. To characterize the operation of the inductive CT during the transformation of the distorted current in a comprehensive manner, the vectorial diagrams are constructed for three harmonics. The values of the current error and phase displacement result from the operating conditions of the CT determined by the RMS values and phase shifts of a given harmonic (up to 13) of the distorted primary current and value, as well as the power factor of the load of the secondary winding. At the same time, it is necessary to take into consideration, for a given harmonic, the increase in the value of magnetizing voltage resulting from the change of value of the leakage reactance and the resistance of the secondary winding.

Author Contributions

Conceptualization, M.K. and E.S.; methodology, M.K. and E.S.; validation, M.K., E.S. and P.K.; formal analysis, M.K., P.K. and E.S.; investigation, M.K., E.S. and P.K.; resources, M.K. and E.S.; data curation, M.K. and E.S.; writing—original draft preparation, M.K. and E.S.; writing—review and editing, M.K. and E.S.; visualization, E.S.; supervision, M.K. All authors have read and agreed to the published version of the manuscript.

Funding

This research received no external funding.

Institutional Review Board Statement

Not applicable.

Informed Consent Statement

Not applicable.

Data Availability Statement

Not applicable.

Conflicts of Interest

The authors declare no conflict of interest.

References

  1. Yang, T.; Pen, H.; Wang, D.; Wang, Z. Harmonic analysis in integrated energy system based on compressed sensing. Appl. Energy 2016, 165, 583–591. [Google Scholar] [CrossRef]
  2. Haas, A.; Niitsoo, J.; Taklaja, P.; Palu, I. Analysis of electricity meters under distorted load conditions. In Proceedings of the PQ 2012: 8th International Conference-2012 Electric Power Quality and Supply Reliability, Conference Proceedings, Tartu, Estonia, 11–13 June 2012; pp. 281–284. [Google Scholar]
  3. Dirik, H.; Duran, I.U.; Gezegin, C. A Computation and Metering Method for Harmonic Emissions of Individual Consumers. IEEE Trans. Instrum. Meas. 2019, 68, 412–420. [Google Scholar] [CrossRef]
  4. Mingotti, A.; Peretto, L.; Bartolomei, L.; Cavaliere, D.; Tinarelli, R. Are inductive current transformers performance really affected by actual distorted network conditions? An experimental case study. Sensors 2020, 20, 927. [Google Scholar] [CrossRef] [PubMed] [Green Version]
  5. Locci, N.; Muscas, C. Comparative analysis between active and passive current transducers in sinusoidal and distorted conditions. IEEE Trans. Instrum. Meas. 2001, 50, 123–128. [Google Scholar] [CrossRef]
  6. Zobaa, A.F.; Abdel Aleem, S.H.E. A new approach for harmonic distortion minimization in power systems supplying nonlinear loads. IEEE Trans. Ind. Inform. 2014, 10, 1401–1412. [Google Scholar] [CrossRef] [Green Version]
  7. Mazin, H.E.; Xu, W.; Huang, B. Determining the harmonic impacts of multiple harmonic-producing loads. IEEE Trans. Power Deliv. 2011, 26, 1187–1195. [Google Scholar] [CrossRef]
  8. Sharma, H.; Rylander, M.; Dorr, D. Grid impacts due to increased penetration of newer harmonic sources. IEEE Trans. Ind. Appl. 2016, 52, 99–104. [Google Scholar] [CrossRef]
  9. IEC 61869-2. Instrument Transformers—Additional Requirements for Current Transformers; IEC: Geneva, Switzerland, 2012. [Google Scholar]
  10. Kaczmarek, M.; Stano, E. Nonlinearity of Magnetic Core in Evaluation of Current and Phase Errors of Transformation of Higher Harmonics of Distorted Current by Inductive Current Transformers. IEEE Access 2020, 8, 118885–118898. [Google Scholar] [CrossRef]
  11. Stano, E.; Kaczmarek, M. Wideband self-calibration method of inductive cts and verification of determined values of current and phase errors at harmonics for transformation of distorted current. Sensors 2020, 20, 2167. [Google Scholar] [CrossRef] [Green Version]
  12. Kaczmarek, M. Inductive current transformer accuracy of transformation for the PQ measurements. Electr. Power Syst. Res. 2017, 150, 169–176. [Google Scholar] [CrossRef]
  13. Platero, C.A.; Sánchez-Fernández, J.Á.; Gyftakis, K.N.; Blázquez, F.; Granizo, R. Performance problems of non-toroidal shaped current transformers. Sensors 2020, 20, 3025. [Google Scholar] [CrossRef] [PubMed]
  14. Li, Z.; Chen, X.; Wu, L.; Ahmed, A.S.; Wang, T.; Zhang, Y.; Li, H.; Li, Z.; Xu, Y.; Tong, Y. Error analysis of air-core coil current transformer based on stacking model fusion. Energies 2021, 14, 1912. [Google Scholar] [CrossRef]
  15. Kaczmarek, M.; Stano, E. The Influence of the 3rd Harmonic of the Distorted Primary Current on the Self-Generation of the Inductive Current Transformers. IEEE Access 2022, 10, 55876–55887. [Google Scholar] [CrossRef]
  16. Brandolini, A.; Faifer, M.; Ottoboni, R. A simple method for the calibration of traditional and electronic measurement current and voltage transformers. IEEE Trans. Instrum. Meas. 2009, 58, 1345–1353. [Google Scholar] [CrossRef]
  17. Laurano, C.; Toscani, S.; Zanoni, M. A simple method for compensating harmonic distortion in current transformers: Experimental validation. Sensors 2021, 21, 2907. [Google Scholar] [CrossRef] [PubMed]
  18. Cristaldi, L.; Faifer, M.; Laurano, C.; Ottoboni, R.; Toscani, S.; Zanoni, M. A Low-Cost Generator for Testing and Calibrating Current Transformers. IEEE Trans. Instrum. Meas. 2019, 68, 2792–2799. [Google Scholar] [CrossRef]
  19. Kaczmarek, M.L.; Stano, E. Application of the inductive high current testing transformer for supplying of the measuring circuit with distorted current. IET Electr. Power Appl. 2019, 13, 1310–1317. [Google Scholar] [CrossRef]
  20. Kaczmarek, M.; Kaczmarek, P. Comparison of the wideband power sources used to supply step-up current transformers for generation of distorted currents. Energies 2020, 13, 1849. [Google Scholar] [CrossRef]
  21. Kondrath, N.; Kazimierczuk, M.K. Bandwidth of current transformers. IEEE Trans. Instrum. Meas. 2009, 58, 2008–2016. [Google Scholar] [CrossRef]
  22. Gustavsen, B. Wideband Transformer Modeling Including Core Nonlinear Effects. IEEE Trans. Power Deliv. 2016, 31, 219–227. [Google Scholar] [CrossRef] [Green Version]
  23. Ballal, M.S.; Wath, M.G.; Suryawanshi, H.M. A novel approach for the error correction of ct in the presence of harmonic distortion. IEEE Trans. Instrum. Meas. 2019, 68, 4015–4027. [Google Scholar] [CrossRef]
  24. Haghjoo, F.; Pak, M.H. Compensation of CT distorted secondary current waveform in online conditions. IEEE Trans. Power Deliv. 2016, 31, 711–720. [Google Scholar] [CrossRef]
  25. Collin, A.J.; Femine, A.D.; Gallo, D.; Langella, R.; Luiso, M. Compensation of current transformers’ nonlinearities by tensor linearization. IEEE Trans. Instrum. Meas. 2019, 68, 3841–3849. [Google Scholar] [CrossRef]
  26. Gallo, D.; Landi, C.; Luiso, M. Real-time digital compensation of current transformers over a wide frequency range. IEEE Trans. Instrum. Meas. 2010, 59, 1119–1126. [Google Scholar] [CrossRef]
  27. Kaczmarek, M. The source of the inductive current transformers metrological properties deterioration for transformation of distorted currents. Electr. Power Syst. Res. 2014, 107, 45–50. [Google Scholar] [CrossRef]
  28. Kaczmarek, M. Estimation of the inductive current transformer derating for operation with distorted currents. Bull. Polish Acad. Sci. Tech. Sci. 2014, 62, 363–366. [Google Scholar] [CrossRef] [Green Version]
  29. Cataliotti, A.; Di Cara, D.; Emanuel, A.E.; Nuccio, S. Current transformers effects on the measurement of harmonic active power in LV and MV networks. IEEE Trans. Power Deliv. 2011, 26, 360–368. [Google Scholar] [CrossRef]
  30. Kaczmarek, M. Wide frequency operation of the inductive current transformer with Ni80Fe20 toroidal core. Electr. Power Compon. Syst. 2014, 42, 1087–1094. [Google Scholar] [CrossRef]
  31. Kaczmarek, M.; Szczęsny, A.; Stano, E. Operation of the Electronic Current Transformer for Transformation of Distorted Current Higher Harmonics. Energies 2022, 15, 4368. [Google Scholar] [CrossRef]
  32. Joint Committee For Guides In Metrology. Evaluation of Measurement Data–Guide to the Expression of Uncertainty in Measurement; ISO: Geneva, Switzerland, 2008; Volume 50, p. 134. [Google Scholar]
  33. Stano, E. The Method to Determine the Turns Ratio Correction of the Inductive Current Transformer. Energies 2021, 14, 8602. [Google Scholar] [CrossRef]
Figure 1. Equivalent circuit of inductive current transformer for distorted current transformation.
Energies 15 05436 g001
Figure 2. Measuring system for the evaluation of the current error and phase displacement of the inductive CT: (a) Electrical diagram; (b) Photo of the laboratory setup.
Energies 15 05436 g002
Figure 3. Measuring circuit used for construction of the vectorial diagram.
Energies 15 05436 g003
Figure 4. Vectorial diagram constructed for the inductive CT.
Energies 15 05436 g004
Figure 5. Influence of the rated resistive load of the secondary winding of the 100 A/5 A CT on its accuracy: (a) current error, (b) phase displacement.
Energies 15 05436 g005
Figure 6. Influence of the 25% of the rated resistive load of the secondary winding of the 100 A/5 A CT on its accuracy: (a) current error, (b) phase displacement.
Energies 15 05436 g006
Figure 7. The change, with the frequency of the transformed harmonic, of the mutual reactance of windings of a 100A/5A CT.
Energies 15 05436 g007
Figure 8. The change, with the frequency of the transformed harmonic, of the resistance representing the active power losses in the magnetic core of a 100A/5A CT.
Energies 15 05436 g008
Figure 9. The change of the values of the core excitation current components of the tested CT (a) reactive and (b) active.
Energies 15 05436 g009
Figure 10. Vectorial diagrams constructed for the tested CT for a given harmonic: (a) 1st harmonic, (b) 20th harmonic, (c) 100th harmonic.
Energies 15 05436 g010
Publisher’s Note: MDPI stays neutral with regard to jurisdictional claims in published maps and institutional affiliations.

