
Modeling and Analysis of Load Growth Expected for Electric Vehicles in Pakistan (2021–2030)

 ,
,
Abstract
:1. Introduction
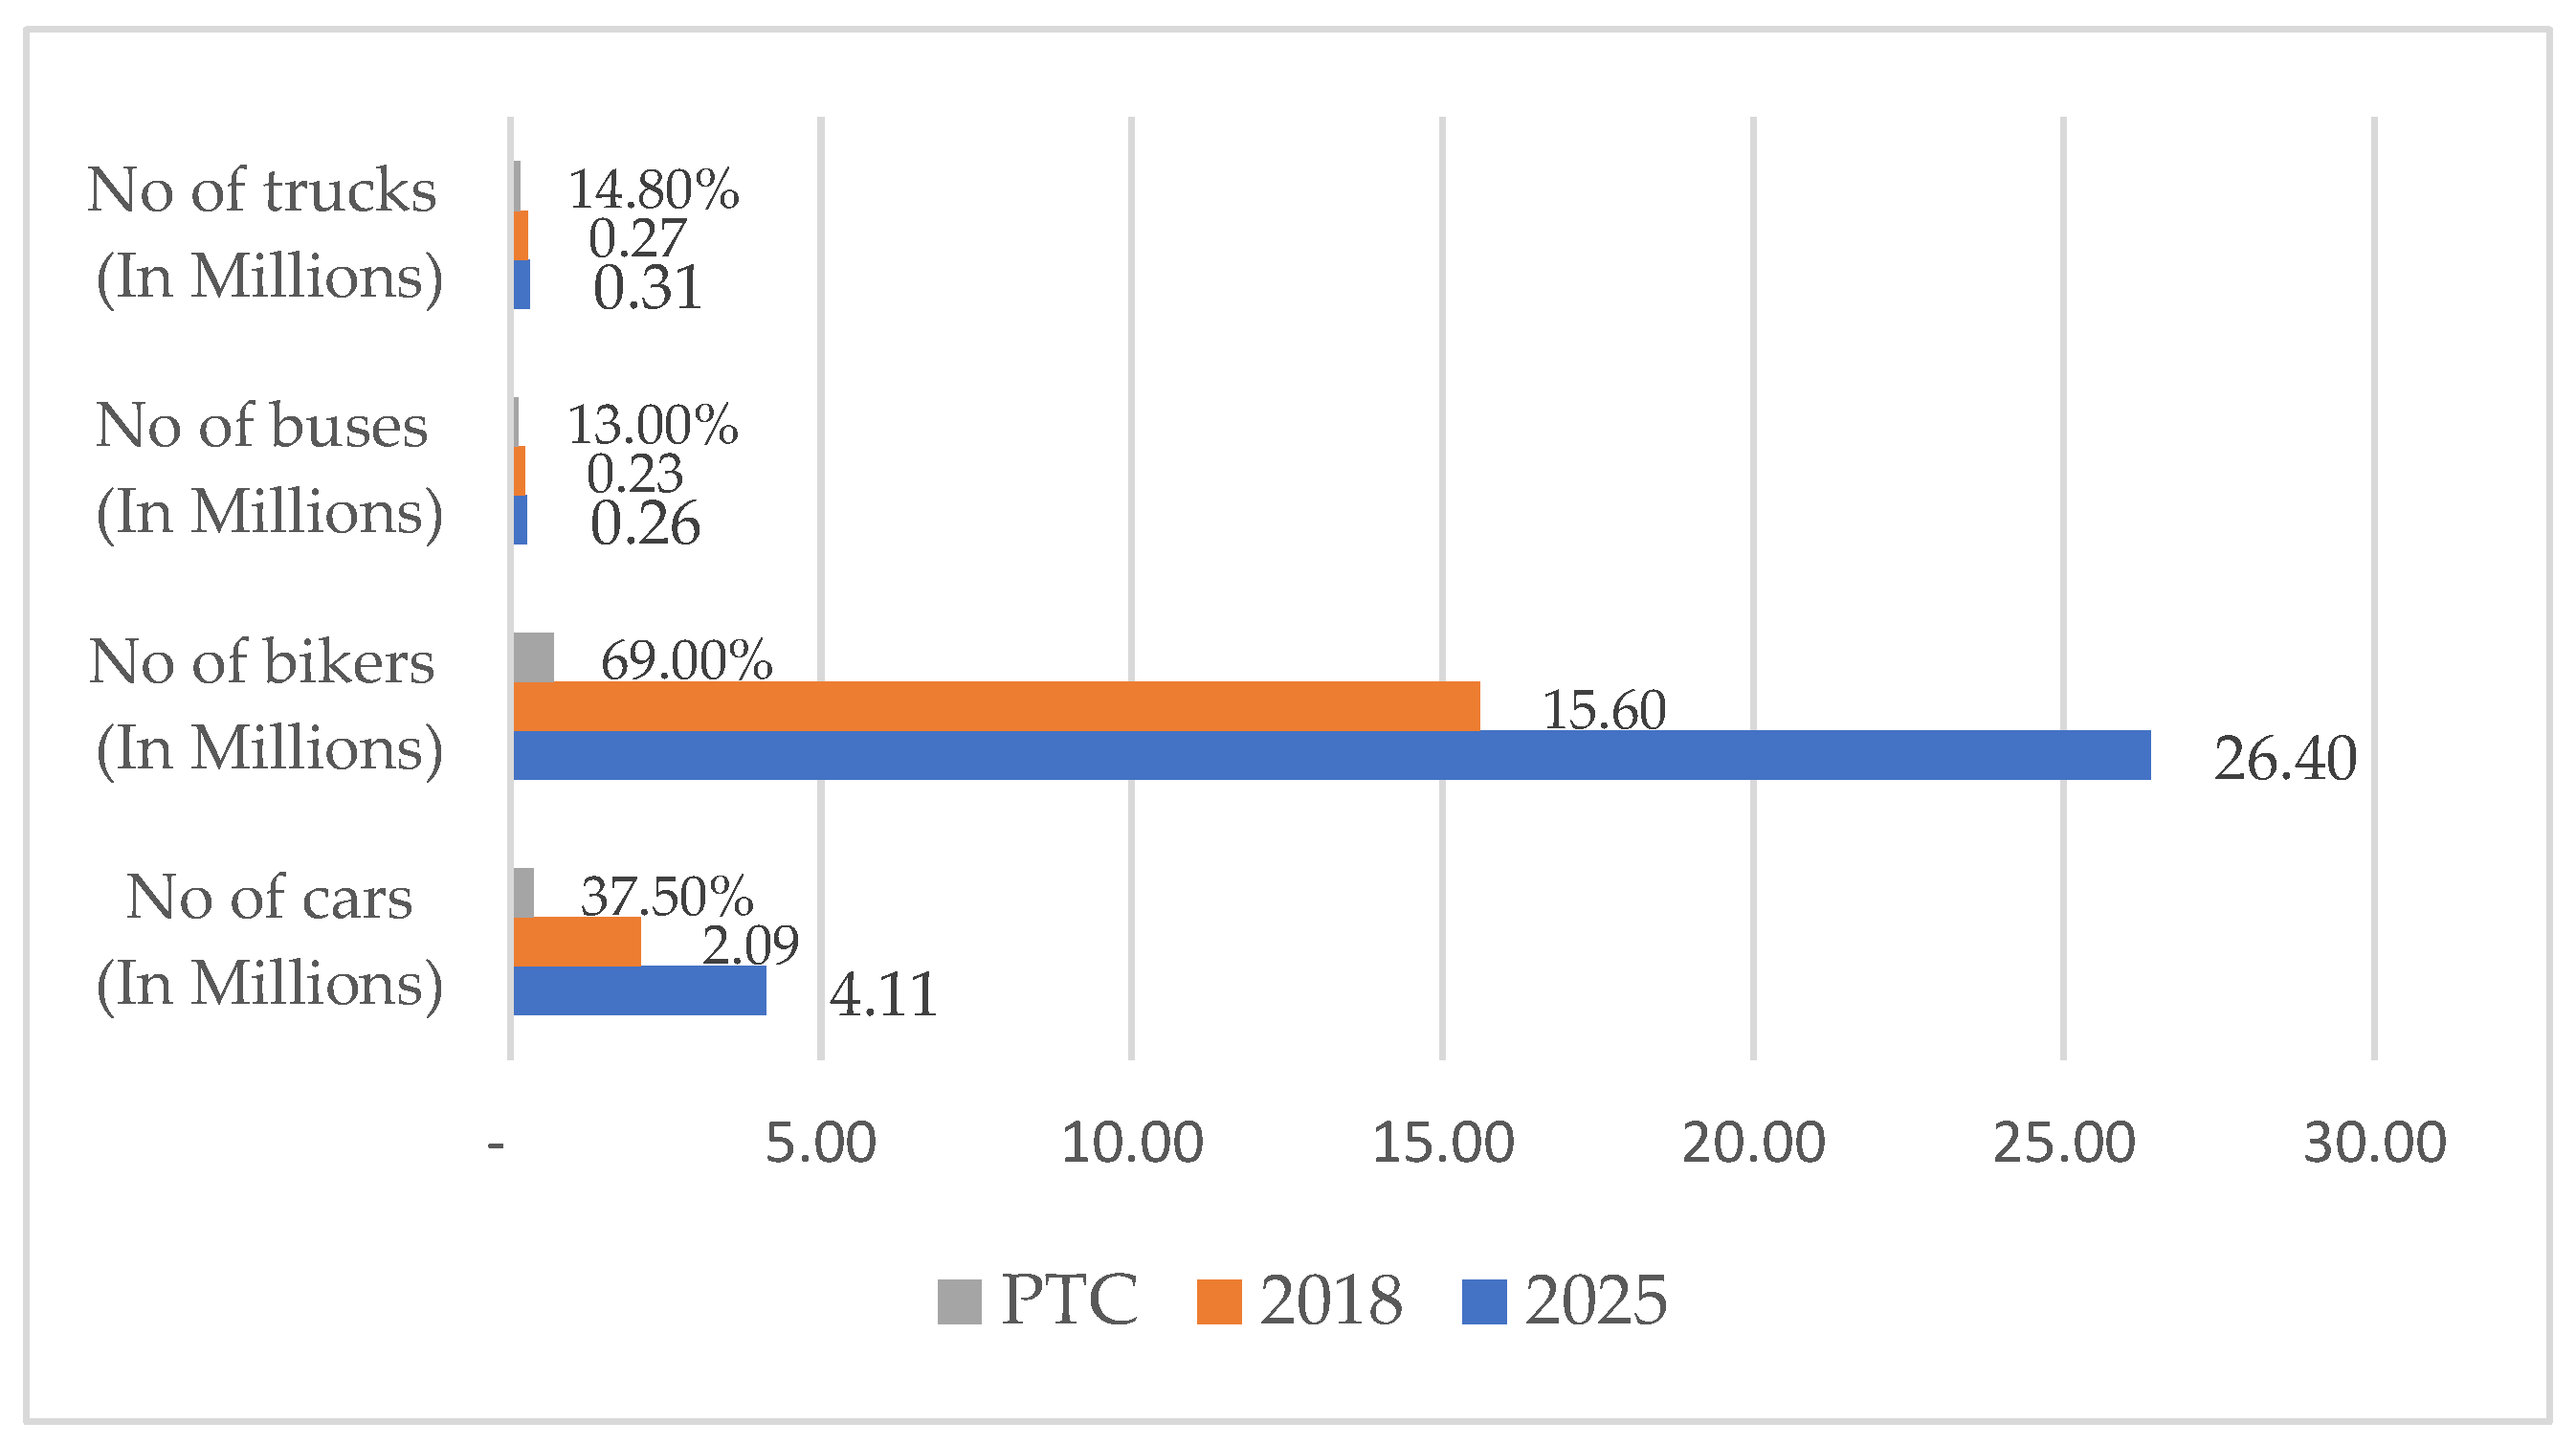
2. Transport Sector of Pakistan and Associated Issues
- i.
- Commercial Transport:
- ii.
- Private Transport:
- iii.
- Public Transport:
3. Electricity Situation in Pakistan
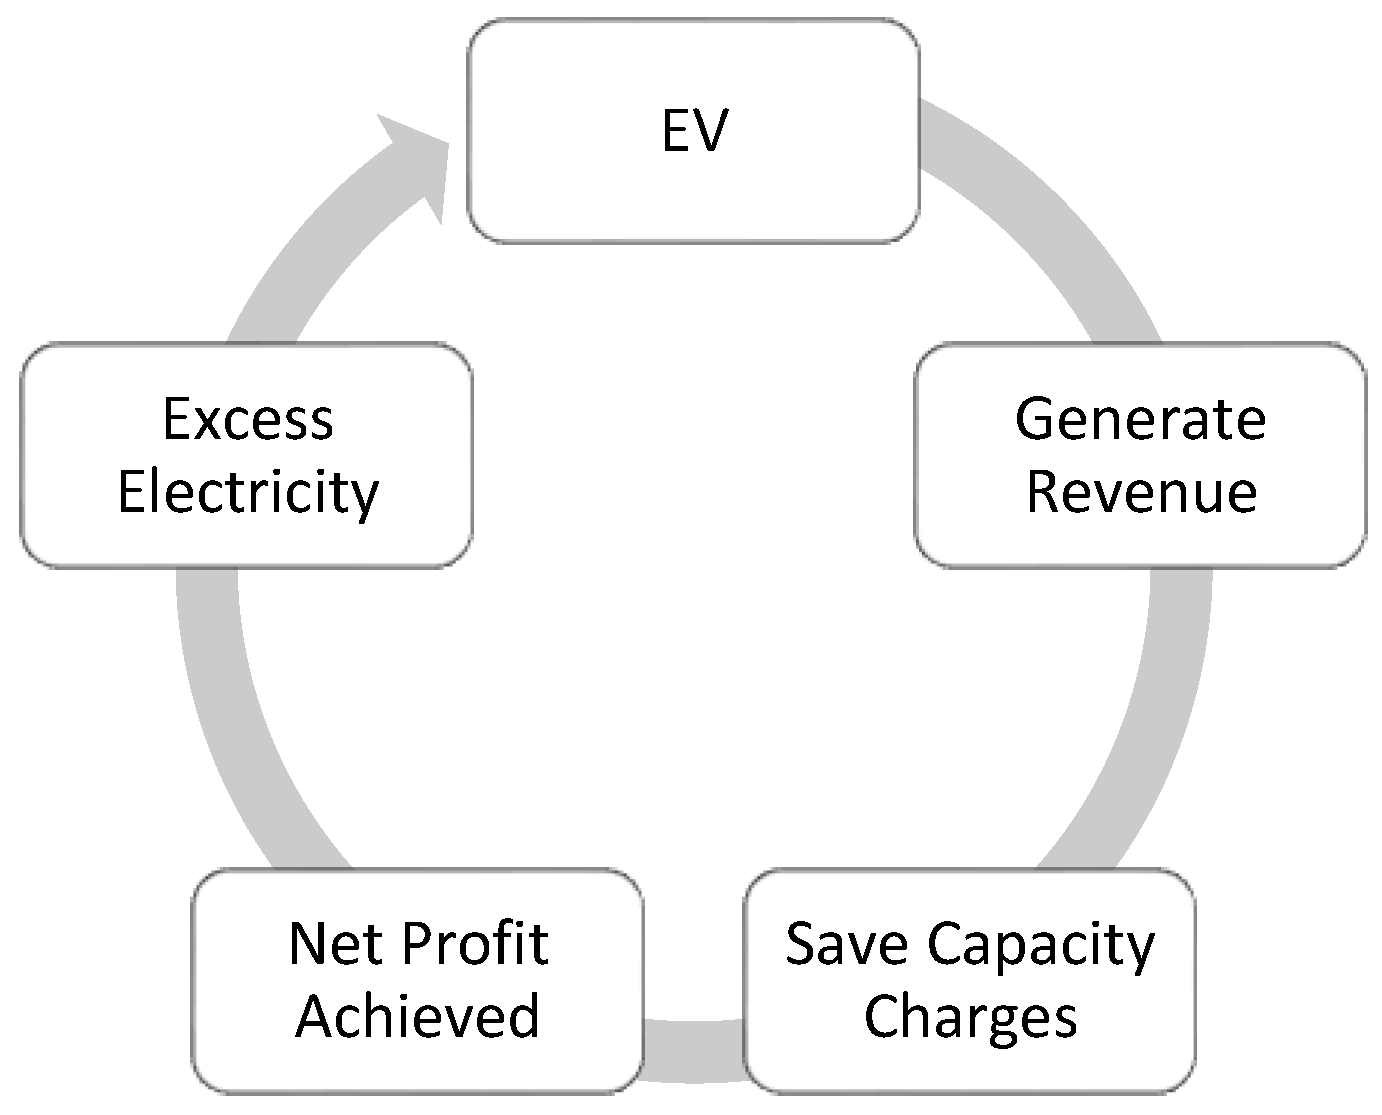
Issues with Excess Electricity
4. National Electric Vehicle Policy of Pakistan 2020–2030
4.1. Main Objectives of the Electric Vehicle Policy
- Encourage Pakistan’s auto and associated industries to adopt electric vehicle manufacturing as a pivot to country’s industrial progress [16].
- Curtail the current negative climate impact on Pakistan by introducing and incorporating green energy technologies in the transport sector to reduce the carbon footprint [16].
- Generate employment opportunities as new companies would invest in the transition [16].
- To ensure reduction of external deficit by decreasing oil import through clean transportation [16].
4.2. Summarized Recommendations of the Policy
4.2.1. Two/Three Wheelers
- For five years, the EV policy period, the general sales tax (GST) for the 2/3 wheelers is to be fixed at the 1% at sales stage. Whereas at the importing stage, the sales tax is to be renounced off (0%) to avoid refunds.
- The specific parts of electric 2/3 wheelers to be imported would have custom duty (CD) standing at 1% for the EV policy period.
- Registration and annual token tax exemption for 2/3 wheelers. Tolls for electric vehicles will be reduced by 50%.
- The existing manufacturing industry for traditional 2/3 wheelers in terms of non-electric parts should be preserved to maintain the previously obtained localization until a strategy on conventional vehicle retirement is developed and implemented.
- The new and existing manufacturers should both benefit from the EV policy.
- Import of new electric 2/3 wheelers in CBU condition at the concessionary pace of obligation (50% of the common pace of custom obligation) to be connected with foundation of assembling offices, i.e., 10 units for every variation with a limit of 200 units permitted to be imported under a concessionary system in an auto area neighborhood. In any case, advancement of cross breed innovation is not tended to in this strategy.
4.2.2. Heavy Commercial Vehicles
- The complete build up (CBUs) of EV buses, trucks, and prime movers would have 1% CD on import. Import of entire Completely Knocked Downs (CKD) allowed to have a CD of 1% to the local manufacturers.
- General sales tax of 1% at the point of sale and 0% at the point of import.
- Registration, yearly renewal, and permit fees are waived, and toll taxes are reduced by half for HCVs.
4.3. Generalized Recommendations
- Review of localization of parts and machineries should be done periodically after 2 years of the announcement of policy.
- Both current and new entrants in both 2/3 wheelers and HCVs would be granted duty and tax-free import of equipment and machinery.
- Manufacturing of car components and building of manufacturing facilities for EV-related equipment will be eligible for a five-year income tax exemption.
- Tax and duty exemptions to be sanctioned for EV vendors for 5 years (applies to in-house manufacturing by OEMs also).
- The States Bank of Pakistan’s funding facility program for encouraging green infrastructure investments will incorporate EV manufacturing, i.e., EV parts, components, and module manufacturing, EV infrastructure development including charging stations, etc.
- Chargers imported with the CKD will be subject to a 1% customs duty and 1% sales tax, while charging stations for electric vehicles imported under HS Code 8504.4030 will continue to be subject to a 0% customs duty.
4.4. Limitation of EV Policy
- The policy targets mitigation of carbon footprint with green infrastructure. However, a subsequent vehicle retirement policy analogous to the power plant retirement policy has not been formulated yet and conventional vehicles in the form of a car, bus, and truck are a great source of GHG emissions. Therefore, organized efforts by the concerned stakeholders will be required for achieving the targets effectively.
- EVs reflect the most recent technical trend and are costly, particularly in terms of battery costs, which are a significant component of the technology under consideration. Because its lifespan is typically five years, clients in Pakistan may be hesitant to pay the upfront amount in advance. However, batteries for motorcycles and rickshaws are either inexpensive or may be utilized in these 2/3 wheelers with regular batteries.
- Hybrid automobiles are also more expensive, and buyers may be enticed to spend more because they are regarded like regular gasoline vehicles.
- The EVs offer basically robust and lightweight conveyance which may not be suitable to operate on the roads of Pakistan, especially the ones in the less developed areas owing to poor road network infrastructure.
- The Govt. of Pakistan through its planning division must ensure finance to establish localized industry manufacturing for gradual import substitution. This will pay the path for cost reduction and bright prospects for future investment.
- Due to Pakistan’s underdeveloped conformity assessment framework, standardization, quality, and equipment safety would be a challenge.
- There is no availability of charging infrastructure which poses a major challenge and hence invites attention to future investment in this area.
5. Modeling of Load Growth of EVs in Pakistan in 2021–2030
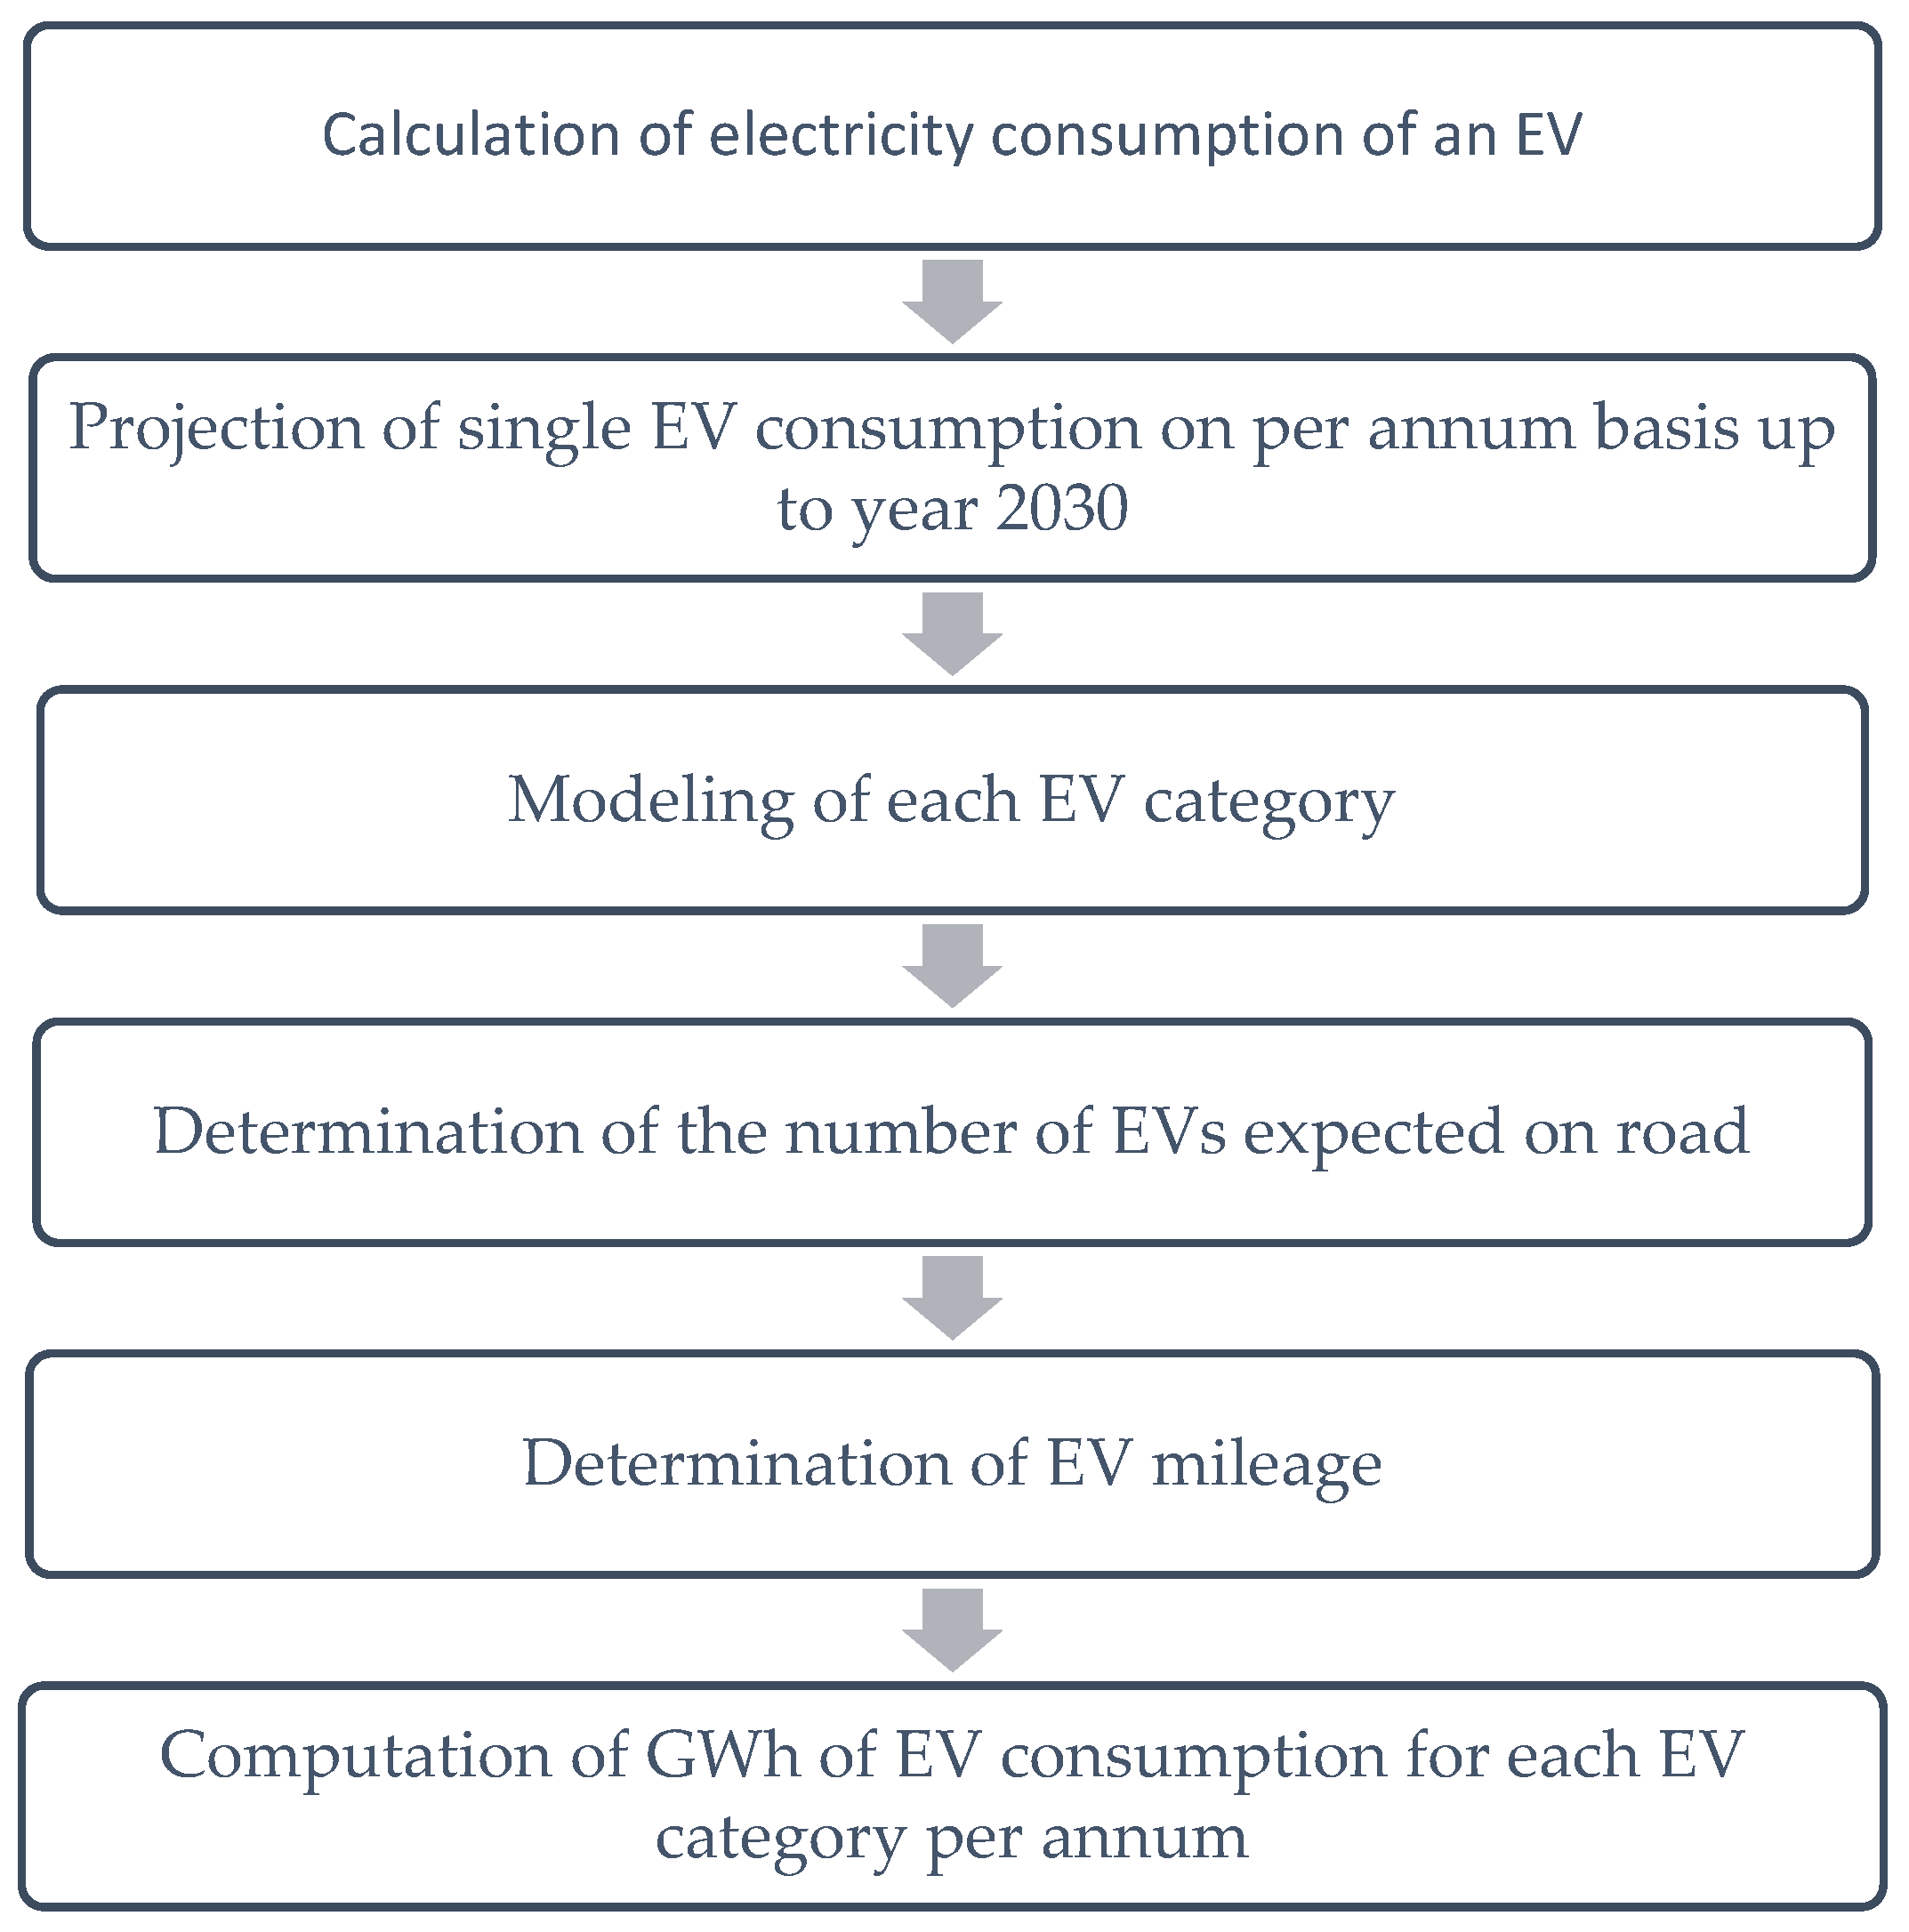
5.1. Methodology
5.2. Demand Forecast of Vehicles
5.2.1. Demand Forecast Model (Cars)
5.2.2. Demand Forecast Model (2/3 Wheeler)
5.2.3. Demand Forecast Model (Trucks)
5.2.4. Demand Forecast Model (Buses)
5.3. Set of Qualitative Assumptions
- The most probable major urban cities to employ EVs are Lahore, Quetta, Islamabad, Karachi, and Peshawar.
- This model is based on data set for the city of Lahore.
- Losses incurred with respect to EV charging stations are not considered.
5.4. Set of Quantitative Assumptions
- Load factor is 60%.
- Transmission losses at 500 and 220 kV voltage levels are 2.71%.
- Distribution losses at 132 kV voltage level and below are 15%.
6. Results
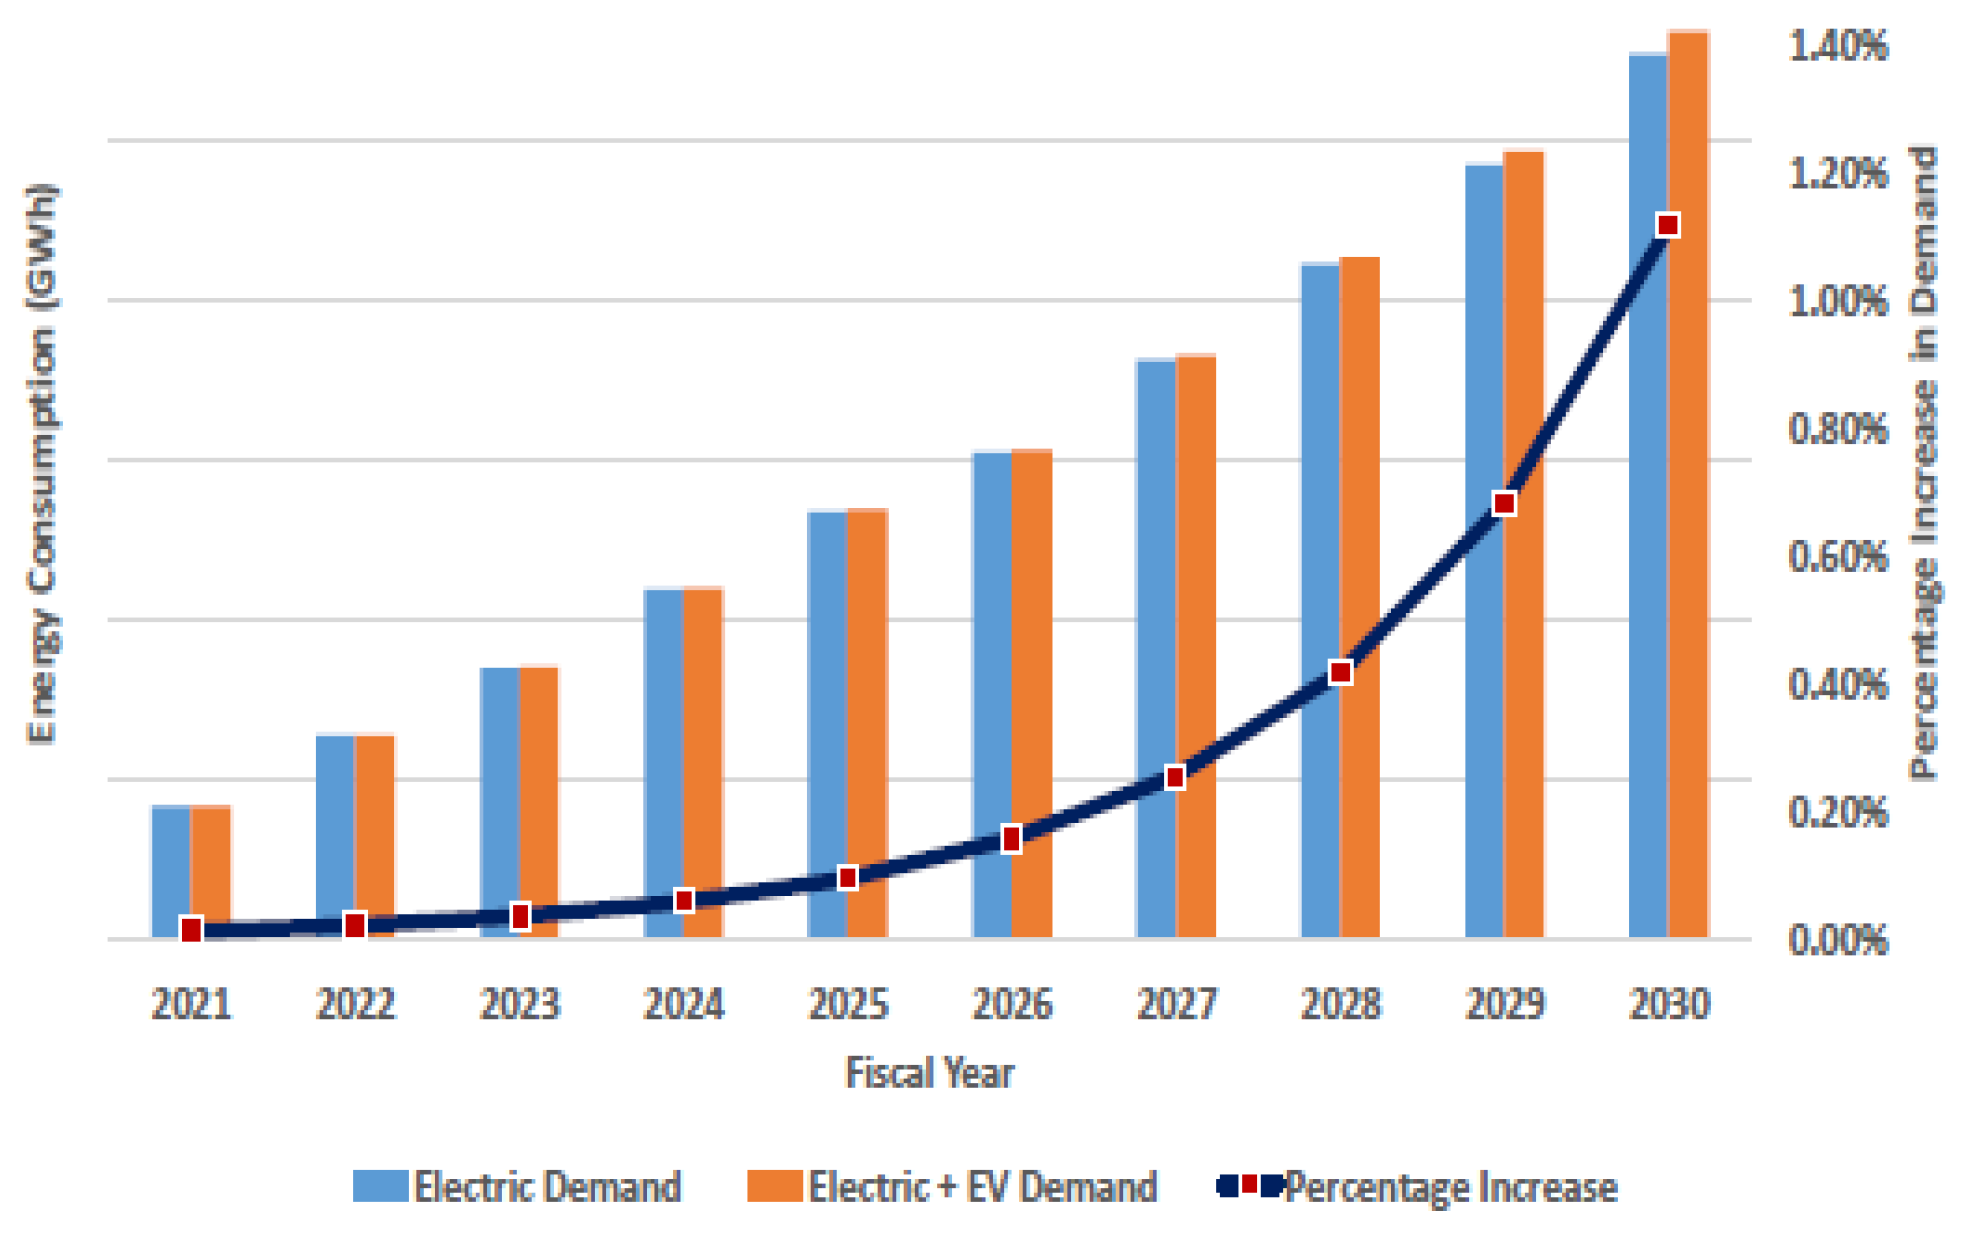
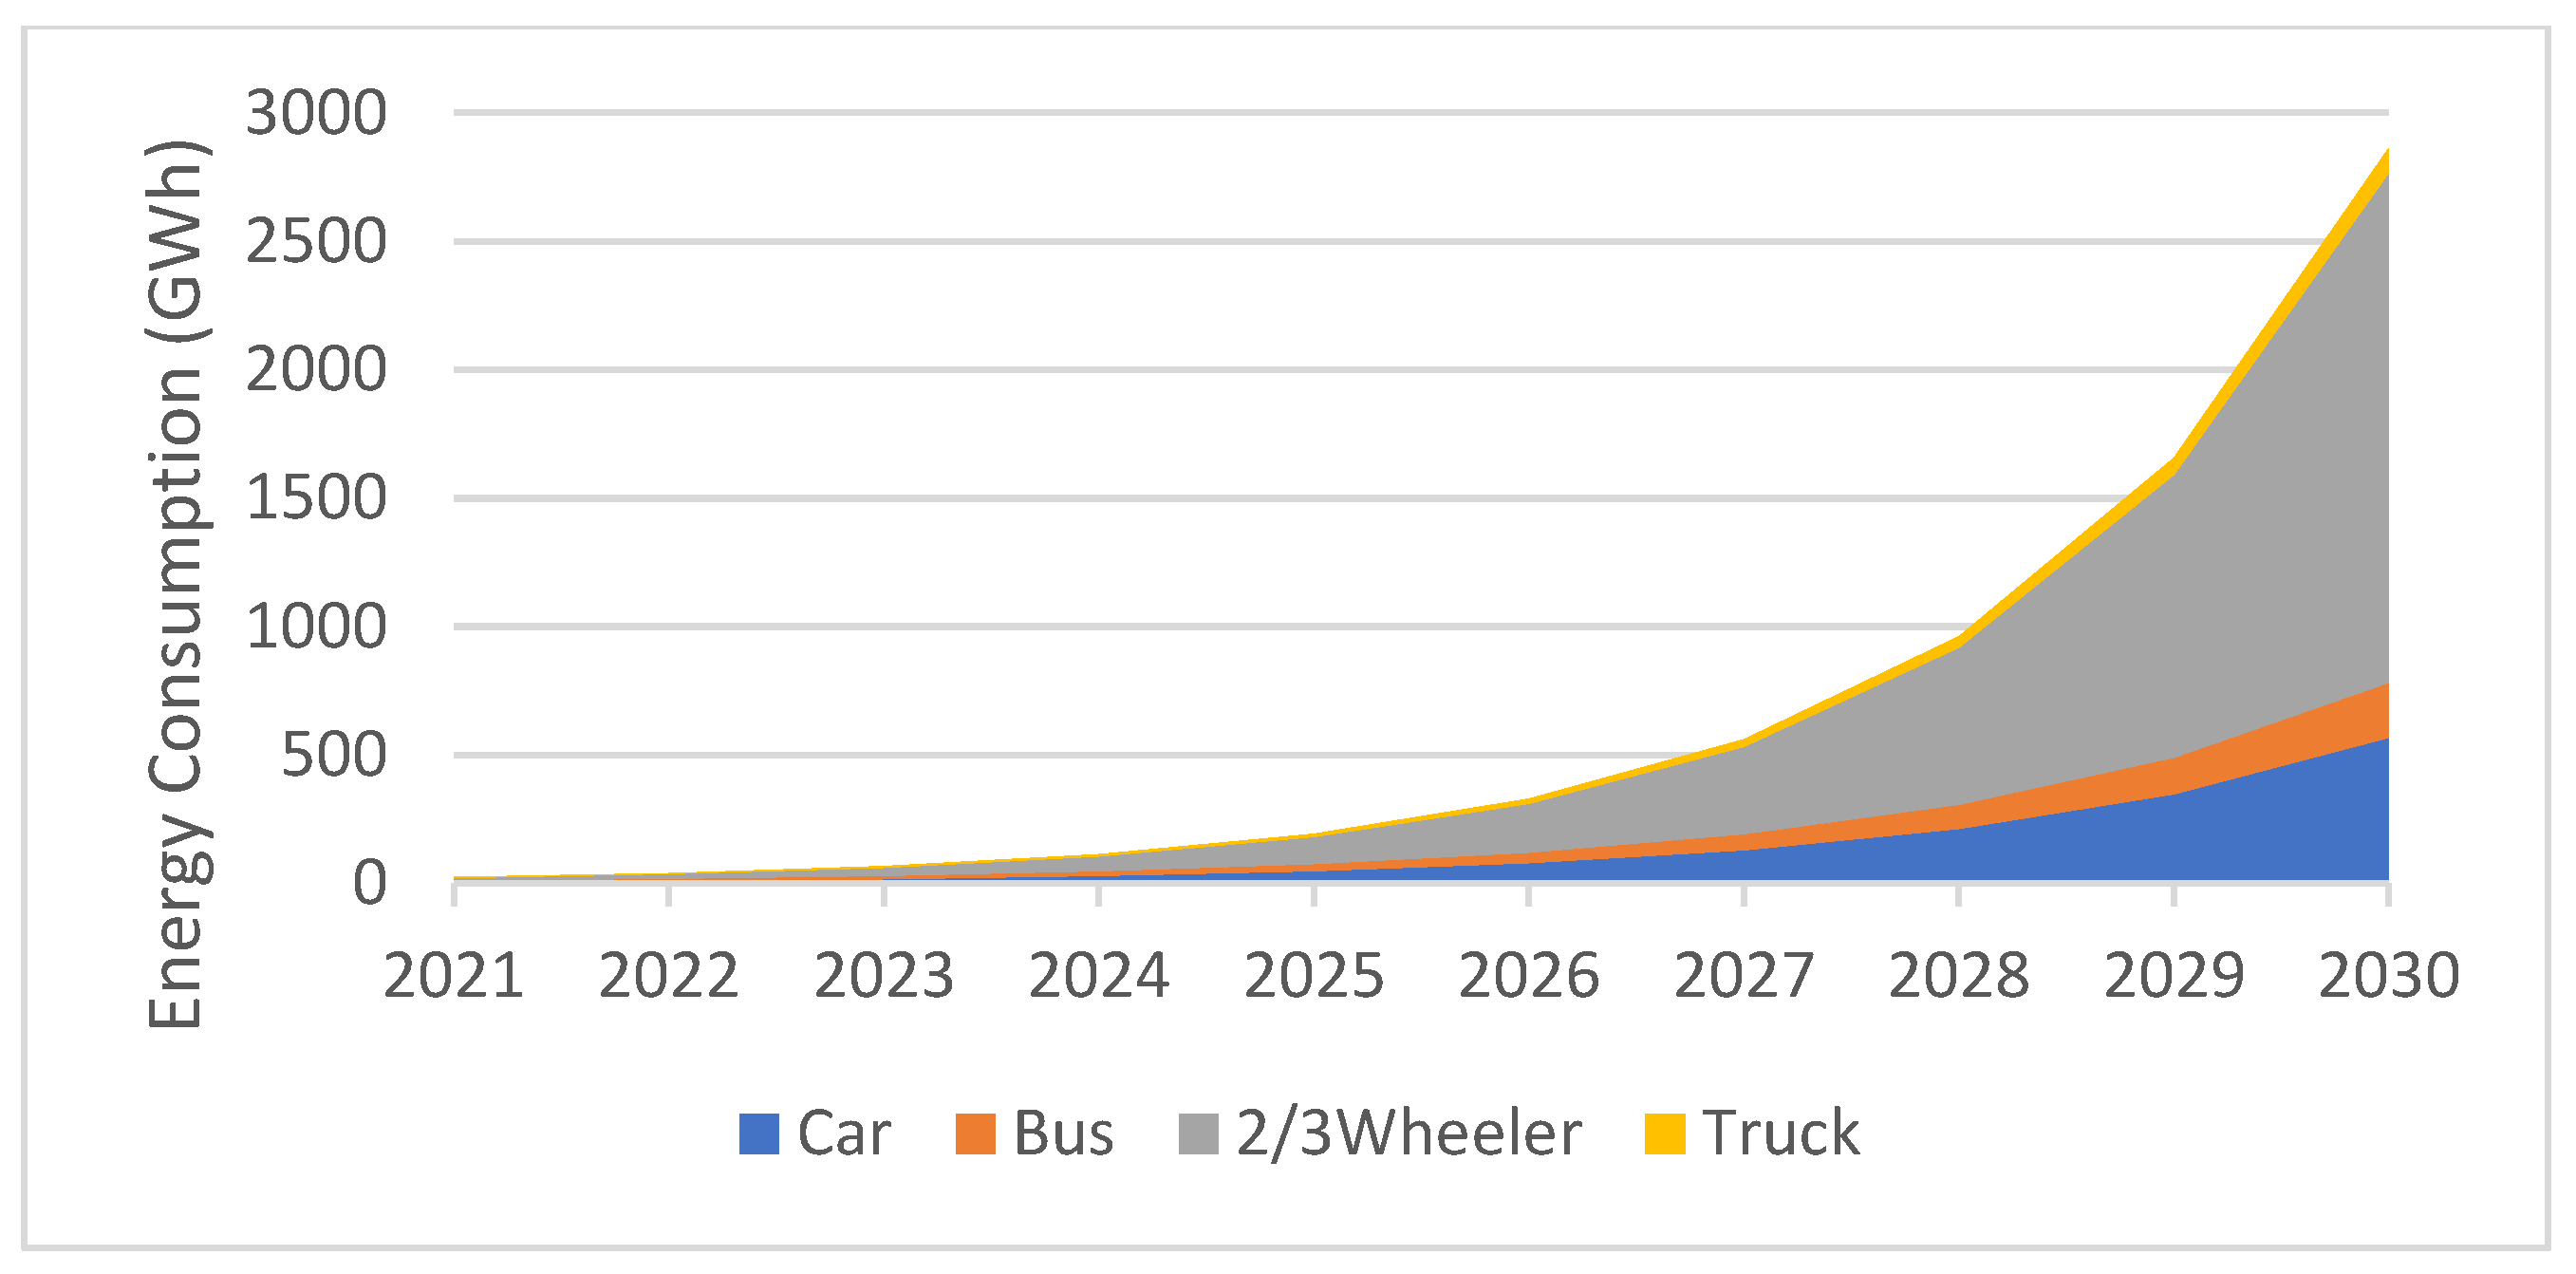
6.1. EV Demand Forecast on the Base Model
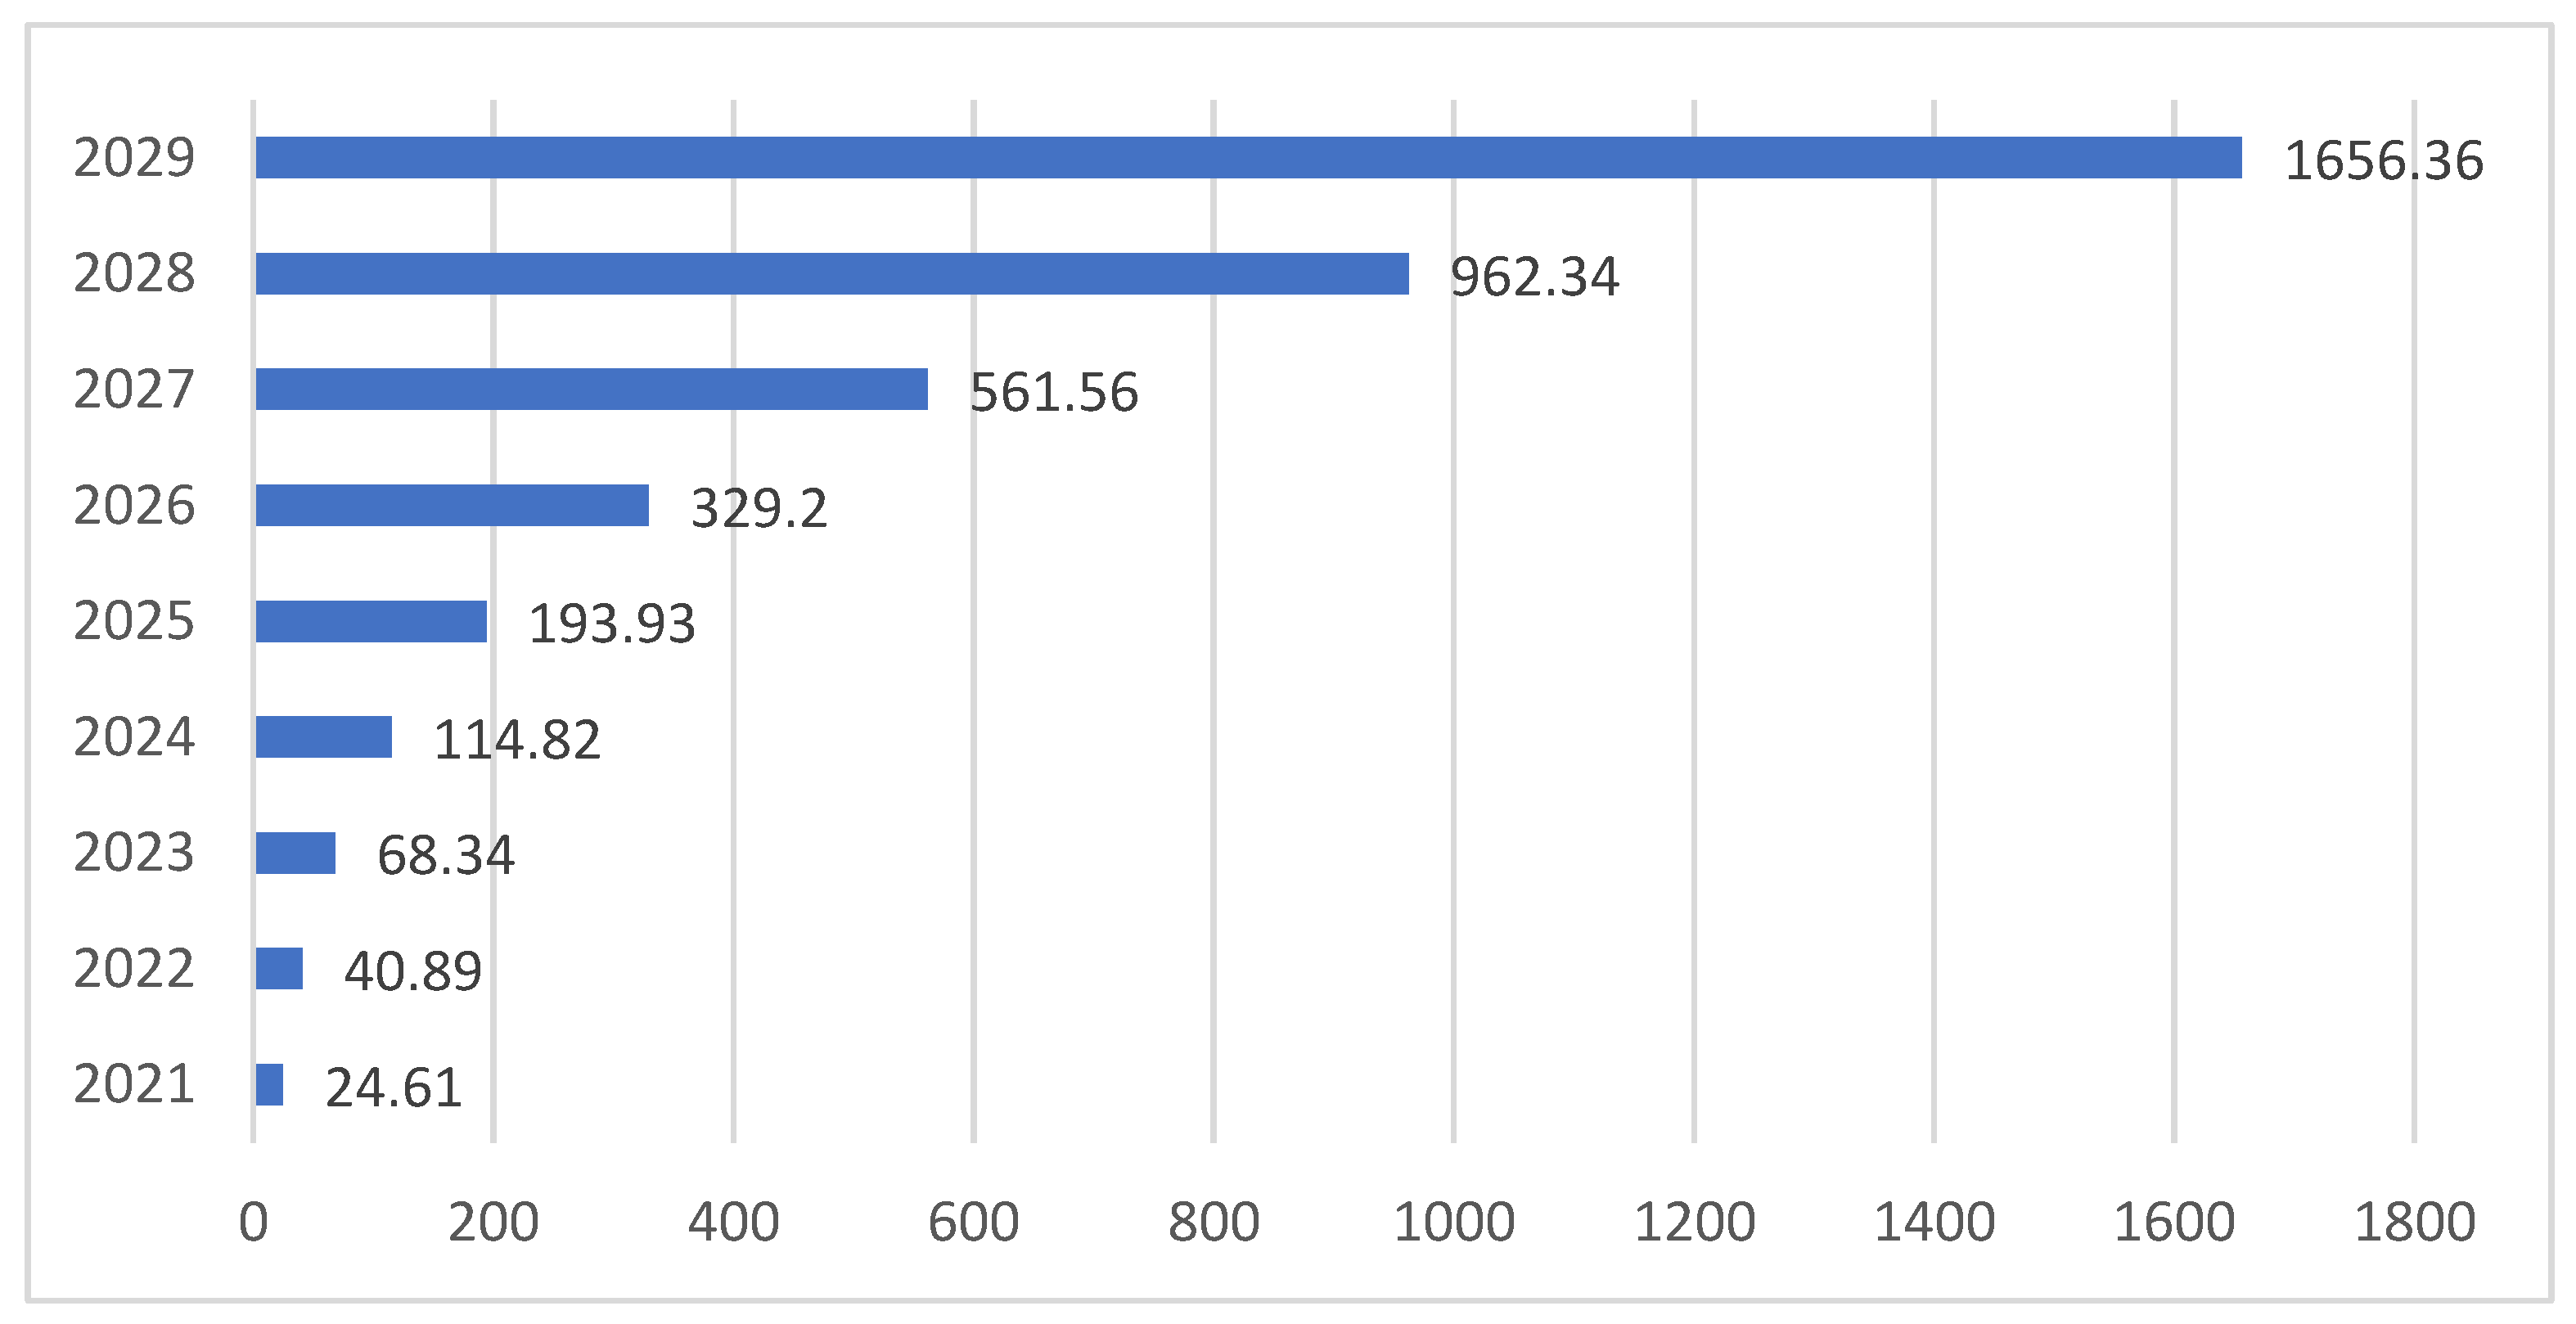
6.2. EV Demand Forecast on Revised Model
- Linear curve of expected EVs on the road was converted to an exponential curve but the value at year 2030 remained the same.
- T&D losses increased from 17.71% to 20%.
- Load data from EV and housing forecast simulated in the WASP model with impact of EV charging at peak load duration.
7. Conclusions and Future Recommendations
Author Contributions
Funding
Institutional Review Board Statement
Informed Consent Statement
Data Availability Statement
Conflicts of Interest
References
- Hutfilter, U.F.; Parra, P.Y.; Zimmer, A.; Ancygier, A.; Saeed, F.; Brecha, R.; Hare, B.; Granadillos, J.; Aboumahboub, T.; Ganti, G.; et al. Country Profile Pakistan: Decarbonizing South and South-East Asia Report; Climate Analytics: Berlin, Germany, 2019. [Google Scholar]
- World’s Most Polluted Countries in 2020 (PM2.5) Ranking, World Air Quality Report, AirVisual. 2020. Available online: www.iqair.com/world-most-polluted-countries (accessed on 25 February 2022).
- Global CO2 Emissions to Drop 4-7pc in 2020, but Will It Matter? May 2020. Available online: www.dawn.com/news/1558475 (accessed on 25 February 2022).
- Pakistan Oil Consumption, 1965–2021 | CEIC Data. Available online: https://www.ceicdata.com/en/indicator/pakistan/oil-consumption (accessed on 3 March 2022).
- Le Quéré, C.; Jackson, R.B.; Jones, M.W.; Smith, A.; Abernethy, S.; Andrew, R.M.; De-Gol, A.J.; Willis, D.R.; Shan, Y.; Canadell, J.G.; et al. Temporary reduction in daily global CO2 emissions during the COVID-19 forced confinement. Nat. Clim. Change 2020, 10, 647–653. [Google Scholar] [CrossRef]
- Bhutto, D.K.; Shah, M.A.; Chachar, F.A. Electric mobility and Energy security in Pakistan: A review. In Proceedings of the Third International Conference on Computing, Mathematics and Engineering Technologies, IEEE Xplore, Sukkur, Pakistan, 29–30 January 2020; pp. 1–6. [Google Scholar]
- Pareek, S.; Sujil, A.; Ratra, S.; Kumar, R. Electric vehicle charging station challenges and opportunities: A future perspective. In Proceedings of the International Conference on Emerging Trends in Communication, Control and Computing, IEEE Xplore, Lakshmangarh, India, 21–22 February 2020; pp. 1–6. [Google Scholar]
- Asghar, R.; Rehman, F.; Ullah, Z.; Qamar, A.; Ullah, K.; Iqbal, K.; Aman, A.; Nawaz, A.A. Electric vehicles and key adaptation challenges and prospects in Pakistan: A comprehensive review. J. Clean. Prod. 2021, 278, 123375, ISSN 0959-6526. [Google Scholar] [CrossRef]
- Ansari, M.; Talpur, A.; Siyal, A.; Unar, N.A.; Aslam, B.; Khatri, S.A. An Overview and Prospects of EVs in Pakistan: A Proposal of RE Based EV Charging Station at Jamshoro. In Proceedings of the 2021 IEEE PES Innovative Smart Grid Technologies Asia (ISGT Asia), Brisbane, Australia, 5–8 December 2021. [Google Scholar]
- Malik, A. Fuel Demand in Pakistan’s Transport Sector; MPRA Paper 103455; Munich Personal RePEc Archive: Munich, Germany, 2020. [Google Scholar]
- Eco-Friendly Transportation in Pakistan, a Dream Yet to Come. Available online: http://www.lead.org.pk/lead/postDetail.aspx?postid=10395 (accessed on 16 January 2022).
- Arshad, N.; Ullah, N.; Khan, B.T.; Javed, M.A.; Arslan, M.M.; Qureshi, M.H. Electric Vehicles in Pakistan: Policy Recommendations; LUMS Energy Institute and US-Pakistan Center for Advanced Studies in Energy (USPCAS-E): Peshawar, Pakistan, 2019; Available online: https://web.lums.edu.pk/~eig/pdf/evReport.pdf (accessed on 6 January 2022).
- Analysis: Pakistan Pays Heavy Price for Excess Power Generation Capacity. TheThirdPole. 2021. Available online: https://www.thethirdpole.net/en/energy/pakistan-excess-power-generation/ (accessed on 17 February 2022).
- NEPRA. State of Industry Report 2021; National Electric Power Regulatory Authority, Govt. of Pakistan: Islamabad, Pakistan, 2021. [Google Scholar]
- Pakistan Economic Survey 2018–2019; Ministry of Finance, Government of Pakistan. 2019. Available online: https://www.finance.gov.pk/survey_1819.html (accessed on 3 March 2022).
- Electric Vehicle Policy 2020–2025 (Draft) 2-3 Wheelers & Heavy Commercial Vehicles; Engineering Development Board, Ministry of Industries and Production, Government of Pakistan, June 2020. Available online: https://invest.gov.pk/sites/default/files/2020-07/EV%2023HCV%20130620%20PDF.pdf.pdf (accessed on 12 December 2021).
- Indicative Generation Capacity Expansion Plan (IGCEP 2021–2030). National Transmission and Dispatch Company (NTDC), Ministry of Energy, Govt. of Pakistan. 2021. Available online: https://nepra.org.pk/Admission%20Notices/2021/06%20June/IGCEP%202021.pdf (accessed on 3 November 2021).


| Reference | Contribution |
|---|---|
| “Temporary reduction in daily global CO2 emissions during the COVID-19 forced confinement”, Nature Climate Change [5] | Day-to-day overall CO2 discharges were brought down by 17% toward the beginning of April 2020 contrasted with the similar period in 2019, somewhat under half because of changes in street ventures attributable to lockdowns; however, these uncommon decreases were not at all permanent since lockdowns in many districts of the world were lifted. This shows that the vehicle area has a huge part in the planet’s climate emergency. Moreover, as per the NEPRA State of Industry Report 2020, Pakistan faces another test in the financial year (FY) 2019–2020, following many years of electric power deficiencies. |
| Electric mobility and Energy security in Pakistan: A review [6] | As the idea of taking on EVs in Pakistan is still new, there are restricted writing surveys that make sense of the offices of EV charging stations (EVCS) and key areas in Pakistan for their establishment, yet there is an unbalanced enormous number of papers that stress the capability of EVs. For example, in the paper the creators investigate the rising issue of GHG emissions in Pakistan, with a specific spotlight on the transportation sector. For the choice of a satisfactory class of EVs for the future market of Pakistan, a fluffy SWOT method is applied, and fuzzy straight writing computer programs are utilized to break down the feasibility of EVs in Pakistan’s developing business sector climate. |
| Electric vehicle charging station challenges and opportunities: A future perspective [7] | In this paper, a correlation between burning motors and electric vehicles is made in various fundamental regions to advance electric portability in Pakistan. The review underscores the requirement for an energy security strategy, covers a few types of EVs, and suggests plug-in hybrid and battery electric vehicles as the most encouraging advances.The paper also talks about the potential risks of fostering the EVCS as far as matrix over-burdening, battery charging and discharging, and T&D interconnections are concerned. |
| Country Profile Pakistan: Decarbonizing South and South-east Asia Report [1] | This paper depicts the rapidly increasing effects of expanding worry of GHG emissions in Pakistan, putting more accentuation on the transportation sector, and utilizes a fluffy SWOT technique for choosing a sensible class of EVs for Pakistan’s future market, while fuzzy direct writing computer programs are utilized to look at the plausibility of EVs in Pakistan creating market circumstances. The review finishes up by recommending guidelines for the specialists to consider EVs in Pakistan. |
| Electric vehicles and key adaptation challenges and prospects in Pakistan: A comprehensive review [8] | A concise rundown of the proceeding with the change in the EV business, as well as its adaption boundaries in Pakistan, is introduced in the paper [8], and possibilities that show up for EVs following dispersion in the ongoing business sector are analyzed. |
| An Overview and Prospects of EVs in Pakistan: A Proposal of RE Based EV Charging Station at Jamshoro [9] | This paper highlights study centers around Pakistan’s abundance of power, ecological difficulties, transportation areas, and EVs as the conceivable arrangement, featuring Jamshoro, Sindh, as perhaps the most appropriate site, principally concerning renewable energy potential. |
| Summary of Power Balances (MW) Based on IGCEP 2021–2030 | |||||||||||||
|---|---|---|---|---|---|---|---|---|---|---|---|---|---|
| Fiscal Year | July | August | September | October | November | December | January | February | March | April | May | June | |
| 2021–2022 | Total Installed Capacity | - | - | - | - | - | - | - | 35,844 | 36,021 | 38,783 | 39,443 | 40,119 |
| Firm Gen. Capability | - | - | - | - | - | - | - | 22,229 | 20,661 | 27,484 | 31,870 | 32,327 | |
| Peak Demand | - | - | - | - | - | - | - | 13,812 | 13,952 | 17,602 | 21,811 | 24,574 | |
| Net Surplus/Deficit | - | - | - | - | - | - | - | 8417 | 6708 | 9882 | 10,059 | 7753 | |
| 2022–2023 | Total Installed Capacity | 40,449 | 40,471 | 40,471 | 39,111 | 37,511 | 37,511 | 37,511 | 37,511 | 37,781 | 37,781 | 37,781 | 39,385 |
| Firm Gen. Capability | 34,729 | 31,777 | 30,422 | 29,475 | 25,980 | 24,488 | 24,356 | 24,469 | 21,425 | 26,342 | 31,137 | 32,304 | |
| Peak Demand | 24,788 | 24,585 | 23,543 | 20,331 | 15,156 | 14,908 | 14,401 | 14,473 | 14,620 | 18,422 | 22,827 | 25,779 | |
| Net Surplus/Deficit | 9941 | 7192 | 6879 | 9144 | 10,823 | 9580 | 9955 | 9997 | 6806 | 7920 | 8310 | 6525 | |
| 2023–2024 | Total Installed Capacity | 42,106 | 42,106 | 42,166 | 42,166 | 42,216 | 42,754 | 42,754 | 42,754 | 42,764 | 42,833 | 44,363 | 44,363 |
| Firm Gen. Capability | 36,099 | 35,209 | 31,824 | 31,689 | 26,476 | 25,431 | 24,447 | 27,631 | 24,836 | 30,740 | 37,226 | 35,087 | |
| Peak Demand | 27,407 | 27,182 | 26,714 | 22,479 | 17,198 | 16,916 | 16,341 | 16,422 | 16,589 | 20,368 | 25,238 | 28,027 | |
| Net Surplus/Deficit | 8692 | 8027 | 5109 | 9210 | 9278 | 8515 | 8106 | 11,209 | 8247 | 10,373 | 11,988 | 7059 | |
| 2024–2025 | Total Installed Capacity | 46,363 | 47,433 | 47,433 | 47,433 | 47,433 | 47,441 | 47,441 | 47,441 | 47,441 | 48,521 | 48,521 | 48,521 |
| Firm Gen. Capability | 39,785 | 39,211 | 34,759 | 33,826 | 28,903 | 28,179 | 25,439 | 29,032 | 26,691 | 32,971 | 40,213 | 37,618 | |
| Peak Demand | 28,651 | 28,416 | 27,927 | 23,499 | 17,978 | 17,684 | 17,082 | 17,168 | 17,342 | 21,292 | 26,384 | 29,389 | |
| Net Surplus/Deficit | 11,135 | 10,795 | 6833 | 10,327 | 10,924 | 10,495 | 8357 | 11,864 | 9348 | 11,679 | 13,829 | 8229 | |
| 2025–2026 | Total Installed Capacity | 50,721 | 50,721 | 50,721 | 50,991 | 51,871 | 51,871 | 52,071 | 52,071 | 52,271 | 52,471 | 52,471 | 52,471 |
| Firm Gen. Capability | 43,380 | 41,608 | 36,451 | 37,649 | 32,231 | 30,986 | 27,056 | 28,665 | 26,531 | 32,745 | 42,445 | 40,620 | |
| Peak Demand | 29,950 | 29,704 | 29,193 | 24,564 | 18,794 | 18,486 | 17,857 | 17,946 | 18,129 | 22,257 | 27,580 | 30,814 | |
| Net Surplus/Deficit | 13,430 | 11,904 | 7258 | 13,085 | 13,438 | 12,501 | 9199 | 10,719 | 8402 | 10,487 | 14,865 | 9807 | |
| 2026–2027 | Total Installed Capacity | 53,533 | 53,533 | 53,308 | 53,308 | 53,308 | 53,602 | 53,602 | 53,602 | 53,683 | 52,409 | 52,409 | 52,409 |
| Firm Gen. Capability | 44,950 | 43,688 | 38,732 | 38,162 | 31,701 | 30,435 | 26,739 | 29,744 | 29,261 | 33,293 | 43,434 | 39,776 | |
| Peak Demand | 31,280 | 31,023 | 30,489 | 25,655 | 19,628 | 19,307 | 18,650 | 18,743 | 18,934 | 23,246 | 28,805 | 32,276 | |
| Net Surplus/Deficit | 13,670 | 12,665 | 8243 | 12,506 | 12,073 | 11,128 | 8089 | 11,001 | 10,328 | 10,048 | 14,629 | 7500 | |
| 2027–2028 | Total Installed Capacity | 53,278 | 53,278 | 53,978 | 54,223 | 54,523 | 54,523 | 54,523 | 54,523 | 54,523 | 54,523 | 54,523 | 54,523 |
| Firm Gen. Capability | 44,816 | 43,690 | 38,691 | 38,306 | 29,556 | 29,646 | 29,166 | 32,604 | 28,211 | 35,051 | 44,619 | 42,073 | |
| Peak Demand | 32,691 | 32,423 | 31,865 | 26,813 | 20,514 | 20,178 | 19,491 | 19,589 | 19,788 | 24,294 | 30,104 | 33,829 | |
| Net Surplus/Deficit | 12,125 | 11,268 | 6826 | 11,493 | 9042 | 9468 | 9675 | 13,016 | 8423 | 10,756 | 14,515 | 8244 | |
| 2028–2029 | Total Installed Capacity | 55,523 | 55,523 | 55,523 | 55,523 | 55,158 | 55,920 | 55,920 | 55,920 | 60,420 | 60,420 | 60,420 | 60,420 |
| Firm Gen. Capability | 46,405 | 42,682 | 40,430 | 39,529 | 29,299 | 31,585 | 29,907 | 30,257 | 29,269 | 37,755 | 47,842 | 45,440 | |
| Peak Demand | 34,168 | 33,888 | 33,304 | 28,024 | 21,440 | 21,089 | 20,372 | 20,473 | 20,682 | 25,392 | 31,464 | 35,457 | |
| Net Surplus/Deficit | 12,238 | 8795 | 7126 | 11,505 | 7858 | 10,496 | 9535 | 9783 | 8587 | 12,363 | 16,378 | 9983 | |
| 2029–2030 | Total Installed Capacity | 61,420 | 61,420 | 61,420 | 61,420 | 61,248 | 61,248 | 61,112 | 61,112 | 61,112 | 61,112 | 61,112 | 61,112 |
| Firm Gen. Capability | 52,104 | 50,150 | 45,587 | 41,535 | 34,237 | 34,800 | 34,072 | 33,853 | 29,238 | 36,445 | 47,340 | 45,928 | |
| Peak Demand | 35,681 | 35,388 | 34,779 | 29,265 | 22,390 | 22,023 | 21,274 | 21,380 | 21,598 | 26,516 | 32,858 | 37,129 | |
| Net Surplus/Deficit | 16,423 | 14,762 | 10,808 | 12,270 | 11,847 | 12,777 | 12,798 | 12,473 | 7641 | 9929 | 14,482 | 8799 | |
| Year | Car | 2/3 Wheeler | Bus | Truck | Total | ||||
|---|---|---|---|---|---|---|---|---|---|
| Nos. | GWh | Nos. | GWh | Nos. | GWh | Nos. | GWh | GWh | |
| 2021 | 20,000 | 28 | 100,000 | 40 | 200 | 21.02 | 200 | 9.4 | 98.42 |
| 2022 | 40,000 | 56 | 200,000 | 80 | 400 | 42.04 | 400 | 18.8 | 196.84 |
| 2023 | 60,000 | 84 | 300,000 | 120 | 600 | 63.06 | 600 | 28.2 | 295.26 |
| 2024 | 80,000 | 112 | 400,000 | 160 | 800 | 84.08 | 800 | 37.6 | 393.68 |
| 2025 | 100,000 | 140 | 500,000 | 200 | 1000 | 105.1 | 1000 | 47 | 492.1 |
| 2026 | 160,000 | 224 | 1,400,000 | 560 | 1200 | 126.12 | 1200 | 56.4 | 966.52 |
| 2027 | 220,000 | 308 | 2,300,000 | 920 | 1400 | 147.14 | 1400 | 65.8 | 1440.94 |
| 2028 | 280,000 | 392 | 3,200,000 | 1280 | 1600 | 168.16 | 1600 | 75.2 | 1915.36 |
| 2029 | 340,000 | 476 | 4,100,000 | 1640 | 1800 | 189.18 | 1800 | 84.6 | 2389.78 |
| 2030 | 400,000 | 560 | 5,000,000 | 2000 | 2000 | 210.2 | 2000 | 94 | 2864.20 |
| Year | Electric Generation Required for EVs in GWh | Electric Generation Required for EVs in MW |
|---|---|---|
| 2021 | 116 | 22 |
| 2022 | 232 | 44 |
| 2023 | 348 | 66 |
| 2024 | 463 | 88 |
| 2025 | 579 | 110 |
| 2026 | 1138 | 216 |
| 2027 | 1696 | 323 |
| 2028 | 2255 | 429 |
| 2029 | 2813 | 535 |
| 2030 | 3371 | 641 |
| Year | Electric Generation Required for EVs in GWh | Electric Generation Required for EVs in MW |
|---|---|---|
| 2021 | 30 | 6 |
| 2022 | 49 | 9 |
| 2023 | 82 | 16 |
| 2024 | 138 | 26 |
| 2025 | 233 | 44 |
| 2026 | 395 | 75 |
| 2027 | 674 | 128 |
| 2028 | 1155 | 220 |
| 2029 | 1988 | 378 |
| 2030 | 3435 | 654 |
| Year | Car | 2/3 Wheeler | Bus | Truck | Total | ||||
|---|---|---|---|---|---|---|---|---|---|
| Nos. | GWh | Nos. | GWh | Nos. | GWh | Nos. | GWh | GWh | |
| 2021 | 5000 | 7 | 25,000 | 10 | 50 | 5.26 | 50 | 2.32 | 24.61 |
| 2022 | 8150 | 11.41 | 45,000 | 18 | 76 | 7.94 | 76 | 3.55 | 40.89 |
| 2023 | 13,285 | 18.6 | 81,000 | 32.4 | 114 | 11.98 | 114 | 5.36 | 68.34 |
| 2024 | 21,654 | 30.32 | 145,800 | 58.32 | 172 | 18.09 | 172 | 8.09 | 114.82 |
| 2025 | 35,296 | 49.41 | 262,440 | 104.98 | 260 | 27.32 | 260 | 12.22 | 193.93 |
| 2026 | 57,532 | 80.54 | 472,392 | 188.96 | 393 | 41.25 | 393 | 18.45 | 329.2 |
| 2027 | 93,777 | 131.29 | 850,306 | 340.12 | 593 | 62.29 | 593 | 27.86 | 561.56 |
| 2028 | 152,856 | 214 | 1,530,550 | 612.22 | 895 | 94.06 | 895 | 42.06 | 962.34 |
| 2029 | 249,156 | 348.82 | 2,754,990 | 1102.00 | 1351 | 142.03 | 1351 | 63.52 | 1656.36 |
| 2030 | 406,124 | 568.57 | 4,958,982 | 1983.59 | 2041 | 214.47 | 2041 | 95.91 | 2862.54 |
Publisher’s Note: MDPI stays neutral with regard to jurisdictional claims in published maps and institutional affiliations. |
© 2022 by the authors. Licensee MDPI, Basel, Switzerland. This article is an open access article distributed under the terms and conditions of the Creative Commons Attribution (CC BY) license (https://creativecommons.org/licenses/by/4.0/).
Share and Cite
Unar, N.A.; Mirjat, N.H.; Aslam, B.; Qasmi, M.A.; Ansari, M.; Lohana, K. Modeling and Analysis of Load Growth Expected for Electric Vehicles in Pakistan (2021–2030). Energies 2022, 15, 5426. https://doi.org/10.3390/en15155426
Unar NA, Mirjat NH, Aslam B, Qasmi MA, Ansari M, Lohana K. Modeling and Analysis of Load Growth Expected for Electric Vehicles in Pakistan (2021–2030). Energies. 2022; 15(15):5426. https://doi.org/10.3390/en15155426
Chicago/Turabian StyleUnar, Naveed Ahmed, Nayyar Hussain Mirjat, Bilal Aslam, Muneer Ahmed Qasmi, Maha Ansari, and Kush Lohana. 2022. "Modeling and Analysis of Load Growth Expected for Electric Vehicles in Pakistan (2021–2030)" Energies 15, no. 15: 5426. https://doi.org/10.3390/en15155426
APA StyleUnar, N. A., Mirjat, N. H., Aslam, B., Qasmi, M. A., Ansari, M., & Lohana, K. (2022). Modeling and Analysis of Load Growth Expected for Electric Vehicles in Pakistan (2021–2030). Energies, 15(15), 5426. https://doi.org/10.3390/en15155426