Article

Designing Harvesting and Hauling Cost Models for Energy Cane Production for Biorefineries

Department of Agricultural and Environmental Sciences, Tennessee State University, Nashville, TN 37209, USA
*
Author to whom correspondence should be addressed.
Energies 2022, 15(15), 5403; https://doi.org/10.3390/en15155403
Submission received: 29 March 2022 / Revised: 17 July 2022 / Accepted: 20 July 2022 / Published: 26 July 2022

Abstract

:
The harvesting and hauling operations of bioenergy feedstock is an important area in biofuel production. Production costs can be minimized by maintaining optimal machinery units for these operations. The objective of this study is to design an optimal harvesting unit for bioenergy refinery and estimate harvesting and hauling costs of energy cane. A biorefinery with the annual capacity of processing twenty-five million imp. gallons of ethanol were considered. Given the efficiency of harvesting, a two-row soldier system was considered. Considering the year-round supply of energy cane to the refinery, the optimal machinery unit was designed, and the combined operation costs were derived. The average estimated ownership, repair, labor and fuel and lubricant costs of biomass harvest unit were calculated to be $0.50, $0.54, $1.78 and $1.51/mt, respectively. The costs distribution generated showed harvesting and hauling costs could range between $5.47–$9.23/mt of energy cane. The methodology and the research output will provide guidelines for investors in designing harvesting and hauling units and estimating costs for different scales of operation.

1. Introduction

Biomass resources have greater potential to increase energy security in regions with inadequate fossil fuel reserves, improve the supplies of fuel transportation and maintain a stable environment by decreasing net emissions of carbon into the atmosphere [1,2,3,4]. The availability and potentiality of biomass are dependent on a wide range of factors, such as land availability, technological conversion, environmental changes, and competition with food production [5]. Among a variety of candidate crops, energy cane has recently gained popularity as a bioethanol feedstock [6,7,8,9,10]. Energy cane has a stronger energy balance than other competing crops due to its low input requirements, adaptability, and exceptional biological productivity [11,12]. Energy cane (Saccharum spp.) is a hybrid between commercial sugarcane lines and wild sugarcane (Saccharum spontaneum L.) that has been developed and cultivated primarily for the purpose of using biomass as a fuel [13,14]. It has a lower sugar concentration than commercial sugarcane cultivars but a higher cold tolerance, allowing for a broader growing zone in the southeastern United States [15,16,17,18]. Energy cane dry matter yields have ranged from 8 to 53 Mg/ha year−1 in the southeastern United States, depending on location, cultivar, years after planting, number of annual cuttings, and input amounts [19,20,21]. When grown in the tropics and subtropics, energy cane is a promising feedstock for biomass production and could play a significant role as a bioenergy crop, even though there are environmental interactions between biomass production and risks that must be assessed [10,16].
The southeastern Regional Biomass Research Center (RBRC) is working to produce high-performing herbaceous feedstocks such as energy cane and other subtropical/tropical perennial grasses [22,23,24]. The recent use of biomass for energy production has grown in the past years, specifically in developed countries as well [25,26,27]. Global interest is shown in the opportunities that bioenergy presents, especially in the sustainable development of more modern and efficient bioenergy production systems. However, this has increased the forecasts and energy needs in many developed countries even though all evidence points to the biomass potential, and domestic biofuel production capacity will be insufficient to meet the energy needs of these countries [28].
Agricultural input use and production costs are important for biomass production decisions as well as a research tool to analyze the farm economy [29]. One of the major challenges facing industrial biofuel production is the production costs of feedstock [30]. Harvesting and transportations operations are important in maintaining the economic viability of bioenergy production [31,32,33]. Due to operational risk, high input costs, price fluctuations, etc., producers find it difficult to increase profit and to remain sustainable. Among the agricultural production costs, machinery is a major cost item. For example, development of new machineries, technological development, and fluctuating energy prices have caused farm machinery and power costs to increase in recent times. The operators need to make smarts decisions about acquiring, operating and maintaining machinery to minimize costs. An accurate estimate of the costs of owning and operating farm machinery is helpful in making best decisions. Therefore, a development of a methodology to estimate machinery costs for harvesting and hauling operations would be useful for producers in estimating costs in the absence of detailed farm survey data. The objective of this paper is to design a harvesting and hauling unit for a representative biorefinery and estimate the associated costs. The structure of the paper is designed as follows. In the next section, the data and the estimation procedures are described, then the estimated results are presented, and, finally, the conclusions of the research are highlighted.

2. Materials and Methods

Biomass production from energy cane was considered for the analysis. There are two types of herbaceous biofuel feedstocks, namely thick-stemmed species such as energy cane and thin-stemmed species, hence different types of machines are required for harvesting. Basically, two methods are available for handling high moisture crops, namely a direct cut system and a wilting system [34]. The harvesting and hauling designed for costs estimated here are for feedstock supply for an ethanol plant with a 25-million-gallon annual capacity.
It is assumed that harvesting and hauling operations of thick stem biomass such as energy cane are similar to sugarcane. For example, sugarcane harvesting is done by two types of mechanical harvesters, namely combine harvesters and whole stalk harvesters. The combine harvester is popular in Australia and the states of Florida and Texas in the USA. The whole stalk harvesting system is the predominant method of harvesting in Louisiana [35]. However, in a combine harvester, the hours of combine operations needed to harvest a given amount of acreage is about twice the time required for a soldier harvester [36]. Therefore, a two-row soldier harvester was considered for efficient harvesting of energy cane. A soldier harvester can harvest around 90–140 mt [35]. The two-row loader machine was taken for loading the harvested biomass for both systems. The average capacity of the two-row loader is 75 mt/h. There are two choices for transporting harvested biomass. Biomass can be directly transported to the processing facility using direct wagons. The other option is to bring the harvested biomass to the on-farm facility using transfer wagons. The average capacity of transfer or direct wagon is 10 mt. The stored biomass is loaded into truck trailers using a transloader and transported to the refinery. A transloader has the capacity to load around 100 mt/h, while truck trailers have the capacity of 28 mt (Figure 1).
The following assumptions [35,36] were made in estimating applicable costs. The average annual biomass yield of energy cane was 66.12 mt/ha. For energy cane, line up time in the field for transfer and direct wagon is assumed to be 8 min. Distance to the transfer site and to the processing site was assumed to be 0.5 and 5 km, respectively. Waiting time to unload for transfer and direct wagon at the loading site was assumed to be 8 min. Queuing time at the loading site was assumed to be 8 min, while queuing and unloading time at the mill was assumed to be 15 min. The number of working hours per day was assumed to be 8 h. It is assumed that half of the daily harvested biomass is directly transported to the processing plant while the rest of the harvested product is transported to the transloading site at the farm.
Details of machine specifications (hp, purchasing costs, age, salvage value factor, fuel and lubrication factors, etc.) needed for the analysis were gathered from published data [37,38,39,40]. The harvesting and hauling cost model were based on the economic engineering approach [39].
Energy cane Harvesting and Hauling Costs (HHCi) is a function of Ownership Cost of Machinery (OCM), Fuel Cost (Fuel), Lubrication Cost (Lubri), Repair Cost (Repair), and Operating Labor Cost (OL).
  • HHCi = OCMi + Fueli + Lubrii + Repairi + OLi
  • OCMi = capital recovery + TIH
  • capital recovery = (total depreciation × capital recovery factor) + (salvage value × interest rate)
  • total depreciation = initial costs of machinery − salvage value
  • capital recovery factor = 0.13
  • salvage value = initial costs of machinery × salvage value factor (0.3)
  • TIH = Taxes, Insurance & Housing = 0.01 × purchase price
  • Fueli (Average diesel consumption per hour) = diesel consumption factor (0.044) × maximum horsepower
  • Lubrii =lubrication factor (0.15) × Average cost for fuel consumption
  • Repairi = repair cost factor (0.03) × purchase price
The labor cost include costs for harvesting and hauling.
  • Labori = labor cost for the harvest unit + labor cost for transportation
Specific data and the estimation procedures are elaborated under the respective tables under the results and discussion for better visualization.

3. Results

3.1. Energy Cane Feedstock Requirement

The estimated farm size and the total feedstock requirement for the continuous supply of energy cane for the operation of a biorefinery with an annual capacity of 25 million gallons is given in Table 1. Based on the assumption that there are 300 operational days of the plant, the daily ethanol production was 83,333 imperial gallons (imp gal). The annual supply of feedstock for the ethanol plant with the above capacity requires 4726 ha of energy cane field. The total energy cane requirement and area needed to be harvested on a daily basis were 1042 mt and 15.75 ha, respectively.

3.2. Harvesting Unit

Table 2 shows the number of machines needed per day for harvesting and loading. The estimated numbers of machines needed were based on the total hours needed for daily harvest and the number of working hours/days. Accordingly, two harvesters are needed to harvest the biomass yield to be harvested daily assuming an 8-h workday schedule. To load the harvested biomass, two two-row loaders are needed. Also, a single transloader is needed to handle the daily biomass arriving at the transloading center.

3.3. Hauling Unit

The total number of wagons and trucks with trailers needed to effectively transport daily harvested biomass was estimated based on total daily travel time needed to transport the biomass. Based on an 8-h working day, approximately three transfer wagons, five direct wagons, and four trucks with trailers are needed to transport the daily harvested energy cane to the biorefinery (Table 3 and Table 4).

3.4. Ownership and Operation Costs of Harvesting and Hauling

The details of estimated costs are presented under several sub-categories namely machinery ownership, accumulated repair and maintenance, machinery operating labor, fuel and lubricant.

3.4.1. Machinery Ownership

The breakdown of ownership costs for harvesting and hauling units is given in Table 5. In order to estimate the ownership costs, salvage values were estimated based on current list price of each piece of machinery and the remaining value factor [21]. The estimated salvage value was used to estimate the depreciation cost of each machine. Total ownership costs were based on estimated total depreciation, capital recovery, and taxes. Accordingly, the estimated total ownership costs of machinery were $0.50/mt of energy cane. The most ownership costs occur for two-row soldier harvesters and two-row loaders due to higher initial costs.

3.4.2. Accumulated Repair and Maintenance

The estimated accumulated repair costs are given in Table 6. Estimated hours used by each machinery are the total machinery hours to be used during the life cycle of the machine. Accumulated repair cost/h of machine use was based on the total accumulated repair cost during the life of the machine and the estimated hours used for the machine during its lifetime. Accordingly, the repair costs account for $0.37/mt of energy cane.

3.4.3. Operating Labor

The estimated total labor costs for harvesting and transportation of each machine is given in Table 7. Annual use hours per machine were based on the total days for harvest and working h/day. Total machine h/ha was based on estimated total machine hours and the area to be harvested. Accordingly, the estimated total labor costs were $2.31/mt of energy cane.

3.4.4. Fuel and Lubricants

The estimated fuel and lubricant costs were $0.97/m and $0.15/mt, respectively. Accordingly, the total estimated costs for fuel and lubrication were $1.11/mt of energy cane (Table 8).
The summary of the estimated costs of harvesting and the hauling unit is given in Figure 2 and Figure 3. Figure 2 shows annual costs, while Figure 3 shows costs/mt. The ownership costs can be categorized as fixed costs, while repair, labor and fuel & lubricant costs can be classified under variable costs. Accordingly, variable costs incur higher costs ($3.82/mt) compared to the ownership costs (0.50/mt) which is the case in crop production. The total estimated costs of machinery for harvesting and hauling units were $4.32/mt of energy cane.

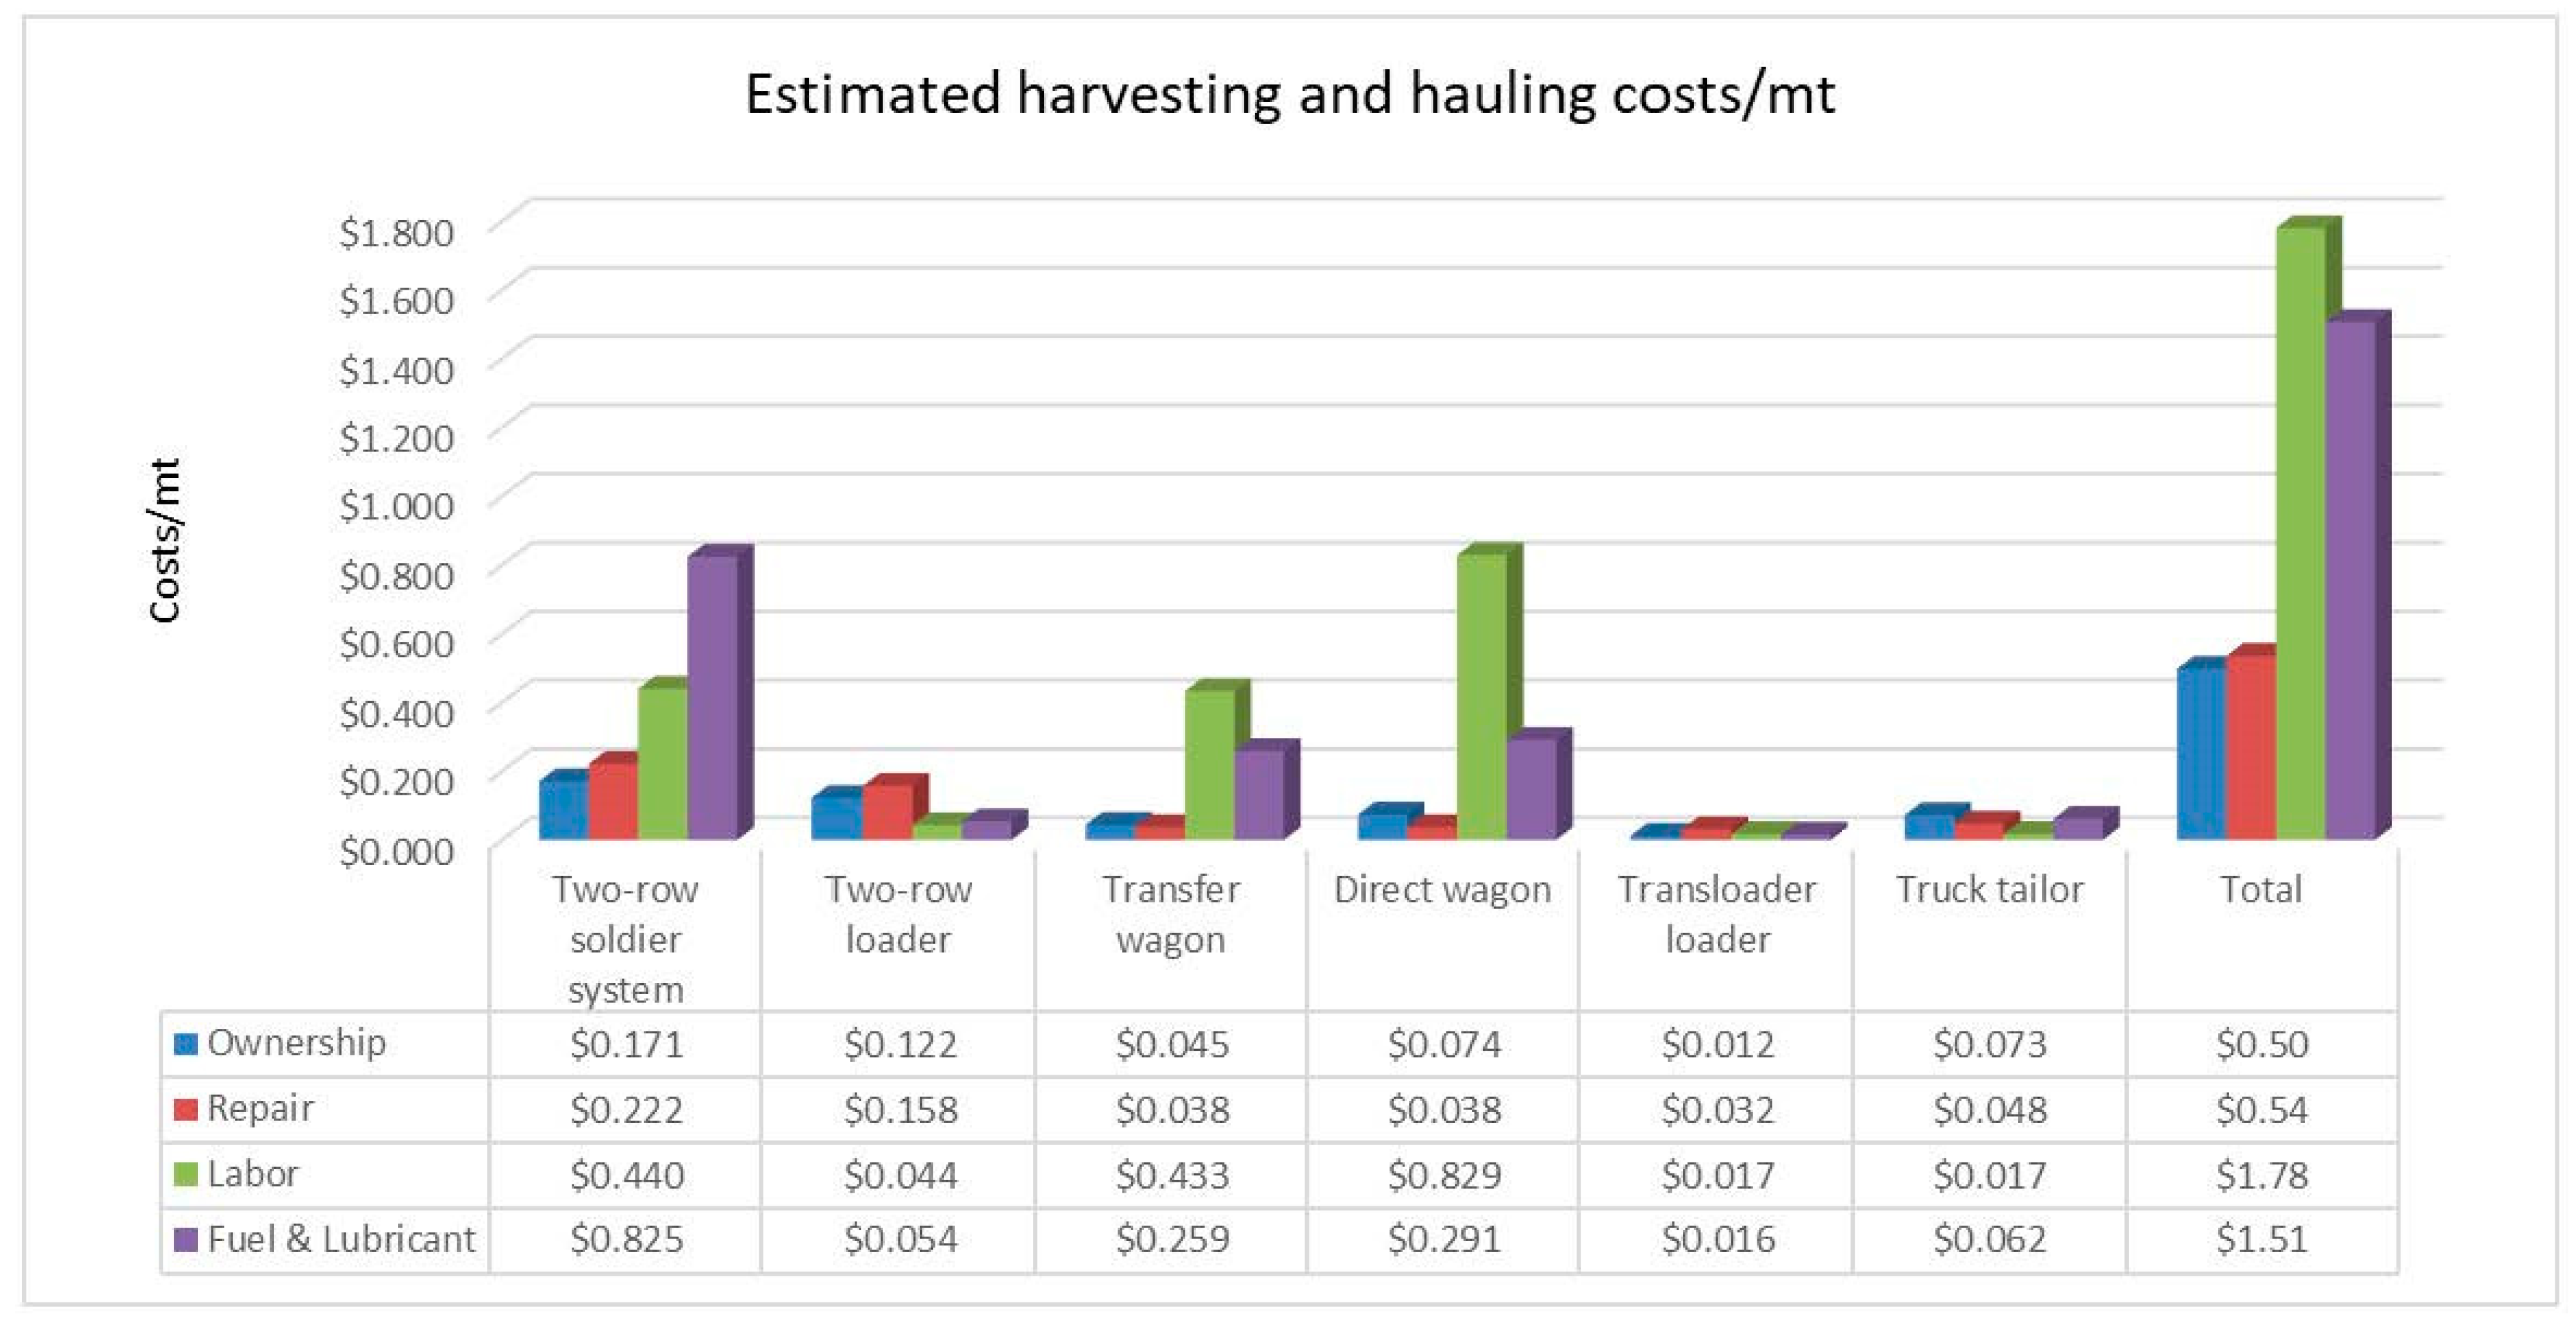
3.5. Distribution of Harvesting and Hauling Costs

To better visualize the potential range of costs, we reviewed the harvesting and hauling costs of sugarcane which is a comparable crop for energy cane. Previous estimates on sugarcane harvesting [36] showed harvesting costs range from $3.92–$9.42 range with mean costs of $6.67. We considered our estimated costs as minimum costs and generated the cost distribution based on assumptions from previous work (Figure 4). According to 90% confidence level, the harvesting and hauling costs could range from $5.47–$9.23/mt of energy cane.

4. Discussion

The results generated from this study will be useful for supply chain development for supply of biomass for ethanol biorefineries. Biorefineries can evaluate options for maintaining one’s own harvesting unit for their field operations or considering custom harvesting for biomass supply. The results will be useful for harvesting companies to determine initial capital investment, annual expenses for operation and production costs based on timing of operations. The estimated harvesting and hauling unit is specific to a biorefinery with a selected capacity, and the required machinery units may change with biomass yield, ethanol yield/mt of biomass and the days of operation annually along with the capacity of machine. A study of this nature is based on assumptions, hence any changes in assumptions may affect the estimation. The harvesting and hauling costs are sensitive to a wide range of stochastic factors including type of machinery (capacity, power, initial costs etc.), travel time and distance, working hours, waiting time, labor wages, fuel and lubricant prices etc. We generated the potential distribution of costs by analyzing sugarcane harvesting and hauling costs. However, a detailed sensitivity analysis is useful in evaluating costs under various scenarios given risk and uncertainty, hence we highlight the importance of performing a sensitivity analysis in a similar study. A sensitivity analysis would be useful to identify how the results can be applicable to other scenarios such as different local/economic situations.

5. Conclusions

A supply of feedstock to an industrial bioenergy refinery with the processing capacity of 25 million imp gal of ethanol was considered in this research. To supply energy cane, an area of 4746 ha is needed. The machinery units required for the continuous harvest and supply of energy cane were assessed, and the cost analysis was performed. The average estimated ownership, repair, labor and fuel and lubricant costs of biomass harvest units were calculated to be $0.50, $0.54, $1.78 and $1.51/ mt, respectively. The simulation results show that costs distribution (95% CI) could range between $5.47–$9.23/mt of energy cane. Currently, the commercial production of biomass sorghum in the southeastern region is at early stage, hence the research output will provide vital information for the feedstock development initiative. The research findings may help to identify and design machinery units for harvesting biomass with lower costs. The study findings can also be used in evaluating investment costs for designing harvesting and hauling units for different scales of operation. The new investment opportunities in the biomass harvesting and hauling operations will likely provide new revenue generation and employment opportunities that would bring additional economic impact to local and the regional economies.

Author Contributions

Conceptualization, P.I.; model, P.I.; methodology, P.I.; data, P.I., F.Y. and K.N.; formal analysis, P.I., writing original draft preparation, P.I., F.Y. and K.N.; writing, review, and editing, P.I., F.Y. and K.N.; project administration, P.I. All authors have read and agreed to the published version of the manuscript.

Funding

This research was funded by the US Department of Energy (DOE), grant number DE-EE0008522.

Institutional Review Board Statement

Not applicable.

Informed Consent Statement

Not applicable.

Data Availability Statement

Not applicable.

Conflicts of Interest

The authors declare no conflict of interest.

References

  1. Field, C.B.; Campbell, J.E.; Lobell, D.B. Biomass energy: The scale of the potential resource. Trends Ecol. Evol. 2008, 23, 65–72. [Google Scholar] [CrossRef] [PubMed]
  2. Abdul Malek, A.B.M.; Hasanuzzaman, M.; Rahim, N.A. Prospects, progress, challenges and policies for clean power generation from biomass resources. Clean Technol. Environ. Policy 2020, 22, 1229–1253. [Google Scholar] [CrossRef]
  3. Bhutto, A.W.; Bazmi, A.A.; Karim, S.; Abro, R.; Mazari, S.A.; Nizamuddin, S. Promoting sustainability of use of biomass as energy resource: Pakistan’s perspective. Environ. Sci. Pollut. Res. 2019, 26, 29606–29619. [Google Scholar] [CrossRef] [PubMed]
  4. Gutiérrez, A.S.; Eras, J.J.C.; Huisingh, D.; Vandecasteele, C.; Hens, L. The current potential of low-carbon economy and biomass-based electricity in Cuba. The case of sugarcane, energy cane and marabu (Dichrostachys cinerea) as biomass sources. J. Clean. Prod. 2018, 172, 2108–2122. [Google Scholar] [CrossRef]
  5. Burg, V.; Bowman, G.; Erni, M.; Lemm, R.; Thees, O. Analyzing the potential of domestic biomass resources for the energy transition in Switzerland. Biomass Bioenergy 2018, 111, 60–69. [Google Scholar] [CrossRef]
  6. Rooney, W.L.; Blumenthal, J.; Bean, B.; Mullet, J.E. Designing sorghum as a dedicated bioenergy feedstock. Biofuels Bioprod. Biorefining 2007, 1, 147–157. [Google Scholar] [CrossRef]
  7. Tew, T.L.; Cobill, R.M.; Richard, E.P. Evaluation of sweet sorghum and sorghum sudan grass hybrids as feedstocks for ethanol production. Bioenergy Res. 2008, 1, 147–152. [Google Scholar] [CrossRef]
  8. Xie, G.H. Progress and direction of non-food biomass feedstock supply research and development in China. J. Chin. Agr. Univ. 2012, 17, 1–19. [Google Scholar]
  9. Ayodele, B.V.; Alsaffar, M.A.; Mustapa, S.I. An overview of integration opportunities for sustainable bioethanol production from first-and second-generation sugar-based feedstocks. J. Clean. Prod. 2020, 245, 118857. [Google Scholar] [CrossRef]
  10. Salassi, M.E.; Brown, K.; Hilbun, B.M.; Deliberto, M.A.; Gravois, K.A.; Mark, T.B.; Falconer, L.L. Farm-scale cost of producing perennial energy cane as a biofuel feedstock. Bioenergy Res. 2014, 7, 609–619. [Google Scholar] [CrossRef] [Green Version]
  11. Yu, J.; Zhang, X.; Tan, T. Ethanol production by solid state fermentation of sweet sorghum using thermotolerant yeast strain. Fuel Process. Technol. 2008, 89, 1056–1059. [Google Scholar] [CrossRef]
  12. Huang, J.; Khan, M.T.; Perecin, D.; Coelho, S.T.; Zhang, M. Sugarcane for bioethanol production: Potential of bagasse in Chinese perspective. Renew. Sustain. Energy Rev. 2020, 133, 110296. [Google Scholar] [CrossRef]
  13. Chynoweth, D.P.; Turick, C.E.; Owens, J.M.; Jerger, D.E.; Peck, M.W. Biochemical methane potential of biomass and waste feed- stocks. Biomass Bioenergy 1993, 5, 95–111. [Google Scholar] [CrossRef]
  14. Grassi, M.C.B.; Pereira, G.A.G. Energy-cane and RenovaBio: Brazilian vectors to boost the development of Biofuels. Ind. Crops Prod. 2019, 129, 201–205. [Google Scholar] [CrossRef]
  15. Fedenko, J.; Erickson, J.E.; Florida, A. Biomass Production and Composition of Perennial Grasses Grown for Bioenergy in a Subtropical Climate Across Florida, USA. BioEnergy Res. 2013, 6, 1082–1093. [Google Scholar] [CrossRef]
  16. Leon, R.G.; Gilbert, R.A.; Comstock, J.C. Energycane (Saccharum spp. × Saccharum spontaneum L.) Biomass Production, Reproduction, and Weed Risk Assessment Scoring in the Humid Tropics and Subtropics. Agron. J. 2015, 107, 323–329. [Google Scholar] [CrossRef]
  17. Langholtz, M.H.; Stokes, B.J.; Eaton, L.M. USDOE 2016 Billion-Ton Report: Advancing Domestic Resources for a Thriving Bioeconomy; Volume 1: ORNL/TM- 2016/160; Economic availability of feedstock; Oak Ridge National Laboratory: Oak Ridge, TN, USA, 2016. Available online: https://energy.gov/ (accessed on 16 January 2022).
  18. Lee, D.K.; Aberle, E.; Anderson, E.K.; Anderson, W.; Baldwin, B.S.; Baltensperger, D.; Owens, V. Biomass production of herbaceous energy crops in the United States: Field trial results and yield potential maps from the multiyear regional feedstock partnership. GCB Bioenergy 2018, 10, 698–716. [Google Scholar] [CrossRef]
  19. Bischoff, K.P.; Gravois, K.A.; Reagan, T.E.; Hoy, J.W.; Kimbeng, C.A.; LaBorde, C.M.; Hawkins, G.L. Registration of ‘L 79-1002’ sugarcane. J. Plant Regist. 2008, 2, 211–217. [Google Scholar] [CrossRef]
  20. Knoll, J.E.; Anderson, W.F.; Strickland, T.C.; Hubbard, R.K.; Malik, R. Low-input production of biomass from perennial grasses in the coastal plain of Georgia, USA. Bioenerg. Res. 2012, 5, 206–214. [Google Scholar] [CrossRef] [Green Version]
  21. Woodard, K.R.; Prine, G.M. Dry matter accumulation of elephant grass, energy cane, and elephant millet in a subtropical climate. Crop. Sci. 1993, 33, 818–824. [Google Scholar] [CrossRef]
  22. Mitchell, R.B.; Schmer, M.R.; Anderson, W.F.; Jin, V.; Balkcom, K.S.; Kiniry, J.; Coffin, A.; White, P. Dedicated energy crops and crop eesidues for bioenergy feedstocks in the central and eastern USA. Bioenergy Res. 2016, 9, 384–398. [Google Scholar] [CrossRef] [Green Version]
  23. Perry, A.; Kaplan, J.K. ARS and the Regional Biomass Research Centers. Agric. Res. 2012, 60, 4. [Google Scholar]
  24. Steiner, J.J.; Buford, M.A. The origin of the USDA regional biomass research centers. Bioenergy Res. 2016, 9, 379–383. [Google Scholar] [CrossRef] [Green Version]
  25. Proskurina, S.; Junginger, M.; Heinimö, J.; Tekinel, B.; Vakkilainen, E. Global biomass trade for energy—Part 2: Production and trade streams of wood pellets, liquid biofuels, charcoal, industrial roundwood and emerging energy biomass. Biofuels Bioprod. Biorefining 2019, 13, 371–387. [Google Scholar] [CrossRef]
  26. Tursi, A. A review on biomass: Importance, chemistry, classification, and conversion. Biofuel Res. J. 2019, 6, 962–979. [Google Scholar] [CrossRef]
  27. Umar, M.; Ji, X.; Kirikkaleli, D.; Alola, A.A. The imperativeness of environmental quality in the United States transportation sector amidst biomass-fossil energy consumption and growth. J. Clean. Prod. 2021, 285, 124863. [Google Scholar] [CrossRef]
  28. Junginger, M.; Goh, C.S.; Faaij, A. (Eds.) International bioenergy trade. In History, Status Outlook on Securing Sustainable Bioenergy Supply, Demand and Markets; Springer: Dordrecht, The Netherlands, 2014. [Google Scholar]
  29. Chiang, S. “Cost of Production.” UH Agribusiness Incubator Program. 2013. Available online: http://www.ctahr.hawaii.edu/sustainag/news/articles/V16-Chiang-COP.pdf (accessed on 16 January 2022).
  30. Aui, A.; Wang, Y.; Mba-Wright, M. Evaluating the economic feasibility of cellulosic ethanol: A meta-analysis of techno-economic analysis studies. Renew. Sustain. Energy Rev. 2021, 145, 111098. [Google Scholar] [CrossRef]
  31. Soha, T.; Papp, L.; Csontos, C.; Munkácsy, B. The importance of high crop residue demand on biogas plant site selection, scaling and feedstock allocation–A regional scale concept in a Hungarian study area. Renew. Sustain. Energy Rev. 2021, 141, 110822. [Google Scholar] [CrossRef]
  32. Thorsell, S.; Epplin, F.M.; Huhnke, R.L.; Taliaferro, C.M. Economics of a coordinated biorefinery feedstock harvest system: Lignocellulosic biomass harvest cost. Biomass Bioenergy 2004, 27, 327–337. [Google Scholar] [CrossRef]
  33. Scordia, D.; Cosentino, S.L. Perennial energy grasses: Resilient crops in a changing European agriculture. Agriculture 2019, 9, 169. [Google Scholar] [CrossRef] [Green Version]
  34. Turhollow, A.; Downing, M.; Butler, J. The Cost of Silage Harvest and Transport Systems for Herbaceous Crops; Oak Ridge National Laboratory: Oak Ridge, TN, USA, 1996. Available online: http://bioenergy.ornl.gov/papers/bioen96/turhllw.html (accessed on 5 February 2022).
  35. Salassi, M.; Champagne, L. A spreadsheet-based cost model for sugarcane harvesting systems. Comput. Electron. Agric. 1998, 20, 215–227. [Google Scholar] [CrossRef]
  36. Barker, F.G. An Economic Evaluation of Sugarcane Combine Harvester Costs and Optimal Harvest Schedules for Louisiana. Master’s Theses, Louisiana State University, Baton Rouge, LA, USA, 2007; p. 221. Available online: https://digitalcommons.lsu.edu/gradschool_theses/221 (accessed on 5 February 2022).
  37. Lazarus. Machinery Costs Estimated. University of Minnesota. 2021. Available online: https://wlazarus.cfans.umn.edu/william-f-lazarus-farm-machinery-management (accessed on 16 January 2022).
  38. Edwards, W. Estimating Farm Machinery Costs. Ag Decision Maker. Iowa State University Extension. 2015. Available online: https://www.extension.iastate.edu/agdm/crops/pdf/a3-29.pdf (accessed on 12 January 2022).
  39. Schnitkey, G.; Lattz, D. Machinery Costs Estimate summary. University of Illinois at Urbana Champaign. 2021. Available online: https://farmdoc.illinois.edu/wp-content/uploads/2019/08/machinery-cost-estimates_summary.pdf (accessed on 16 January 2022).
  40. Deliberto, A.; Hilbun, B.M. Projected costs and returns crop enterprise bugets. In Sugarcane Production Costs in Lousiana; Agricultural Economics Information Report Series No. 354; Lousiana State University Agricultural Center: Baton Rouge, LA, USA, 2022; Available online: https://www.lsuagcenter.com/~/media/system/c/3/7/6/c376546954a0ea8e2a04fdac2bfe422f/2022%20sugar%20enterprise%20budgets%20finalpdf.pdf (accessed on 2 March 2022).
Figure 1. Energy cane harvesting and hauling unit (adopted from sugarcane harvesting system, 36).
Energies 15 05403 g001
Figure 2. Summary of costs to operate a harvesting and hauling unit/year of energycane.
Energies 15 05403 g002
Figure 3. Summary of costs to operate a harvesting and hauling unit/mt of energycane.
Energies 15 05403 g003
Figure 4. Distribution of transportation and hauling costs of energycane.
Energies 15 05403 g004
Table 1. Minimum area needed for daily harvesting for continuous supply of energycane for biorefinery.
CategoryValue
Yield (MT/ha)66.12
Ethanol yield (imp gal/mt)80.00
Ethanol yield (imp gal/mt/year)5289.80
Total Ethanol yield per farm (imp gal)25,000,000
Plant Capacity (imp gal)25,000,000
Days of operation per year300
Daily capacity83,333
Total cane yield needed (mt)312,500
Energycane needed per day (mt)1042
Farm size (ha)4726
Minimum area needed to harvest (ha/day)15.75
Table 2. Estimated number of harvesters and loading machine requirements for energycane.
MachineryCapacity (mt/h)Av.Capacity (mt/h)Average Farm Yield (mt/ha)Harvest Capacity (ha/h)Max. Potential Daily Harvest ha 1Actual Daily Harvest AreaActual Machine Hours Needed per dayTotal Daily Harvest (MT)Total Farm Size (ha)Total Machine Use h/year 2Total Hours for Harvesting per DayNo of Machines Needed per Day 3
Two-row soldier harvester90–14081.8266.121.249.9015.7512.7310424726381912.732
Two-row loader75.0068.1866.121.038.2515.7515.2810424726458315.282
Transloader loader100.0090.9166.121.3711.0015.7511.4610424726343711.461
1 Based on 8 h/day schedule. 2 Machine h/day × 300 working days/year. 3 Rounded to the nearest integer.
Table 3. Estimated number of wagons for transportation of harvested biomass.
MachineryWaiting Time to Unload (min)Total TripsTotal Waiting TimeWaiting Time (h)Overall Waiting Time in the Field and Loading SiteTotal Travel Time (h)Total Time (Q&T): hWorking hour/dayWagons Needed 1
Transfer wagon8.0095.49763.8912.7320.694.3725.058.003
Direct wagon8.0095.49763.8912.7320.6927.2847.979.005
1 Rounded to the nearest integer.
Table 4. Estimated number truck trailers for transportation of harvested biomass.
MachineryQueuing Time (min) 1No of Trailer LoadsTotal
Queuing Time (h) 2
Total Round Trip km 3Time per Round Trip (h) 4Total Travel Time (h)Queuing/Unloading at Mill (min)Total Unloading Time (h) 5Total Operation Time (h) 6Daily Work HoursTotal Truck Tailor Needed 7
Truck with tailor8.0040.95.5409.230.4016.3715.0010.2332.068.004
1 Queuing time at the loading site. 2 Total queuing time = queuing time × no of trailer loads = 327.4 min = 5.5 h. 3 Total round trip travelled = no of trailer loads × round trip per load (10 km) = 409 km. 4 Time per round trip = distance for a round trip (10 km)/tractor speed (25 km/h). 5 Total unloading time = total trips (40.9) × queuing and unloading time (15 min/trip) = 614 min (10.23 h). 6 Total operation time = total queuing time + total travel time + unloading time. 7 Rounded to the nearest integer.
Table 5. Estimated ownership costs of machinery in harvesting and hauling unit.
MachineryHPInitial CostSalvage Value Factor Salvage Value 1Total Depreciation 2Capital Recovery Factor Interest RateCapital Recovery 3Total Taxes 4Total Ownership Costs ($/Year) 5Total Ownership Costs/mt
Two-row soldier system350$231,0000.3$69,300$161,7000.130.05$24,486$2310$53,552$0.17
Two-row loader220$165,0000.3$49,500$115,5000.130.05$17,490$1650$38,280$0.12
Transfer wagon175$40,0000.3$12,000$28,0000.130.05$4240$400$13,920$0.05
Direct wagon175$40,0000.3$12,000$28,0000.130.05$4240$400$23,200$0.07
Trans loader loader85$33,0000.3$9900$23,1000.130.05$3498$330$3828$0.01
Truck trailer160$49,5000.3$15,345$34,1550.130.05$5207$495$22,810$0.07
1 Salvage value = initial costs of machinery × salvage value factor. 2 Total depreciation = initial costs of machinery − salvage value. 3 Capital recovery = (Total depreciation × capital recovery factor) + Total depreciation × (interest rate). 4 Total taxes = initial costs of machinery × 1%. 5 Total ownership costs = (capital recovery + taxes) × no of machines needed.
Table 6. Estimated repair costs of machinery.
MachineryHPInitial CostAnnual Use (h)Age (Year)Repair Costs Factor Accumulated Repair Cost 1Repair Cost/YearRepair Costs/hRepair Costs/mt
Two-row soldier system350$231,00038191230%$69,300$5775$1.51$0.0185
Two-row loader220$165,0003991030%$49,500$4950$12.40$0.0158
Transfer wagon175$40,00024001330%$12,000$923$0.38$0.0030
Direct wagon175$40,00027001030%$12,000$1200$0.44$0.0038
Transloader loader85$33,000299830%$9900$1237$4.13$0.0040
Truck trailer160$49,5006251030%$14,850$1485$2.38$0.0048
1 Accumulated repair cost = Initial cost of machinery (from Table 4) × repair costs factor.
Table 7. Total labor costs for harvesting and transportation unit.
MachineryNo of Machines NeededAnnual Use Hours per Machine 1Total Machine HoursTotal Area(ha)Machine Hours per ha 2Labor Cost
$/h
Total Labor CostsTotal Energycane Yield (MT)Cost/Mt
Two-row soldier system23819763947261.62$18$137,500312,483$0.44
Two-row loader239976247260.16$18$13,719312,483$0.04
Transfer wagon32400751647261.59$18$135,290312,483$0.43
Direct wagon5270014,39147263.05$18$259,040312,483$0.83
Transloader loader129929947260.06$18$5388312,483$0.02
Truck with trailer42400961747262.03$18$173,103312,483$0.55
1 Annual use hours per machine = total days for harvest × working h/day. 2 Total machine h/ha = area to be harvested/estimated total machine hours.
Table 8. The estimated fuel and lubricant costs for harvesting and transportation unit.
MachineryDiesel Consumption FactorAv. Fuel Consumption (imp gal/h)Diesel Cost/imp galAv Fuel Cost per HourFuel Cost/yearTotal Lubrication Cost/h 1Total Lubrication Cost/yearTotal Fuel and Lubrication Cost/yearFuel and Lubrication Costs/mt
Two-row soldier system0.04415.4$3.81$58.67$224,102$8.80$33,615$257,717$0.82
Two-row loader0.0449.68$3.81$36.88$14,718$5.53$2207$16,926$0.05
Transfer wagon0.0447.7$3.81$29.34$70,408$4.40$10,561$80,970$0.26
Direct wagon0.0447.7$3.81$29.34$79,209$4.40$11,881$91,091$0.29
Transloader loader0.0443.74$3.81$14.25$4265$2.14$639$4905$0.02
Truck with trailer0.0447.04$3.81$26.82$16,764$4.02$2515$19,279$0.06
1 Total lubrication costs on most farms average about 15% of fuel costs (lubrication factor of 0.15). Lubrication costs = 0.15 × average fuel costs/h.
Publisher’s Note: MDPI stays neutral with regard to jurisdictional claims in published maps and institutional affiliations.

