Article

Research on Method for Detecting Pipeline Blockages Based on Fluid Oscillation Theory

1
State Key Laboratory of Urban Water Resource and Environment, Harbin Institute of Technology, School of Environment, Huanghe Road No. 73, Harbin 150090, China
2
School of Energy and Architecture Engineering, Harbin University of Commerce, Xuehai Street No. 1, Harbin 150028, China
*
Author to whom correspondence should be addressed.
Energies 2022, 15(15), 5373; https://doi.org/10.3390/en15155373
Submission received: 6 June 2022 / Revised: 15 July 2022 / Accepted: 15 July 2022 / Published: 25 July 2022

Abstract

:
To address the problem of pipeline blockage detection, a mathematical model of pipeline blockage detection is established based on fluid oscillation theory. This paper proposes a governing equation of the water hammer of fluid motion in a pipeline with a blockage point, and The Dirac function is introduced for dimensionlessness and linearization. The amplitude of the harmonic of each component in different periods is expressed by a Fourier series. The blocking position can be determined by the ratio of the two-component harmonics, and the blocking magnitude can be determined by the blocking attenuation parameters of each component’s harmonics. The numerical simulation and experimental results show that the application of fluid oscillation theory to detect the location and magnitude of pipeline blockages is effective, and the accuracy of the detection method is verified, which lays a theoretical foundation for the application of the proposed method in engineering practice.

1. Introduction

The blockage of water supply pipelines will cause pressure fluctuations and leakages in pipelines, such as water supply pipelines and long-distance oil pipelines. A failure to locate the blockage position in time and take corrective action will result in a gradual increase in dirt accumulation in the pipeline. Once the pressure exceeds the maximum load of the pipeline system, the pipeline will burst, resulting in a significant economic and ecological impact on the water supply system and petrochemical industry [1,2]. In recent years, many researchers have focused on methods and technologies to achieve blockage detection in water supply pipeline systems. Fedi [3] proposed a detection method that does not assume regularly shaped blockages and that reconstructs the internal pipe area of an unconstrained form. The mathematical and physical bases of the proposed method are described, and a numerical example of a pipe with irregular blockages is considered to evaluate the performance of the method. The proposed method was shown to be more accurate and efficient than the other methods. Yan [4] investigated the interaction of transient pressure waves with the pipe wall roughness and blockages in water pipelines. The analytical expression of wave propagation in a pipeline with rough blockages was first derived using multiscale wave perturbation analysis for transient pipe flows. The results demonstrate that wave scattering is dependent on the relationship between the incident wavelength and the correlation length of the roughness blockage disorders in the pipeline. Kumar and Mohapatra [5] proposed a modified reconstructive method of characteristics (RMOCs) technique suitable for detecting multiple partial discrete and extended blockages in elastic and viscoelastic conduits. This new method can be used to evaluate the steady-state head in a pipe, which is determined as the discrete blockage parameter, and pipe area reconstruction can be employed to estimate multiple extended blockages.
Some new technologies based on transient theory for leak or crack detection are also suitable for blockage detection. Chi [6] developed a convolutional neural network (CNN)-based model to classify acoustic wave files, which are classified as an anomaly or other background or environmental noise. The wave file is an “acoustic wave file“. When a pipe leak/crack occurs, the vibration caused by discharge through the leak/crack introduces extra energy, which is recorded by a nearby accelerometer that records a 10 s acoustic wave file with a sampling rate of 4681 Hz. A field investigation is initiated if a wave file is classified as an anomaly and is not related to a scheduled event. The validations confirmed that the developed models are effective tools for water pipeline leak and crack detection. Zhang [7] derived the leak-induced reflection coefficient at the measurement point by incorporating the additional damping effect of the reflection wave propagation process along the pipeline, which was then fully validated by method of characteristic (MOC)-based numerical and experimental laboratory applications. The obtained results were characterized by a dominance analysis to explore the importance ranking of different dimensionless factors to the leak-induced reflection coefficient in pipeline systems.
Wan et al. [8] proposed a numerical model for detecting the partial blockage of a closed conduit. This method determines the location and relative intensity of partial blockages by comparing the maximum pressure of the pipeline when a water hammer occurs. The model proposed in this paper for the detection of partial blockages is mainly to analyze the maximum value of water hammer pressure from the perspective of the time domain, which is more effective in qualitative analysis. The proposed method for detecting blockages is based on the frequency domain analysis of the location and magnitude of the blockage, which has certain advantages in terms of quantification. To investigate the features of incipient cracks and their effects on water supply running conditions, Zhang and Wan [9] built an experimental platform. The elemental features of incipient cracks were identified from the experiments, and a numerical simulation model was established accordingly. The results also showed that the crack scale and location had significant effects on the water hammer intensity. They [10] continued to conduct more research on the diagnosis of incipient cracks, and the results revealed more features of the interactions among multiple cracks and in-pipe turbulence. Based on these findings, they also proposed a type of transient feature-based diagnostic method to detect and predict the location of incipient cracks, which could realize a significant reduction in costs for pipeline maintenance compared to traditional methods.
The most effective strategy to be employed for blocking control is to detect the location and magnitude of blockages [11]. Based on the theory of hydraulic transient flow and the theory of fluid oscillation, this study proposes a model for detecting the location and magnitude of blockages in oil pipelines. Using the theory of fluid oscillation, the governing equation of the pipeline with blockages was established, and an analytical solution was then obtained. The results were analyzed using a Fourier series to realize the quantitative detection of pipeline blockages. The experimental results verify the feasibility of the theoretical model and provide a practical basis for solving future practical engineering problems.

2. Mathematical Model of Single Tube with Blockage

Fluid oscillation implies that the action time of external excitations is short [12]. After the vibration stops, the disturbance of the system gradually dissipates, and the system eventually returns to a steady state. If there is a blockage in the pipeline, the attenuation parameters are markedly different from those of the system without blockage after excitation [13]. This study makes use of this difference to analyze the attenuation parameters caused by pipe blockages and to determine the state of a pipe blockage.

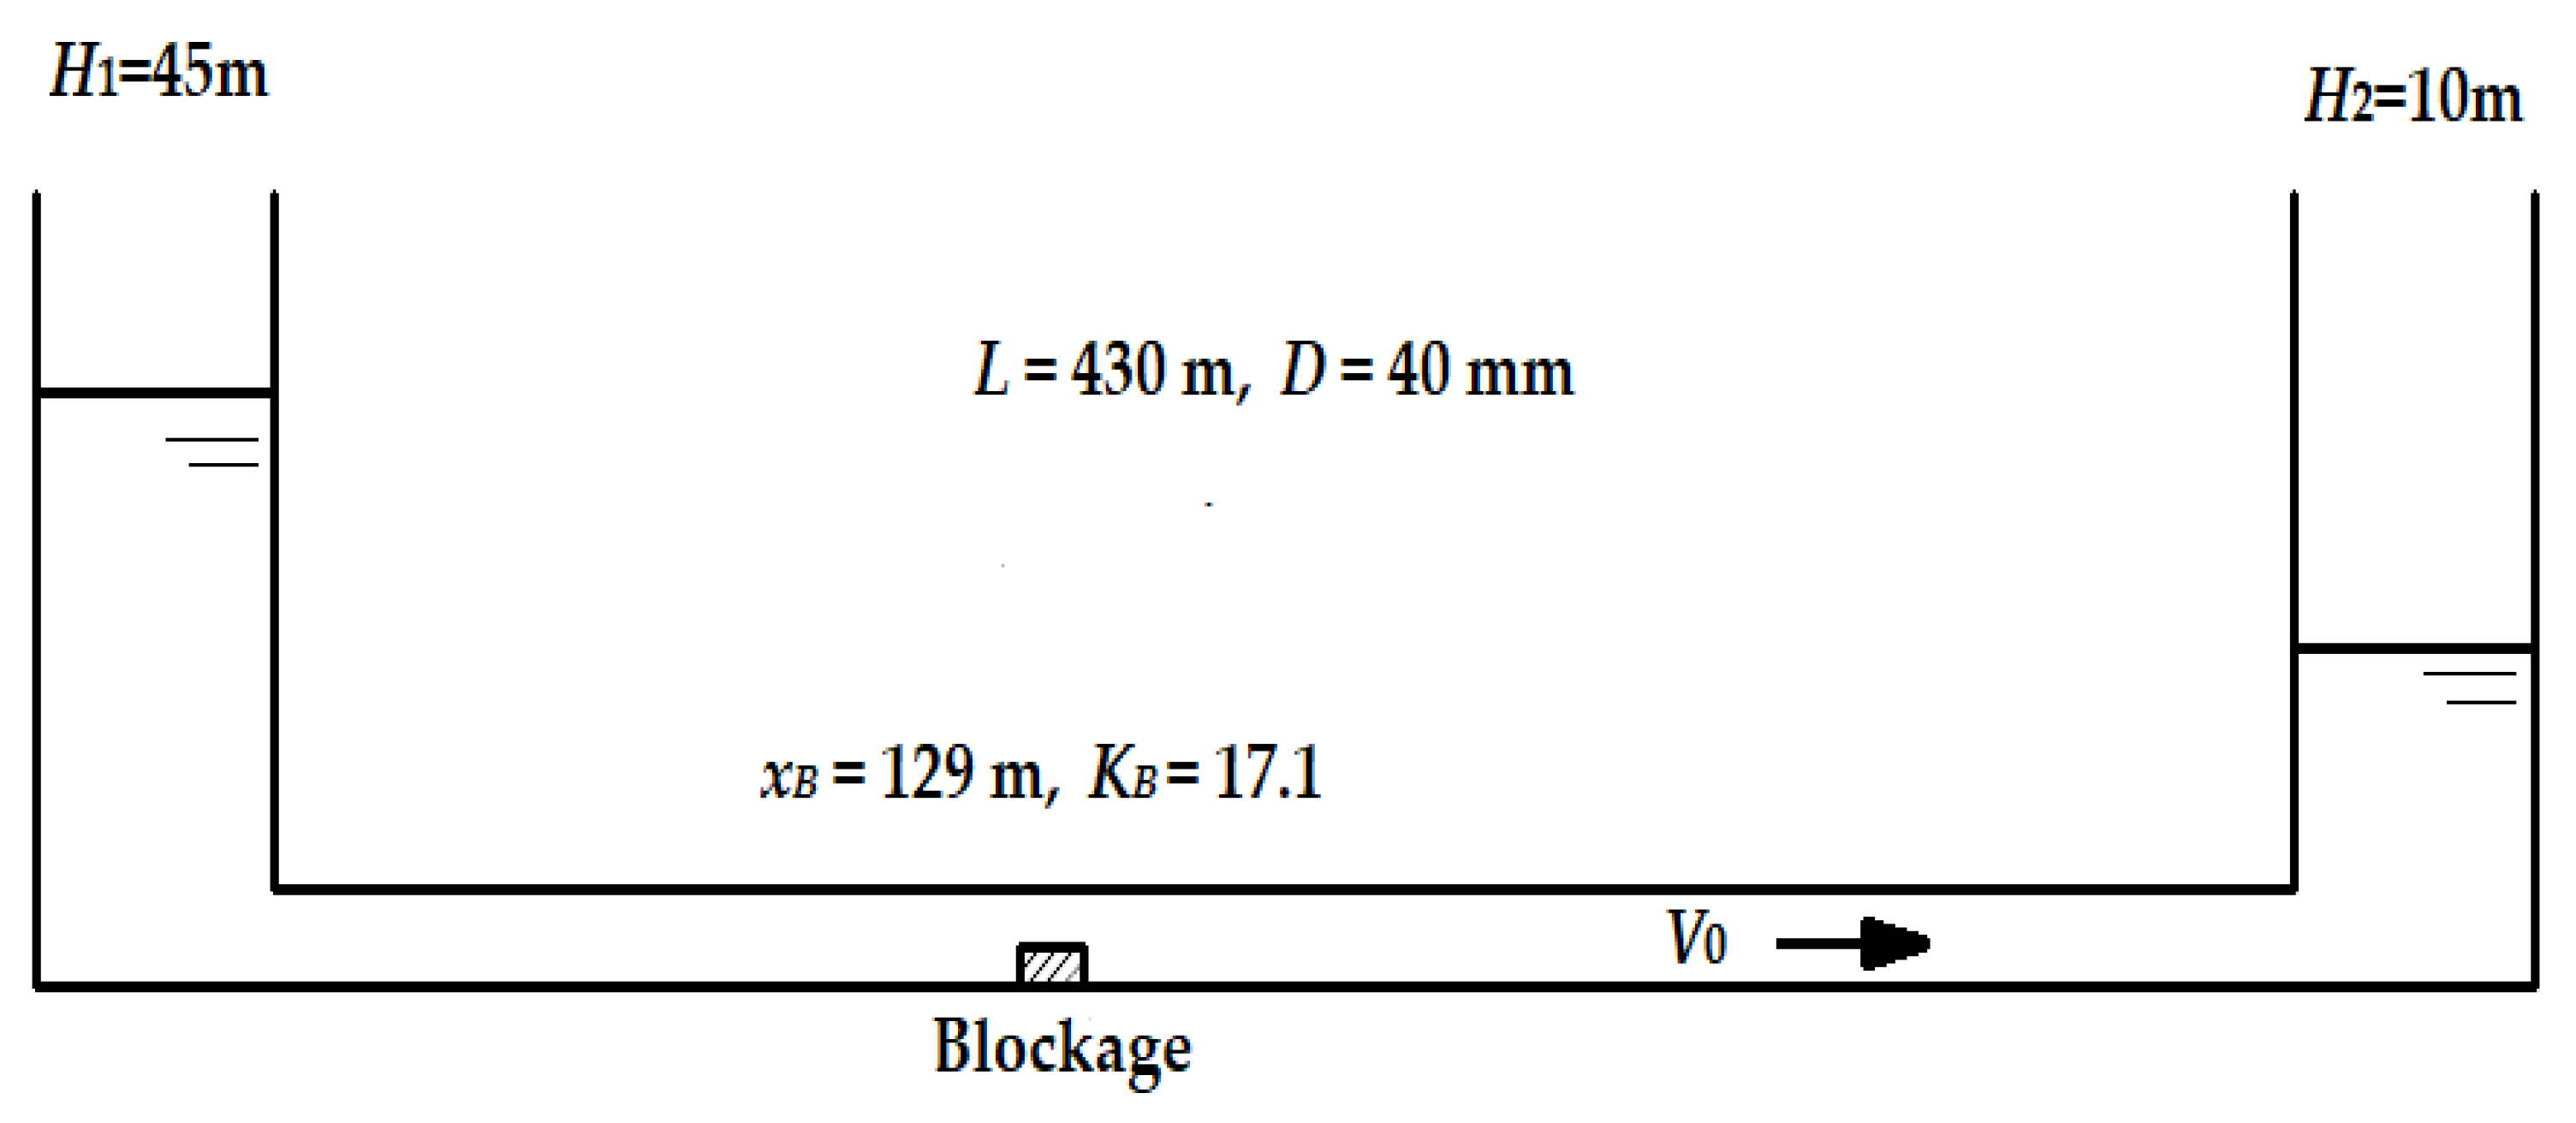
2.1. Single-Tube Blockage Model and Governing Equation

The derivation process adopted a tank–pipe–tank system, and the water levels at both ends were constant. The liquid flow at the blockage point of the pipeline was regarded as the flow of the orifice, and the physical model of the blockage segment is shown in Figure 1 [11].
The equation of conservation of momentum [14] of the above model is shown as:
t ( ρ A V ) Δ x + x ( ρ A V 2 ) Δ x = p 1 A p 2 A τ 0 π D ( x 2 x 1 ) Δ P B A
where p1 is the pressure for Section 1 (N/m2); p2 is the pressure for Section 2 (N/m2); D is the pipe diameter (m); τ 0 is the pipe wall shear stress (N/m2); Δ P B is the pressure difference before and after blockage (N/m2); A is the cross-sectional area of flow (m2); ρ is the liquid density, (kg/m3); V is the tube flow velocity (m/s); FS is the friction on pipe walls that prevents water from flowing, F S = τ 0 π D ( x 2 x 1 ) ; FB is the resistance of blockage, F B = Δ P B A , and FW is the stress blockage to the wall.
Assume that Δ x becomes infinitesimal, then Equation (1) is changed as follows:
t ( ρ A V ) + x ( ρ A V 2 ) + A p x + τ 0 π D Δ P B A δ ( x x B ) = 0
where δ ( x x B ) is the Dirac function and is defined as:
δ ( x x B ) = { x = x B 0 x x B
and
lim ε 0 x B ε x B + ε δ ( x x B ) d x = 1
where ε is the neighborhood near the blocking point.
According to the derivation process of the water hammer motion equation, a form similar to the basic equation of the water hammer is obtained [15,16,17], as shown in Equation (5):
H x + 1 g A Q t + Q g A 2 Q x + f Q 2 2 D g A 2 Δ H B δ ( x x B ) = 0
where H is the head of the blockage point; Q denotes the pipeline flow; Δ H B denotes the difference in the blockage head (m), and f denotes the pipeline friction coefficient.
Similarly, the continuity equation of a blocked pipe can be expressed as [18,19,20]:
H t + Q A H x + a 2 g A Q x = 0
where a is the wave velocity of the fluid water hammer.
The difference of the blockage head can be expressed as:
Δ H B = K B Q 2 2 g A 2
where KB is the local head loss coefficient of the blockage, which is related to the blockage area.
The dimensionless forms of Equations (5)–(7) are expressed as
t = t L / a x = x L H = H H S Q = Q Q 0 δ ( x x B ) = δ ( x x B )
where HS is the Zhukovsky pressure increment (m), H S = a V 0 g , and Q0 is the average fluid flow rate (m3/s).
The dimensionless governing equations are simplified as follows:
H t + Q x = 0
H x + Q t + [ R + G δ ( x x B ) ] ( Q ) 2 = 0
where R is the frictional drag parameter, R = f L Q 0 2 D A a = H f H S ; Hf is the frictional loss along the pipe, and G is the blockage resistance parameter, G = K B Q 0 2 a A = Δ H B H S .

2.2. Analytical Solution under Fixed Boundary Conditions

H* and Q* are expressed as the sum of the steady-state and fluctuation values, respectively:
H = H 0 + h ,   Q = Q 0 + q
where h* is the dimensionless fluctuation pressure, and q* is the dimensionless fluctuation flow.
By substituting Equation (11) into Equations (9) and (10), the following formula is obtained:
h t + q x = 0
H 0 x + h x + q t + [ R + G δ ( x x B ) ] ( Q 0 2 + 2 Q 0 q + q 2 ) = 0
The initial condition is shown as follows:
h ( 0 , t ) = 0 ,   h ( 1 , t ) = 0
By substituting Equation (14) into Equation (12), the boundary conditions are obtained as follows:
q ( 0 , t ) x = 0 ,   q ( 1 , t ) x = 0
If the excitation inside the pipeline occurs, the initial conditions are:
q ( x , 0 ) = f q ( x ) ,   q ( x , 0 ) t = g q ( x )
By performing an expansion by Fourier series, the solution of Equation (13) under boundary conditions is
{ q ( x , t ) = n = 1 { e ( R + R n B ) t [ A n cos ( n π t ) + B n sin ( n π t ) ] cos ( n π x ) } h ( x , t ) = n = 1 { e ( R + R n B ) t [ A n cos ( n π t ) + B n sin ( n π t ) ] sin ( n π x ) }
when h ( x , 0 ) = f h ( x ) , h ( x , 0 ) t = g h ( x ) , the An and Bn are expressed as following:
A n = 2 0 1 f h ( x ) sin ( n π x ) d x ( n = 1 , 2 , 3 , ) B n = 2 n π 0 1 g h ( x ) sin ( n π x ) d x + A n ( R + R n B ) n π ( n = 1 , 2 , 3 , ) }
R n B = 2 G cos 2 ( n π x B )
where R n B is the blockage attenuation parameter of the nth degree harmonic, and x B is the dimensionless blocked location.
According to Equation (17):
1.
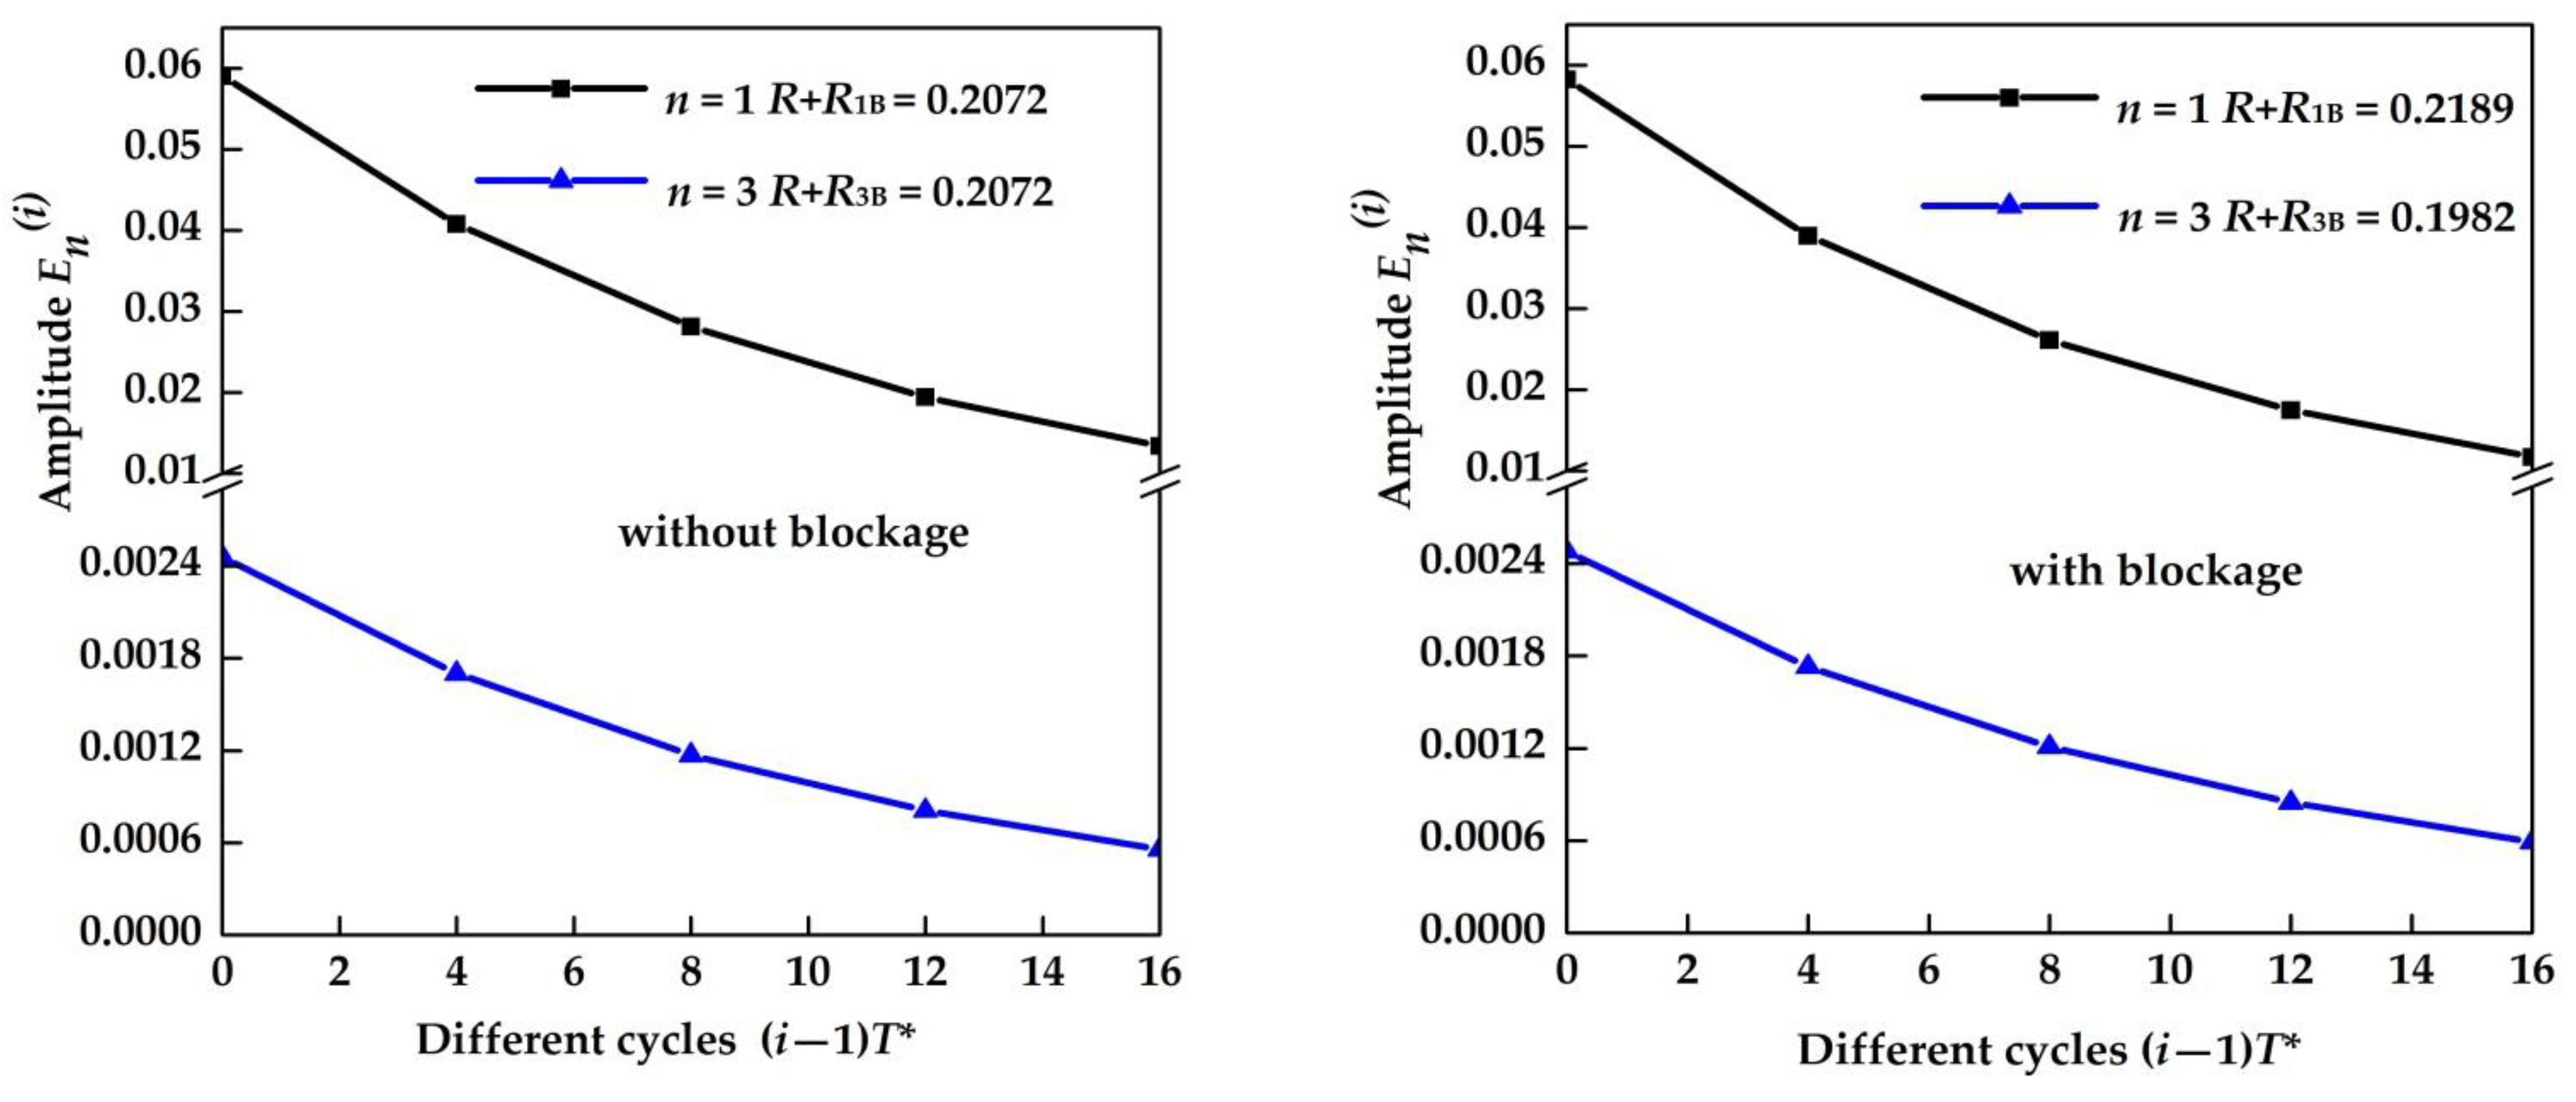
The attenuation parameters of each harmonic are the sum of R and R n B .
2.
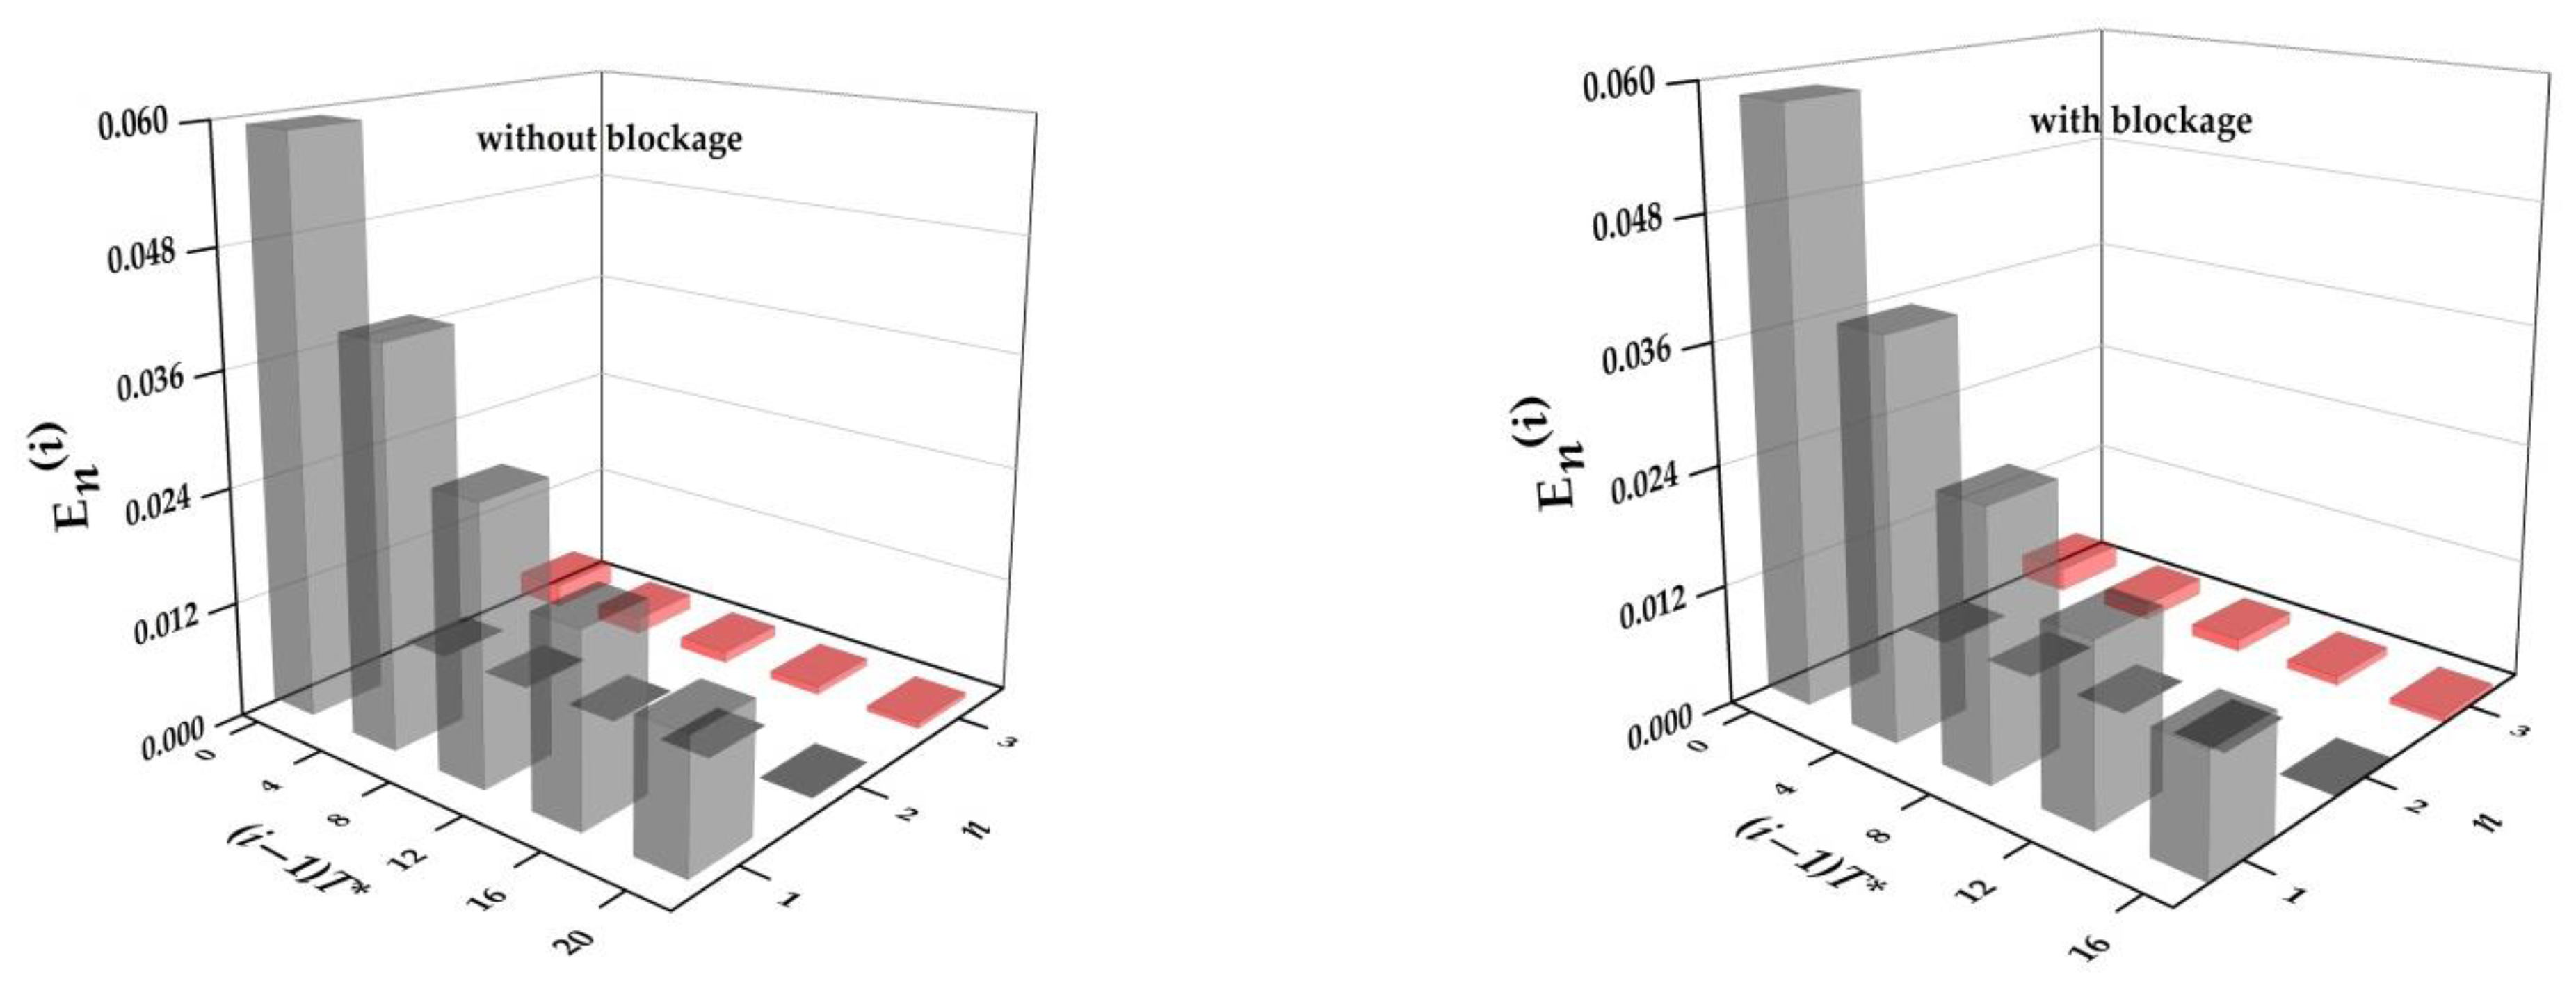
The sum of the components in each harmonic can be used to represent the pressure fluctuation of the blocked pipe, and the R value of the different harmonics is independent of the degree of harmonics n and exhibits exponential attenuation.
3.
The values of R n B are different for each harmonic, which is also key to detecting blockages.
4.
R n B is related to the location and magnitude of the blockage, but not to the location of the measurement.

3. Application of Fluid Oscillation Theory to Detection of Pipe Blockage

3.1. Fourier Series Analysis

After the system is excited, the dimensionless fluctuating pressure is measured at a certain point in the pipeline at different times, which could be any point along the pipe [21,22,23]. The curve showing the variation of the dimensionless fluctuating pressure with dimensionless time is obtained and divided up periodically, as shown in Figure 2. Based on Equation (17), the dimensionless fluctuating pressure curves of different periods are expanded into a Fourier series form, and the amplitude of the nth degree harmonic in the ith period is
E n ( i ) = e ( R + R n B ) ( t + T * ) e ( R + R n B ) t 0 ( R + R n B ) T sin ( n π x ) A n 2 + B n 2 e ( R + R n B ) ( i 1 ) T *
where t 0 is the dimensionless start time to transient analysis; x is the dimensionless position of the transient flow detection point; T is the dimensionless period of transient flow, T = T / ( L / a ) , and T is the period of transient flow (s).

3.2. Blockage Detection

Figure 3 shows the responses of three different harmonics (n = 1, n = 2, and n = 3) along the pipeline. According to Equation (19), R n B is greatly affected by different harmonic degrees n and the dimensionless blockage positions x B , so, according to this characteristic of R n B , blockage detection can be realized.

3.2.1. Detection of Blockage Location

The ratio of R n B for different harmonics is a function of the blockage position and is independent of the magnitude of the blockage. The calculation equation is as follows:
R n 2 B R n 1 B = cos 2 ( n 2 π x B ) cos 2 ( n 1 π x B )
From Figure 4, it can be seen that the higher the harmonic, the smaller the ratio of R n B and the greater the number of blockage positions. Therefore, to facilitate the improved detection accuracy of the blockage location, this study only considers that the degree n of the harmonic is no more than 4.

3.2.2. Detection of Blockage Magnitude

According to Equation (19), after determining the blockage location, the blockage magnitude can be obtained using the following equation:
G = R n B 2 cos 2 ( n π x B ) ( n = 1 , 2 , 3 , )
The local resistance coefficient KB was calculated according to the magnitude of the blockage, which is given by the following equation:
K B = 2 a G V 0
where KB is the local resistance coefficient of the blockage; a is the wave velocity (m/s), and V0 is the flow velocity in the pipeline (m/s).

4. Experimental Verification of Blockage Detection

4.1. Experimental System

The experimental system includes the pumping stations, experimental pipeline, data acquisition device, power distribution cabinet, blocking valve, turbine flowmeter, and pressure transmitter. The experimental device covered an area 14 m in length, 3 m in width, and 1.5 m in height. The highest local turnover point was at 3 m. The total length of the pipeline was 430 m, and it was made of galvanized steel. There were four pump stations in the experimental system, each of which had two centrifugal pumps, and the two centrifugal pumps were connected in series. The distance between each pumping station was 105 m, and the four pumping stations were controlled remotely using their respective operation panels. Several pressure sensors, gate valves, and ball valves were installed on the test bench, and a data acquisition system and an automatic control system were installed. The topological structure of the pipeline system was changed by manually opening and closing the gate valve, and the transient flow conditions in the pipeline system were excited by manually opening and closing the end-ball valve. A schematic of the experimental bench is shown in Figure 5, and a photograph is shown in Figure 6. The functions and descriptions of the experimental instruments on the experimental bench are listed in Table 1.
Four pumping stations with eight pumps were used in the experimental system. During the experiment in this study, only the first pumping station needed to be operated, and V18 at the initial position of the second pumping station was assumed to be the blockage, and the ball valve at the end of the pipeline was used as the transient excitation device in the experiment. Moreover, because the experiment in this study did not use the turnover point, this part of the pipeline was closed.

4.2. Experimental Verification

At the beginning of the experiment, the centrifugal pump control button in the remote distribution cabinet was opened. After the pressure and flow rate of the pipeline were stabilized, the data were recorded with and without blockage, respectively. Using the instantaneous closing valve at the end of the pipeline to generate the excitation of the transient flow, the change in pressure at the detection point was recorded. The total initial water head measured in the experimental system was 35 m, and the steady flow rate without blockage was 8.40 m3/h, while that with blockage was 8.0 m3/h. The length and diameter of the pipe were 430 m and 40 mm, respectively. The frictional drag coefficient was 0.02, and the wave speed c was 1200 m/s, which was calculated using Equation (24).
c = c 0 1 + K E d δ
where c is the pressure wave speed; m/s; c0 is the speed of sound waves in water when the temperature of water is 10 °C, c 0 = 1435   m / s ; d is the diameter of the pipeline, mm; δ is the thickness of the pipeline, mm; K is the volumetric modulus of water; K = 2.1 × 10 9 Pa ; E is the elastic modulus of the tube wall material; for steel pipe, E = 20.6 × 10 10 Pa .
There was a blockage at the point xB = 129 m, and KB was 17.1, as shown in Figure 7.
The experiments were divided into two parts. One part was to measure the flow rate in the pipeline and the pressure fluctuation of the measurement point when oscillation occurs in the pipeline without blockage. The other part was to measure the flow rate and the pressure fluctuation when oscillation occurs with blockage. Through the analysis of the difference between the pressure fluctuations in the two parts, the position and magnitude of the blockage were obtained. Regardless of whether there was a blockage in the pipeline, the experimental process was carried out according to the following procedures: (1) Opened the experimental system, and after the system was completely stable, measured the flowrate in the pipeline; (2) Generated oscillation, that is, transient excitation. The specific method for generating the oscillation was as follows: it was divided into two stages within 0~20 s, and from 0~10 s, the water level of the water tank at the end of the pipeline first increased to nearly 15 m, and then from 10~20 s, the water level decreased to 10 m. This process was carried out by a feed pump connected to the downstream tank; (3) Measured the pressure fluctuations at certain point; this point could be any point in the pipeline, and in this paper, the point at x = 322.5 m was adopted as the measurement point.
In this study, owing to the large number of pipe bends in the experimental system, the local friction resistance coefficient was larger than that in the numerical simulation, and the instantaneous excitation adopted a ball valve instead of a solenoid valve; therefore, linear closure and a fixed closing time were not guaranteed. There was a slight difference between the experimental and numerical simulation results, but the general trend was the same and did not affect the subsequent Fourier series analysis and periodic decomposition. The experimental data of the transient analysis were processed and analyzed, and the variation curves of the dimensionless fluctuating pressure at point x = 322.5 m with and without blockages were obtained and are shown in Figure 8.
By using Fourier series analysis, the dimensionless fluctuating pressure curves with and without blockages were decomposed into different period forms, and the amplitudes of each individual harmonic in different periods were obtained, as shown in Figure 9.
According to the results shown in Figure 9, the attenuation curves of each harmonic in different periods were obtained, as shown in Figure 10.
When there was no blockage in the pipeline, the frictional drag parameter R is
R = f L Q 0 2 D A a = 0.02 × 430 × 0.0023 2 × 0.04 × 0.001256 × 950 = 0.2072
When there was a blockage in the pipeline, the frictional drag parameter R is
R = f L Q 0 2 D A a = 0.02 × 430 × 0.0022 2 × 0.04 × 0.001256 × 950 = 0.1982
In Figure 10, when there was no blockage in the pipeline, the attenuation rate R + R n B of the first and third harmonics was the same and equal to 0.2072. This is because the value of R + R n B for each harmonic is independent of the number of harmonics and is only related to R.
In Figure 10, when there is a blockage in the pipeline, the R + R n B values of the first harmonic and the third harmonic are 0.2189 and 0.1982, respectively. In addition, the R + R n B values for the different harmonics were different and larger than R. This was because R + R n B for each harmonic wave was not only related to R, but also to the degree of harmonics. Therefore, the R values of the first harmonic and the third harmonic were R 1 B = 0.0207 and R 3 B = 0.0000467 , respectively, and the ratio of R 3 B / R 1 B was 0.00226. According to Figure 4, the following results could be obtained:
When R 3 B / R 1 B = 0.00226 , x ^ B = 0.171 , x ^ B = 0.201 , x ^ B = 0.829 , and x ^ B = 0.799 . Owing to the symmetry analysis, the corresponding actual pipe blockage point was x B = 0.342 or x B = 0.402 , and the values of the other two points exceeded 1, which were not considered.
When x B = 0.342 :
{ G = R 1 B 2 cos 2 ( π x ^ B ) = 0.0207 2 × cos 2 ( π × 0.171 ) = 0.0140 K B = 2 A a G Q 0 = 2 × 0.001256 × 950 × 0.0140 0.0022 = 15.2
Therefore, the blockage point x B = 0.342 and blockage magnitude K B = 15.2 , which were calculated using this method, are close to the actual situation of the blocked pipeline ( x B = 0.300 , K B = 17.1 ).

4.3. Results Discussion

In the process of technical implementation, it is very important to select the detection point that is convenient for detecting the pressure wave because the core technology is to monitor the pressure wave with blockages and to obtain a waveform that can be studied analytically. In practical engineering, after obtaining the free oscillating pressure wave, the dimensionless pulsating pressure curve is decomposed into different periods, Fourier series analysis is applied, and the individual components are composed of harmonic components. A specific method for detecting blocked pipelines is based on the blockage attenuation parameter. If the blockage attenuation coefficient R n B is greater than the frictional drag parameter R, it is determined that there is a blockage; then, the blockage position is determined according to the ratio of the two separate component harmonics. Equation (19) can be used to determine the blockage position, and the blockage magnitude can then be calculated according to Equation (23).
Exponential attenuation with the blockage attenuation parameter e R n B t cannot be obtained from the integral because the blockage attenuation parameter R n B of each harmonic is different, which is also the key to the detection of pipeline blockage technology using each harmonic blockage attenuation parameter.
In the calculation example in this study, the actual blockage position was set to x B = 0.300 ; the blockage magnitude was K B = 17.1 , and the blockage point and blockage magnitude obtained by the proposed method had an error of approximately 11%, which is acceptable for engineering applications. The sensitivity mainly depends on the selection of the detection point, but the location of the detection point in the actual project is related to the actual project scenario and therefore cannot be generalized.

5. Conclusions

In this study, based on the fluid oscillation theory, the location and magnitude of pipeline blockages were detected by the transient attenuation of the fluid caused by pipeline blockages. In the detection, the blockage attenuation parameters R n B of each individual harmonic component were used to quantify the blockage, whereas the ratio of the harmonic blockage attenuation parameters of different components was used to locate the blockage. Finally, the method was verified experimentally. The following conclusions were drawn.
  • Based on the theory of fluid oscillation and the method of Fourier series analysis to detect the blockage problem in a pipeline system, the location and magnitude of blockage were determined using the parameters of blockage attenuation fluctuation caused by the blockage.
  • The fluctuating pressures under the fluid oscillation of the pipeline system can be expressed as the sum of a series of harmonic components, each of which is exponentially attenuated by the sum of the attenuation parameters R and the blockage attenuation parameters R n B ; when the pipeline blockage position is confirmed, the magnitude can be calculated by the blockage attenuation parameter R of each individual harmonic component.
  • A pipeline test bench for detecting blockages was constructed according to the existing pipeline simulation test bench, and simulation experiments were designed to verify the blockage detection method. The experimental results show that the proposed method is accurate, reliable, and provides a reference for its application in practical engineering.
The blockage detection method proposed in this study is currently in the experimental stage. Because the physical model is relatively ideal, there are many interference factors in the actual project, so the research group plans to gradually increase the interference factors in the experimental process to ensure that it is as close as possible to the actual pipeline, and error and sensitivity analyses will be performed. It will be applied to an actual project, which will be the focus of the next study. The results obtained in this study can provide an important reference for future work and can prove the feasibility of the proposed blockage detection method.

Author Contributions

Conceptualization, Y.F. and Y.X.; methodology, Y.X.; software, K.W.; validation, Y.F. and Y.X.; formal analysis, K.W.; investigation, Y.X.; resources, Y.F.; data curation, Y.F.; writing—original draft preparation, K.W.; writing—review and editing, Y.X.; supervision, Y.F.; project administration, Y.F.; funding acquisition, Y.X. All authors have read and agreed to the published version of the manuscript.

Funding

This research was funded by the National Natural Science Foundation of China (Grant Nos.51808102 and 51978202), the Science Foundation of Harbin University of Commerce (Grant No. 2020CX07), and the Natural Science Fund in Heilongjiang Province (Grant No. LH2019E111 and LH2020E028).

Institutional Review Board Statement

Not applicable.

Informed Consent Statement

Not applicable.

Conflicts of Interest

The authors declare no conflict of interest. The funders had no role in the study design, collection, analyses, interpretation of data, the writing of the manuscript, or the decision to publish the results.

References

  1. Chunyang, Z. A Study on Detection of Oil Pipeline Blockage Based on Free Oscillation Theory. Master’s Thesis, Harbin University of Technology, Harbin, China, 2016. [Google Scholar]
  2. Zhongyuan, J. Analysis and Identification Method of Abnormal Pressure Fluctuation in Oil Pipeline. Ph.D. Thesis, China University of Petroleum (East China), Qingdao, China, 2017. [Google Scholar]
  3. Zouari, F.; Blåsten, E.; Louati, M.; Ghidaoui, M.S. Internal pipe area reconstruction as a tool for blockage detection. J. Hydraul. Eng. 2019, 145, 4019019. [Google Scholar] [CrossRef] [Green Version]
  4. Yan, X.F.; Duan, H.F.; Wang, X.K.; Wang, M.L.; Lee, P.J. Investigation of transient wave behavior in water pipelines with blockages. J. Hydraul. Eng. 2021, 147, 4020095. [Google Scholar] [CrossRef]
  5. Kumar, P.; Mohapatra, P.K. Partial blockage detection in pipelines by modified reconstructive method of characteristics technique. J. Hydraul. Eng. 2022, 148, 4022003. [Google Scholar] [CrossRef]
  6. Zhang, C.; Alexander, B.J.; Stephens, M.L.; Lambert, M.F.; Gong, J. A convolutional neural network for pipe crack and leak detection in smart water network. Struct. Health Monit. 2022, 1–13. [Google Scholar] [CrossRef]
  7. Zhang, Y.; Duan, H.F.; Keramat, A.; Che, T.C. On the leak-induced transient wave reflection and dominance analysis in water pipelines. Mech. Syst. Signal Process. 2022, 167, 108512. [Google Scholar] [CrossRef]
  8. Wan, W.; Chen, X.; Zhang, B.; Lian, J. Transient simulation and diagnosis of partial blockage in long-distance water supply pipeline systems. J. Pipeline Syst. Eng. Pract. 2021, 12, 4021016. [Google Scholar] [CrossRef]
  9. Wan, W.; Zhang, B. The intermittent leakage phenomenon of incipient cracks under transient conditions in pipeline systems. Int. J. Press. Vessel. Pip. 2020, 186, 104138. [Google Scholar] [CrossRef]
  10. Zhang, B.; Wan, W. A transient-features-based diagnostic method of multi incipient cracks in pipeline systems. Int. J. Press. Vessel. Pip. 2022, 199, 104701. [Google Scholar] [CrossRef]
  11. Yuebin, W.; Ying, X.; Fen, W. A method for detection of blockage of compressed pipes based on free oscillation theory. J. Harbin Univ. Technol. 2014, 46, 45–50. [Google Scholar]
  12. Yang, L.; Fu, H.; Liang, H.; Wang, Y.; Han, G.; Ling, K. Detection of pipeline blockage using lab experiment and computational fluid dynamic simulation. J. Pet. Sci. Eng. 2019, 183, 106421. [Google Scholar] [CrossRef]
  13. Zhenren, C. A Study on Mechanical Analysis of Blocked Oil Mud Columns in Shallow Sea Oil Pipeline. Ph.D. Thesis, Northeast University of Petroleum, Xian, China, 2018. [Google Scholar]
  14. Wylie, E.B.; Streeter, V.L. Fluid Transients in Systems; Prentice-Hall Inc.: Englewood Cliffs, NJ, USA, 1993. [Google Scholar]
  15. Jianbin, Z.; Li, T. Analysis of Impact Impact of Gas Volatility in Pipeline. Pipeline Ind. Technol. Forum 2020, 19, 48–49. [Google Scholar]
  16. Tian, Y.; Zhao, X.F.; Tian, D.; Wu, R.; Tang, H. Dynamic detection of the multiple hydrate blockages in natural gas pipeline using mass pulse at the inlet. Appl. Mech. Mater. 2014, 490, 490–497. [Google Scholar] [CrossRef]
  17. Jing, Y. Numerical Simulation and Experimental Analysis of Nonlinear Oscillation of Gas in Tube. Ph.D. Thesis, Nanjing University of Aeronautics and Astronautics, Nanjing, China, 2014. [Google Scholar]
  18. Mohapatra, P.K.; Chaudhry, M.H. Hanif Chaudhry. Frequency responses of single and multiple partial pipeline blockages. J. Hydraul. Res. 2011, 49, 263–266. [Google Scholar] [CrossRef]
  19. Junkai, L.; Hui, Y. Causes and countermeasures of blockage and wear of slag water pipeline in gasification of coal water slurry. Chem. Eng. Design 2020, 30, 16–18. (In Chinese) [Google Scholar]
  20. Qinghua, K. CO2 Analysis of Transient Simulation of Long Pipeline Blocking. Ph.D. Thesis, Xi’an University of Petroleum, Xian, China, 2020. [Google Scholar]
  21. Linfeng, W.; Zao, F.; Xuefeng, Z. Pipeline blockage state evaluation based on optimized VMD and continuous hidden Markov model. Vib. Shock 2020, 39, 214–222, 233. [Google Scholar]
  22. Zhenshan, L. A new approach to solving the problem of pipe blocking of slurry pump in Brief. Energy Technol. 2020, 18, 54–58. [Google Scholar]
  23. Nazar, M.; Shahid, F.; Akram, M.S.; Sultan, Q. Flow on oscillating rectangular duct for Maxwell fluid. Appl. Math. Mech. 2012, 33, 717–730. [Google Scholar] [CrossRef]
Figure 1. Physical model of blockage segment.
Energies 15 05373 g001
Figure 2. Curve of dimensionless fluctuating pressure with dimensionless time.
Energies 15 05373 g002
Figure 3. Blockage attenuation diagram of different harmonic components.
Energies 15 05373 g003
Figure 4. Ratio curves of different R n B values at different blockage locations.
Energies 15 05373 g004
Figure 5. Schematic diagram of pipeline test bench.
Energies 15 05373 g005
Figure 6. Photo of pipeline test bench.
Energies 15 05373 g006
Figure 7. Simplified diagram of the test bench.
Energies 15 05373 g007
Figure 8. Dimensionless fluctuating pressures with dimensionless time with and without blockages.
Energies 15 05373 g008
Figure 9. Amplitude of harmonics in different periods.
Energies 15 05373 g009
Figure 10. Exponential attenuation curves of harmonics.
Energies 15 05373 g010
Table 1. List of laboratory instruments.
No.NameQuantityModelRemarks
1Centrifugal pumps8Motor ZS50-32-160/2.2, power 2.2 kW
2Turbine flowmeters2LW-40, output signal 4–20 mA0.5% accuracy
3Pressure sensors13Range 0–700 kPa, −100–500 kPa
4Ball valves8Q41F-16, nominal pressure 1.6 Mpa
5PipelineDN40Stainless steel
Publisher’s Note: MDPI stays neutral with regard to jurisdictional claims in published maps and institutional affiliations.

