
Research Trends and Applications of PMUs


1
Electrical and Computer Engineering Department, University of Florida, Gainesville, FL 32603, USA
2
Distributed Systems Group, Pacific Northwest National Laboratory, Richland, WA 99354, USA
*
Author to whom correspondence should be addressed.
Energies 2022, 15(15), 5329; https://doi.org/10.3390/en15155329
Submission received: 1 July 2022
/
Revised: 19 July 2022
/
Accepted: 20 July 2022
/
Published: 22 July 2022
Abstract
:This work is a survey of current trends in applications of PMUs. PMUs have the potential to solve major problems in the areas of power system estimation, protection, and stability. A variety of methods are being used for these purposes, including statistical techniques, mathematical transformations, probability, and AI. The results produced by the techniques reviewed in this work are promising, but there is work to be performed in the context of implementation and standardization. As the smart grid initiative continues to advance, the number of intelligent devices monitoring the power grid continues to increase. PMUs are at the center of this initiative, and as a result, each year more PMUs are deployed across the grid. Since their introduction, myriad solutions based on PMU-technology have been suggested. The high sampling rates and synchronized measurements provided by PMUs are expected to drive significant advancements across multiple fields, such as the protection, estimation, and control of the power grid. This work offers a review of contemporary research trends and applications of PMU technology. Most solutions presented in this work were published in the last five years, and techniques showing potential for significant impact are highlighted in greater detail. Being a relatively new technology, there are several issues that must be addressed before PMU-based solutions can be successfully implemented. This survey found that key areas where improvements are needed include the establishment of PMU-observability, data processing algorithms, the handling of heterogeneous sampling rates, and the minimization of the investment in infrastructure for PMU communication. Solutions based on Bayesian estimation, as well as those having a distributed architectures, show great promise. The material presented in this document is tailored to both new researchers entering this field and experienced researchers wishing to become acquainted with emerging trends.
1. Introduction
The introduction of the phasor measurement unit (PMU) has unlocked a new realm of possibilities for researchers and engineers. Today, solutions based on PMU technology expand across multiple areas of research. From state estimation to protection, the PMU is driving exciting solutions that have the potential to revolutionize the power grid, and given the ever-increasing number of PMUs installed on the grid, many of these solutions could become feasible in the near future. High sampling rates, combined with the synchronization of measurements provided by PMUs, make it possible to detect dynamics that are invisible to traditional meters. For example, in the context of system modeling, PMUs offer a dynamic view into the behavior of a system, which makes it possible to derive system parameters with greater accuracy which, in turn, leads to improved estimation, control, and protection. In the context of state estimation, PMUs are expected to be the foundation of dynamic state estimation (DSE), which will allow grid operators to make decisions based on real-time data. In terms of protection and control, PMUs could be used to improve corrective actions in the presence of disturbances due to their ability to synchronize measurements across large distances. In short, PMUs are expected to usher in a new era in terms of grid technology and solutions; however, before these advances can be realized, there are several gaps that must be addressed. This work presents a review of current research trends and applications of PMU technology in the power grid. After reading this document it will become clear to the reader that the vast majority of PMU applications have a foundation on abnormal data detection. In fact, most of the current obstacles in the field of applied synchrophasors can be approached as goodness of data problems. In contrast to other surveys of PMU technology, this document reviews PMU applications across the complete range of power delivery: from generation to distribution. While the constraints found at each level of power delivery are very different, some similarities, and in some cases synergies, can be found in the context of PMUs. Moreover, as renewables, microgrids, and distributed generation (DG) become more prevalent, the distinction between generation, transmission, and distribution is becoming less clear. The modern power systems engineer must be proficient in all three areas; this work does not draw clear lines between generation, transmission, and distribution. However, distinctions must be made when describing protection applications. For that reason, efforts are made to separate the techniques where appropriate, so that consistency can be maintained throughout the paper. The applications covered in this work are grouped into four areas: estimation, monitoring, protection, and stability. Each of these four areas is dedicated a section where several research efforts are summarized, compared, and discussed. The remainder of this document is organized as follows. The history of the PMU and some of its key features are summarized in Section 3. Efforts related to power system monitoring are covered in Section 4, while Section 5 highlights work in cybersecurity. Power system stability and protection applications are covered in Section 6 and Section 7, respectively. Figure 1 displays the overall structure of this work. The four main areas are further divided into subsections that highlight important and promising areas of investigation. An overall discussion is presented in Section 8, and closing remarks are made in Section 9. In-depth coverage of the technical aspects of PMU communication and networking are beyond the scope of this work; however, this information can be found in [1]. Most of the works reviewed in this manuscript were released within the last five years; therefore, this can be considered a review of the state of the art in PMU applications.
2. Methodology
The objective of this work is to highlight the latest trends in PMU research and applications. To that end, a series of works that exemplify current trends in their field will be presented in each section. Recent works, for the most part published in the last five years, that show potential for significant impact are covered in greater detail. Featured works were selected based on citation metrics. This methodology allows this manuscript to offer a sense of where mainstream trends are heading, as well as a preview of up-and-coming tendencies.
3. Origins of the PMU
The origins of the PMU can be traced back to the aftermath of the 1965 northeast blackout in the US. This event exposed several gaps in the grid-monitoring technology of that time, in particular, static state estimation. In order to mitigate large disturbances, rapid actions must be taken, but the effectiveness of these actions depends heavily on the quality and the quantity of the information available to the system operators. Ideally, real-time applications would be used for grid operation; unfortunately, real-time monitoring was something state estimators of this period were not able to support, at least not across large areas. In light of these limitations, measures were taken to improve the reliability of the power grid. One of the efforts placed into motion was the development of real-time wide area measurements (WAMs). The following decades (1970s and 1980s) saw advancements in power system protection, digital signal processing, and satellite-based navigation that provided a platform for the development of the first PMU in 1988 by researchers at Virginia Tech [2]. After the turn of the century, the integration of PMUs into the grid gained significant momentum due to the smart grid initiative, which was in part driven by the need to modernize the grid to meet the requirements of alternative energy sources, and as a response to high-profile events such as the 2003 northeastern USA blackout [3]. Organizations dedicated to the study of PMU technology, such as the North American Sychrophasor Initiative (NASPI) [4], networks such as NASPInet [1], and industry standards such as IEEE C37.118 [5], have been established to advance and regulate PMU applications.
Key Features of PMUs
The synchronization of PMUs is accomplished by using a common clock as reference; currently this is achieved via GPS satellites. This synchronization makes it possible to measure and compare phasors at multiple locations across large distances, ergo, PMUs are synonymous with WAMs, and with the term synchrophasor [6]. A simplified centralized synchrophasor arrangement is depicted in Figure 2.
In addition to their ability to make measurements across large distances, PMUs have a high sampling rate (up to 120 Hz) [5] relative to other measurement systems such as SCADA (up to several seconds) or smart meters (several minutes), which make it possible to trace and analyze events dynamically. By capturing the dynamics of a system, it becomes possible to extract unique features that can be used to enhance current technologies. The ability of PMUs to take measurements across large distances, combined with their high resolution, are two key characteristics that enable many of the applications discussed in the following sections.
4. Power System Monitoring
One of the original drivers behind the efforts that eventually lead to the development of the PMU was the need to enhance static state estimators. This is showcased in [7], where PMUs are used to validate static estimators. Eventually, as PMUs continue to be installed across the grid, dynamic state estimation (DSE) will likely become the standard for grid monitoring. Presently, however, the infrastructure necessary to support full DSE is limited to a few selected systems. This section is divided into two subsections: DSE and integrated state estimation (ISE), as illustrated in Figure 1.
4.1. Dynamic State Estimation
One of the first challenges encountered by researchers in this area was a lack of system observability due to low PMU penetration. By leveraging the electrical relationships of the buses in a network along with techniques originally developed for SSE, PMU-observability can be achieved without having to install PMUs at every bus in a system [8]. These ideas are illustrated in Figure 3, where not every bus is equipped with a PMU, yet the algorithm is capable of providing dynamic estimates for all buses in the system.
PM-observability can be achieved via algorithms based on graph theory that take into account the electrical relationships, as well as the topology of the system [9,10]. Each year, the typical utility company receives a fixed amount of funding for PMU installation. This results in a fixed amount of PMUs being added to the grid annually. These new PMUs must be installed at key locations to maximize technical and financial gains. When constraints such as the cost of installation or the availability of measurements are considered, the PMU placement problem can be approached as an optimization problem [11]. In [12], optimal PMU placement is studied under multiple contingency conditions such as line outages and loss of measurements. Robust PMU placement via mutual information (MI) is investigated in [13]. This approach takes into consideration uncertainties such as reduced number of states and PMU outages, as well as financial constraints. Financial constraints are once again considered in a Bayesian-estimation-based technique introduced in [14]. The solution presented in [15] attempts to strike a balance between estimation accuracy and cost. Additional constraints, such as redundancy for critical buses, prohibited substations, the handling of existing PMUs, and others, can be integrated into the optimization algorithm in order to meet a certain design criteria. For the remainder of this review, all systems will be assumed to be PMU-observable, unless stated otherwise.
DSE frameworks share a common foundation: the Kalman filter (KF) [16]. A complete derivation of the KF can be found in [17].
Over time, variations or extensions of the KF have been proposed to overcome the limitations of the original formulation [16]. In [18], a variation of the extended Kalman filter (EKF) is introduced to improve the performance of the filter in cases where a full set of input measurements is not available. An extension developed to improve the ability of the EKF to track transients and disturbances is presented in [19]. An estimator based on the unscented Kalman filter (UKF) is used in [20] to streamline the estimation process, while in [21], a decentralized scheme based on the UKF is investigated.
The work in [22] presents a KF-based technique for systems containing uncertainties due to noise, saturation, or transients. The idea is to utilize a tuning parameter to ensure that the covariance matrix remains positive definite. Simulations produced encouraging results as this technique outperformed other similar KF-based estimation solutions. Being able to deal with uncertainties related to data is a significant contribution that increases the robustness and the flexibility of DSE.
The work presented in [23] tackles the challenges that KF-based DSE encounters when estimating larger power systems. Classical KF-based algorithms struggle to overcome uncertainties and nonlinearities present in the state space model of larger power systems, which can lead these filters to become unstable. The unscented Kalman filter (UKF) is used as the foundation of this method. The UFK is reinforced by improving its numerical stability though modifications that guarantee key matrices remain positive semi-definite even in the presence of nonlinear events. This introduces an algorithm that replaces matrix with the nearest symmetric semidefinite matrix in Frobenius norm whenever is no longer positive semidefinite. The new matrix is found through a modified version of Dykstra’s projection algorithm [24]. Positive definiteness is enforced by replacing negative eigenvalues with their positive equivalent. This solution performed well in some of the testing scenarios; unfortunately, it did not maintain a consistent level of performance across a variety of system topologies. It must be noted that this novel approach did not display the adaptability of more established techniques such as [25,26].
An important aspect of DSE is the detection of abnormal data. Some of the classical bad-data detection techniques inherited from traditional SSE, such as residual analysis, can be applied to DSE, as seen in [27,28]. However, contemporary solutions are moving in a different direction as new frameworks are being adopted. In [29], a unified PMU placement and bad-data detection solution is proposed. First, PMU locations are optimized, then abnormal data are detected by analyzing the linear independence of the Jacobian matrix. In [30], Lagrange multipliers are used to identify errors in WLS estimations. Erroneous values are identified and removed via mixed-integer programming (MIP) in [31]. An estimator based on the least absolute value (LAV) estimator [32] is presented in [33]. This technique offers advantages in terms of efficiency as LAV can handle both the estimations and bad-data detection in a single module. Detrended fluctuation analysis (DFA) is used to develop a novel bad-data detection scheme for dynamic estimation in [34].
A decentralized solution for abnormal data detection in sychrophasor measurements is developed in [35]. In this approach, several detector types are used in unison. The first is a detector based on linear regression, the second detector is a variation of Chebyshev’s inequality, and the third detector is based on spatial clustering. At the global level, another layer of detection is used, this one based on Bayesian estimation. This technique was shown to be effective during testing, performing reliably well across a series of tests. This is a data-driven solution, and therefore benefits from a high degree of generality. Another highlight of this technique is its use of Bayesian estimation and a distributed architecture, two very promising methods that studies have just recently begun utilizing. Finally, while the scope of [35] is limited to abnormal data detection, it has the potential to be a standalone solution if expanded accordingly.
In [36], a decentralized-approach-based graph theory is presented. The system is broken into a series of observable islands. The number of PMUs is found via optimization algorithms while graph theory ensures observability.
Whether it is dynamic, static, or integrated (covered in the following section) estimation, the integrity and the quality of measurements used by the estimators remains a key issue. For these techniques to flourish, their results must be robust in the presence of signal quality issues; this topic is covered in greater detail in [37,38,39,40]. In [41], quality issues stemming from GPS errors, latency, scaling, and noise are investigated and mitigation solutions are presented. Redundancy between PMU measurements and linear estimators is used to identify abnormalities. The rank of the Jacobian matrix is then used to derive correction factors.
The subject of uncertainty in measurements is an important aspect of estimation, and one that has the potential to generate system-wide errors. Uncertainties come from multiple sources, including latency, discrepancies in system parameters, and instrument inaccuracies [42]. In [43], uncertainty propagation theory is used to analyze the spread of errors in WLS estimators and how the results are shaped by these uncertainties. In this method, lower and upper error bounds are established for the outputs of the estimator, and errors are mitigated by adjusting the weights of suspected measurements. The impact of buffering times in estimates are studied in [44]. This work considers a system where PMUs measurements are generated at different rates. A solution based on a memory buffer is proposed. At the memory buffer, data are primed before being fed to the estimator. This priming includes the determination of weighting factors. This method is complemented by the inclusion of an optimization routine that is used to find efficient buffer lengths. In [45], fuzzy set theory and Markov models are used to develop reliability indices to identify PMUs and estimates that are vulnerable to uncertainties.
More recently, in [46], techniques for the characterization and quantification of noise in PMU measurements were presented. The goal of these techniques is to facilitate the mitigation of estimation errors due to noise and uncertainties. In [47], -model approximations are extended to identify and correct estimation errors due to uncertainties in line and transformer parameters. A root mean square error (RMSE) is used to track the performance of the estimator. The validity of uncertainty propagation theory in transmission line estimates is examined in [48]. Results indicate that when both voltage and current measurements corresponding to a node are used, the accuracy of the theoretical models are significantly improved. The widely used Gaussian assumption is studied in [49], with results indicating the assumption might be flawed. The impact of uncertainty on fault location was investigated in [50]. Discrepancies in transmission line parameters are mitigated via stochastic models and MLE estimators. The performance of PMU placement strategies in the face of uncertainties are studied in [51]. A variation of the nondominated sorting genetic algorithm II (NSGA-II) is presented to alleviate the effects of uncertainty while keeping costs to a minimum. Finally, extensions of the KF have been developed for the purpose of increasing the resilience of dynamic estimators in the presence of uncertainties, as shown in [22,52,53].
Trends: The Kalman filter and its extensions are the most prevalent estimators used in contemporary dynamic estimation. In regards to bad-data detection, there is not a clear go-to technique, but the trend appears to be shifting away from traditional residual analysis as more holistic approaches are being investigated. Most techniques include a PMU placement module; in this regard, the trend is to make the system observable with the lowest number of PMUs possible.
Gaps: As mentioned above, PMU-observability is pivotal. Graph theory and optimization tools are being used to address this gap. Other significant obstacles in DSE are the possible limitations in terms of communication network infrastructure. Decentralized and distributed approaches are being evaluated to overcome this challenge. This topic is covered in greater detail in Section 6.4. Key paper contributions in this topic are presented in Table 1.
4.2. Integrated Estimation
As previously mentioned, currently, few systems can support full DSE. Research has been carried out attempting to leverage the technology currently deployed in the grid to close the gap between SSE and DSE. The techniques presented in this section leverage smart meters (SM), SCADA, and other sources of data in the grid to make sections of the grid PMU-observable. Figure 4 illustrates an arrangement where multiple meter types are used for estimation.
Bayesian estimation is at the core of these techniques, which represents a significant paradigm shift in SE, as algorithms such as WLS and KF-based methods remain the most widely utilized techniques in SSE and DSE, respectively. This work refers to these techniques as integrated state estimation (ISE). These techniques follow a layered approach in which measurements are processed separately based on sampling rate. The outputs of the slower layers are used to augment the PMU layer, which is the fastest layer processing data in real time [54]. This arrangement is illustrated in Figure 5.
In [55], Bayesian inference is employed to estimate the probability distribution of a given set of measurements. This process can have a varying degree of complexity depending on the properties of the dataset and the assumptions that are made. Ref. [55] leverages NNs to carry out the process of retrieving the corresponding probability distributions from historical power-flow measurements. Once the probability distributions are established, another NN is then used to emulate a mean-squared error (MMSE) estimator for real-time estimation. The goal of the technique is to minimize the MMSE, defined as
Data anomalies are detected using likelihood ratios, and when an anomaly is detected the erroneous measurement is replaced by the mean of the prior distribution. One significant advantage of this approach over other, more popular, estimation procedures is that Bayesian estimation performs well in systems with low or lack of observability. Probability distributions and Bayesian estimation produce estimates comparable to pseudo measurements. In the case of [55], the technique seemed to outperform classical approaches in terms of accuracy and resolution. The main obstacle of the technique is obtaining the appropriate probability distributions to make the MSSE estimator produce accurate results.
The framework presented in [55] is expanded in [56] to incorporate measurements from meters with different sampling rates. In a layered approach, measurements from meters with lower sampling rates are included in the calculation of the probability distributions. Online estimation, which is performed via an MMSE estimator, utilizes measurements from the meters with the highest sampling rates. A second extension was presented in [57] to enable PMU-observability in an approach that produces quasi-dynamic estimates. The highlight of this technique is that it produces results comparable to the results produced by contemporary state estimators (in some cases outperforming them), while utilizing techniques that are not widely used in SE. While extremely promising, this approach is not the most accessible for the average researcher as it requires specialized knowledge in ML and probability theory. This technique can be improved by modifying the structure of the NNs, the number of neurons, and activation functions. The training and accuracy thresholds can be optimized to meet a particular specification. Additionally, measurements produced by other metering infrastructure could be leveraged to make the solution more robust.
In [58], smart meter and pseudo measurements are processed along with PMU and SCADA measurements as part of a Bayesian estimation solution. The principle behind this work is similar to that of [57]. A Bayesian estimator is once again used, but this time, it is a simpler maximum a posteriori (MAP) estimator, compared to the more complex MMSE in the previous technique.
As per Figure 5, the input from slower metering infrastructure is used to augment the PMU layer of the solution. The state equations developed in this solution resemble those of the Kalman filter, and they establish relationships between the different measurement layers:
where represents the state at the current sampling layer, and represents the state at the previous (slower) sampling layer. represents uncertainties between the two layers, is the error component at the current layer, and is the measurements at the current layer. An objective function for the estimated states is developed and minimized via the modified Newton method.
Abnormal data are detected via Chebyshev’s inequality.
where is a probability based on a credibility interval, and P is the covariance of the posterior state. The solution produced encouraging results relative to KF and hybrid estimation algorithms. This technique emphasizes a low computational burden and the adaptability of the solution to a variety of systems. One assumption that deserves further investigation was that of modeling the probability distributions as Gaussian. Assuming that the distributions were Gaussian allowed [58] to bypass the computationally intensive step of estimating probability distributions using complex techniques such as NNs, as was carried out in [57].
Integrated estimation formulations without the use of Bayesian techniques have also been proposed. As presented in [59,60], SCADA and RTU (remove terminal unit) measurements were used to obtain pseudo measurements which were then used in linear estimators that process PMU data in real time.
Trends: The most simple form of integrated estimation is the expansion of PMU-observability through the integration of other (slower) measurement sources, such as SCADA. The slower measurements are processed offline to obtain PMU pseudo measurements. Bayesian estimation appears to be experiencing a resurgence, as ML is being used to derive probability distributions that are then used for online estimation. Based on the results produced by works such as [57], ISE appears to have the potential to become a viable and powerful estimation platform in the near future until dynamic estimation becomes a widespread reality.
Gaps: Challenges in ISE can be attributed to the complexity involved in acquiring probability distributions for Bayesian-based ISE.
Key paper contributions in this topic are presented in Table 2.
4.3. Disturbance Detection
Solutions in the disturbance detection group aim to enhance the situational awareness of the grid. Events, such as switching and loading changes, and disturbances, such as faults, are monitored and reported by via holistic solutions. For example, in [61], big data is analyzed to detect disturbances at their inception giving system operators more time to react.
In [62], -PMUs are assumed to be located at the ends of a feeder. After an event is detected, changes in voltage and current are calculated at both ends.
These deviations are then used to determine the change in impedance
at both ends of the feeder. The sign (positive or negative) of the real component of each relative to each other is used to determine whether the disturbance is internal or external. Once the location of the disturbance has been identified, sweep forward and backward voltage calculations are performed to calculate the change in voltage at every node along the feeder. Discrepancies in nodal voltages are used to pinpoint the exact location of the events. Events such as the switching of capacitor banks, high and low impedance faults, and DERs changing status were identified by this technique. The concept is a relatively simple one to understand and to implement; however, considerable drops in performance were experienced as more complexities such as error in measurements, marginal stability, and high fault impedances were added to the events. This solution also lacked a well-defined scope and application. Despite a few shortcomings, this technique could serve as the foundation of a more robust solution, as was performed in [63], where ML techniques were used to extract additional features from data reported by PMUs. While this technique improved on the work of its predecessors, extensive training of ML algorithms represents an implementation challenge.
Another data-driven method was introduced in [64]. First, in order to reduce the data burden produced by PMUs, the minimum amount of data required to monitor the system is found by changing the sampling intervals of the measurements until estimates produce errors that violate a criterion. In other words, fewer data are used until the system can no longer be recognized. Once a satisfactory sampling interval has been established, principal component analysis is used to estimate key system parameters. Density-based clustering is then used to identify data outliers and locate them. This approach presented an interesting take on PMU data processing and is an approach that does not rely on sampling at the higher end of current PMU technology. As expected, lower sampling rates had a negative impact on performance, but a balance between the capacity of the PMUs, infrastructure available, and the requirements of the user can be used to optimize the operating parameters of the program.
PMUs and NNs were utilized for load forecasting in [65]. Meanwhile, in [66], NNs were used in a novel capacity to create heatmaps that were used to monitor system stability. The rotor angles of generators connected to a network were monitored and were used as input to the NN. This technique produced interesting results and presented stability information in a novel form. Several steps in this process were of empirical nature, in particular the structure and parameters of the NN. While the solution does not revolutionize the state of the art, it brings new ideas to the table.
Efforts in the area of situational awareness are also delving into system validation and topology. These efforts leverage PMUs to monitor changes in topology in order to deliver a comprehensive view of the grid in real time. Trees were used in [67] to monitor the topology of radial systems. In [68], results from simulations were used to build a database of baseline values which were then used to calculate differences between them and real-time measurements. This method uses these deviations as indicators of changes in topology. In [69], variations in topology were identified via -PMUs and power-flows.
Trends: The main trend in situational awareness is the development of holistic solutions that:
- Track deviations or changes in the system to uncover issues early.
- Facilitate the access to the true status of the system in terms of states, phasors, and topology.
This is carried out to enhance the level of knowledge of operators and the system, so that the decision-making process can be expedited. Given the diversity of the techniques used in situational awareness, it is difficult to identify a method or tool is that is being widely used.
Gaps: This area seems to lack focus, or least a well-defined goal or methodology. While some interesting ideas can be encountered in this area, presently it is hard to see any of them being implemented in the real world. One possible target of situational awareness could be to replace EMS (energy management system) systems in the future.
Key paper contributions in this topic are presented in Table 3.
5. Cybersecurity
Solutions developed for cybersecurity focus on the detection of malicious attacks on state estimators and grid control systems.
Cyber-Security Solutions
In [70], cyberattacks (CAs) in DE were detected via techniques borrowed from the field of system control. Modified versions of observers were developed, which were used to extract key system parameters. The equations used by this method bear some resemblance to those used to describe the Kalman filter in previous sections. Residuals were compared to a threshold to determine whether the corresponding state was under attack. A mitigation procedure was also introduced, where a weighted deterministic treat level (WDTL) was defined as
where z is the WDTL of the ith PMU, while Y and W are weight matrices. PMUs with high WDTL values are quarantined and their measurements removed from the estimation process. In order to ensure the system remains observable, some of the constraints of the estimation process are relaxed. This solution produced interesting results, indicating that this work has the potential to become a framework for future solutions. However, in the form presented in [70], the issue of how to handle the removal of a PMU that renders the system unobservable was not addressed in detail. Moreover, there are potential gaps in performance when highly dynamic conditions and marginal stability are introduced.
In [71], multiple types of CAs were mitigated. First, measurement attacks, which take place at the PMU level by either disabling or corrupting measurements [27], were detected by finding an MAP estimate of the attack parameter f as follows:
where the subscript represents predicted values. The expected value of an attack parameter f, at node i at a time T, is defined as
Parameter errors, defined as systemic errors at the database level [27], for instance, an attack that modifies the impedance matrix of the system, are detected through a filter. The output of the filter and the error parameters previously derived are used to calculate residuals via further filtering steps. While this technique takes a very important step in providing the means to detect both measurement and parameter errors, the formulation is highly complex compared to other solutions, such as those based on chi-squared error detection. The use of multiple filters simultaneously in addition to Bayesian estimation is an interesting approach that can be refined to reduce the computational and data-transfer burden of the solution. In [72], Bayesian-based approximation filters (BAFs) were deployed throughout the network in a distributed architecture approach.
In [73], ML was used to develop a distributed CA detection algorithm based on autoencoders. Detectors were deployed throughout the system and each one focused on identifying issues locally. This eliminates constant data transfer from each measurement node to a centralized location. The autoencoders were trained with historical data, and several features were used for anomaly detection such as voltages, currents, impedances, and phase angles. The technique performed well during testing, but, as is the case with ML-based approaches, additional work can be carried out to standardize the training process and streamline the tuning of parameters.
The technique presented in [74] focused on the elimination of biases that may occur in measurements provided by PMUs. States are projected unto a rectangular coordinate system where magnitudes and angles are monitored. The correction relies on redundancy provided by adjacent PMU nodes. In [75], when an abnormal result is obtained from the state estimator, data from multiple sources, including SCADA, PMU databases, and power-flows, are used to verify the validity of the estimated results. A similar approach was taken in [76], where PMU data, load forecasts, generation data, SCADA, and EMS were used to validate and correct abnormal results produced by state estimators. Several types of attacks were investigated in [77], including some that have the ability to remain undetected by commonly used bad-data detection methods. This solution proposes a technique for detecting and mitigating attacks where counter measures are taken based on deviations observed in the network’s impedance.
Trends: A recurrent theme in this area is the use of redundancy to identify and correct issues. In some solutions, this is performed by using PMUs to validate the results of static estimators. In others, PMU readings are validated by power-flow results. Utilizing multiple sources of information is the foundation of virtually all solutions in this area.
Gaps: Finding multiple sources of data is a very significant challenge. That means that these applications could be limited to highly monitored systems, such as critical infrastructure. Power plants could be a viable target audience for these techniques.
Key paper contributions in this topic are presented in Table 4.
6. Stability Applications
As previously discussed, improving state estimators was a pivotal need that drove the development of PMUs. This is because state estimators play a critical role in the mitigation of conditions that lead to instability.
6.1. Under Frequency Stability Applications of PMUs
Frequency stability (FS) is defined as the ability of a power system to maintain a steady frequency, and to recover or reconverge, at the nominal operating frequency following a disturbance that results in a significant imbalance between the generating capacity and the load connected to the power system [78]. The FS of a system is primarily driven by its ability to maintain or restore the load-generation balance while minimizing loss of load [79]. A common method of mitigating dips in frequency is the removal of load from the system so that the load-generation balance can be regained [80]. This process is called load shedding, and it is illustrated in Figure 6.
The work in [81] proposes an adaptive technique to UF load-shedding (UFLS). Traditional UFLS schemes are based on fixed values; when the system frequency dips below a given threshold, selected loads are disconnected from the system. While traditional UFLS schemes have provided satisfactory UF mitigation, they are not perfect as they do not adapt to the continuously changing conditions of the grid. Ref. [81] leveraged PMUs to develop an adaptive UFLS scheme that optimizes the load-shedding process. Once an appropriate amount of load has been shed, the system regains balance. The role of PMUs in this scheme is to provide measurements that are used to monitor the inertia and frequency of the system in real time. This solution produced satisfactory results, in some cases outperforming traditional UFLS schemes. The effectiveness of this scheme is influenced by the selection of the UF pickup settings. The selection of those settings was left unexplored, as was the selection of the load(s) to be shed. Both of these can be approached as optimization problems in an extension of this framework.
A more complete UFLS approach was presented in [82]. The fundamental idea of [82] is to estimate the state of the system’s frequency a few seconds in advance. When a UF condition is predicted, the solution finds a combination of loads to drop that matches the predicted power deviation. The mathematical models used in this solution are similar to the ones used in [81], and are omitted for brevity. The logic behind this approach is that by taking proactive actions, this solution mitigates unknowns such as breaker trip times. The predictions are made via polynomial curve fitting; this allows for a reduced number of PMUs to be used. Provisions are made in cases where an accurate estimate cannot be produced. The load-shedding step is broken into stages; this allows for further estimates and corrections in real time. This solution also presents a load-shedding philosophy and settings. Experimental results were favorable and the use of predictions for load-shedding is novel. This framework could be expanded by utilizing alternate means of prediction.
Works dedicated to the islanding process are presented in [83,84]. Ref. [83] introduced algorithms that calculate and find the load needing to be shed in order to regain balance. Ref. [84] examined the validity of commonly used anti-islanding methods based on frequency drift.
In [85], the feasibility of real-time and adaptive UF schemes based on PMUs was investigated through simulations. The results of the experiments validated the use of PMUs for these types of applications; however, some limitations were identified:
- Noisy measurements.
- Transients.
- Harmonics.
All had detrimental effects on the performance of the scheme. These issues can be addressed by adopting mathematical models which increase the system’s robustness to power/signal-quality-related issues. Increased filtering and data processing can also be applied to alleviate these issues at the expense of increasing the computational requirements. The issue of uncertainty in the context of UF schemes was also examined in [85]. Uncertainty limits in PMU-based UF schemes were evaluated.
Key paper contributions in this topic are presented in Table 5.
6.2. Transient Stability
TS examines the ability of generators connected to the power grid to remain synchronized in the aftermath of a disturbance [86]. How resilient the system is, is determined by the generators’ ability to maintain and regain a balance between electromagnetic torque and mechanical torque [79].
Among the first applications of PMUs in the area of stability was their integration into out-of-step (OOS) relaying schemes, as presented in [87,88]. Recently, more intricate techniques, such as [89], have been presented. In [89], system parameters were estimated via the UKF from a dynamic model based on the swing equation; details can be found in [90]. Once the system’s parameters have been established, individual component analysis [91] and the discrete Fourier transform (DFT) are used to divide the system into coherent groups (zones). At each zone, the equal area criterion is used to develop the OOS settings. Since the settings developed in this work are adaptive, they provide high selectivity compared to traditional OOS schemes. While promising, this technique relies on complex calculations at a centralized location. It also does not specify locations and the sampling rates of the PMUs involved. Finally, although the scheme is of an adaptive nature, initial settings are still developed using transitional techniques. Overall, this technique utilizes novel tools to develop clusters and adaptive OSS settings, but several open items are yet to be addressed.
Machine learning has been leveraged in the development of new TS solutions; [92] is an example of this. In this solution, a long short-term memory (LSTM) process, which is an improvement over the recurrent neural network (RNN), is trained offline to detect rotor angles that lead to instability. The output of the NN, y, is defined as
where
and is the maximum deviation between any two generators. After training, fixed time windows are used to update the stability thresholds. As new real-time data are processed by the algorithm, LSTM allows for fast results at the expense of decreased accuracy. In [93], NNs were used in a similar fashion to [92] to derive key parameters which were then used to produce coherent groups, as performed in [89]. In [94], an improved denoising autoencoder (DAE) and synthetic data were used to develop a TS scheme. These ML-based approaches displayed strong performance with rapid online calculations, which make them an attractive framework for future solutions; however, the process of training the NNs, the need to conduct a series of studies to extract important training data, and the optimization of PMU placement offer opportunities for improvement.
In [95], a predictive transient stability (TS) monitoring scheme was presented. After a disturbance occurs, the center of oscillations (CoO) triggered by the disturbance is located. This is achieved by relating the frequencies at two ends of a line, as follows:
Key paper contributions in this topic are presented in Table 6.
Where and represent the frequencies at each end of a line at time . Once the location of the CoO has been identified, a simplified equivalent model of the generator affected by the disturbance is created. The stability of the equivalent model is monitored via Lyapunov energy functions and Lyapunov’s direct method. By monitoring the potential energy of the system simultaneously with the total energy (the sum of potential and kinetic energies), the generator can be seen drifting into instability before any thresholds are surpassed. This allows for corrective actions to take place sooner than with traditional schemes, helping mitigate equipment damage and disturbances from escalating. As presented in [95], this solution was tested on relatively simple systems. More validation with larger, more complex systems should be carried out; however, this is a very promising solution that can serve as a foundation for future work.
As a power network reacts to transient, unintentional islanding of certain sections of the system could occur as the protection scheme attempts to isolate the problem. Unintentional islands tend to be at a higher risk of stability loss due to lack of contingencies and access to additional resources located outside of the island. These conditions are addressed in [96,97,98]. Ref. [96], proposed an improvement to non-detection zones (NDZs) via modal analysis. Ref. [97] focused on the communication requirements for anti-islanding schemes. In [98], simulations and decision trees were utilized to detect islanding. Decision trees were once again used in [99], but this time they were used to generate stability indexes.
6.3. Voltage Stability
VS examines the ability of a power system to maintain steady voltages across all of the buses in the system following a disturbance [80]. How resilient the system is, is determined by its capacity to meet the power demands of the load and prevent progressive changes in voltage [79].
In [100], a VS solution based on PMU measurements is presented. Thevenin equivalent models at each bus are produced and used to derive impedance values. Spline extrapolation is used to find the trajectory of the impedances as a function of loading. The maximum loading parameter at the bus is defined as the point along the impedance trajectory where is equal to , signaling the point of maximum power transfer. The bus with the lowest sets the maximum loading point for the whole system. This can be defined mathematically as
is then used to determine the voltage stability margin (VSM) of the whole system as
A relatively simple formulation and the utilization of well-known techniques are the strengths of this solution. It was assumed that accurate and reliable measurements were available through filtering techniques that were not part of the solution. The integration of data filtering into this solution presents one possible opportunity for improvement. The performance of the system in the presence of significant disturbances was also not explored.
In [101], a more complete solution composed of a VS index and a load-shedding scheme was presented. Similar to [100], parameters were calculated from Thevenin Equivalent circuits at each bus. These parameters were used to build a stability index. Each index value corresponded to a loading level. The following relations were used during the load-shedding step:
where is the difference in power between a stable loading point (index 2) and a unstable loading point (index 1). is a multiplier corresponding to the power factor of the load to be shed. This technique displayed a strong performance during testing. Once again, the simplicity of the method is a strength; however, more testing is needed to see how the algorithm performs in conditions of considerable measurement noise and transients.
ML techniques have also been leveraged in the development of VS solutions. In [102,103], solutions based on random forest algorithms that adapt to the operating conditions of the system were presented. Stability indexes were used in [104], where locations at risk of falling into instability were identified proactively. This was achieved though the use of equivalent network models obtained via PMUs. These network models were studied in real time to produce stability indicators.
Key paper contributions in this topic are presented in Table 7.
6.4. Small Signal Stability and Controller Design
Small signal stability focuses on the ability of the power system to remain synchronized in the presence of small disturbances [86]. The nature of small signal disturbances is related to oscillations produced by the mechanical dynamics of the generator and the auxiliary and control electronics around it [78]. This phenomenon is usually addressed through controllers [79], but in order for controllers to be effective, these modes of oscillation must first be identified. In [105], a regularized robust recursive least squares (R3LS) method was used to determine oscillatory modes from PMU measurements. This technique also utilizes moving averages and optimization tools to mitigate the impact of abnormal data. In [106], modes of oscillation in extra-high-voltage (EHV) lines were identified via hybrid dynamic models based on differential algebraic equations. Solutions developed to overcome challenges generated by the noise introduced by hardware were presented in [107,108]. Signals were analyzed in the Fourier spectrum to obtain eigenvalues in [109]. Empirical mode decomposition (EMD) and wavelet shrinkage analysis were used in [110]. The Hilbert transform, together with synthetic measurements, were utilized in [111]. Low signal–noise-ratio conditions were examined and mitigated through a self-coherence method in [112]. Once a suitable method for the identification of oscillatory modes has been selected, a controller can be designed.
In [113], a wide-area damping controller (WADC) based on robust control is presented. This controller is used to damp and eliminate low-frequency oscillations while considering variables such as latency in communication networks, and data transmission failures. The controller’s gain varies over time to adapt to the dynamic conditions of the system. The design of the controller is finalized by applying stability constraints and performance indexes in a minimization procedure. The results produced by this solution are encouraging, and its use of adaptive parameters is an improvement over traditional controllers.
In [114], a TS solution via distributed control is presented. This solution leverages the continuous data influx provided by PMUs to provide a controller with adaptive gains, as seen in [113]. They key difference between the two approaches is that [114] does not rely on centralized data processing. The distributed nature of this approach translates into a significantly lower strain on the communication network, as well as increased security in case of a cyberattack, since losing one single control point will not cause the entirety of the control system to collapse. The controller used in this work is of the robust type, and the system’s model is derived from the swing equation. The objective of the controller is to ensure that the rotor angle matches the target angle by actuating distributed storage sources (DSSs). Global stability constraints are developed via Lyapunov stability analysis to ensure the system as a whole is stable. This method displayed a strong performance; however, some open items remain in terms of the availability and capacity of DSSs, and the frequency at which parameters are updated at both the local and the global level.
Several distributed control algorithms are presented in [115]. The principal motivation behind the development of these distributed solutions is the simple fact that current communication infrastructure will not be able to handle the myriad data that could be generated by centralized synchrophasor applications [116]. In [117], it was shown how distributed computing technology is likely to grow at a faster rate than the communication infrastructure needed to support centralized solutions. Ref. [115] makes a significant contribution by not only formulating a mathematical solution but also elaborating on the system architecture to support it. The algorithms at each processing location are based on eigenvalue estimation. Several architectures with varying degrees of communication in between processing nodes are presented. Architectures with global consensus presented advantages in terms of coping with network delays and data privacy; however, they presented several drawbacks, such as single point failure exposure due to the central point of communication, as well as high volumes of data traffic. When a central communication node was removed, and each processing location communicated with a sub-set of locations, the exposure created by a single point failure was eliminated. However, with this configuration, delays become more consequential, data privacy is decreased, and data traffic volumes remain high. An architecture combining the two aforementioned architectures delivers a system network where processing nodes are grouped into areas. Within each area, there is communication between the processing nodes, but only one of them communicates with a central unit. The central node communicates with one specific processing unit in each area. With this configuration, the exposure presented by the single point of failure returns. Additionally, data privacy and delays remain a problem. However, this configuration alleviates the data volume issues present in the other architectures. Clearly, a one-size-fits all architecture is far from finalized, and it is very likely that compromises will need to be made depending on the requirements present at each location. Communication challenges in the context of PMUs are further explored in [118,119]. Obstacles encountered in centralized architectures are emphasized in [120], while [121] focuses on challenges specific to distributed architectures.
As seen in other areas of stability, indexes have been proposed for small-signal stability. In [122], eigenvalues and their corresponding modes are monitored and given a rank. This solution is based on graph theory and decision trees.
Trends: For the area of stability, the discussion of trends and gaps was combined into one. Across the field of stability, a prominent movement is the development of predictive techniques. Since the loss of stability happens gradually (not instantaneously), and given the computing capacity of modern computers and relays, the trend is to identify conditions that will lead to the loss of stability while the system is still operating under normal conditions. This allows the system to optimize its response. In some cases, that response could be to separate the system into islands; with a predictive approach, an optimization routine could be used to calculate and find the precise amount of load needed to be shed. The use of adaptive thresholds is also a significant trend in stability.
Gaps: Latency will always be a factor in time-constrained applications. The robustness of data during heavy disturbances is an aspect that could have a detrimental impact on the performance of these techniques. Methods designed to provide reliable results during fault conditions can be found in Section 4.1. It must be noted that since these solutions make decisions upon identifying a drift into instability, the impact of latency and disturbance-related distortions is expected to be moderate compared to solutions that take a more reactive approach (those that wait until stability thresholds have been surpassed).
Key paper contributions in this topic are presented in Table 8.
7. Power System Protection
This section is divided into three areas, as seen in Figure 1. Some of the applications in transmission protection share the same foundation and execution approach as some of the applications designed for distribution protection. However, it must be understood that the constraints and obstacles presented at those two levels of power delivery are vastly different, and therefore, those applications deserve to be examined independently. A third subsection is dedicated to specialized protection applications of PMUs, where more experimental, yet intriguing, techniques are presented.
Several of the solutions covered by this work deal with the topic of adaptive protection (AP). AP schemes are used to cope with drastic changes in the available fault current of a system. With the increasing penetration of distributed generation (DG), fixed protective settings can leave the system exposed during certain operating conditions. Figure 7 illustrates a condition where four sources are connected to a system when a fault occurs (left). With the four sources connected, the system can supply enough current to trip the corresponding breakers and clear the fault, preventing further damage (right) [123].
On the other hand, if some of the sources are removed from the system and a fault occurs, as seen in Figure 8 (left), it is possible that the remaining sources might not be able to supply enough fault current to operate the protective devices [123]. This type of situation can lead to larger outages (upstream breakers tripping) and equipment damage (the line burning), and represents a clear safety hazard [80].
While these scenarios might seem far-fetched, one must remember that the typical inverter will shut itself off once its current output reaches 1.5–2 PU [124]. One possible solution could be to install multiple relays, but that option is not the most cost-effective. Directional relays can alleviate the issue, but do not always offer a complete solution. Another alternative could be to program multiple sets of settings into a relay. The problem with that is that while modern relays can have multiple settings groups programmed into them, switching from one set of settings to another usually requires human interaction, either in person or remotely, and some relays require a reboot when another group of settings is selected, meaning that the relay (and protection) will be disabled for several seconds [125]. As a result of these limitations in OC protection, AP schemes are being developed to dynamically adapt to the various operating conditions that the modern grid can present [80].
7.1. Distribution
In [126], a distributed approach for fault detection and location in active distribution networks is presented. The fundamental idea is to leverage PMU measurements as inputs for multiple linear weighted least squares state estimators (LWLS-SE). The estimation step is a familiar one, similar to the estimation techniques presented in Section 4. This approach assumes that all buses in the network are equipped with PMUs. The status of key devices, such as circuit breakers, is taken into account when the admittance matrices corresponding to each estimator are built. This is achieved by assuming that the status of the device is sent to the PMU. Errors are detected via a metric called weighted measurement residual ().
The s of all the LWLS-SEs are calculated and compared. If a line’s deviates from the mean for two consecutive time-steps at an increasing rate, the line is flagged as faulted. The of all the faulted lines are then compared, the largest deviation revealing the true faulted line. The results of simulations produced encouraging results in regards to its accuracy and ability to detect a variety of faults types, with a reasonable processing time of under 122 ms. The algorithm displayed a strong performance in the presence of DGs. Another advantage is the use of well-known estimation techniques, although, as mentioned before, classical estimation techniques underutilize PMU measurements. The assumption that every bus is equipped with a PMU is a strong one, particularly at the distribution level. It is unclear how this method would perform in a system with a large number of buses. Performance would be expected to decline as the number of buses increases due to communication latency and processing times when comparing a large number of residuals.
A dynamic setting-less protection scheme is presented in [127]. This solution takes a decentralized approach to alleviate the strain that DE can place on communication networks due to high data-transfer rates. This technique assumes that key components, such as transformers, generators, and converters, are equipped with PMUs or other metering devices capable of high sampling rates. DE is performed locally at these key locations with chi-square testing used to detect anomalies. The estimated states are given a time stamp and sent over to a central location where classical SSE for the complete system is performed. This technique assumes that PMU sampling rates of 60 Hz are available at the DE locations. This sampling rate makes it possible to apply the dynamic models this technique uses to describe the behavior of the devices being monitored. Once again, differential protection is used as the foundation of this DE-based protection scheme. This work is based on the premise that when internal faults occur, the WSL estimates will have large errors, while external faults will only produce slight errors, if any at all. The chi-square test with v degrees of freedom is defined as
where v is the difference between the number of measurements m and the number of states n. is the estimated measurement and is the actual measurement. When reaches a critical value, the corresponding estimate is classified as abnormal. This method showcased a significant degree of sensitivity as it was able to correctly identify high-impedance faults and in some cases outperformed differential protection. This strong performance can be attributed to use of dynamic models which allow for an in-depth look into the behavior and condition of the system. While it is encouraging to see techniques pushing the boundaries of current technology, it must be noted that high-end relays are currently capable of sampling rates of only 30 Hz [128], meaning that presently, this technique could only work with PMUs or other devices with high sampling rates. Another drawback of this technique is that implementing it could require significant engineering work as parameters such as flux linkages and mutual/self impedance would have to be calculated beforehand.
Ref. [129] introduces an adaptive protection scheme that focuses on the impedance angles of a line. This technique assumes that both ends of a line are monitored by PMUs. The readings of the two PMUs are utilized to estimate impedance angles which are then tracked in a polar coordinate plane. This technique is similar to distance or impedance relaying, where the magnitude and angle of the apparent impedance of a line is used to identify faults. The impedance angles are calculated through a very simple approach:
where is designated as the positive sequence integrated impedance. Similarly, the angles or integrated impedance angles s are calculated as
where the subscripts 1 and 2 represent the ends of the line. These voltages and currents are found via KCL (Kirchhoff’s current law) and KVL (Kirchhoff’s voltage law). Slight modifications are made to the equations above to account for various modes of operation and fault types. The capabilities of the PMU are leveraged to capture measurements during disturbances. Zones related to different operating conditions, based on impedance angles, were determined empirically. It was found that, in general, impedance angles between 5 and degrees from the origin represent normal conditions. Angles between 5 and 90 degrees represent external faults, while angles between and degrees represent internal faults. Calculated impedance values at both ends of the line are used to provide redundancy. This solution’s results were robust, even in the presence of high-impedance faults, and as DG sources were added and removed. The highlight of this technique is its simplicity; however, its reliance on empirical data deserves further investigation. Additionally, multiple equations and relationships are estimated by this technique; however, it is not clear how they are applied once a disturbance has been identified.
A distribution protection scheme developed to provide consistent performance across a wide range of topologies and disturbance events is presented in [130]. Changes in topology and DGs are considered in [131]. Multiple metering sources are utilized in the protection scheme presented in [132]. Overload conditions in distribution lines are addressed in [133].
Trends: In distribution, adaptive protection is taking a more central role as researchers look for ways to provide reliable protection in the presence of microgrids and distributed generation. This is a key issue that modern relays have not fully addressed.
Gaps: PMU-observability becomes a major issue at the distribution level. -PMUs could play a central role in making these solutions feasible. Presently, these solutions could be limited to microgrids.
Key paper contributions in this topic are presented in Table 9.
7.2. Transmission
As PMUs communicate to produce synchrophasor measurements, a latency is introduced by the communication network. In general, a delay between 40 to 100 ms is to be expected from the moment a reading is taken to the moment the measurement becomes available at another location in the network [80]. In the relaying world, where decisions and actions are measured in terms of cycles, 40 to 100 ms is a significant delay; this delay makes WAMs not suitable for high-speed protection. At the transmission level where distance relaying is widely used, high-speed protection corresponds to Zone 1, where delays are normally not introduced. For a Zone 1 event, a modern relay is expected to operate in fewer than 1.5 cycles [128]. However, as delays are introduced in Zones 2 (200 to 500 ms), and 3 (400 ms to 1 s) [134], the integration of WAMs into protection schemes becomes feasible. These three zones of protection are illustrated in Figure 9. Zones 2 and 3 provide a redundancy or backup to outer areas in case primary protection fails at those locations. Given the delayed nature of PMU-based protection, the following solutions are presented as backup protection schemes intended to complement traditional relay-based protection.
In [135], a PMU-based backup protection scheme is presented. This technique aims to provide reliable backup protection without highly complex computations during conditions of high stress for the grid. The operating principle behind this technique is a variation of voltage differential protection. Measurements at both ends of a line are used to derive the following voltage and current relationships:
where is the propagation constant and L is the length of the line. represents the surge impedance of the line, and the number 1 in the subscript represents positive sequence values. Deviations in voltage are used to build an index that is then used to identify abnormal conditions such as faults. The lines that produce abnormal voltage deviations are selected for further analysis where the following parameter is calculated:
where A and B represent line parameters calculated during the fault. The values of the lines involved in the disturbance are compared to determine the location of the issue. The premise presented by this technique is that examining voltages can lead to a more robust detector during disturbances which can prevent misoperations seen in current-based protection. This work also includes its own algorithm for optimal PMU placement; this algorithm is similar to the ones covered in Section 4. This technique provided acceptable results across a variety of tests. The main appeal of this solution is its simplicity and relatively low computational burden. One drawback is that perhaps this technique does not tap into the full capacity of PMUs.
In [136], in addition to using voltage readings to identify issues, as in [135], frequency data are integrated into the algorithm. Voltage measurements are compared to an average that is recalculated every n cycles. PMUs whose readings are flagged as abnormal are then tracked for n cycles and are assigned a value based on their deviations from the average. The readings with the largest cumulative deviation are sent to another module where events are classified via feature extraction. In the classifier module, a variant of the wavelet transform is applied to extract the oscillatory modes corresponding to the measurements during the disturbance. The dominant spectral component, skewness, distortion, and the rate of change of the spectral components are some of the features used to build event profiles which are then fed to an ML algorithm that identifies the event class. Overall, this technique displayed a strong performance with reasonable processing times. Some opportunities for improvement can be found when dealing with switching events, as this solution struggled to identify these occurrences. As is the case with solutions that integrate ML or NNs into the algorithm, the process for choosing the optimal parameters and structure of the NN deserves further investigation. It is important to note that these types of solutions test the capabilities of PMUs, as they leverage the high sampling rates of PMUs to develop algorithms that process data across multiple domains. Rigorous applications such as this one can lead to further improvements in technology.
In [137], an adaptive PMU-based protection scheme is presented. This scheme utilizes techniques that are popular in classical estimation; this allows for ease of implementation with a relatively low computational burden. Overall, the approach is similar to other techniques previously discussed. A key distinction lies in its use of backup protection zones (BPZs). After a PMU-placement algorithm determines the optimal locations for PMU installation, this technique proceeds to divide the system into subsections. These subsections, referred to as BPZs, are established based on observability and network topology. The principle behind BPZs is similar to differential protection, where the sum of the currents entering the zone must equal the sum of the currents leaving the zone [80]. Faults are identified when the currents entering a zone exceed a threshold. These relationships are determined as follows:
where is the current threshold. is defined as
where represents the current of a line. is simply the sum of the line currents at the bus. The adaptive aspect of this technique is accomplished by updating the every minute. When a fault is identified, voltage–current relationships of the affected BPZ are used to locate the fault via linear least squares. This solution is based on tried-and-true techniques (differential protection and linear regression) and, as expected, produces solid results. Solid performance combined with relatively simple implementation make this solution appealing. Opportunities for improvement exist in the following forms: This technique has requirements regarding topology, which means that the algorithm might struggle to maintain the same levels of performance when applied in systems with a complex topology. The solution also does not address distributed generation and the potential impact on fault current flows. Finally, the solution is rather rudimentary and does not make the most of synchrophasor technology.
Another type of transformation, in this case the Hilbert transform, is applied in the solution presented in [138]. The Hilbert transform has some parallels with the popular Fourier transform. Test results showcased the method’s ability to produce accurate estimates in the presence of noise, harmonics, and decaying DC components, but the PMU-sampling rate was still on the higher end of the range at 128 Hz. Moreover, the technique was tested on rather a simple system. Modifying the technique so that it can function with lower sampling rates, and performing additional testing with more complex systems, offer opportunities for improvement.
In [139], the principle of integrated impedance is used to formulate a backup protection solution for transmission lines. The operating principle is similar to the one presented in [129], which is itself similar to impedance-based protection. Meanwhile, ref. [140] expands the principles presented in [129,139] to produce a formal wide-area protection scheme. In particular, ref. [140] address backup protection for adjacent lines. The direction of the fault currents seen by the PMUs and their relative locations are used to coordinate the backup operation. During testing, this scheme displayed an acceptable level of performance. There are several ways this solution can be improved, but the main takeaway is that [140] shows how PMU-based protection can be expanded and formulated as a formal protection scheme. A predictive blocking scheme is presented in [141] to prevent misoperation in the Zone 1 of distance relays to due transients. Modal decomposition is used in [142] to formulate an adaptive protection scheme for parallel transmission lines. Symmetrical components and a modified version of the discrete Fourier transform (DFT) are used in [143] to protect EHV transmission lines. Two-terminal protection schemes for transmission lines are presented in [144,145]. These solutions are reportedly highly accurate, but require PMUs at both ends of the line. A technique designed to be robust in presence of errors is presented in [146].
Trends: In regard to transmission protection, backup and adaptive schemes are the most investigated applications. Backup applications, which include time delays by design, are able to leverage PMUs to locate faults and coordinate corrective actions. Adaptive and setting-less protection are also used in applications closely related to stability. Most techniques appear to be a variation of either differential or impedance/distance protection. Many techniques are taking a decentralized approach and modify the techniques discussed in Section 4.1 for the purposes of protection.
Gaps: The majority of PMU-based protection applications seem incomplete. For instance, coordination, which is a critical aspect of protection, is covered by only a few solutions.
Key paper contributions in this topic are presented in Table 10.
7.3. Specialized Techniques
Finally, in this section, this manuscript reviews specialized applications of PMUs of a more experimental flavor. As made evident by several techniques presented in this work, the synchronization and high sampling rates of PMUs allow for new venues of power system analysis. Transient and dynamic behavior provide a wealth of insight into the system being studied [116]. These types of events are invisible to traditional metering infrastructure, and although modern digital relays and DFRs are capable of capturing disturbances at high resolutions, recording in these devices is usually triggered by disturbances, which makes them reactive tools rather than a proactive means of protection. Equally fundamental is the synchronization of the measurements which allows for the dynamic estimation of crucial system parameters [8]. This section focuses on the development of PMU-based solutions for HIFs (high-impedance faults). Overcurrent protection has led to to the development of myriad protection schemes due to its reliability, effectiveness, and simplicity [80]. However, as the grid evolves, more complex, and in some cases stochastic, events have appeared. These events have forced protection engineers to find alternative means of protection beyond overcurrent based schemes. For instance, at the transmission level, distance (impedance) protection is generally the default protection scheme, and it monitors voltage–current relationships in addition to the apparent impedance angle. Another example are voltage differential schemes, which track changes in bus voltage instead of currents at locations where monitoring changes in current becomes unfeasible due to high current magnitudes or CT ratios that are hard to match [134]. A very important, yet relatively overlooked, problem in power system protection is the issue of HIFs. This is an area where overcurrent protection has historically struggled due to the relative low current magnitudes and the highly stochastic nature of these faults. In many cases, HIFs are not detected and the fault either clears itself (a tree branch is completely burned through), or the HIF escalates into a more severe fault (higher current magnitude) [147]. Several techniques reviewed in previous sections were capable of detecting and locating HIFs; however, in most cases that was a byproduct of the solution and therefore the typical obstacles associated with HIFs were not fully explored. The following three techniques take a deeper dive into HIFs and highlight some of the obstacles the state of the art is yet to overcome.
In [148], ML and PMUs are leveraged to uncover the key features of HIFs so they can be used for HIF detection. Mathematically, the solution is based on the findings of [147], which introduced a popular version of the anti-parallel source-diode HIF model. This model has become widely used and highly influential in the area of HIFs. The reason for its popularity is that it manages to emulate many of the complex features of HIFs. While powerful, the application of this model requires extensive simulation where faults are modeled using many different combinations of fault parameters, which is clearly very impractical. In [148], simulation data using the anti-parallel source-diode HIF model are used to train a semi-supervised learning algorithm. The solution produced strong results across several categories, including accuracy and robustness to noise; however, this solution does not address the fundamental problem of HIFs: their stochastic nature.
The solution presented in [149] suggests a drastic move away from traditional techniques that attempt to model and predict key characteristics of HIFs, such as [148]. Instead, this solution focuses on monitoring deviations from a benchmark. A general data-driven solution is emphasized with little to no input from humans. First, currents and voltages at both ends of a line are utilized in a subspace estimation procedure with the goal of curve fitting. In order to increase the reliability of the solution, timers and multiple zones of protection (boundaries) are utilized, similar to those seen in OOS protection. When an eigenvalue drifts outside of the inner zone, a timer starts; if the eigenvalue returns to the inner zone before the time expires, no events are flagged and the parameters of the cluster are updated. If, on the other hand, the eigenvalue does not return to inner zone on time or drifts outside of the outer zone, the event is flagged as a fault. The solution displayed extreme sensitivity when detecting faults, as it was able to detect faults with a resistance of 1000 , which is much higher than most HIF solutions, even those utilizing PMUs. It must be noted that this solution completely eliminates the need to model the stochastic behavior of HIFs, and it instead establishes a reference or baseline of normal eigenvalue behavior. The sensitivity displayed by the technique did come at a price, however, as sudden increases in the level of noise of the measurements can result in false positives.
In [150], a solution for fault location in underground systems is developed. By leveraging measurements at both ends of a cable via PMUs, a model based on symmetrical components is estimated. This solution focuses on monitoring the capacitance of the cables. Changes in capacitance can be used to detect degrading insulation which is closely related to faults. As it relates to underground systems, capacitance-based fault location might offer some advantages over impedance-based fault location, in particular when dealing with ground faults. The results of the solution are interesting; however, it was noted that the accuracy of the solution fluctuated as the length of the line varied. In addition to length-related limitations, this technique was not tested with resistances beyond 100 .
The solutions presented in this section demonstrate that PMUs can be capable of offering more than just backup protection, and in some cases they can become the primary source of protection.
8. Discussion
In regards to estimation and observability, most solutions rely on sampling rates on the higher end of the PMU spectrum (60 Hz or higher), which might make them unpractical in the short term. The vast majority of buses do not have PMUs installed, and while modern relays, such as the SEL421, produce sychrophasor measurements, they do so at rates of 30 Hz [128]. It is likely that in the future, PMU-observability will be possible through a combination of PMUs, -PMUs, and PMU-ready relays; however, the sampling rates will likely be below 60 Hz, as older units are combined with newer PMU models. Researchers should take this limitation into account when developing solutions, as solutions with less stringent sampling rate requirements will have a higher degree of feasibility.
In the mid-term future, integrated techniques appear to be very promising as they could be capable of delivering quasi-dynamic estimation by leveraging various types of metering infrastructure in addition to PMUs.
Many techniques do not appear to utilize the full capabilities of PMUs and simply take measurements and process them using traditional tools such as WLS. On the other hand, mathematical techniques that produce predictions or estimates into the future, such as filtering or Bayesian estimation, have produced encouraging results cross multiple areas, yet they remain relatively unexplored.
ML- and NN-based techniques are far from general, as they require a high degree of customization, which makes it difficult to reproduce the findings reported by their authors.
In the context of protection and control, most solutions do not take into account or leverage status sharing and reporting that already exists in between devices and EMS, such as breaker open/closed status. Many of the techniques presented do not offer a formal or complete solution. When developing a solution in the area of protection, researchers should ensure that the technique offers an improvement over modern relaying techniques. Many of the methods discussed in this work assumed that PMUs are installed at every bus, and in that case, it would be fair to compare those solutions to systems where modern digital relays are located at the ends of every line. A simple differential scheme is capable of detecting and locating faults with accuracy while using standard, off-the-shelf equipment [151,152].
Finally, there is strong evidence that indicates that the future of synchrophasor-based power system applications might be in the form of distributed schemes. That is due to the immense burden that centralized dynamic PMU communication will place on the networks [115,116]. It has been suggested that distributed solutions can deliver performances comparable to those by centralized solutions, with lighter data traffic and with increased network security [153].
9. Conclusions
This work provided an overview of current research trends and applications of synchrophasor technology. The majority of the solutions discussed in this document were released within the last five years, and can, therefore, be considered state of the art. These solutions were divided into four areas: estimation, monitoring, stability, and protection. In most cases, these solutions spanned across multiple categories, indicating that there might be opportunities to find synergy among them. Indeed, fundamentally all of the applications reviewed can be approached as goodness-of-fit problems. During this review, it was found that many techniques do not utilize PMUs to their full capacity. Many of them rely on classical processing techniques such as WLS estimation, and basic voltage–current relationships, which have benefits as they are easy to understand and require relative low computing power, but do not truly advance the state of the art. While some of the more experimental techniques might not be feasible in the immediate future, they play a key role in testing the capabilities of modern PMUs and providing a framework for future advancements. Techniques utilizing mathematical transformations and alternative means of estimation such as Bayesian estimation have provided very promising results, yet they remain largely unexplored. Tools such as machine learning and neural networks can also be leveraged to bridge gaps in existing schemes; however, ML-based solutions carry an inherent lack of generality, which can make them impractical. Widespread dynamic solutions will likely not be feasible in the near future due to lack of infrastructure, yet they are the focus of the majority of research efforts related to PMUs. On the other hand, a new paradigm in between static and dynamic, which might become feasible in the near future, is largely unexplored. Quasi-dynamic solutions, which integrate measurements from meters at multiple sampling rates, could become pivotal in smart grid applications in the near future. Similar to dynamic techniques, centralized solutions are also the subject of significant research, despite the fact that their feasibility has been called into serious question.
Author Contributions
Conceptualization, G.P.; methodology, G.P.; software, G.P.; validation, G.P.; formal analysis, G.P.; investigation, G.P.; resources, G.P.; data curation, G.P.; writing—original draft preparation, G.P.; writing—review and editing, A.B.; visualization, G.P.; supervision, A.B. and S.M.; project administration, G.P.; funding acquisition, A.B. and S.M. All authors have read and agreed to the published version of the manuscript.
Funding
This research was funded by National Science Foundation grant number ECCS-1809739.
Institutional Review Board Statement
Not applicable.
Informed Consent Statement
Not applicable.
Data Availability Statement
Not applicable.
Conflicts of Interest
The authors declare no conflict of interest.
Abbreviations
The following abbreviations are used in this manuscript:
| WAMs | Wide Area Measurements |
| PMU | Synchronized Phasor Measurement Unit |
| UF | Underfrequency |
| FS | Frequency Stability |
| VS | Voltage Stability |
| TS | Transient Stability |
| NN | Neural Network |
| ML | Machine Learning |
| SE | State Estimation |
| SSE | Static State Estimation |
| DSE and DE | Dynamic State Estimation |
| ISE | Integrated State Estimation |
| SCADA | Supervisory control and data acquisition |
| KF | Kalman Filter/Filtering |
| SM | Smart Meters |
| WSL | Weighted Least Squares |
| DER | Distributed Energy Resources |
| MAP | Maximum a Posteriori Estimation |
References
- Taft, J.D. NASPInet 2.0 Architecture Guidance Version 1.19. 2019. Available online: https://gridarchitecture.pnnl.gov/media/NASPInet (accessed on 7 July 2022.).
- Phadke, A.G. Synchronized phasor measurements-a historical overview. Eee/Pes Transm. Distrib. Conf. Exhib. 2002, 1, 476–479. [Google Scholar] [CrossRef]
- Chakrabortty, A.; Khargonekar, P.P. Introduction to wide-area control of power systems. In Proceedings of the 2013 American Control Conference, Washington, DC, USA, 17–19 June 2013; pp. 6758–6770. [Google Scholar] [CrossRef]
- North American Synchrophasor Initiative. Available online: www.naspi.org (accessed on 17 February 2022).
- IEEE Std C37.118.1-2011 (Revision of IEEE Std C37.118-2005); IEEE Standard for Synchrophasor Measurements for Power Systems. IEEE Standards Association: Piscataway, NJ, USA, 2011. [CrossRef]
- Phadke, A.G. Synchronized phasor measurements in power systems. IEEE Comput. Appl. Power 1993, 6, 10–15. [Google Scholar] [CrossRef]
- Wakti, M.H.; Hadi, S.P.; Putranto, L.M. PMU Installation to Increase The Accuracy of State Estimation. In Proceedings of the 11th International Conference on Information Technology and Electrical Engineering (ICITEE), Pattaya, Thailand, 10–11 October 2019; pp. 1–6. [Google Scholar] [CrossRef]
- De La Ree, J.; Centeno, V.; Thorp, J.S.; Phadke, A.G. Synchronized Phasor Measurement Applications in Power Systems. IEEE Trans. Smart Grid 2010, 1, 20–27. [Google Scholar] [CrossRef]
- Monticelli, A. Electric power system state estimation. Proc. IEEE 2000, 88, 262–282. [Google Scholar] [CrossRef]
- Manousakis, N.M.; Korres, G.N.; Georgilakis, P.S. Taxonomy of PMU Placement Methodologies. IEEE Trans. Power Syst. 2012, 27, 1070–1077. [Google Scholar] [CrossRef]
- Baldwin, T.L.; Mili, L.; Boisen, M.B.; Adapa, R. Power system observability with minimal phasor measurement placement. IEEE Trans. Power Syst. 1993, 8, 707–715. [Google Scholar] [CrossRef]
- Aminifar, F.; Khodaei, A.; Fotuhi-Firuzabad, M.; Shahidehpour, M. Contingency-Constrained PMU Placement in Power Networks. IEEE Trans. Power Syst. 2010, 25, 516–523. [Google Scholar] [CrossRef]
- Li, Q.; Cui, T.; Weng, Y.; Negi, R.; Franchetti, F.; Ilic, M.D. An Information-Theoretic Approach to PMU Placement in Electric Power Systems. IEEE Trans. Smart Grid 2013, 4, 446–456. [Google Scholar] [CrossRef] [Green Version]
- Kekatos, V.; Giannakis, G.B.; Wollenberg, B. Optimal Placement of Phasor Measurement Units via Convex Relaxation. IEEE Trans. Power Syst. 2012, 27, 1521–1530. [Google Scholar] [CrossRef]
- Pal, A.; Vullikanti, K.S.; Ravi, S.S. A PMU Placement Scheme Considering Realistic Costs and Modern Trends in Relaying. IEEE Trans. Power Syst. 2017, 32, 552–561. [Google Scholar] [CrossRef]
- Zhao, J. Power System Dynamic State Estimation: Motivations, Definitions, Methodologies, and Future Work. IEEE Trans. Power Syst. 2019, 34, 3188–3198. [Google Scholar] [CrossRef]
- Welch, G.; Bishop, G. An Introduction to the Kalman Filter; TR 95-041; UNC-Chapel Hill: Chapel Hill, NC, USA, 2006. [Google Scholar]
- Ghahremani, E.; Kamwa, I. Dynamic State Estimation in Power System by Applying the Extended Kalman Filter with Unknown Inputs to Phasor Measurements. IEEE Trans. Power Syst. 2011, 26, 2556–2566. [Google Scholar] [CrossRef]
- Zhao, J.; Netto, M.; Mili, L. A Robust Iterated Extended Kalman Filter for Power System Dynamic State Estimation. IEEE Trans. Power Syst. 2017, 32, 3205–3216. [Google Scholar] [CrossRef]
- Wang, S.; Gao, W.; Meliopoulos, A.P.S. An Alternative Method for Power System Dynamic State Estimation Based on Unscented Transform. IEEE Trans. Power Syst. 2012, 27, 942–950. [Google Scholar] [CrossRef]
- Singh, A.K.; Pal, B.C. Decentralized Dynamic State Estimation in Power Systems Using Unscented Transformation. IEEE Trans. Power Syst. 2014, 29, 794–804. [Google Scholar] [CrossRef] [Green Version]
- Zhao, J. Dynamic State Estimation with Model Uncertainties Using H∞ Extended Kalman Filter. IEEE Trans. Power Syst. 2018, 33, 1099–1100. [Google Scholar] [CrossRef]
- Qi, J.; Sun, K.; Wang, J.; Liu, H. Dynamic State Estimation for Multi-Machine Power System by Unscented Kalman Filter with Enhanced Numerical Stability. IEEE Trans. Smart Grid 2018, 9, 1184–1196. [Google Scholar] [CrossRef]
- Dykstra, R.L. An Algorithm for Restricted Least Squares Regression. J. Am. Stat. Assoc. 1983, 78, 837–842. [Google Scholar] [CrossRef]
- Van Der Merwe, R.; Wan, E.A. The square-root unscented Kalman filter for state and parameter-estimation. In Proceedings of the IEEE International Conference on Acoustics, Speech, and Signal Processing. Proceedings (Cat. No.01CH37221), Salt Lake City, UT, USA, 7–11 May 2001; Volume 6, pp. 3461–3464. [Google Scholar] [CrossRef]
- Julier, S.; Uhlmann, J.; Durrant-Whyte, H.F. A new method for the nonlinear transformation of means and covariances in filters and estimators. IEEE Trans. Autom. Control. 2000, 45, 477–482. [Google Scholar] [CrossRef] [Green Version]
- Bretas, A.S.; Bretas, N.G.; London, J.B.A.; Carvalho, B.E.B. Cyber-Physical Power Systems State Estimation, 1st ed.; Elsevier: Amsterdam, The Netherlands, 2021. [Google Scholar]
- Da Silva, A.M.L.; Do Coutto Filho, M.B.; Cantera, J.M.C. An Efficient Dynamic State Estimation Algorithm including Bad Data Processing. IEEE Trans. Power Syst. 1987, 2, 1050–1058. [Google Scholar] [CrossRef]
- Gou, B.; Kavasseri, R.G. Unified PMU Placement for Observability and Bad Data Detection in State Estimation. IEEE Trans. Power Syst. 2014, 29, 2573–2580. [Google Scholar] [CrossRef]
- Zhang, L.; Abur, A. Strategic Placement of Phasor Measurements for Parameter Error Identification. IEEE Trans. Power Syst. 2013, 28, 393–400. [Google Scholar] [CrossRef]
- Aminifar, F.; Shahidehpour, M.; Fotuhi-Firuzabad, M.; Kamalinia, S. Power System Dynamic State Estimation with Synchronized Phasor Measurements. IEEE Trans. Instrum. Meas. 2014, 63, 352–363. [Google Scholar] [CrossRef]
- Irving, M.R.; Owen, R.C.; Sterling, M.J. Power System State Estimation Using Linear Programming. Proc. Inst. Electr. Eng. 1978, 125, 879–885. [Google Scholar] [CrossRef]
- Göl, M.; Abur, A. A Robust PMU Based Three-Phase State Estimator Using Modal Decoupling. IEEE Trans. Power Syst. 2014, 29, 2292–2299. [Google Scholar] [CrossRef]
- Ashton, P.M.; Taylor, G.A.; Irving, M.R.; Pisica, I.; Carter, A.M.; Bradley, M.E. Novel application of detrended fluctuation analysis for state estimation using synchrophasor measurements. IEEE Trans. Power Syst. 2013, 28, 1930–1938. [Google Scholar] [CrossRef]
- Zhou, M.; Wang, Y.; Srivastava, A.K.; Wu, Y. Ensemble-Based Algorithm for Synchrophasor Data Anomaly Detection. IEEE Trans. Smart Grid 2019, 10, 2979–2988. [Google Scholar] [CrossRef]
- Xie, N.; Torelli, F.; Bompard, E.; Vaccaro, A. A Graph Theory Based Methodology for Optimal PMUs Placement and Multiarea Power System State Estimation. Electr. Power Syst. Res. 2015, 119, 25–33. [Google Scholar] [CrossRef]
- Huang, C.; Li, F.; Zhou, D.; Guo, J.; Pan, Z.; Liu, Y.; Liu, Y. Data quality issues for Synchrophasor applications Part I: A review. Mod. Power Syst. Clean Energy 2016, 4, 342–352. [Google Scholar] [CrossRef] [Green Version]
- Miller, L.E.; Silverstein, A.; Anand, D.; Goldstein, A.; Makarov, Y.; Tuffner, F.; Jones, K. PMU Data Quality: A Framework for the Attributes of PMU Data Quality and a Methodology for Examining Data Quality Impacts to Synchrophasor Applications; NASPI: Washington, DC, USA, 2017; pp. 1–77. [Google Scholar]
- Sundararajan, A.; Khan, T.; Moghadasi, A.; Sarwat, A.I. A survey on synchrophasor data quality and cybersecurity challenges, and evaluation of their interdependencies. Mod. Power Syst. Clean Energy 2018, 7, 1–18. [Google Scholar] [CrossRef] [Green Version]
- Chakrabortty, A.; Ilic, M.D. Control and Optimization Methods for Electric Smart Grids, 1st ed.; Springer: Berlin/Heidelberg, Germany, 2012. [Google Scholar]
- Ghiocel, S.G. Phasor-Measurement-Based State Estimation for Synchrophasor Data Quality Improvement and Power Transfer Interface Monitoring. IEEE Trans. Power Syst. 2014, 29, 881–888. [Google Scholar] [CrossRef]
- Muscas, C.; Pau, M.; Pegoraro, P.A.; Sulis, S. Uncertainty of Voltage Profile in PMU-Based Distribution System State Estimation. IEEE Trans. Instrum. Meas. 2016, 65, 988–998. [Google Scholar] [CrossRef]
- Chakrabarti, S.; Kyriakides, E. PMU Measurement Uncertainty Considerations in WLS State Estimation. IEEE Trans. Power Syst. 2009, 24, 1062–1071. [Google Scholar] [CrossRef] [Green Version]
- Zhang, Q.; Chakhchoukh, Y.; Vittal, V.; Heydt, G.T.; Logic, N. Sturgill Impact of PMU Measurement Buffer Length on State Estimation and Its Optimization. IEEE Trans. Power Syst. 2013, 28, 1657–1665. [Google Scholar] [CrossRef]
- Wang, Y.; Li, W.; Zhang, P.; Wang, B.; Lu, J. Reliability Analysis of Phasor Measurement Unit Considering Data Uncertainty. IEEE Trans. Power Syst. 2012, 27, 1503–1510. [Google Scholar] [CrossRef]
- Brown, M.; Biswal, M.; Brahma, S.; Ranade, S.J.; Cao, H. Characterizing and quantifying noise in PMU data. In Proceedings of the 2016 IEEE Power and Energy Society General Meeting (PESGM), Boston, MA, USA; 2016; pp. 1–5. [Google Scholar] [CrossRef]
- Pegoraro, P.A.; Sitzia, C.; Solinas, A.V.; Sulis, S. A PMU-based Technique for the Simultaneous Estimation of Systematic Measurement Errors, Line Parameters and Tap Changer Ratio. In Proceedings of the 2021 IEEE 11th International Workshop on Applied Measurements for Power Systems (AMPS), Virtual, 29 September–1 October 2021; pp. 1–6. [Google Scholar] [CrossRef]
- Vlahinić, S.; Franković, D.; Ðurović, M.Ž.; Stojković, N. Measurement Uncertainty Evaluation of Transmission Line Parameters. IEEE Trans. Instrum. Meas. 2021, 70, 1–7. [Google Scholar] [CrossRef]
- Wang, S.; Zhao, J.; Huang, Z.; Diao, R. Assessing Gaussian Assumption of PMU Measurement Error Using Field Data. IEEE Trans. Power Deliv. 2018, 33, 3233–3236. [Google Scholar] [CrossRef]
- Fu, J.; Song, G.; De Schutter, B. Influence of Measurement Uncertainty on Parameter Estimation and Fault Location for Transmission Lines. IEEE Trans. Autom. Sci. Eng. 2021, 18, 337–345. [Google Scholar] [CrossRef]
- Andreoni, R.; Macii, D.; Brunelli, M.; Petri, D. Tri-Objective Optimal PMU Placement Including Accurate State Estimation: The Case of Distribution Systems. IEEE Access 2021, 9, 62102–62117. [Google Scholar] [CrossRef]
- Zhao, J.; Mili, L. A Decentralized H-Infinity Unscented Kalman Filter for Dynamic State Estimation Against Uncertainties. IEEE Trans. Smart Grid 2019, 10, 4870–4880. [Google Scholar] [CrossRef]
- Qi, J.; Taha, A.F.; Wang, J. Comparing Kalman Filters and Observers for Power System Dynamic State Estimation with Model Uncertainty and Malicious Cyber Attacks. IEEE Access 2018, 6, 77155–77168. [Google Scholar] [CrossRef]
- Schenato, L.; Barchi, G.; Macii, D.; Arghandeh, R.; Poolla, K.; Von Meier, A. Bayesian Linear State Estimation Using Smart Meters and PMUs Measurements in Distribution Grids. In Proceedings of the IEEE International Conference on Smart Grid Communications (SmartGridComm), Venice, Italy, 3–6 November 2014; pp. 572–577. [Google Scholar] [CrossRef] [Green Version]
- Mestav, K.R.; Luengo-Rozas, J.; Tong, L. State Estimation for Unobservable Distribution Systems via Deep Neural Networks. In Proceedings of the 2018 IEEE Power & Energy Society General Meeting (PESGM), Portland, OR, USA, 5–10 August 2018; pp. 526–540. [Google Scholar] [CrossRef]
- Mestav, K.R.; Luengo-Rozas, J.; Tong, L. Bayesian State Estimation for Unobservable Distribution Systems via Deep Learning. IEEE Trans. Power Syst. 2019, 34, 4910–4920. [Google Scholar] [CrossRef] [Green Version]
- Mestav, K.R.; Tong, L. Learning the Unobservable: High-Resolution State Estimation via Deep Learning. In Proceedings of the 57th Annual Allerton Conference on Communication, Control, and Computing (Allerton), Monticello, IL, USA, 24–27 September 2019; pp. 171–176. [Google Scholar] [CrossRef]
- Massignan, J.A.D.; London, J.B.A.; Bessani, M.; Maciel, C.D.; Fannucchi, R.Z.; Miranda, V. Bayesian Inference Approach for Information Fusion in Distribution System State Estimation. IEEE Trans. Smart Grid 2022, 13, 526–540. [Google Scholar] [CrossRef]
- Kong, X.; Chen, Y.; Xu, T.; Wang, C.; Yong, C.; Li, P.; Yu, L. A Hybrid State Estimator Based on SCADA and PMU Measurements for Medium Voltage Distribution System. Appl. Sci. 2018, 8, 1527. [Google Scholar] [CrossRef] [Green Version]
- Jovicic, A.; Jereminov, M.; Pileggi, L.; Hug, G. A Linear Formulation for Power System State Estimation Including RTU and PMU Measurements. In Proceedings of the 2019 IEEE PES Innovative Smart Grid Technologies Europe (ISGT-Europe), Bucharest, Romania, 29 September–2 October 2019; pp. 1–5. [Google Scholar] [CrossRef] [Green Version]
- Wu, J.; Ota, K.; Dong, M.; Li, J.; Wang, H. Big data analysis-based security situational awareness for smart grid. IEEE Trans. Big Data 2018, 4, 408–417. [Google Scholar] [CrossRef] [Green Version]
- Farajollahi, M.; Shahsavari, A.; Stewart, E.M.; Mohsenian-Rad, H. Locating the Source of Events in Power Distribution Systems Using Micro-PMU Data. IEEE Trans. Power Syst. 2018, 33, 6343–6354. [Google Scholar] [CrossRef] [Green Version]
- Shahsavari, A.; Farajollahi, M.; Stewart, E.M.; Cortez, E.; Mohsenian-Rad, H. Situational Awareness in Distribution Grid Using Micro-PMU Data: A Machine Learning Approach. IEEE Trans. Smart Grid 2019, 10, 6167–6177. [Google Scholar] [CrossRef] [Green Version]
- Liu, S. Data-Driven Event Detection of Power Systems Based on Unequal-Interval Reduction of PMU Data and Local Outlier Factor. IEEE Trans. Smart Grid 2020, 11, 1630–1643. [Google Scholar] [CrossRef]
- Zheng, J.; Xu, C.; Zhang, Z.; Li, X. Electric load forecasting in smart grids using Long-Short-Term-Memory based Recurrent Neural Network. In Proceedings of the 2017 51st Annual Conference on Information Sciences and Systems (CISS), Baltimore, MA, USA, 22–24 March 2017; pp. 1–6. [Google Scholar] [CrossRef]
- Gupta, A.; Gurrala, G.; Sastry, P.S. An Online Power System Stability Monitoring System Using Convolutional Neural Networks. IEEE Trans. Power Syst. 2019, 34, 864–872. [Google Scholar] [CrossRef]
- Talukdar, S.; Deka, D.; Materassi, D.; Salapaka, M. Exact Topology Reconstruction of Radial Dynamical Systems with Applications to Distribution System of the Power Grid. In Proceedings of the 2017 American Control Conference (ACC), Seattle, WC, USA, 24–26 May 2017; pp. 813–818. [Google Scholar] [CrossRef] [Green Version]
- Cavraro, G.; Arghandeh, R.; Poolla, K.; Von Meier, A. Data-Driven Approach for Distribution Network Topology Detection. In Proceedings of the 2015 IEEE Power & Energy Society General Meeting, Denver, CO, USA, 26–30 July 2015; pp. 1–5. [Google Scholar] [CrossRef] [Green Version]
- Arghandeh, R.; Gahr, M.; von Meier, A.; Cavraro, G.; Ruh, M.; Andersson, G. Topology detection in microgrids with micro-synchrophasors. IEEE Power Energy Soc. Gen. Meet. 2015, 6, 1–5. [Google Scholar] [CrossRef] [Green Version]
- Taha, A.F.; Qi, J.; Wang, J.; Panchal, J.H. Risk Mitigation for Dynamic State Estimation Against Cyber Attacks and Unknown Inputs. IEEE Trans. Smart Grid 2018, 9, 886–899. [Google Scholar] [CrossRef]
- Musleh, A.S.; Khalid, H.M.; Muyeen, S.M.; Al-Durra, A. A Prediction Algorithm to Enhance Grid Resilience Toward Cyber Attacks in WAMCS Applications. IEEE Syst. J. 2019, 13, 710–719. [Google Scholar] [CrossRef]
- Khalid, H.M.; Peng, J.C. A Bayesian Algorithm to Enhance the Resilience of WAMS Applications Against Cyber Attacks. IEEE Trans. Smart Grid 2016, 7, 2026–2037. [Google Scholar] [CrossRef]
- Wang, J.; Shi, D.; Li, Y.; Chen, J.; Ding, H.; Duan, X. Distributed Framework for Detecting PMU Data Manipulation Attacks with Deep Autoencoders. IEEE Trans. Smart Grid 2019, 10, 4401–4410. [Google Scholar] [CrossRef]
- Vanfretti, L.; Chow, J.H.; Sarawgi, S.; Fardanesh, B. A Phasor-Data-Based State Estimator Incorporating Phase Bias Correction. IEEE Trans. Power Syst. 2011, 26, 111–119. [Google Scholar] [CrossRef] [Green Version]
- Jamei, M. Micro Synchrophasor-Based Intrusion Detection in Automated Distribution Systems: Toward Critical Infrastructure Security. IEEE Internet Comput. 2016, 20, 18–27. [Google Scholar] [CrossRef]
- Ashok, A.; Govindarasu, M.; Ajjarapu, V. Online Detection of Stealthy False Data Injection Attacks in Power System State Estimation. IEEE Trans. Smart Grid 2018, 9, 1636–1646. [Google Scholar] [CrossRef]
- Deng, R.; Zhuang, P.; Liang, H. CCPA: Coordinated Cyber-Physical Attacks and Countermeasures in Smart Grid. IEEE Trans. Smart Grid 2017, 8, 2420–2430. [Google Scholar] [CrossRef]
- Grainger, J.J.; Stevenson, W.D., Jr. Power System Analysis, 1st ed.; McGraw-Hill: Hightstown, NJ, USA, 1994. [Google Scholar]
- Kundur, P. Definition and classification of power system stability IEEE/CIGRE joint task force on stability terms and definitions. IEEE Trans. Power Syst. 2004, 19, 1387–1401. [Google Scholar] [CrossRef]
- Horowitz, S.H.; Phadke, A.G. Power System Relaying, 4th ed.; Wiley: London, UK, 2014. [Google Scholar]
- Njenda, T.C.; Golshan, M.E.H.; Alhelou, H.H. WAMS Based Intelligent Under Frequency Load Shedding Considering Online Disturbance Estimation. In Proceedings of the 2018 Smart Grid Conference (SGC), Kurdistan, Iran, 28–29 November 2018. [Google Scholar] [CrossRef]
- Rudez, U.; Mihalic, R. WAMS-Based Underfrequency Load Shedding with Short-Term Frequency Prediction. IEEE Trans. Power Deliv. 2016, 31, 1912–1920. [Google Scholar] [CrossRef]
- Franco, R.; Sena, C.; Taranto, G.N.; Giusto, A. Using synchrophasors for controlled islanding—A prospective application for the Uruguayan power system. IEEE Trans. Power Syst. 2013, 28, 2016–2024. [Google Scholar] [CrossRef]
- Lopes, L.A.C.; Sun, H. Performance assessment of active frequency drifting islanding detection methods. IEEE Trans. Energy Convers. 2006, 21, 171–180. [Google Scholar] [CrossRef]
- Frigo, G.; Derviškadić, A.; Zuo, Y.; Paolone, M. PMU-Based ROCOF Measurements: Uncertainty Limits and Metrological Significance in Power System Applications. IEEE Trans. Instrum. Meas. 2019, 68, 3810–3822. [Google Scholar] [CrossRef] [Green Version]
- Kundur, P. Power System Stability and Control, 2nd ed.; McGraw-Hill: New York, NY, USA, 1994. [Google Scholar]
- Centeno, V.; De La Ree, J.; Phadke, A.G.; Michel, G.; Murphy, R.J.; Burnett, R.O. Adaptive out-of-step relaying using phasor measurement techniques. IEEE Comput. Appl. Power 1993, 6, 12–17. [Google Scholar] [CrossRef]
- Centeno, V. An adaptive out-of-step relay [for power system protection. IEEE Trans. Power Deliv. 1997, 12, 61–71. [Google Scholar] [CrossRef]
- Ariff, M.A.M.; Pal, B.C. Adaptive Protection and Control in the Power System for Wide-Area Blackout Prevention. IEEE Trans. Power Deliv. 2016, 31, 1815–1825. [Google Scholar] [CrossRef] [Green Version]
- Ariff, M.A.M.; Pal, B.C.; Singh, A.K. Estimating Dynamic Model Parameters for Adaptive Protection and Control in Power System. IEEE Trans. Power Syst. 2015, 30, 829–839. [Google Scholar] [CrossRef] [Green Version]
- Ariff, M.A.M.; Pal, B.C. Coherency Identification in Interconnected Power System—An Independent Component Analysis Approach. IEEE Trans. Power Syst. 2013, 28, 1747–1755. [Google Scholar] [CrossRef] [Green Version]
- Yu, J.J.Q.; Hill, D.J.; Lam, A.Y.S.; Gu, J.; Li, V.O.K. Intelligent Time-Adaptive Transient Stability Assessment System. IEEE Trans. Smart Grid 2018, 33, 1049–1058. [Google Scholar] [CrossRef] [Green Version]
- Siddiqui, S.A.; Verma, K.; Niazi, K.R.; Fozdar, M. Real-Time Monitoring of Post-Fault Scenario for Determining Generator Coherency and Transient Stability Through ANN. IEEE Trans. Ind. Appl. 2018, 54, 685–692. [Google Scholar] [CrossRef]
- Tan, B.; Yang, J.; Tang, Y.; Jiang, S.; Xie, P.; Yuan, P. A Deep Imbalanced Learning Framework for Transient Stability Assessment of Power Syste. IEEE Access 2019, 7, 81759–81769. [Google Scholar] [CrossRef]
- Farantatos, E.; Huang, R.; Cokkinides, G.J.; Meliopoulos, A.P. A Predictive Generator Out-of-Step Protection and Transient Stability Monitoring Scheme Enabled by a Distributed Dynamic State Estimator. IEEE Trans. Power Deliv. 2016, 31, 1826–1835. [Google Scholar] [CrossRef]
- Wang, X.; Freitas, W.; Xu, W. Dynamic Non-Detection Zones of Positive Feedback Anti-Islanding Methods for Inverter-Based Distributed Generators. IEEE Trans. Power Deliv. 2011, 26, 1145–1155. [Google Scholar] [CrossRef]
- Laverty, M.D.; Morrow, D.J.; Best, R.; Cregan, M. Anti-islanding detection using Synchrophasors and Internet Protocol telecommunications. In Proceedings of the 2nd IEEE PES International Conference and Exhibition on Innovative Smart Grid Technologies, Manchester, UK, 5–7 December 2011; pp. 1–5. [Google Scholar] [CrossRef]
- Sun, R.; Centeno, V.A. Wide Area System Islanding Contingency Detecting and Warning Scheme. IEEE Trans. Power Syst. 2014, 29, 2581–2589. [Google Scholar] [CrossRef]
- Gao, Q.; Rovnyak, S.M. Decision trees using synchronized phasor measurements for wide-area response-based control. IEEE Trans. Power Syst. 2011, 26, 855–861. [Google Scholar] [CrossRef]
- Sun, H.-Y.; Liu, C.-W. Estimating the Voltage Stability Margin Using PMU Measurements. IEEE Trans. Power Syst. 2016, 31, 3221–3229. [Google Scholar] [CrossRef]
- Kamel, M.; Karrar, A.A.; Eltom, A.H. Development and Application of a New Voltage Stability Index for On-Line Monitoring and Shedding. IEEE Trans. Power Syst. 2018, 33, 1231–1241. [Google Scholar] [CrossRef] [Green Version]
- Su, H.-Y.; Liu, T.-Y. Enhanced-Online-Random-Forest Model for Static Voltage Stability Assessment Using Wide Area Measurements. IEEE Trans. Power Syst. 2018, 33, 6696–6704. [Google Scholar] [CrossRef]
- Malbasa, V.; Zheng, C.; Chen, P.; Popovic, T.; Kezunovic, M. Voltage Stability Prediction Using Active Machine Learning. IEEE Trans. Smart Grid 2017, 8, 3117–3124. [Google Scholar] [CrossRef]
- Liu, J.H.; Chu, C.C. Wide-area measurement-based voltage stability indicators by modified coupled single-port models. IEEE Trans. Power Syst. 2014, 29, 756–764. [Google Scholar] [CrossRef]
- Zhou, N.; Trudnowski, D.J.; Pierre, J.W.; Mittelstadt, W.A. Electromechanical Mode Online Estimation Using Regularized Robust RLS Methods. IEEE Trans. Power Syst. 2008, 23, 1670–1680. [Google Scholar] [CrossRef]
- Ma, J.; Zhang, P.; Fu, H.; Bo, B.; Dong, Z. Application of Phasor Measurement Unit on Locating Disturbance Source for Low-Frequency Oscillation. IEEE Trans. Smart Grid 2010, 1, 340–346. [Google Scholar] [CrossRef]
- Tripathy, P.; Srivastava, C.; Singh, S.N. A Modified TLS-ESPRIT-Based Method for Low-Frequency Mode Identification in Power Systems Utilizing Synchrophasor Measurements. IEEE Trans. Power Syst. 2011, 26, 719–727. [Google Scholar] [CrossRef]
- Follum, J.; Pierre, J.W. Detection of Periodic Forced Oscillations in Power Systems. IEEE Trans. Power Syst. 2016, 31, 2423–2433. [Google Scholar] [CrossRef]
- Kakimoto, N.; Sugumi, M.; Makino, T.; Tomiyama, K. Monitoring of interarea oscillation mode by synchronized phasor measurement. IEEE Trans. Power Syst. 2006, 21, 260–268. [Google Scholar] [CrossRef] [Green Version]
- Messina, A.R.; Vittal, V.; Heydt, G.T.; Browne, T.J. Nonstationary Approaches to Trend Identification and Denoising of Measured Power System Oscillations. IEEE Trans. Power Syst. 2009, 24, 1798–1807. [Google Scholar] [CrossRef]
- Browne, T.J.; Vittal, V.; Heydt, G.T.; Messina, A.R. A Comparative Assessment of Two Techniques for Modal Identification From Power System Measurements. IEEE Trans. Power Syst. 2008, 24, 1408–1415. [Google Scholar] [CrossRef]
- Zhou, N.; Dagle, J. Initial Results in Using a Self-Coherence Method for Detecting Sustained Oscillations. IEEE Trans. Power Syst. 2015, 30, 522–530. [Google Scholar] [CrossRef]
- Li, M.; Chen, Y. A Wide-Area Dynamic Damping Controller Based on Robust H∞ Control for Wide-Area Power Systems with Random Delay and Packet Dropout. IEEE Trans. Power Syst. 2018, 33, 4026–4037. [Google Scholar] [CrossRef]
- Ayar, M.; Obuz, S.; Trevizan, R.D.; Bretas, A.S.; Latchman, H.A. A Distributed Control Approach for Enhancing Smart Grid Transient Stability and Resilience. IEEE Trans. Smart Grid 2017, 6, 3035–3044. [Google Scholar] [CrossRef]
- Nabavi, S.; Zhang, A.; Chakrabortty, A. Distributed Optimization Algorithms for Wide-Area Oscillation Monitoring in Power Systems Using Interregional PMU-PDC Architectures. IEEE Trans. Smart Grid 2015, 6, 2529–2538. [Google Scholar] [CrossRef]
- Bose, A. Smart Transmission Grid Applications and Their Supporting Infrastructure. IEEE Trans. Smart Grid 2010, 28, 11–19. [Google Scholar] [CrossRef]
- Hasan, R.; Bobba, R.; Khurana, H. Analyzing NASPInet data flows. In Proceedings of the IEEE/PES Power Systems Conference and Exposition, Seattle, WA, USA, 15–18 March 2009; pp. 1–6. [Google Scholar] [CrossRef]
- Naduvathuparambil, B.; Valenti, M.C.; Feliachi, A. Communication delays in wide area measurement systems. In Proceedings of the Thirty-Fourth Southeastern Symposium on System Theory (Cat. No.02EX540), Huntsville, AL, USA, 18–19 March 2002; pp. 118–122. [Google Scholar] [CrossRef] [Green Version]
- Katsaros, K.V.; Yang, B.; Chai, W.K.; Pavlou, G. Low Latency Communication Infrastructure for Synchrophasor Applications in Distribution Networks. In Proceedings of the 2014 IEEE International Conference on Smart Grid Communications (SmartGridComm), Venice, Italy, 3–6 November 2014; pp. 392–397. [Google Scholar] [CrossRef]
- Chenine, M.; Nordstrom, L. Modeling and simulation of wide-area communication for centralized PMU-based applications. IEEE Trans. Power Deliv. 2011, 26, 1372–1380. [Google Scholar] [CrossRef] [Green Version]
- Castello, P.; Ferrari, P.; Flammini, A.; Muscas, C.; Pegoraro, P.A.; Rinaldi, S. A distributed PMU for electrical substations with wireless redundant process bus. IEEE Trans. Instrum. Meas. 2015, 64, 1149–1157. [Google Scholar] [CrossRef]
- Teeuwsen, S.P.; Erlich, I.; El-Sharkawi, M.A.; Bachmann, U. Genetic algorithm and decision tree-based oscillatory stability assessment. IEEE Trans. Power Syst. 2006, 21, 746–753. [Google Scholar] [CrossRef]
- Glover, J.D.; Sarma, N.S.; Overbye, T.J. Power System Analysis and Design, 5th ed.; Cengage: Stamford, CT, USA, 2012. [Google Scholar]
- EATON Drives. Available online: https://www.eaton.com/content/dam/eaton/products/industrialcontrols-drives-automation-sensors/variable-frequency-drives/svx-variable-frequency-drives/current-control-and-overcurrent-protection-ap04004001e.PDF (accessed on 18 March 2022).
- Jain, R.; Lubkeman, D.L.; Lukic, S.M. Dynamic Adaptive Protection for Distribution Systems in Grid-Connected and Islanded Modes. IEEE Trans. Power Deliv. 2019, 34, 281–289. [Google Scholar] [CrossRef]
- Pignati, M.; Zanni, L.; Romano, P.; Cherkaoui, R.; Paolone, M. Fault Detection and Faulted Line Identification in Active Distribution Networks Using Synchrophasors-Based Real-Time State Estimation. IEEE Trans. Power Deliv. 2017, 32, 381–392. [Google Scholar] [CrossRef] [Green Version]
- Choi, S.; Meliopoulos, A.P. Effective Real-Time Operation and Protection Scheme of Microgrids Using Distributed Dynamic State Estimation. IEEE Trans. Power Deliv. 2017, 32, 504–514. [Google Scholar] [CrossRef]
- SEL-421. Available online: https://selinc.com/products/421 (accessed on 17 February 2022).
- Sharma, N.K.; Samantaray, S.R. PMU Assisted Integrated Impedance Angle-Based Microgrid Protection Scheme. IEEE Trans. Power Deliv. 2020, 35, 183–193. [Google Scholar] [CrossRef]
- Ren, J.; Venkata, S.S.; Sortomme, E. An Accurate Synchrophasor Based Fault Location Method for Emerging Distribution Systems. IEEE Trans. Power Deliv. 2014, 29, 297–298. [Google Scholar] [CrossRef]
- Brahma, S.M. Fault Location in Power Distribution System with Penetration of Distributed Generation. IEEE Trans. Power Deliv. 2011, 26, 1545–1553. [Google Scholar] [CrossRef]
- Jamali, S.; Bahmanyar, A. A new fault location method for distribution networks using sparse measurements. Int. J. Electr. Power Energy Syst. 2016, 81, 459–468. [Google Scholar] [CrossRef]
- Wen, M.H.; Arghandeh, R.; von Meier, A.; Poolla, K.; Li, V.O. Phase identification in distribution networks with micro-synchrophasors. In Proceedings of the 2015 IEEE Power & Energy Society General Meeting, Denver, CO, USA, 26–30 July 2015; pp. 1–5. [Google Scholar] [CrossRef] [Green Version]
- Mason, R.C. The Art & Science of Protective Relaying, 1st ed.; Wiley: London, UK, 1956. [Google Scholar]
- Zare, J.; Aminifar, F.; Sanaye-Pasand, M. Synchrophasor-Based Wide-Area Backup Protection Scheme with Data Requirement Analysis. IEEE Trans. Power Deliv. 2015, 30, 1410–1419. [Google Scholar] [CrossRef]
- Biswal, M.; Brahma, S.M.; Cao, H. Supervisory Protection and Automated Event Diagnosis Using PMU Data. IEEE Trans. Power Deliv. 2016, 31, 1855–1863. [Google Scholar] [CrossRef]
- Neyestanaki, M.K.; Ranjbar, A.M. An Adaptive PMU-Based Wide Area Backup Protection Scheme for Power Transmission Lines. IEEE Trans. Smart Grid 2015, 6, 1550–1559. [Google Scholar] [CrossRef]
- Affijulla, S.; Tripathy, P. Development of Phasor Estimation Algorithm for P-Class PMU Suitable in Protection Applications. IEEE Trans. Smart Grid 2018, 9, 1250–1260. [Google Scholar] [CrossRef]
- Jena, M.K.; Samantaray, S.R.; Panigrahi, B.K. A New Wide-Area Backup Protection Scheme for Series-Compensated Transmission System. IEEE Syst. J. 2017, 11, 1877–1887. [Google Scholar] [CrossRef]
- Al-Maitah, K.; Al-Odienat, A. Wide Area Protection Scheme for Active Distribution Network Aided μPMU. In Proceedings of the IEEE PES/IAS Power Africa Conference, Virtual, 25–28 August 2020. [Google Scholar] [CrossRef]
- Lavand, S.A.; Soman, S.A. Predictive Analytic to Supervise Zone 1 of Distance Relay Using Synchrophasors. IEEE Trans. Power Deliv. 2016, 31, 1844–1854. [Google Scholar] [CrossRef]
- Chen, C.; Liu, C.; Jiang, J. A new adaptive PMU based protection scheme for transposed/untransposed parallel transmission lines. IEEE Trans. Power Deliv. 2002, 17, 395–404. [Google Scholar] [CrossRef]
- Jiang, J.A.; Yang, J.Z.; Lin, Y.H.; Liu, C.W.; Ma, J.C. An adaptive PMU based fault detection/location technique for transmission lines. I. Theory and algorithms. IEEE Trans. Power Deliv. 2000, 15, 486–493. [Google Scholar] [CrossRef]
- Liu, C.; Lien, K.; Chen, C.; Jiang, J. A Universal Fault Location Technique for N-Terminal (N≧3) Transmission Lines. IEEE Trans. Power Deliv. 2008, 23, 1366–1373. [Google Scholar] [CrossRef]
- Liu, C.; Lin, T.; Yu, C.; Yang, J. A Fault Location Technique for Two-Terminal Multisection Compound Transmission Lines Using Synchronized Phasor Measurements. IEEE Trans. Smart Grid 2012, 3, 113–121. [Google Scholar] [CrossRef]
- Dobakhshari, A.S.; Ranjbar, A.M. A Novel Method for Fault Location of Transmission Lines by Wide-Area Voltage Measurements Considering Measurement Errors. IEEE Trans. Smart Grid 2015, 6, 874–884. [Google Scholar] [CrossRef]
- Guatam, S.; Brahma, S.M. Detection of High Impedance Fault in Power Distribution Systems Using Mathematical Morphology. IEEE Trans. Power Syst. 2013, 28, 1226–1234. [Google Scholar] [CrossRef]
- Cui, Q.; Weng, Y. Enhance High Impedance Fault Detection and Location Accuracy via μ -PMUs. IEEE Trans. Smart Grid 2020, 11, 797–809. [Google Scholar] [CrossRef]
- Paramo, G.; Bretas, A.S. WAMS Based Eigenvalue Space Model for High Impedance Fault Detection. Appl. Sci. 2021, 11, 12148. [Google Scholar] [CrossRef]
- Patynowski, D.; Cardenas, J.; Menendez, D.; Zhang, Z.; Roca, J.M.; Germain, J.G.; Huete, A.Y.; Canales, M.; Martinez, A.; Rosendo, J.A.; et al. Fault Locator approach for high-impedance grounded or ungrounded distribution systems using synchrophasors. In Proceedings of the 68th Annual Conference of Protective Relay Engineers, College Station, TX, USA,, 30 March–2 April 2015. [Google Scholar] [CrossRef]
- Phadke, A.G.; Bi, T. Phasor measurement units, WAMS, and their applications in protection and control of power systems. J. Mod. Power Syst. Clean Energy 2018, 6, 1250–1260. [Google Scholar] [CrossRef] [Green Version]
- SEL-411L. Available online: https://selinc.com/products/411L (accessed on 19 February 2022).
- Andreasson, M.; Dimarogonas, D.V.; Johansson, K.H.; Sandberg, H. Distributed vs. centralized power systems frequency control. In Proceedings of the 2013 European Control Conference (ECC), Zurich, Switzerland, 17–19 July 2013; pp. 3524–3529. [Google Scholar] [CrossRef] [Green Version]
Figure 1.
PMU application areas covered in this work.

Figure 2.
Simplified centralized synchrophasor arrangement.
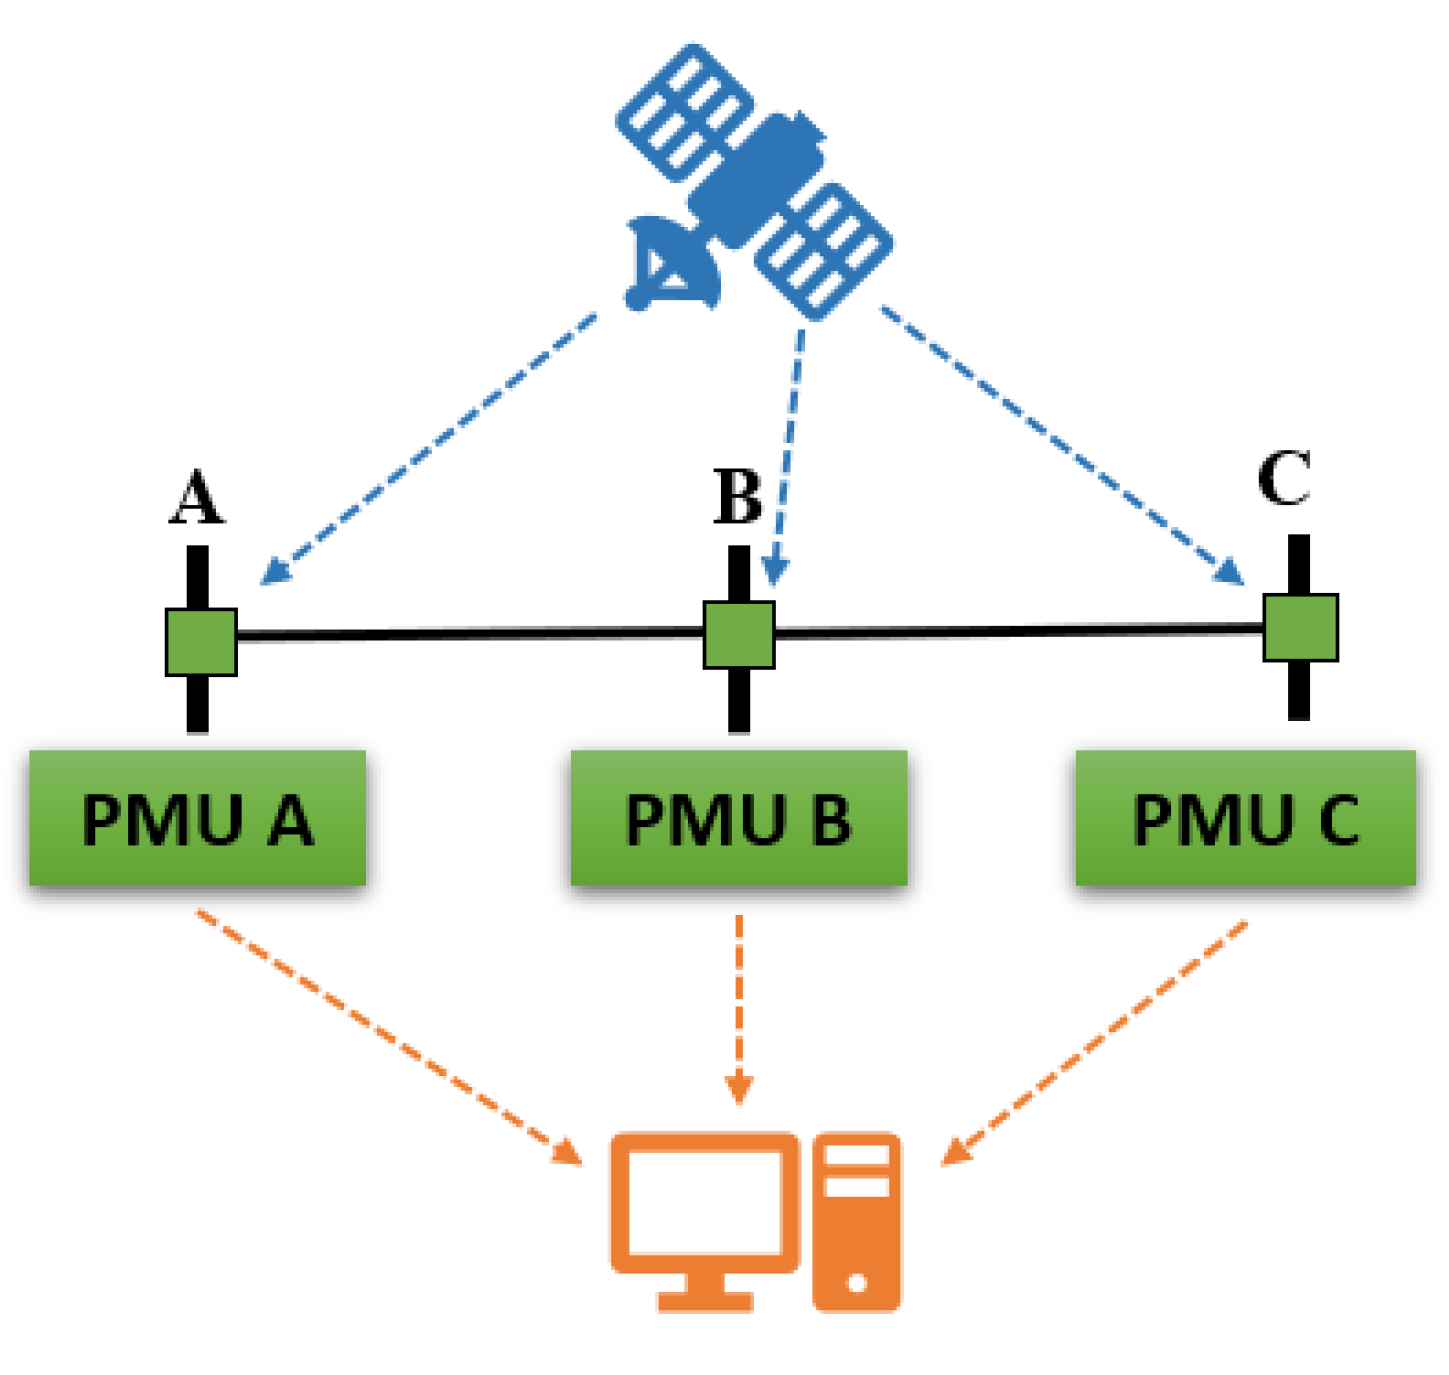
Figure 3.
PMU-observable system with a reduced number of PMUs.
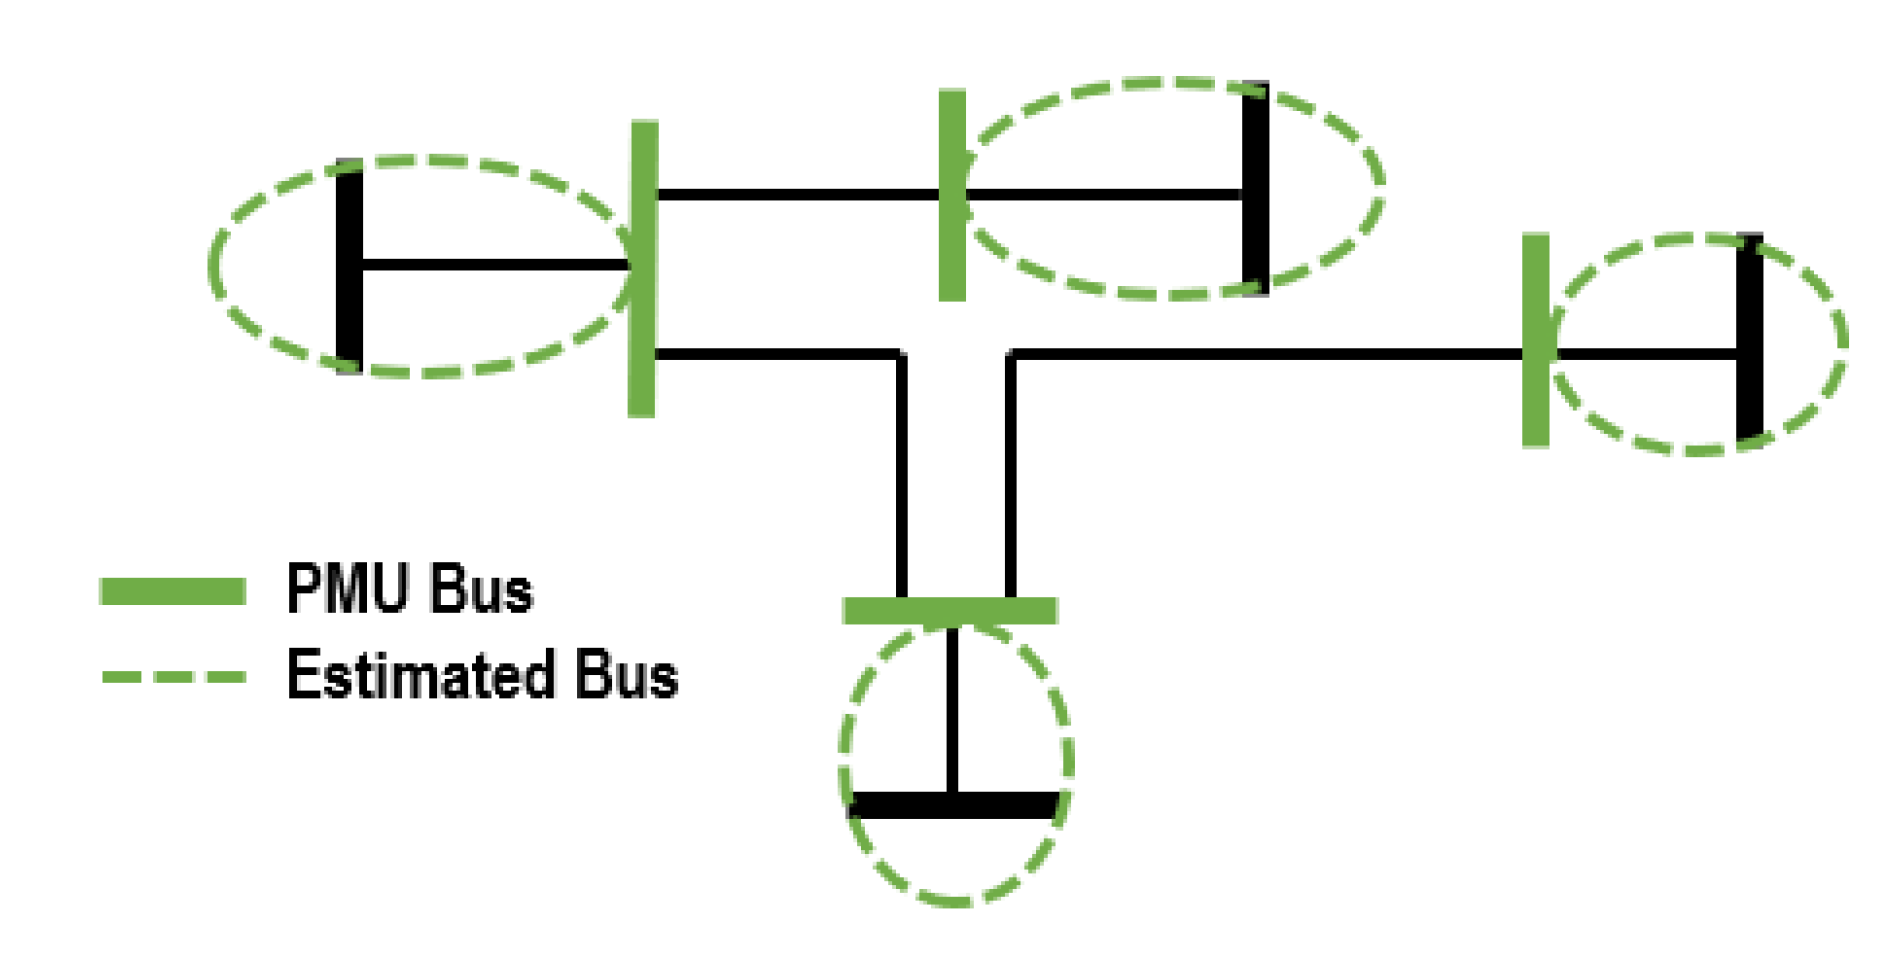
Figure 4.
Multiple meter types used in conjunction.

Figure 5.
General structure of ISE scheme.

Figure 6.
Simplified load-shedding action.

Figure 7.
Power system with distributed and utility sources—all sources online.

Figure 8.
Power system with distributed and utility sources—utility sources offline.

Figure 9.
Typical distance protection scheme with zones of protection.


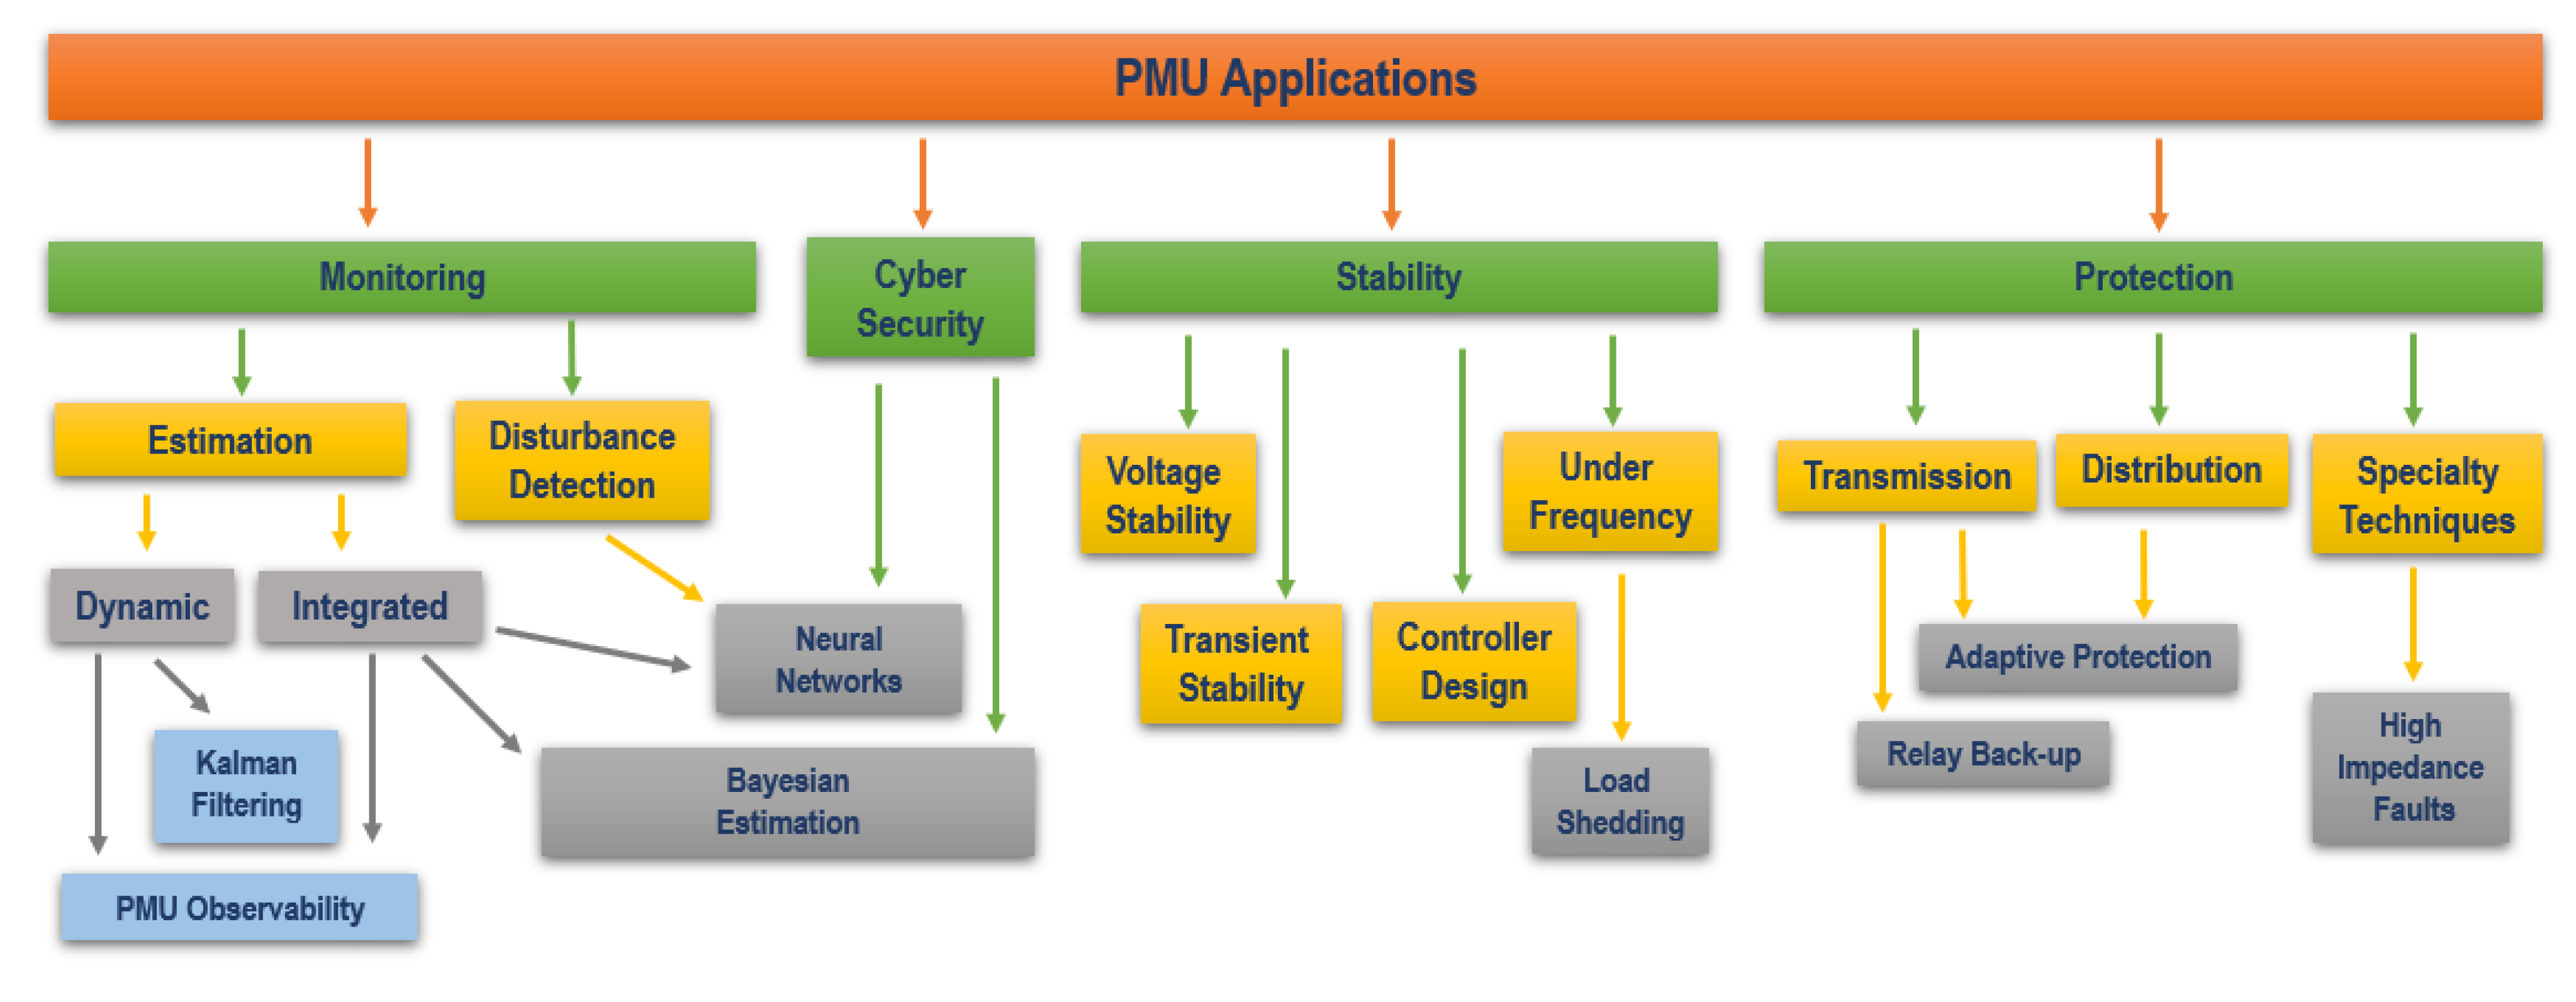
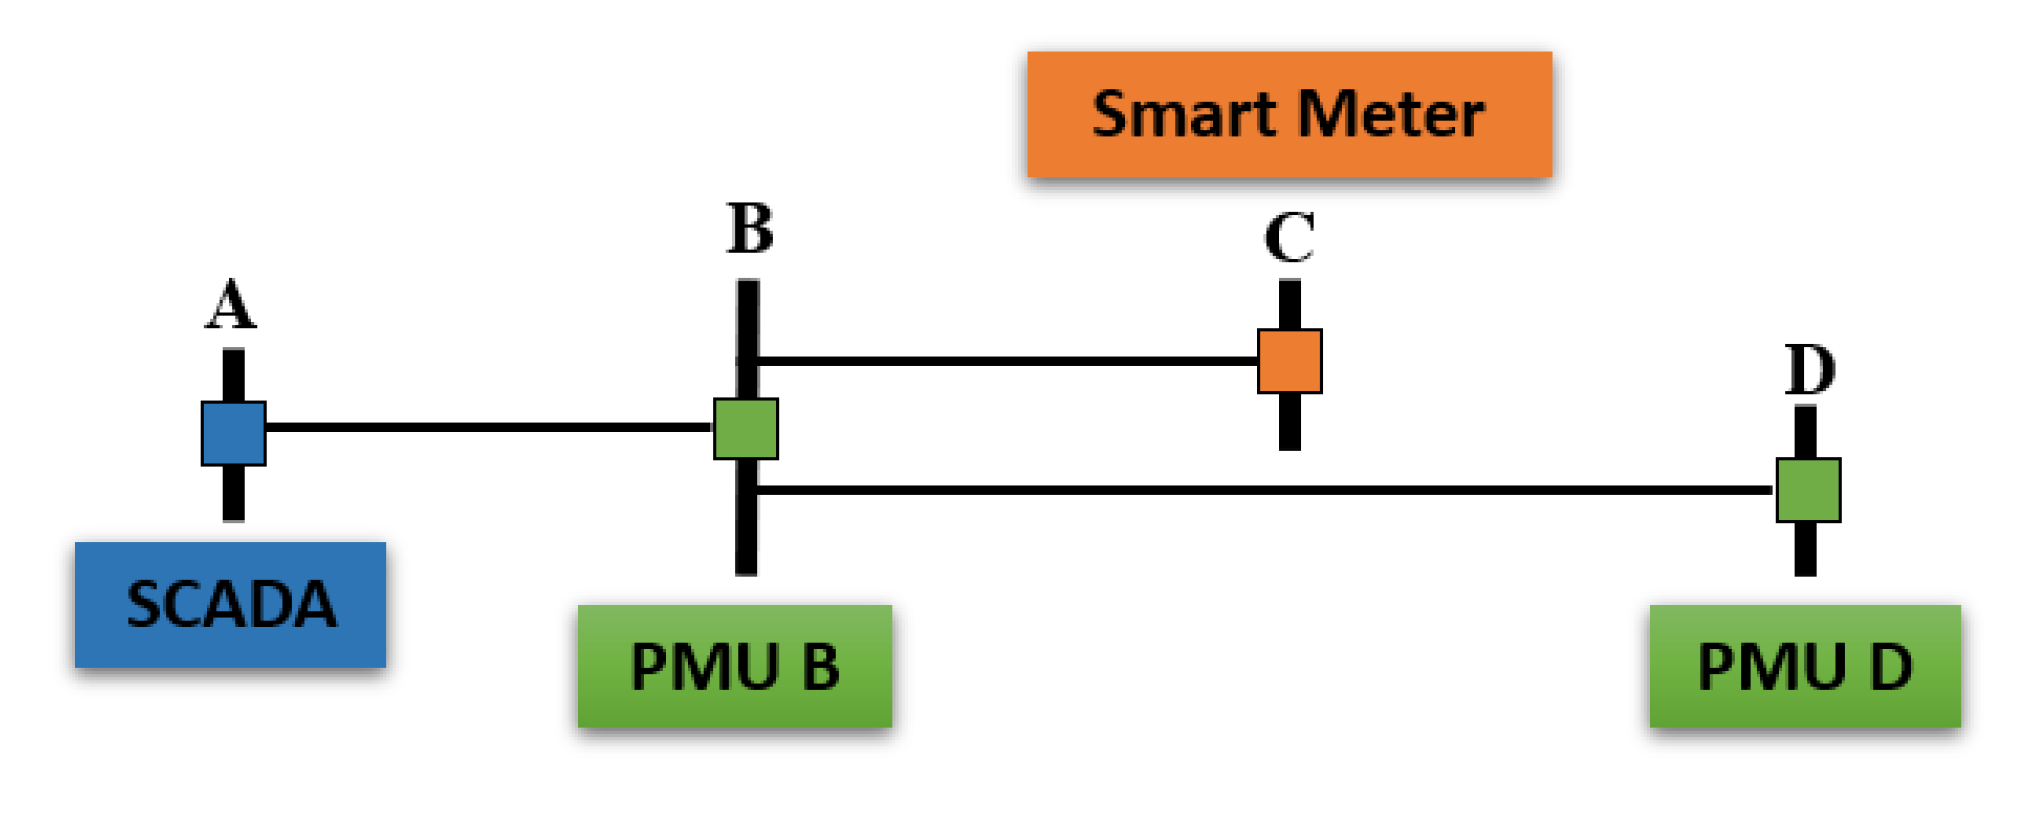
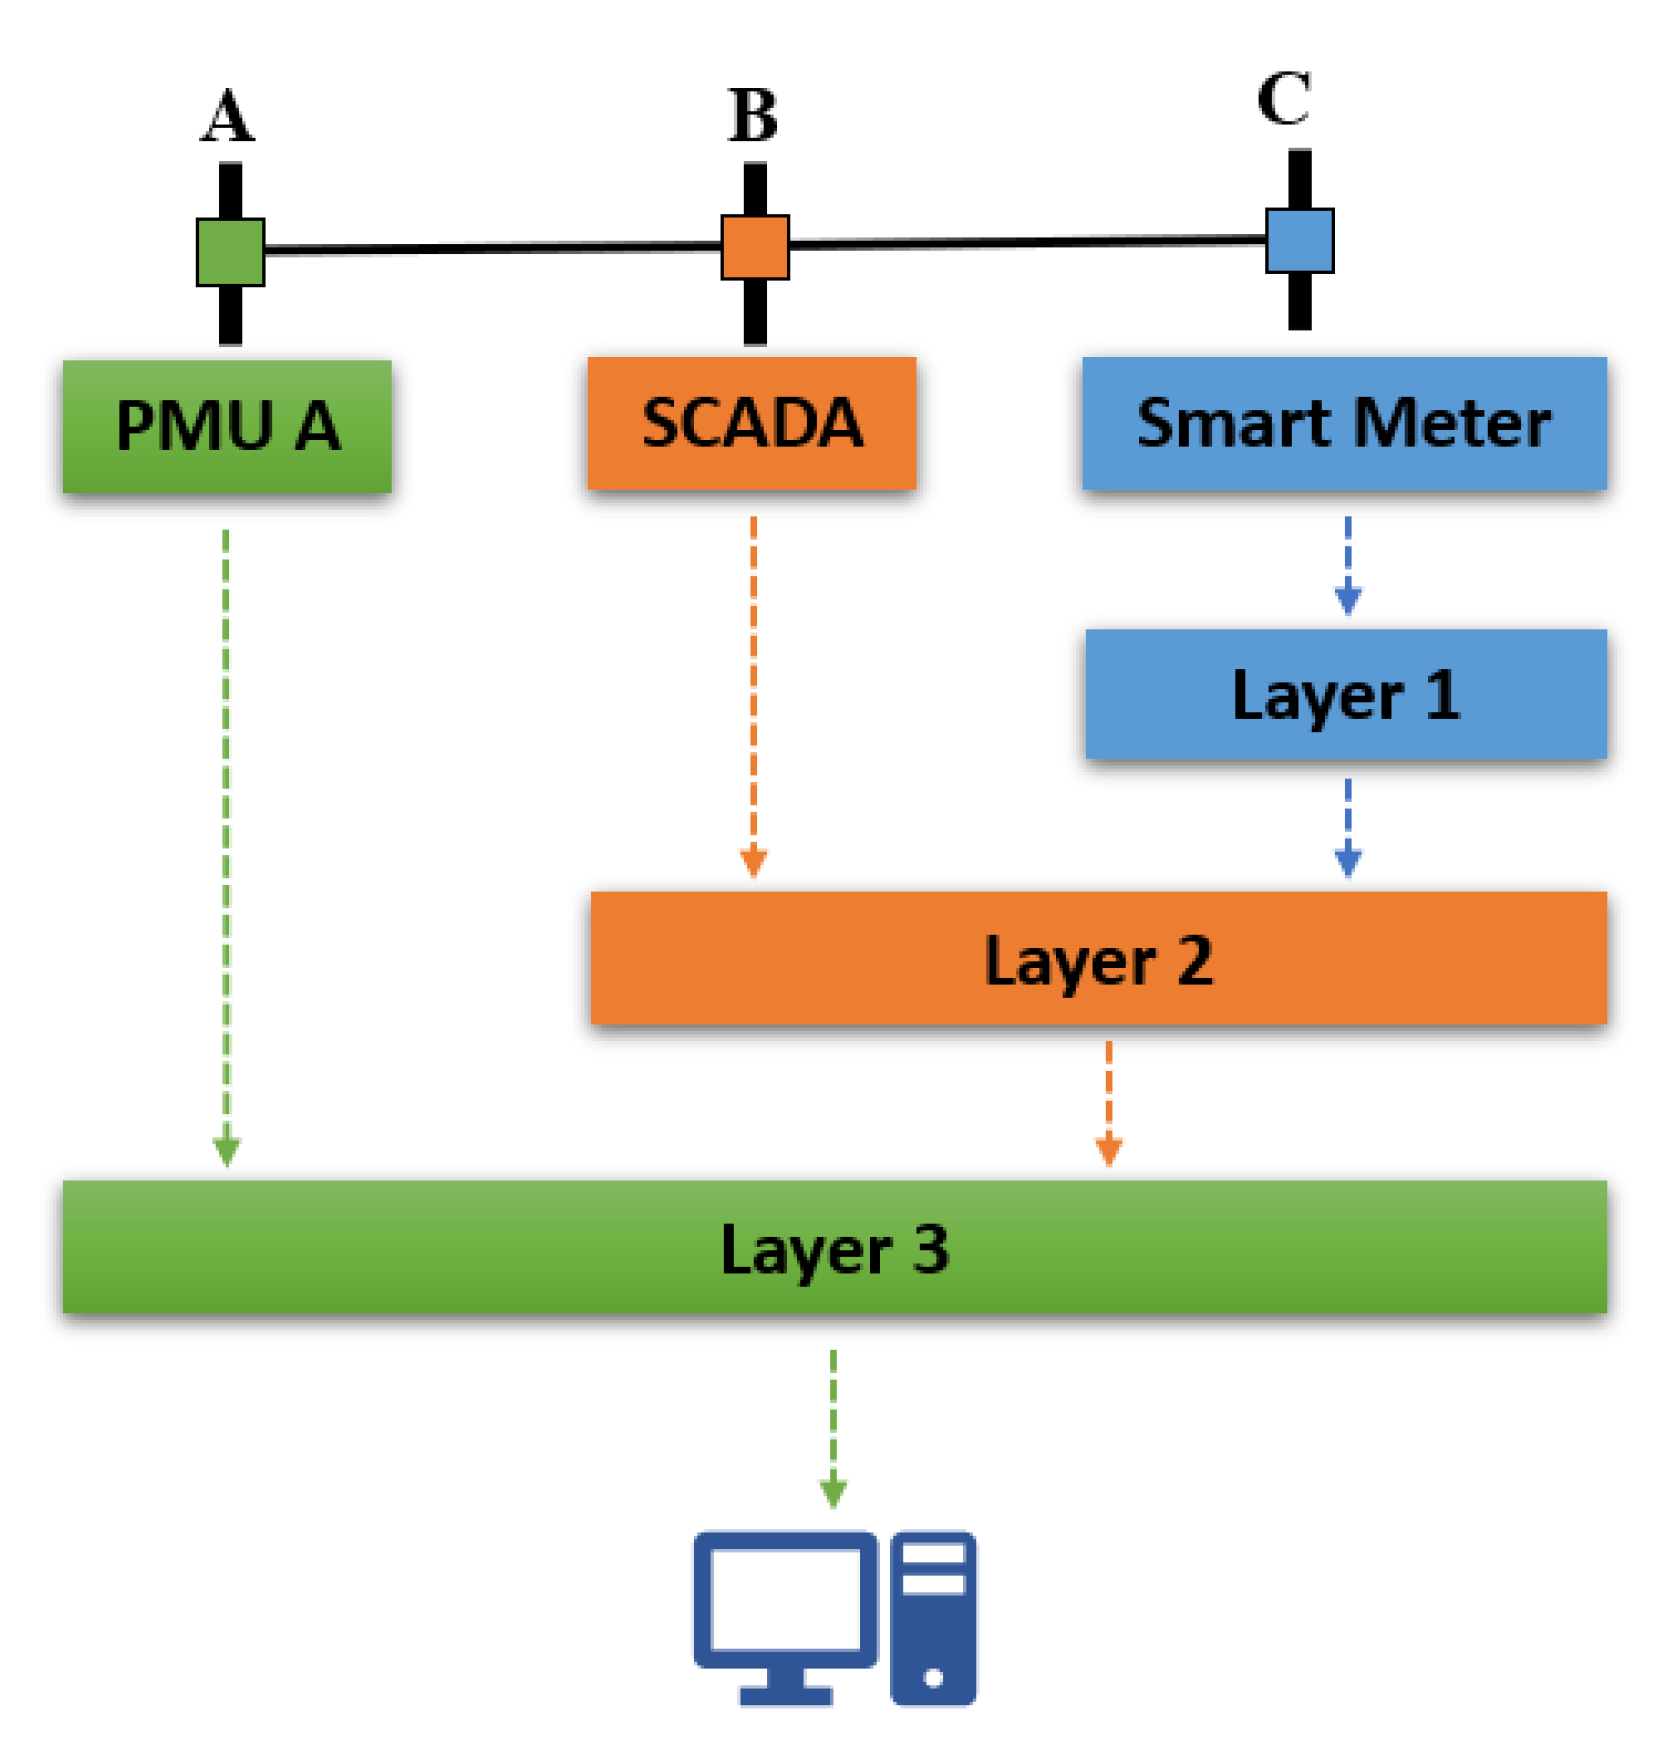
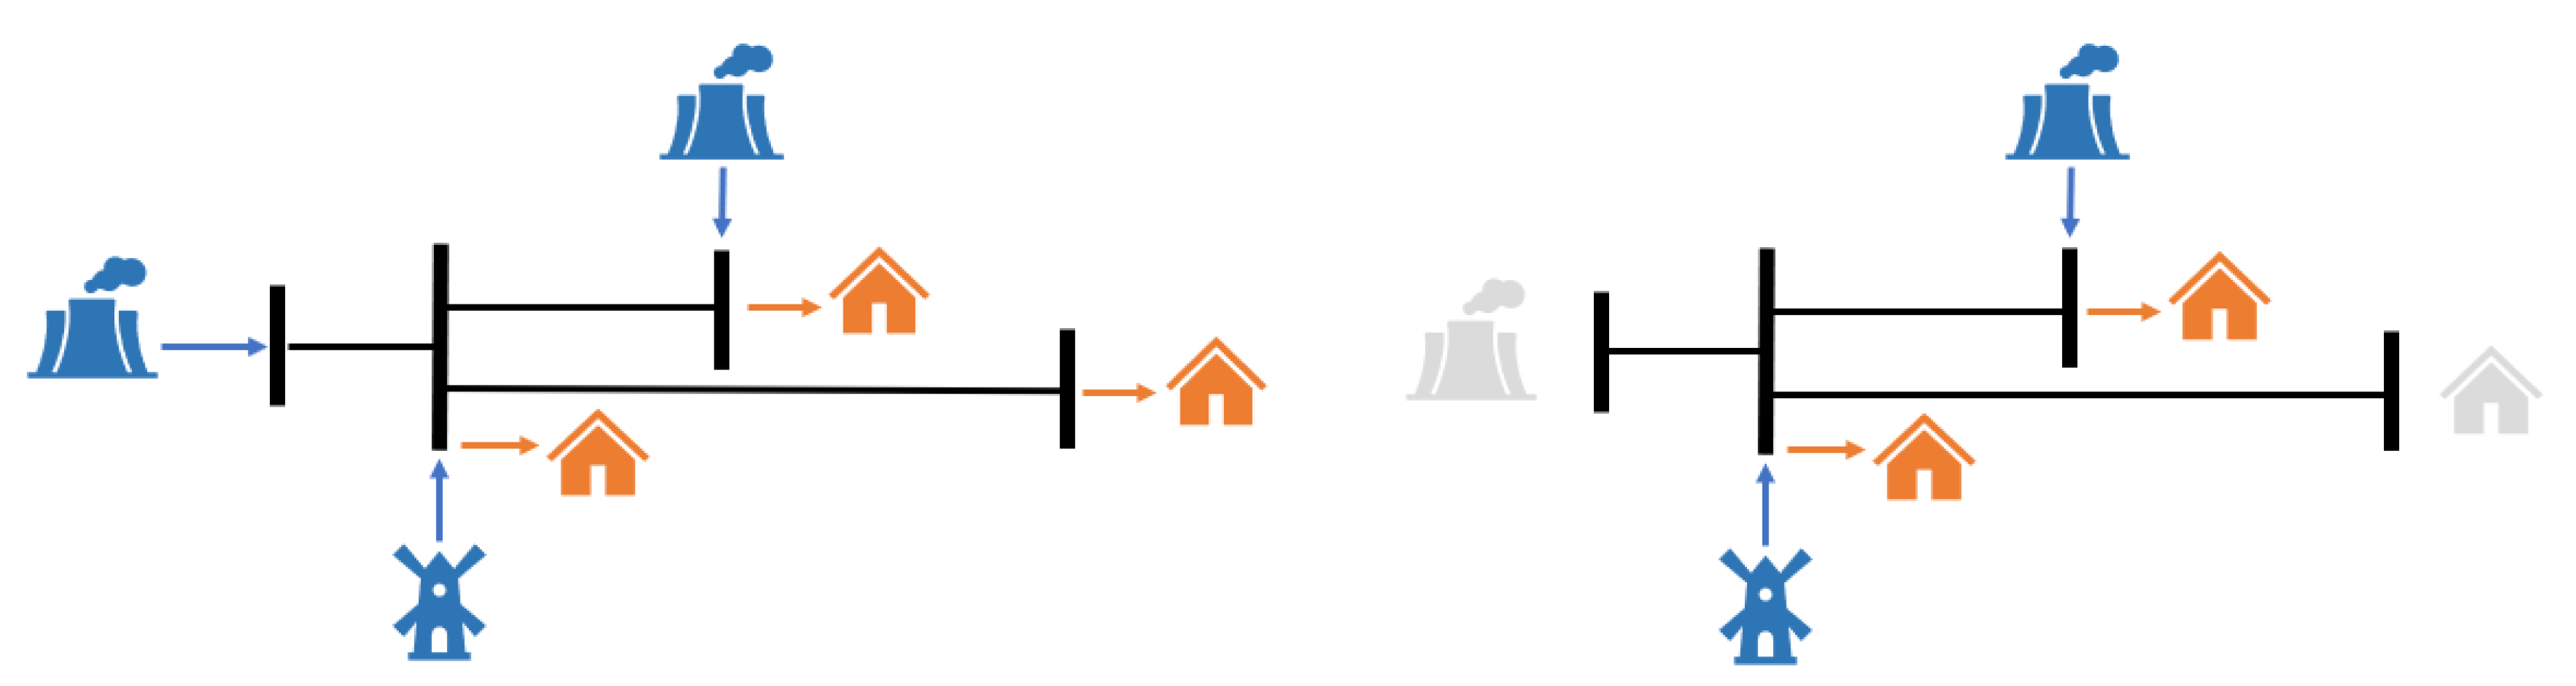
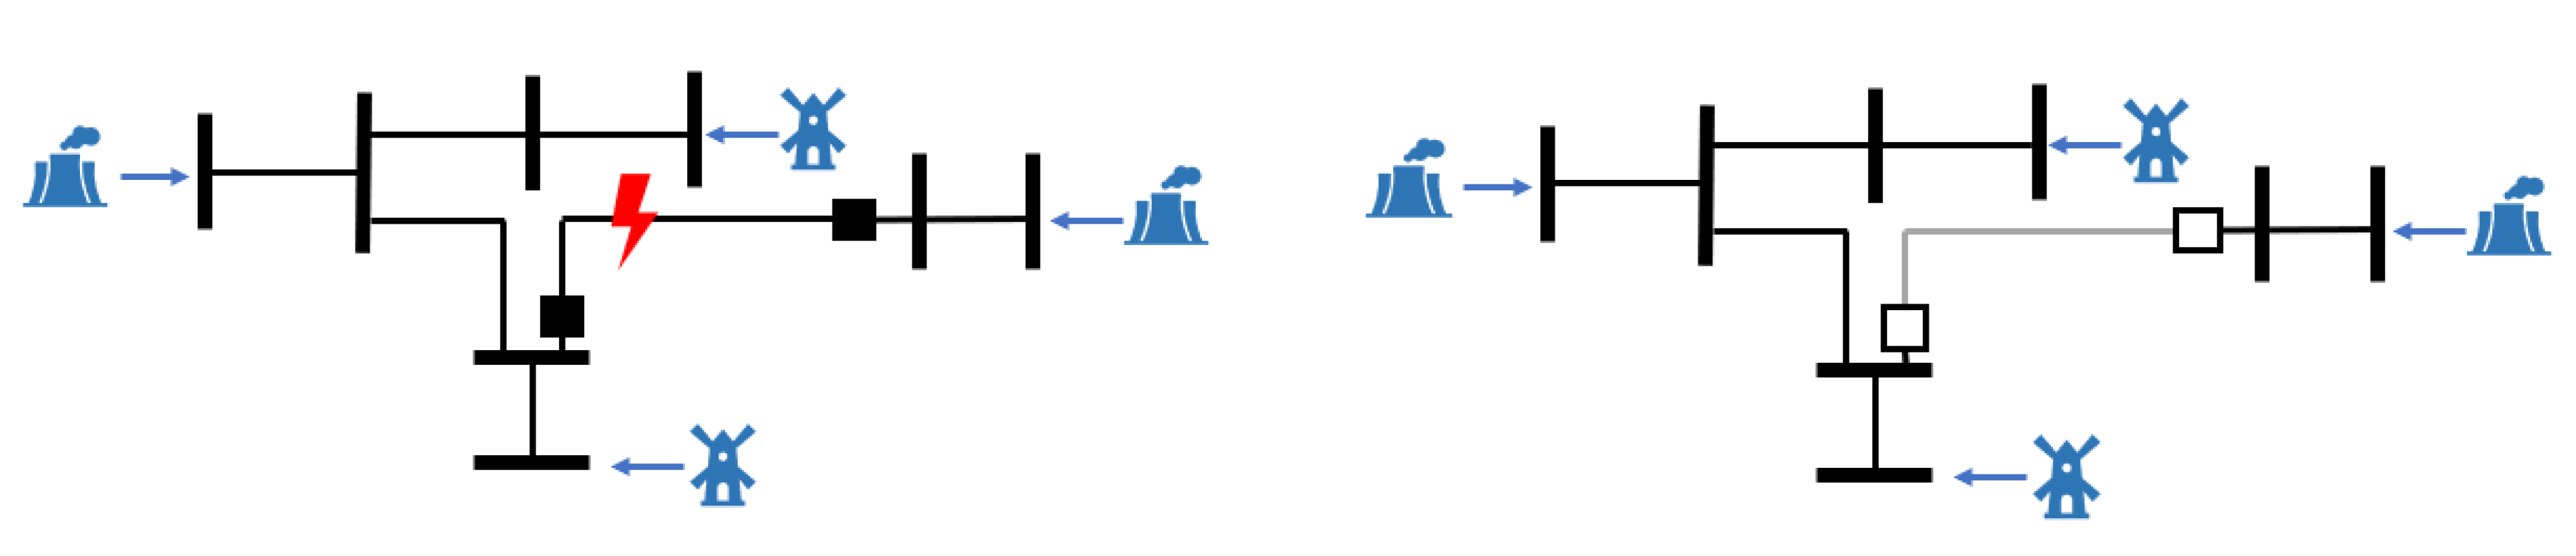
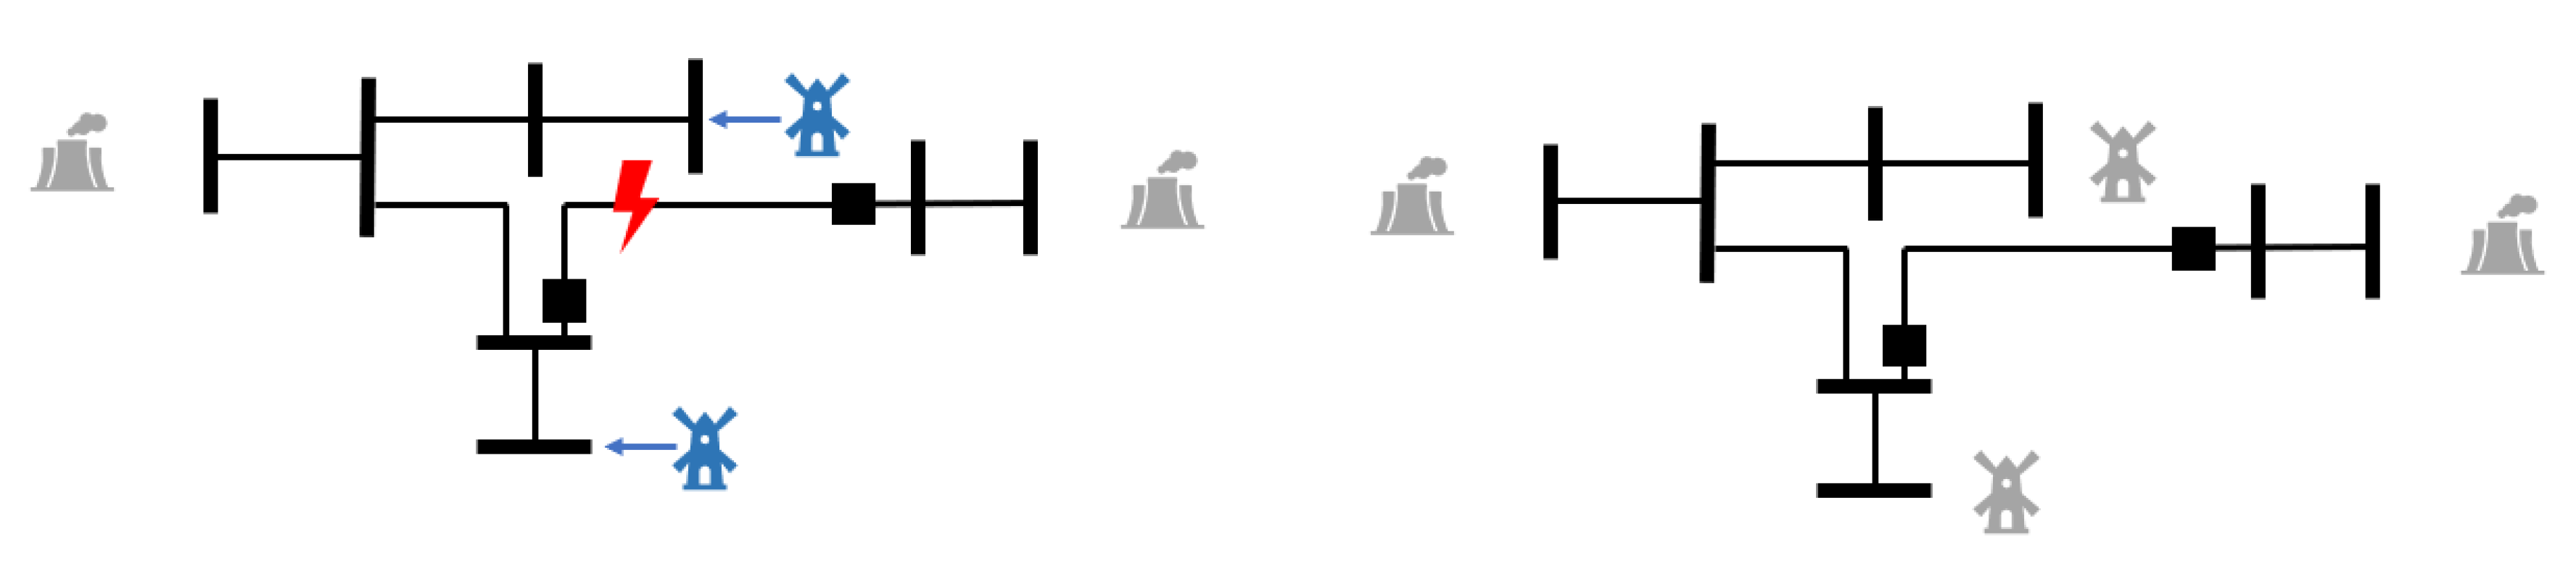
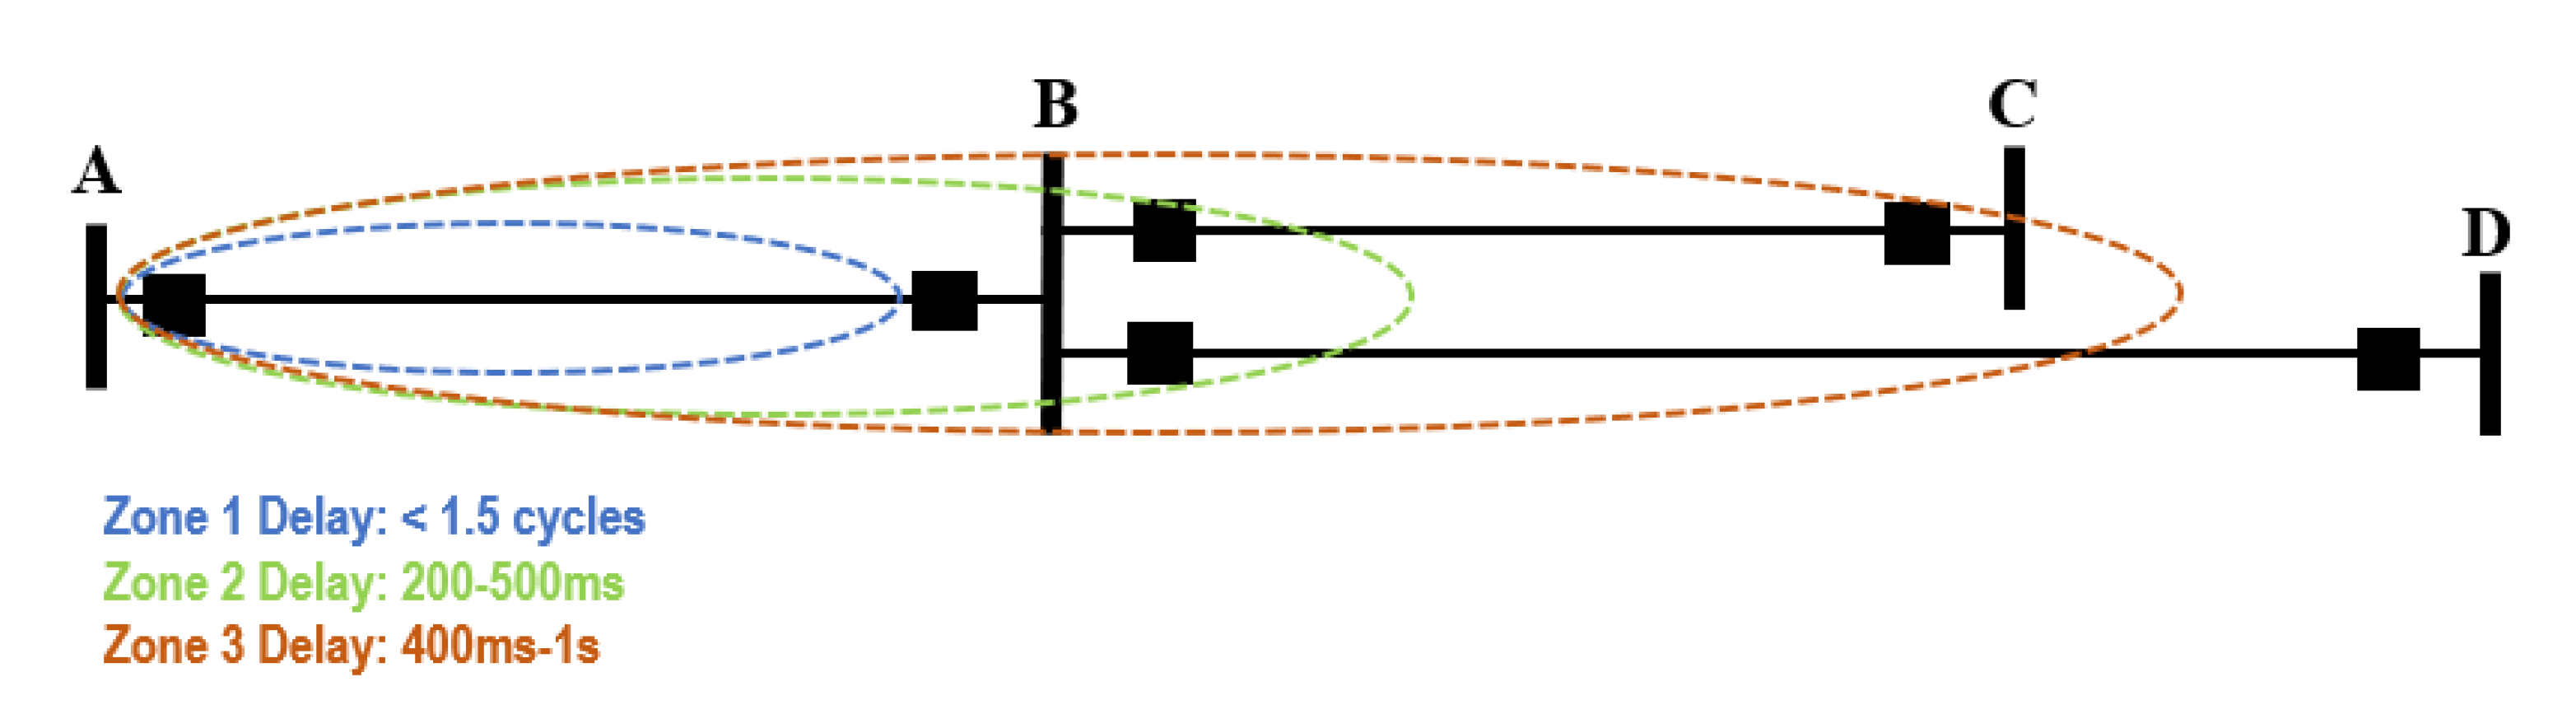
Table 1.
Summary of contributions.
| Key Contribution | Reference |
|---|---|
| PMU placement and optimization | [12,13,15] |
| Extension of the EKF for robustness | [18,19,22] |
| Extension of the UKF for improvements in efficiency | [20,21] |
| Alternative methods for bad-data detection | [29,30,31,33,34] |
| Decentralized schemes | [21,35,36] |
| Techniques for the mitigation of uncertainty | [41,44,45,46,51] |
Table 2.
Summary of contributions.
| Key Contribution | Reference |
|---|---|
| Bayesian estimation | [54,56,58] |
| Formulation of pseudo measurements to improve observability | [59,60] |
| Leverage of machine learning | [55,57] |
Table 3.
Summary of contributions.
| Key Contribution | Reference |
|---|---|
| Impedance-based event detection | [62,63] |
| Alternative methods for improvements in efficiency | [64] |
| Machine learning and neural networks | [63,65,66] |
| Load forecasting | [65] |
| Topology monitoring | [67,68,69] |
Table 4.
Summary of contributions.
| Key Contribution | Reference |
|---|---|
| Bayesian techniques | [71,72] |
| Machine learning and neural networks | [73] |
| Detection and correction via geometrical tools | [74] |
| Redundancy-based detection | [75,76,77] |
| Alternative techniques from control are utilized | [70] |
Table 5.
Summary of contributions.
| Key Contribution | Reference |
|---|---|
| Adaptive scheme | [81] |
| Optimized load-shedding | [81,82] |
| Predictive scheme | [82] |
| Optimized islanding | [83,84] |
Table 6.
Summary of contributions.
| Key Contribution | Reference |
|---|---|
| Adaptive scheme | [89] |
| Machine learning and neural networks | [92,93,94] |
| Predictive scheme | [95] |
| Anti-islanding | [96,97,98] |
| Stability index | [99] |
Table 7.
Summary of contributions.
| Key Contribution | Reference |
|---|---|
| Equivalent models | [100,101] |
| Optimized load-shedding | [101] |
| Machine learning and neural networks | [102,103] |
| Stability index | [104] |
Table 8.
Summary of contributions.
| Key Contribution | Reference |
|---|---|
| Techniques for the detection of oscillatory modes | [105,106,110,111] |
| Noise mitigation | [107,108,112] |
| Robust control techniques | [113] |
| Distributed control techniques | [114,115] |
| Stability index | [122] |
Table 9.
Summary of contributions.
| Key Contribution | Reference |
|---|---|
| Adaptive protection techniques | [126,127,129] |
| Integration of equipment status | [126] |
| Decentralized scheme | [127] |
| Impedance based protection scheme | [129] |
| Provisions are made considering changes in topology | [130,131,132] |
| Overload conditions are considered | [133] |
Publisher’s Note: MDPI stays neutral with regard to jurisdictional claims in published maps and institutional affiliations. |
© 2022 by the authors. Licensee MDPI, Basel, Switzerland. This article is an open access article distributed under the terms and conditions of the Creative Commons Attribution (CC BY) license (https://creativecommons.org/licenses/by/4.0/).
Share and Cite
MDPI and ACS Style
Paramo, G.; Bretas, A.; Meyn, S. Research Trends and Applications of PMUs. Energies 2022, 15, 5329. https://doi.org/10.3390/en15155329
AMA Style
Paramo G, Bretas A, Meyn S. Research Trends and Applications of PMUs. Energies. 2022; 15(15):5329. https://doi.org/10.3390/en15155329
Chicago/Turabian StyleParamo, Gian, Arturo Bretas, and Sean Meyn. 2022. "Research Trends and Applications of PMUs" Energies 15, no. 15: 5329. https://doi.org/10.3390/en15155329
Note that from the first issue of 2016, this journal uses article numbers instead of page numbers. See further details here.