1. Introduction
In recent decades, research on alternative fuel engines is becoming more and more popular because of environmental pollution and petroleum depletion problems [
1,
2]. The alternative fuel includes compressed natural gas (CNG), methanol, biomass fuel, and so on. Among them, switching to CNG, which has the advantages of abundant reserves and a lower cost, can reduce vehicle emissions relatively quickly and has little impact on the entire transportation infrastructure [
3].
The fuel supply system plays an important role in the performance of CNG-fueled engines. At present, the gas supply method of gas fuel engines has been developed to the fourth generation, namely direct injection (DI) technology [
4,
5]. It can eliminate the volumetric efficiency reduction of the PFI mode. It can also avoid the fuel loss that the PFI mode causes during the scavenging process. What is more, the controlling accuracy of in-cylinder mixing, and the combustion process will be improved by optimizing the matching of the injection time, air-fuel ratio (A/F), and ignition time, which is the future development trend of the gas-fueled engine [
6,
7,
8,
9]. However, the mixing path and duration are shortened greatly for the DI mode [
10,
11], which often leads to poor mixing uniformity.
Gas-fueled engines can be divided into a lean-burn and theoretical A/F combustion mode. The former usually requires a rich mixture to be near the spark plug, and it can avoid knocking. However, because the A/F of the lean-burn engine often varies in a rather wide range, the exhaust emission tends to be higher than that under the theoretical A/F combustion mode. On the other hand, the latter often brings a higher heat load, higher heat loss, and higher pump loss at part load. Engines under the theoretical A/F combustion mode are easier to knock. However, all these disadvantages can be effectively eliminated with the use of exhaust gas recirculation (EGR) [
12]. Therefore, the theoretical A/F combustion mode is taken in this study, which requires a homogeneous mixture.
The in-cylinder mixing process of the gas-fueled engine would be affected by many factors, such as the injection position, injection angle, injection time, combustion chamber shape, and so on. The mixing processes of CNG engines under the PFI mode were studied earlier. Schlieren imaging technology was used by Gimbres et al. to explore the mixing process of CNG and air in the intake port. The results showed that CNG would be completely pushed by the air to the upper wall of the intake port when the gas injection velocity was slow [
13]. KIVA-3V was used by Lee et al. to study the effects of the injection timing and engine speed on the mixing uniformity in the intake port and cylinder. The influence of the mixing process on the in-cylinder flame propagating process was also revealed in their study [
14]. The mixing uniformities of the premixed mode and the PFI mode were compared by Garg et al. [
15]. Yamato et al. [
16] used CFD combined with schlieren imaging technology to study the in-cylinder mixture distribution at different injection locations under the PFI mode. The hydrogen injection location was optimized by Berckmuller et al. with FIRE software [
17], and the influence of the injection timing was also studied by them. The mixing performances in the intake manifold were studied by Chintala et al. [
18] under different injection positions, injection angles, and gas supply pressures. In the authors’ previous studies, one transient CFD model of the PFI engine, incorporating the gas fuel injection device’s (GID) motion [
19,
20], has been established to analyze the effects of the GID injection angle and poppet valve opening manner on the mixing homogeneity in the intake port, and finally the in-cylinder mixing performance has been compared. The results showed that the intake-port and in-cylinder mixing uniformity would be better for a pull-open GID, and because of the enhanced influence of the unstable factors of the wake wave and horseshoe vortex under a higher injection angle, the mixing performance in the intake port would be better.
In recent years, the research on the in-cylinder mixing performance of the CNG DI engine has increased gradually. The in-cylinder mixture distribution and engine torque under the condition of 1500 rpm and full load with different injection angles and times were revealed by Baratta et al. [
11]. They also proposed the mixing optimization scheme. Scarcelli et al. [
21] studied the influences of the injection nozzle hole. The influence of the injector’s structure on the gas fuel jet shape was analyzed by Keskinen et al. [
22]. The targeting effect of the deep bowl combustion chamber on the gas jet was also studied to improve the in-cylinder mixing performance. The influences of the PFI and DI modes on the engine’s thermal efficiency, combustion velocity, and stability were studied by Moon et al. [
23] based on the experimental platform of a four-cylinder gas-fueled engine. The results showed that the DI mode would increase the TKE in the cylinder, which is beneficial to accelerate the combustion velocity under low load conditions and improve the thermal efficiency. In the early stage, the transient CFD model of a DI CNG engine was established by the authors of this study to analyze the influences of the injection timing and valve opening manner on the in-cylinder mixing uniformity [
24]. The results showed that with the advanced injection time, the impinging jet force on the piston top would decrease, and so the gas fuel would be grouped into the piston groove, which would lead to a bad mixing uniformity.
The above studies, except those from the authors of this study, must set the spray pattern and outlet mass flow during the CFD calculation because they did not take the internal structure of the gas injector into consideration, which would affect the calculation accuracy seriously. The most accurate approach is to embody the internal structure of the gas injector into the computation region. In this paper, based on the authors’ previous research about the mixing processes of the PFI and DI CNG engines, the 3D transient CFD model incorporating the gas injector’s motion will be established to compare the in-cylinder mixing uniformity of the CNG-fueled PFI and DI engines quantitatively. According to the quantitative comparison result, the urgency of optimizing the mixing uniformity of the DI mode will be clearer. What is more, considering that most of the existing CNG engines are refitted from corresponding diesel engines and that the installation angle of the injector and piston top shape has not been improved to fit the gas fuel mode, the effects of an injection angle and piston top shape on the mixing performance of the DI mode will also be studied.
2. Model and Analysis Method
The main parameters of the prototype CNG engine are shown in
Table 1. The engine is kept at the velocity of 1900 rpm and full load. Considering that the CNG’s main component is methane (proportion exceeds 85% usually), the gas fuel in this paper refers to pure methane gas.
According to the authors’ previous research results [
19,
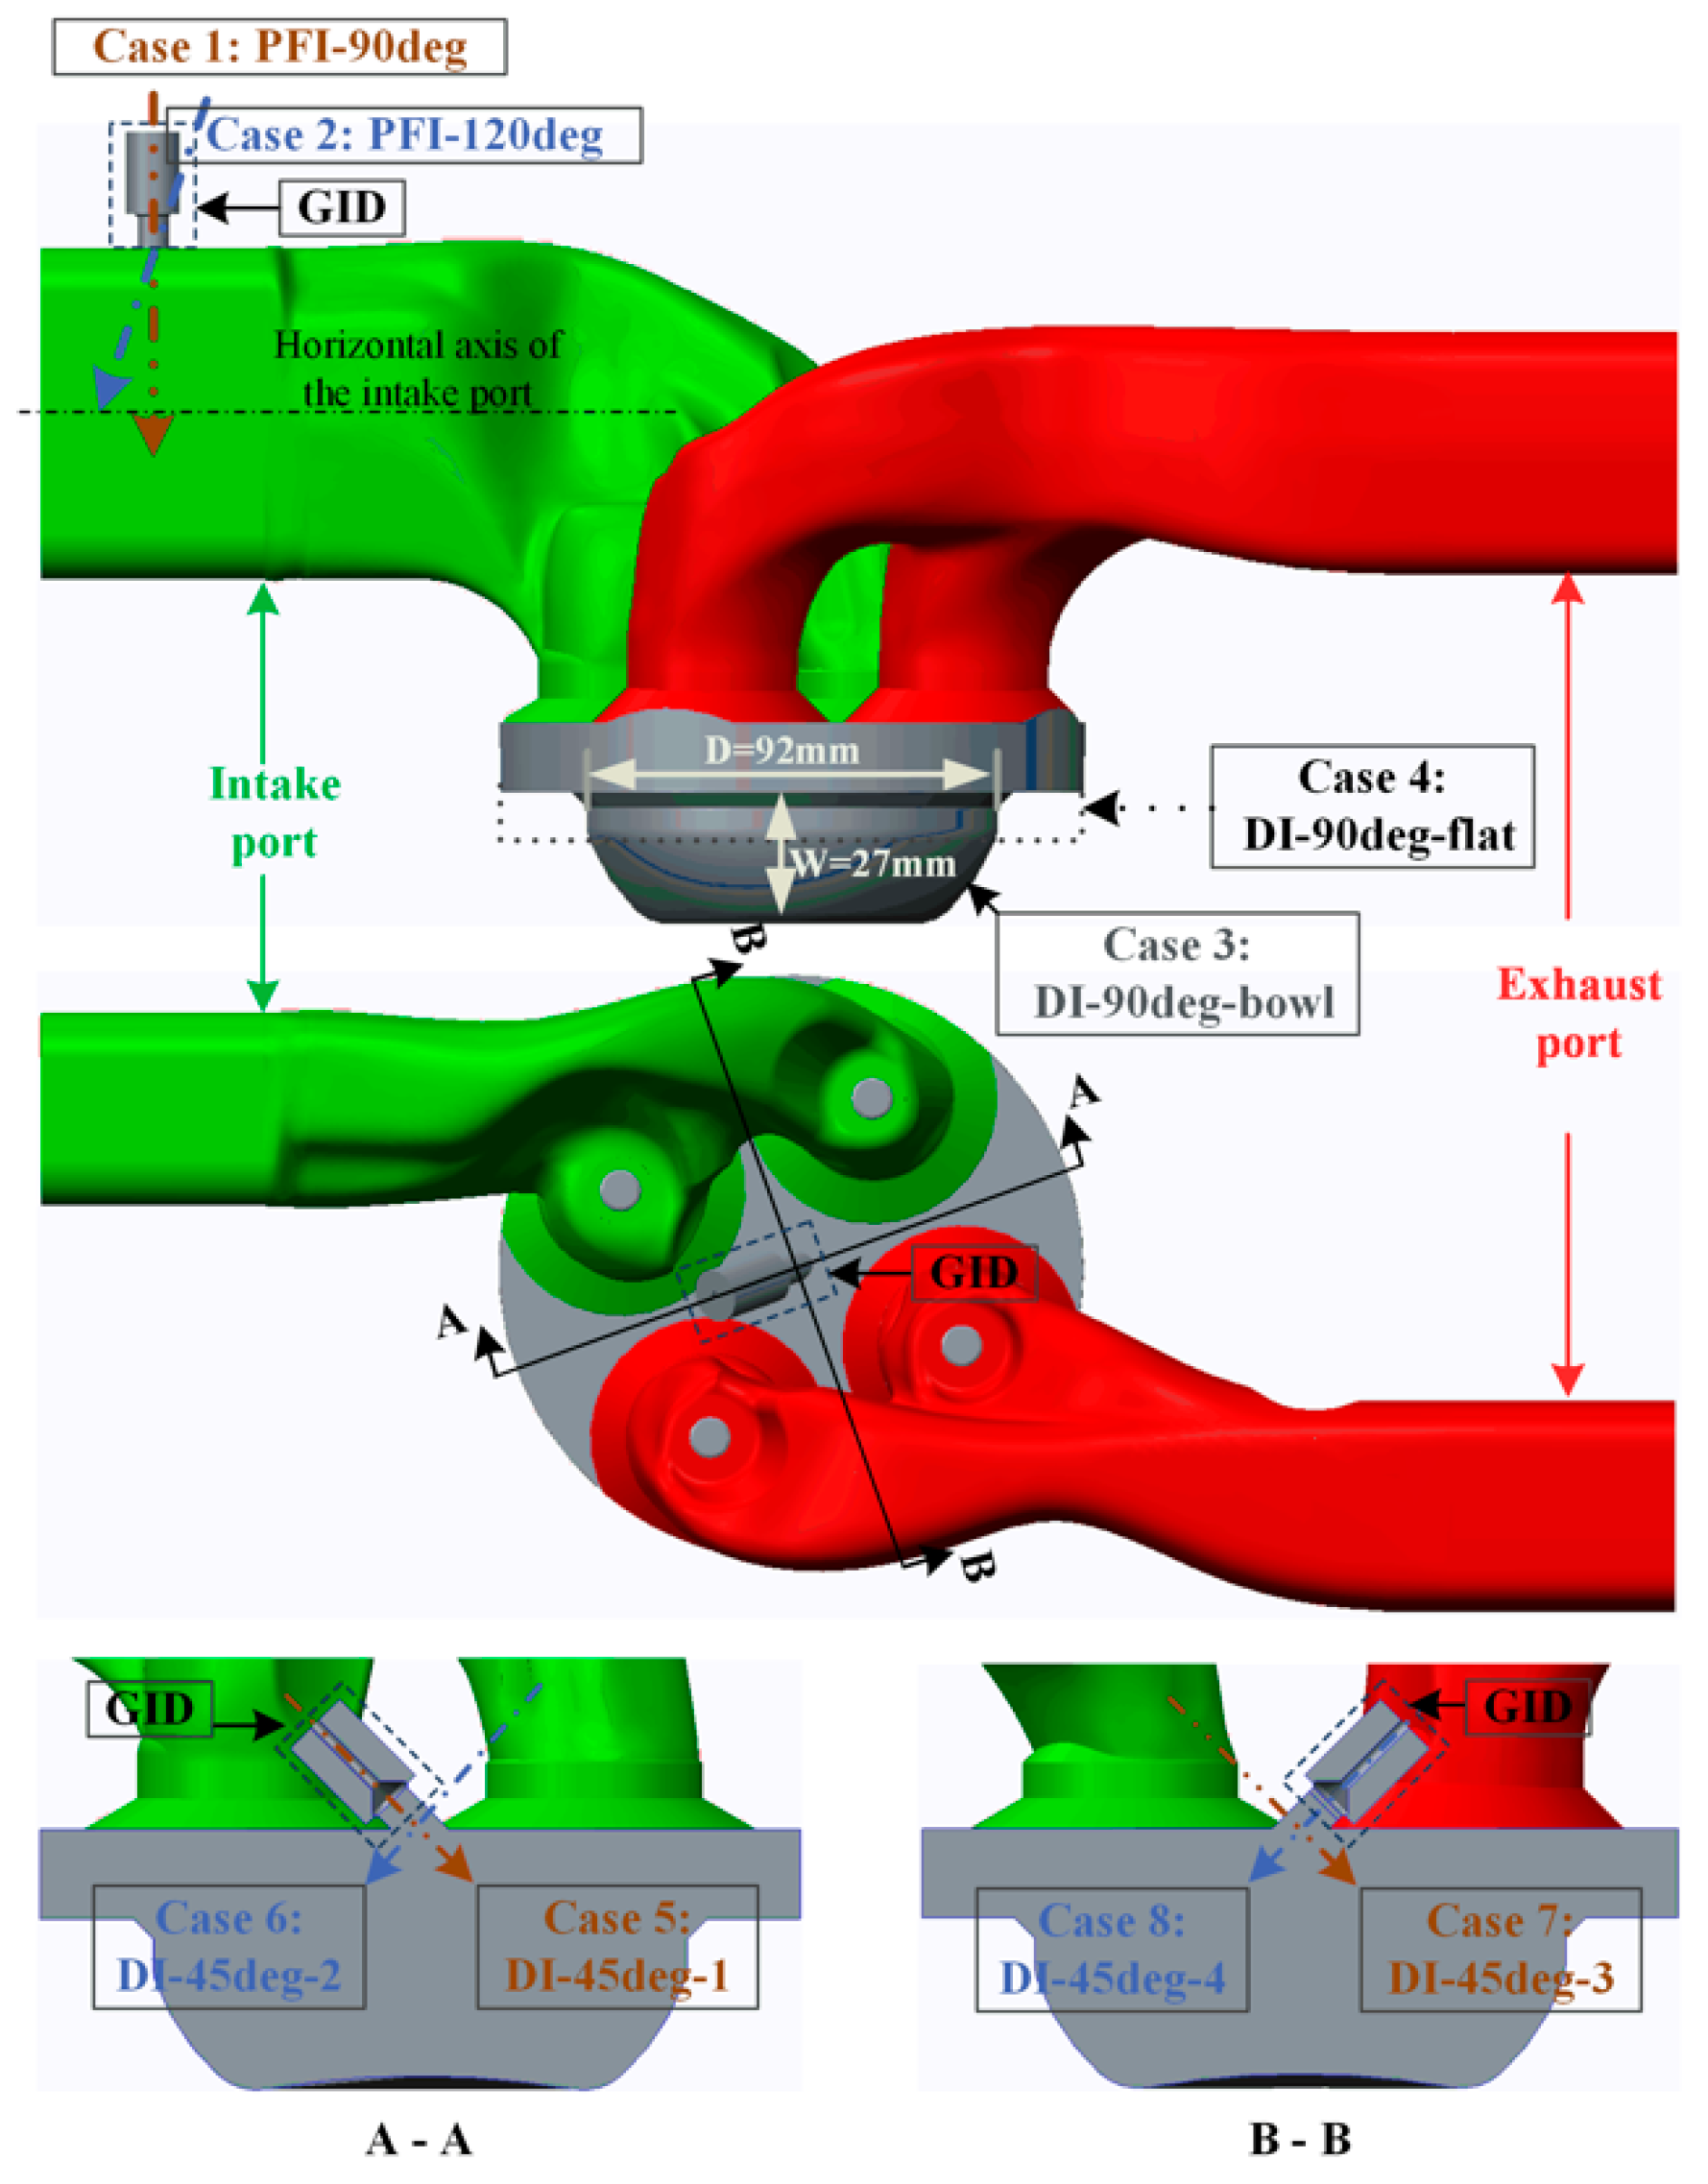
24], the pull-open injector has a faster injection velocity than the push-open one, which means that the gas fuel jet will impinge on the piston with greater intensity, and better in-cylinder mixing uniformity will be created. Therefore, the GID adopts a pull-open form, whether it is the PFI or DI mode. The opening/closing process of the GID needs transition time, which is set at 1 ms according to the previous research results.
For the PFI, the injection pressure is set as 0.7 MPa. As for the injection timing, the start of injection (SOI) is set as −20° ATDC, and the end of injection (EOI) is set as 87° ATDC. So, the duration of injection (DOI) is a 107° crank angle (CA). Actually, the effective DOI is about a 90° CA when the transition time is considered [
19]. For the PFI in this study, only the cases of 90 degrees and of 120 degrees are selected as Case 1 and Case 2, respectively, because they have a better mixing performance than the other injection angles, such as in the cases of 30 degrees, 60 degrees, and 150 degrees [
19].
For the DI, the injection pressure is set as 1.0 MPa. This value is set in order to reduce the manufacturing accuracy requirement of the injector and to make full use of gas fuel in the tank [
24]. The comparative study of the mixing performances of the PFI and DI modes should be based on the assumption that the in-cylinder gas fuel mass after the intake valve closing (IVC) of the PFI and DI modes are the same. Based on the in-cylinder gas fuel mass of the PFI after the IVC and exhaust valve closing (EVC), the DOI for the DI mode is calculated as a 51° CA. The SOI is set as 224° ATDC, and the EOI is set as 275° ATDC. The value of the EOI is to ensure that the gas injection mass flow rate will not be affected by the downstream injection pressure (i.e., the pressure in the cylinder) under the injection pressure of 1.0 MPa, which can facilitate the calibration of the injection pulse width [
24].
According to the authors’ previous research results, the in-cylinder mixing uniformity could be improved by delaying the injection timing, which means that the jet impingement distance is shortened. Therefore, the flat top piston (Case 4) is used to replace the deep bowl piston (Case 3) of the prototype. For Case 4, the purpose of shortening the jet impingement distance is realized actually.
What is more, for the DI mode, the influence of the gas injection angle on the mixing performance will be explored in this paper. The GID is arranged at four 45-degree directions of the cylinder axis, respectively, as Cases 5–8. For these four cases, it may bring some different interactions between the gas fuel jet flow and the in-cylinder vortex flow, or tumble flow, created by the combination intake port. A different interaction would show a different mixing performance. These 8 cases are shown in
Figure 1, and the specific parameters are shown in
Table 2.
The intake boundary condition of the engine is set as 0.2 MPa (turbo-charged) and 353 K, and the exhaust condition is set as 0.18 MPa and 773 K. The whole domain is assumed to be initially quiescent. Software FLUENT is used in this paper. The program is based on the pressure-correction method and uses the PISO algorithm. The first-order upwind differencing scheme is used for the momentum, energy, and turbulence equations.
The grid independence study and turbulence model verification have been analyzed in the authors’ previous research [
19,
24]. One of the most important factors affecting the numerical model’s ability to predict the flow correctly is the number of grid points across the injector nozzle. There should be more than 10 layers of grids across the nozzle diameter [
11]. Considering that the valve diameter is 7 mm, as shown in
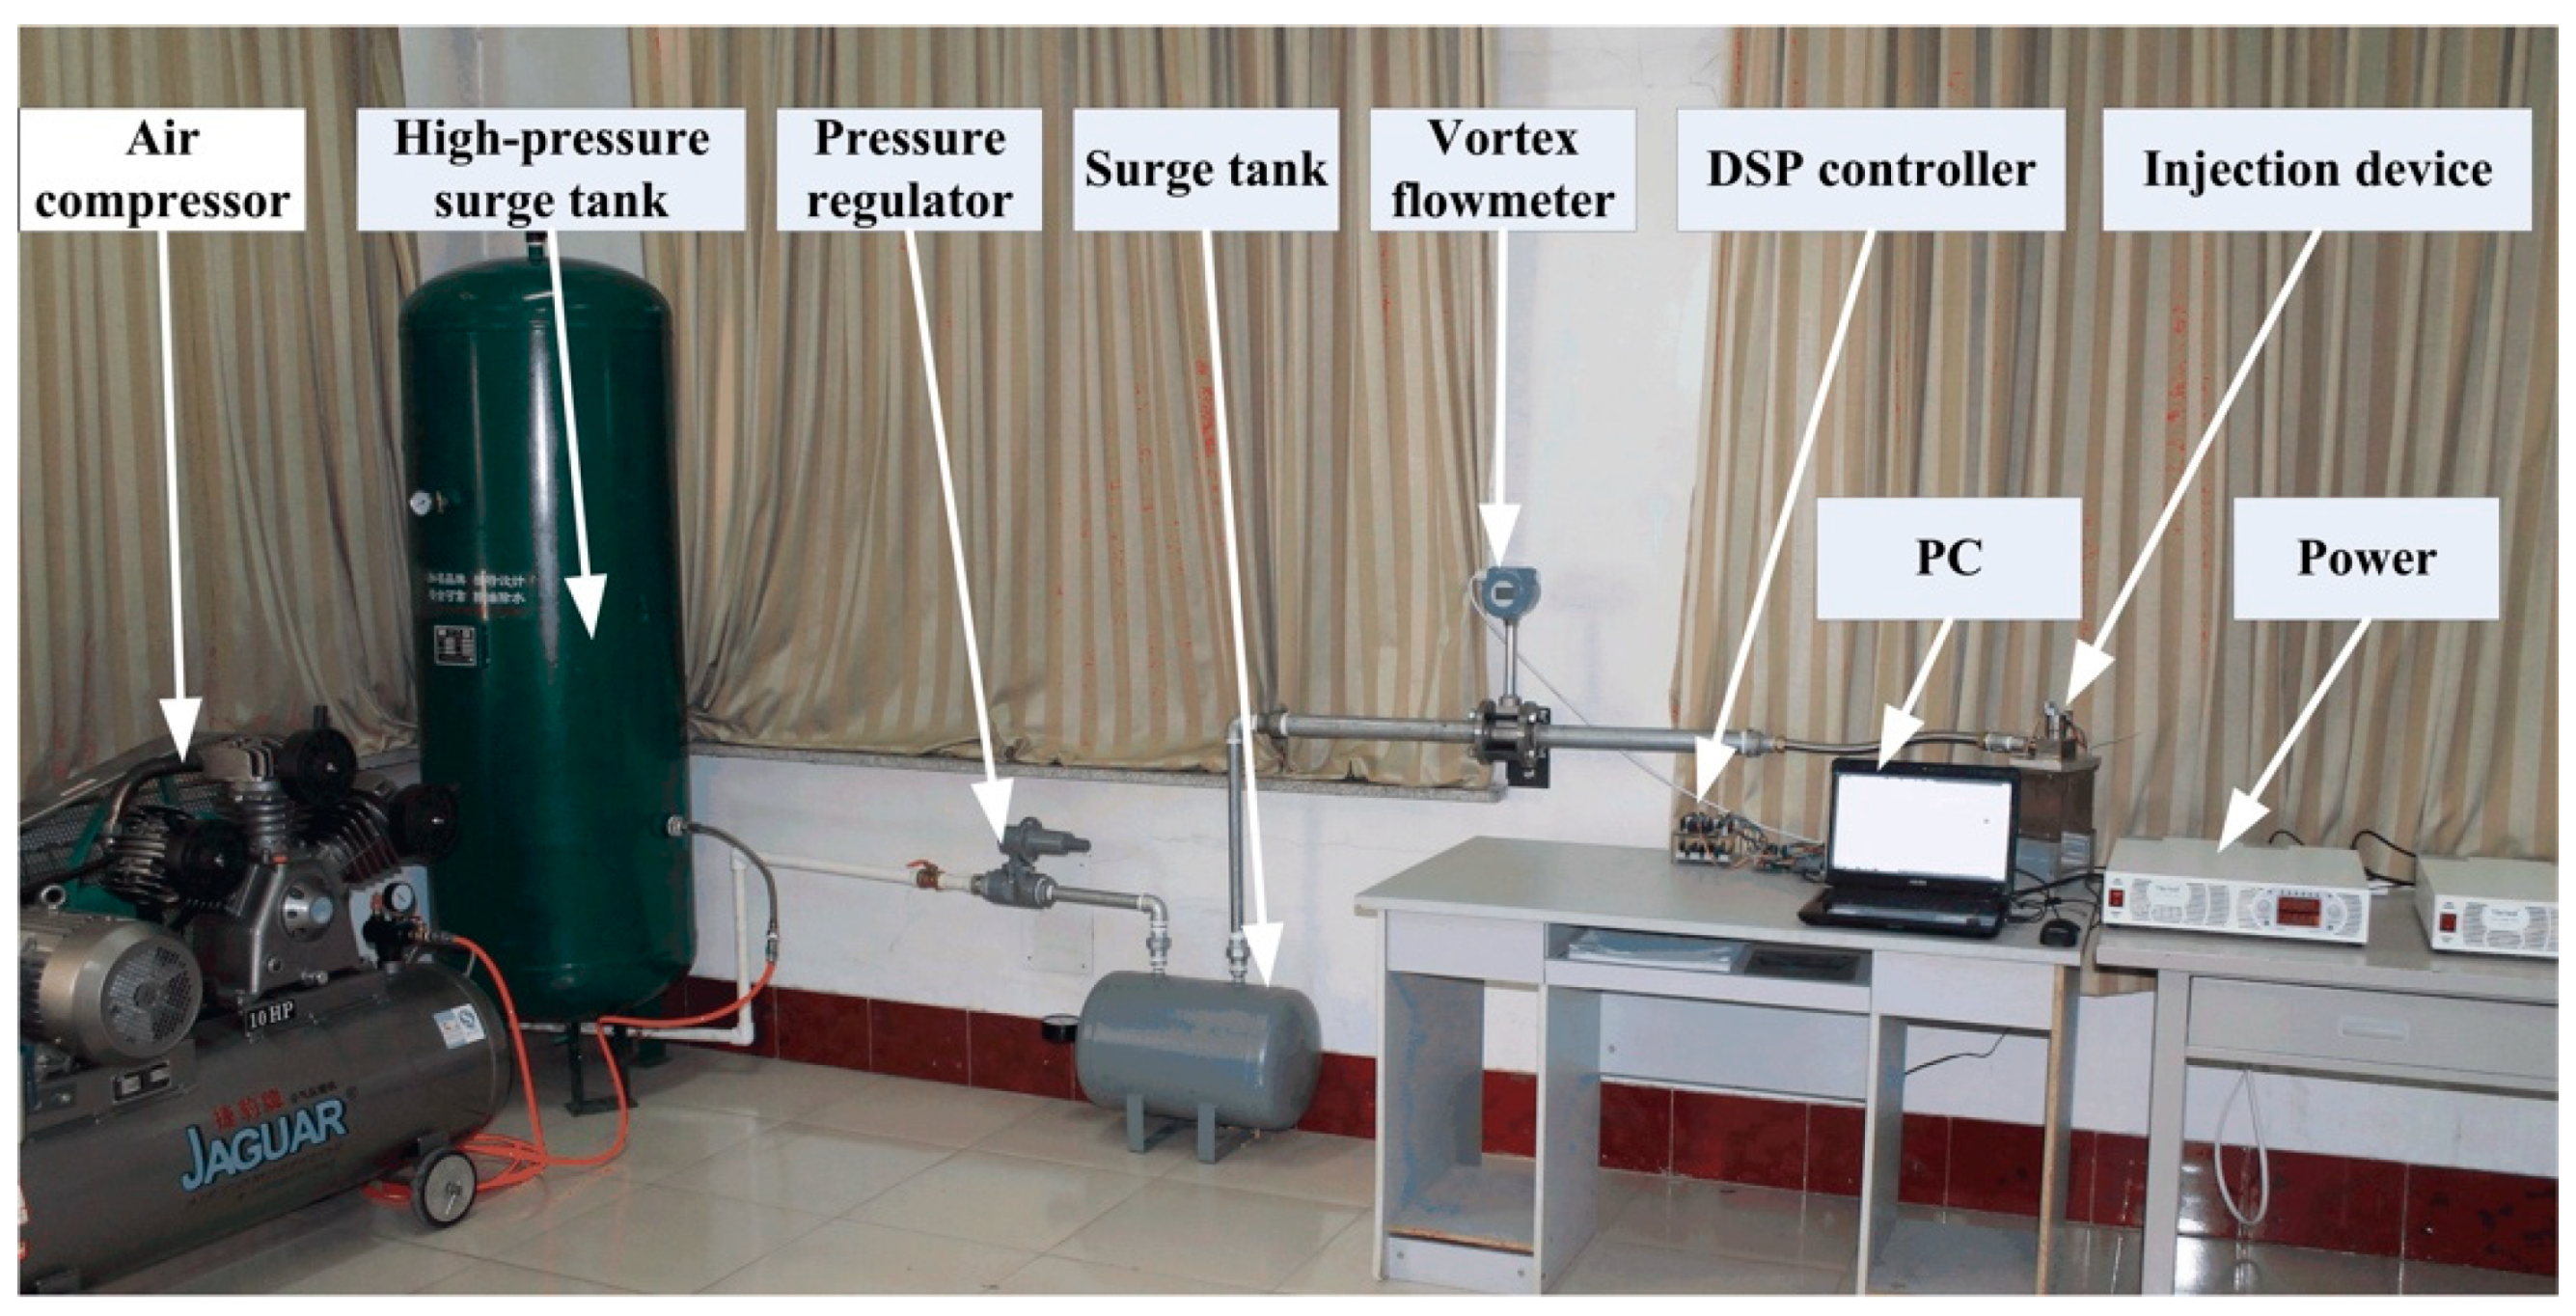
Table 2, the grid size in the nozzle near-field is set as 0.3mm. The mesh size, up to a maximum of 3 mm, is taken in other areas. The mesh is refined near the exit area and the core area of the jet. The steady volumetric flow rate measurement platform for the gas injector was built to validate the grid independence, as shown in
Figure 2. The compressed air instead of CNG was taken as the gas source for safety’s sake. The difference in the volumetric flow rate between the experimental value and simulation value was less than 3.1%. At the bottom dead center (BDC), the total mesh amount of this injection-mixing CFD model is about 2,800,000. Besides, the effects of the three kinds of commonly used Reynolds-averaged Navier–Stokes (RNS) turbulence models on the calculated penetration distance of the wall impinging jet have been analyzed. What is more, the simulation accuracies of two kinds of wall functions (standard wall function and non-equilibrium wall function) have also been compared. Based on the verification results mentioned above, the RNG k–ε turbulence model and the non-equilibrium wall function are used in this study. The turbulent Schmidt number takes the fixed default value of 0.7. The coefficient C
1ε used in the ε equation takes a value of 1.42, the coefficient C
2ε takes a value of 1.68, and the coefficient Cμ takes a value of 0.0845.
3. Results and Discussion
Based on the eight cases above, the influences of the gas fuel injection mode, shape of the piston top, and injection angle on the in-cylinder mixing uniformity will be discussed as follows. It should be pointed out that only the mixing process is discussed in this study. The in-cylinder gas fuel mass of these eight cases is the same for all of the cases, at about 0.168 g, as proposed above. For the PFI case, the in-cylinder air mass after the IVC may be less than that of the DI case because the airflow may be blocked by the gas fuel jet in the intake port. The in-cylinder air mass at the ignition timing is about 6.07 g for the PFI mode and 6.21 g for the DI mode.
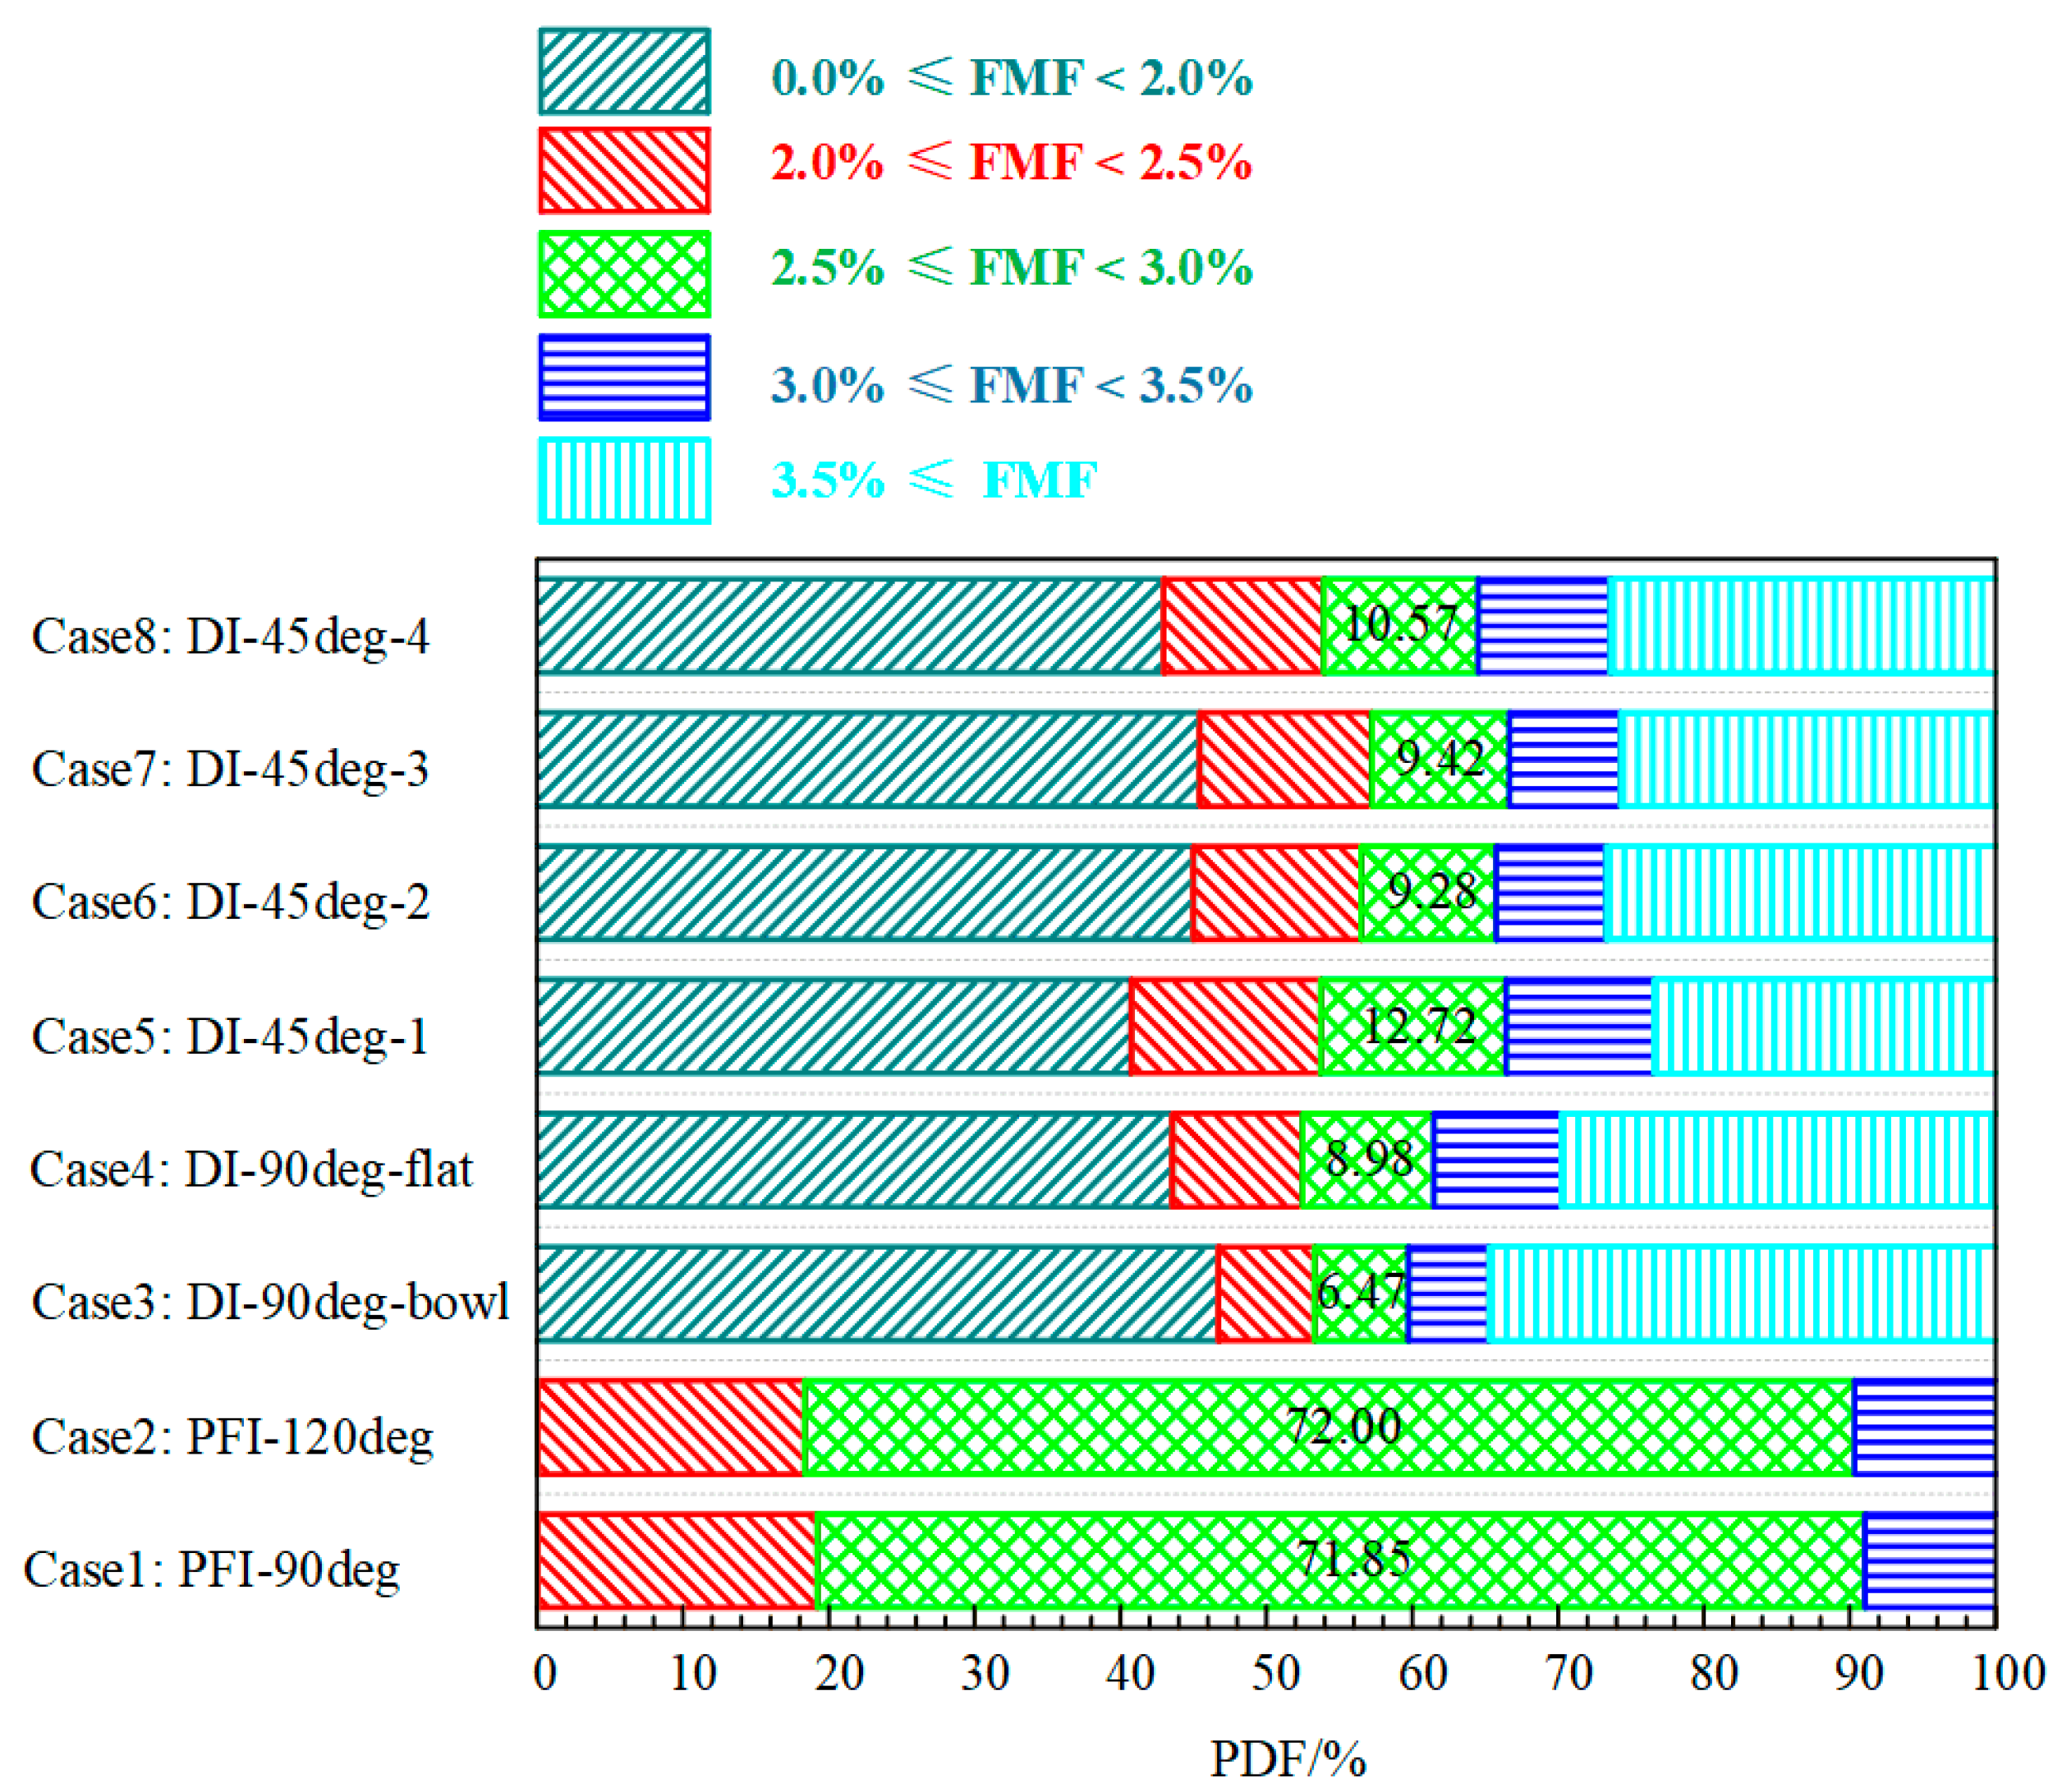
The best mixture concentration region (BMCR), which is calculated according to the in-cylinder air and fuel mass after the IVC, is the same for all of the eight cases; it is 2.5–3.0%. It could be assumed that with the increase of the probability distribution frequency (PDF) in the BMCR, the in-cylinder mixing performance would be better. Correspondingly, 2.0–2.5% is taken as the thinner interval, 3.0–3.5% as the thicker interval, 0.0–2% as the thinnest interval, and a fuel mass fraction (FMF) larger than 3.5% as the thickest interval.
At the ignition timing (340° ATDC, corresponding to CA700), the PDFs of all the mass fraction intervals for all the cases are shown in
Figure 3. The PDFs of the BMCR are compared. At first, it is obvious that the PDF of the BMCR for the PFI mode is much higher (at over 71.85%) than that for the DI mode (from 6.47% to 12.72%). This comes from a longer mixing path and mixing duration of the PFI mode. Of course, such an excellent mixing performance should be the direction taken in making efforts for the DI mode. Secondly, it can be found that the PDF of the BMCR for Case 4 (the flat piston) is larger than for Case 3 (the bowl piston). The former is 8.98%, while the latter is 6.47%. Besides, the PDFs of the thicker interval and the thinner interval near the BMCR are also larger for Case 4. It can be easily concluded that the use of the flat top piston is beneficial to improving the in-cylinder mixing uniformity. As for the reason for this phenomenon, we will discuss it later. Thirdly, as the injection angle is changed from 90 degrees to 45 degrees, the PDF of the BMCR will be increased from 6.47% to more than 9.28%. Among Cases 5–8, Case 5 has the highest value (12.72%), which is almost double Case 3 (the injection angle at 90 degrees). Similarly, the PDFs of the thicker interval and the thinner interval for Cases 5–8 are higher than Case 3. That means the mixing uniformity will be increased if the GID is arranged in 45-degree directions of the cylinder axis.
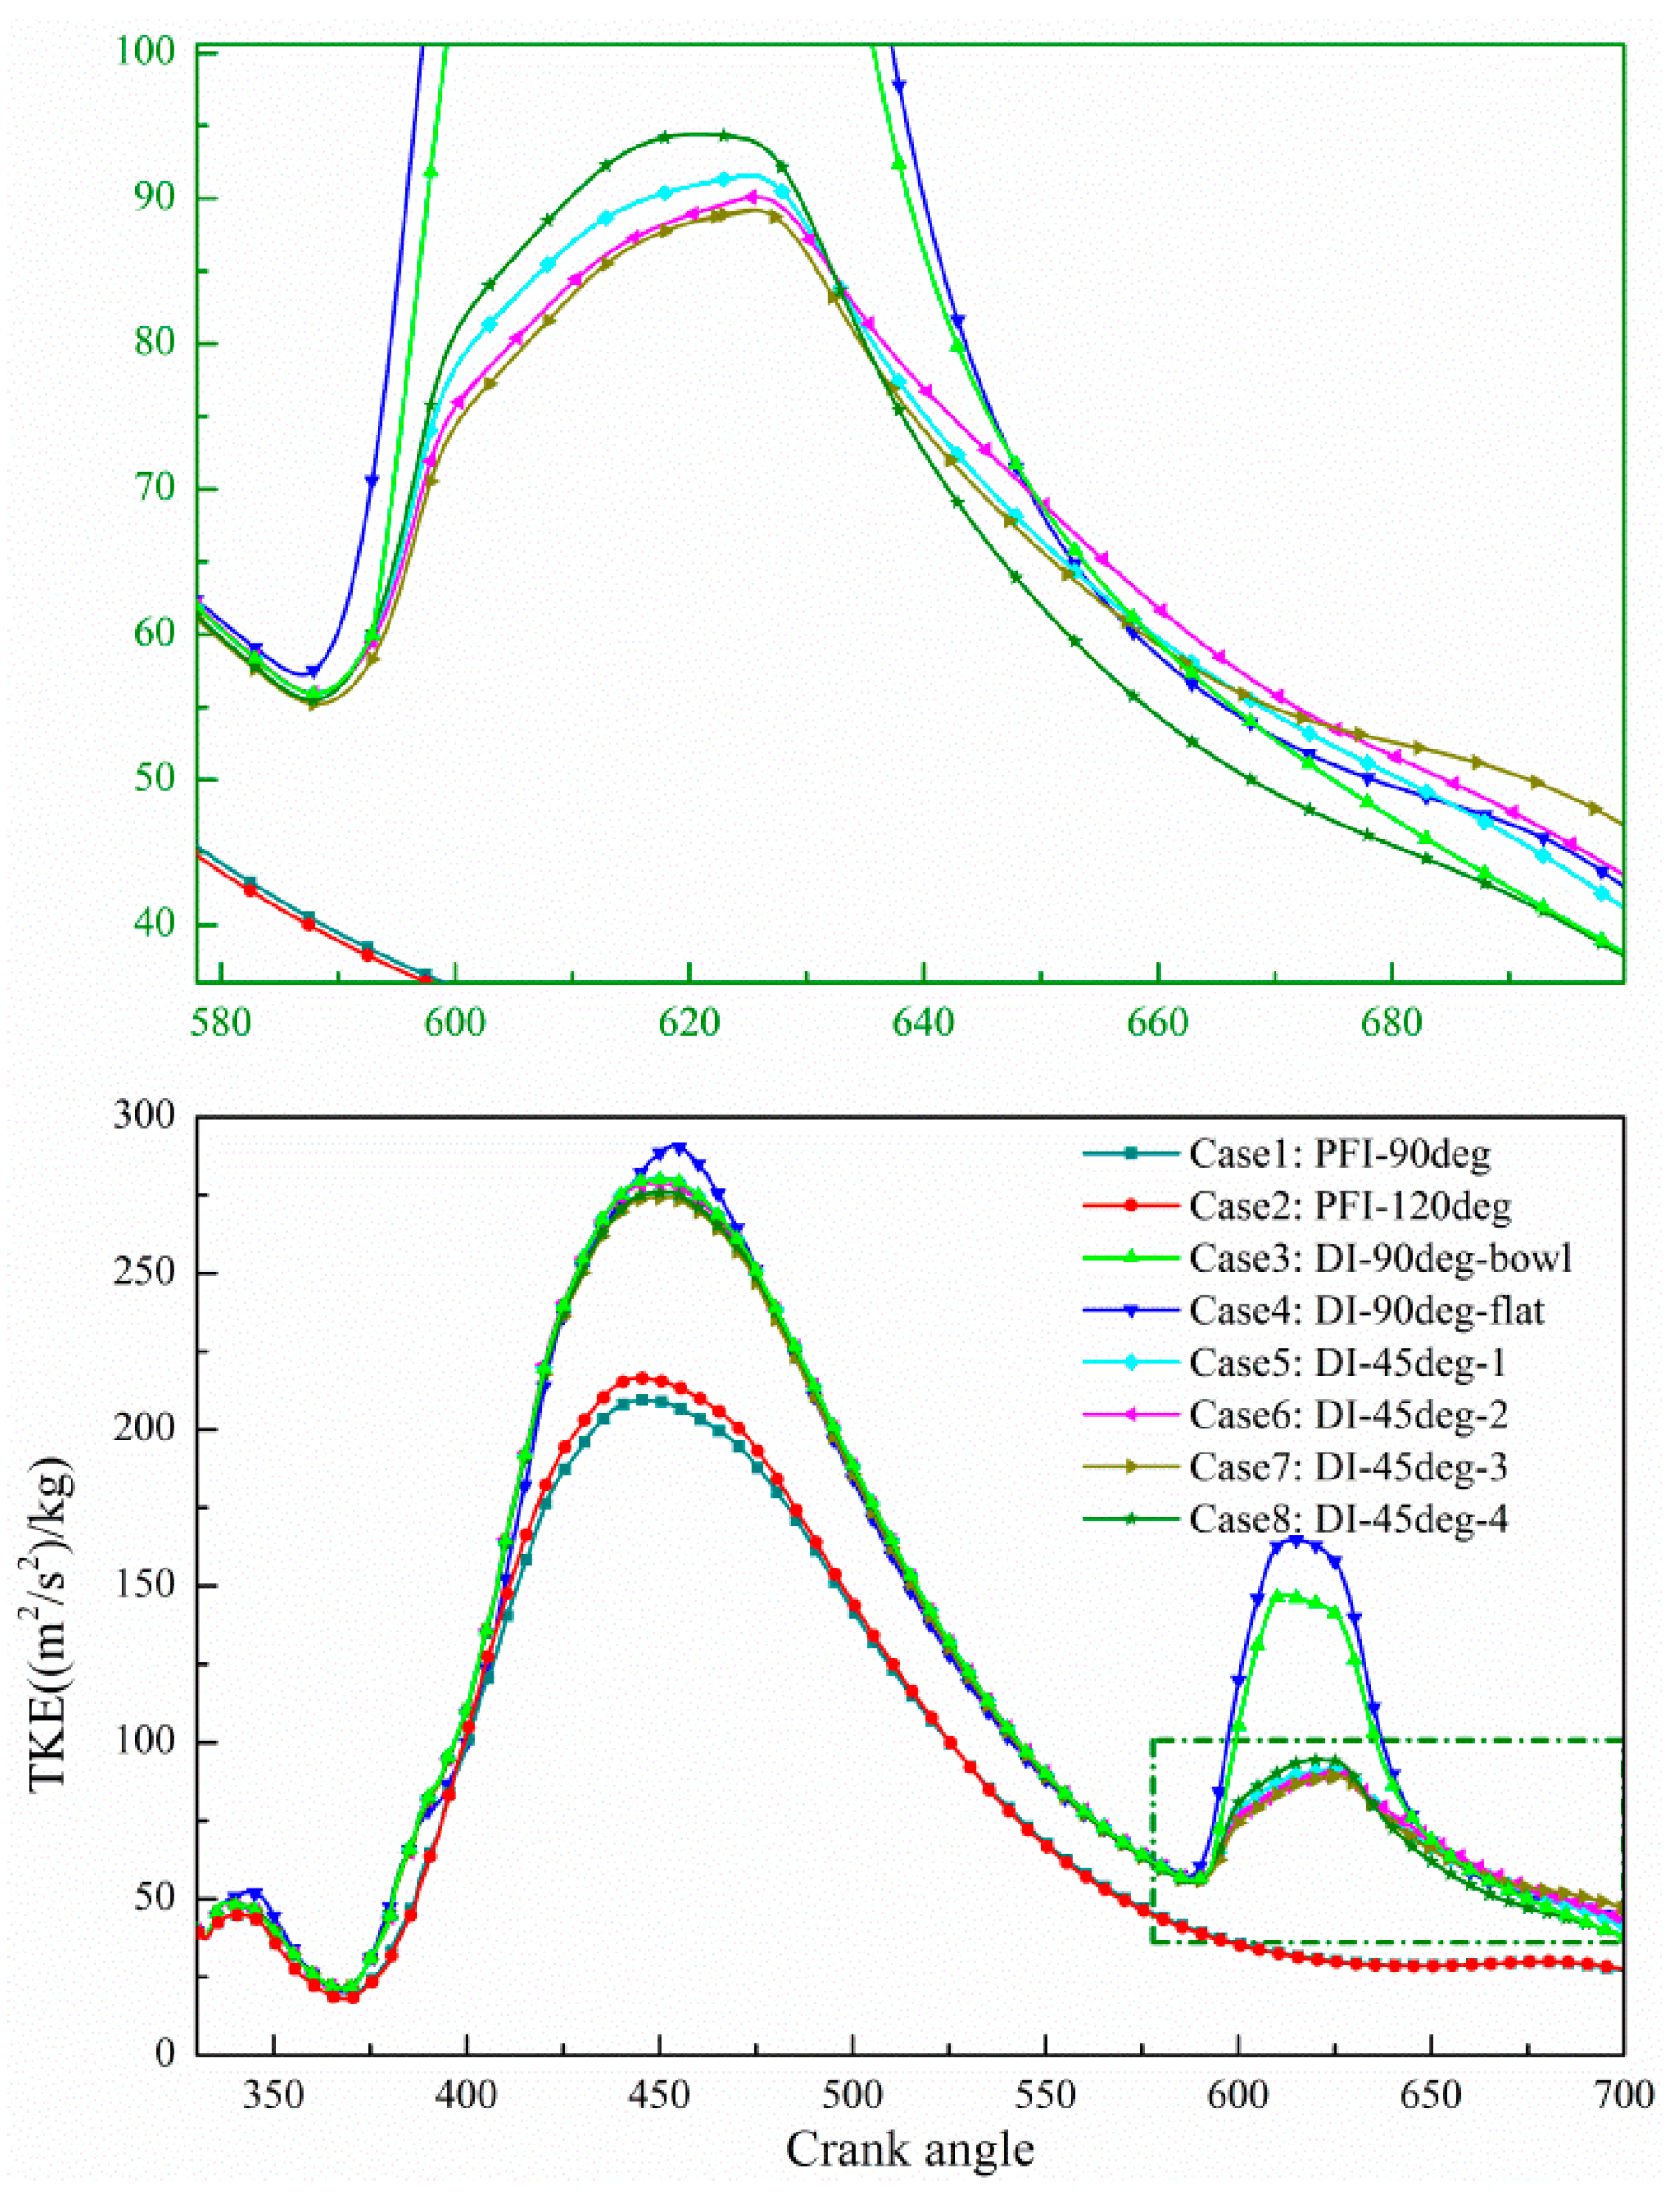
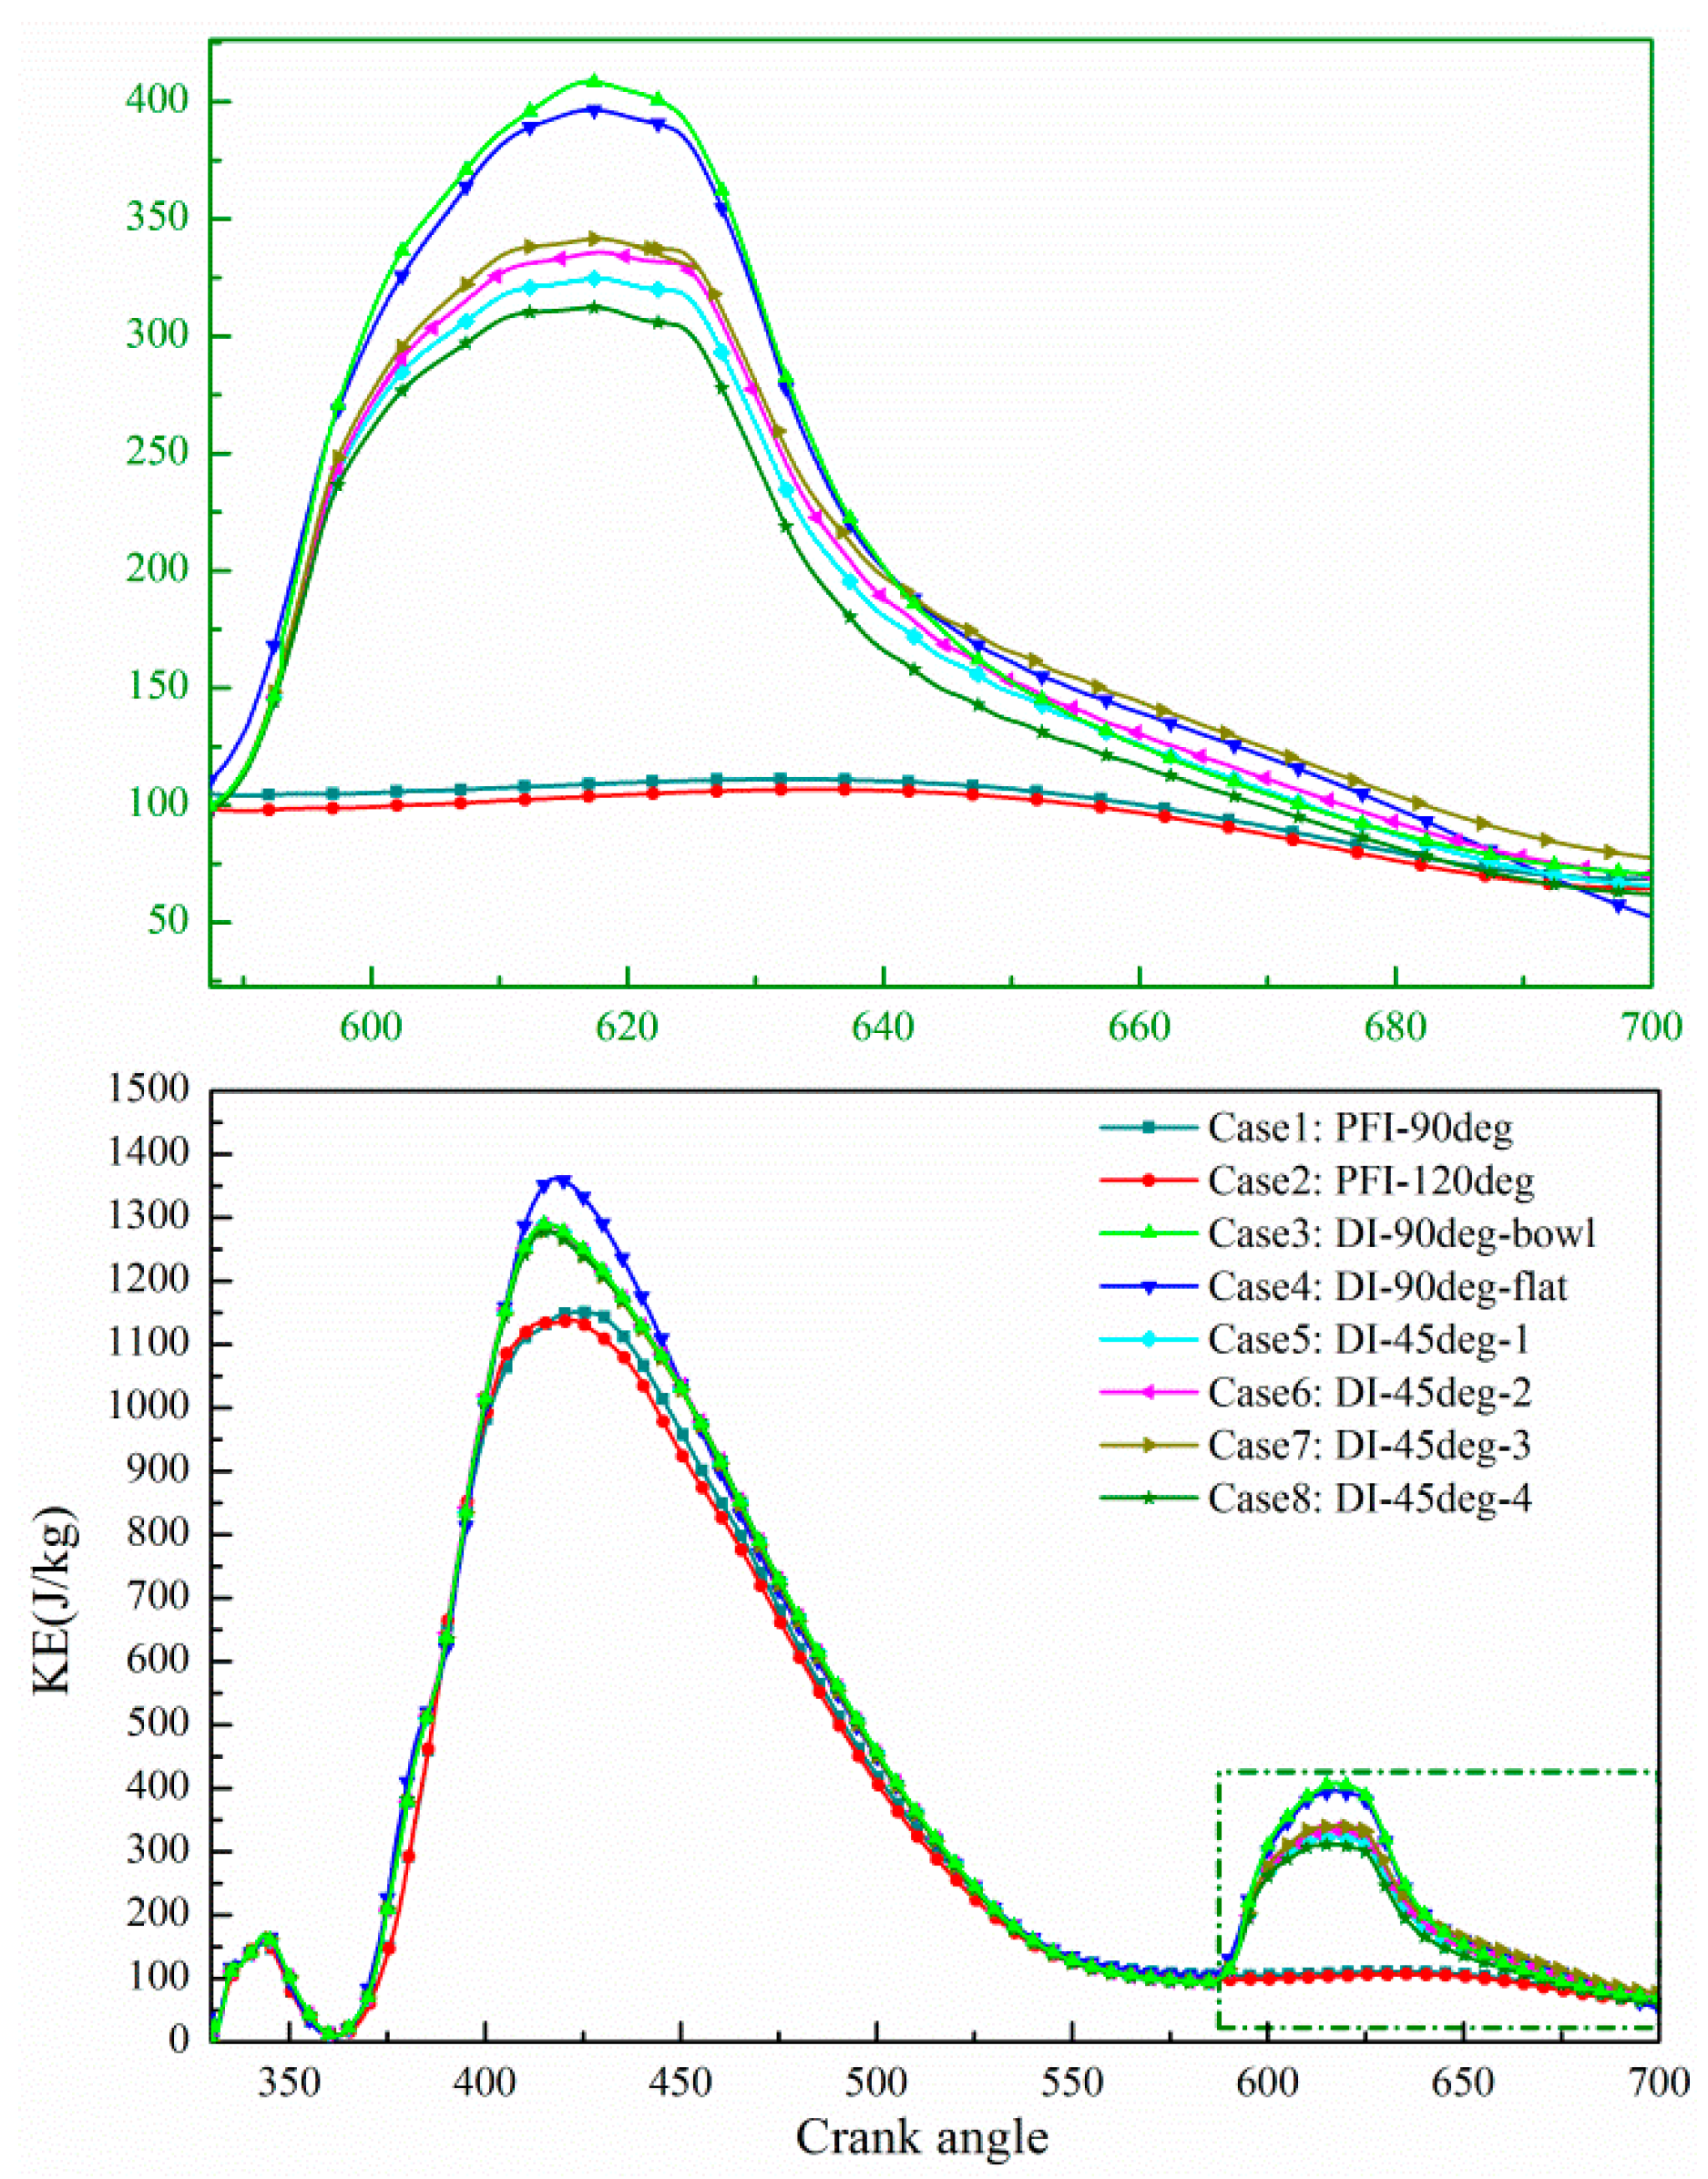
In order to analyze the reasons for the different mixing performances, the in-cylinder unit mass TKEs and the unit mass kinetic energies (KEs) of all the cases are compared further, as shown in
Figure 4 and
Figure 5. The definition of the unit mass TKE and KE are given in Equations (1) and (2):
where KE is the unit mass kinetic energy; TKE is the unit mass turbulence kinetic energy;
is the density of the
ith grid cell;
is the velocity of the
ith grid cell;
is the volume of the
ith grid cell;
is the turbulence kinetic energy of the
ith grid cell.
Firstly, for the PFI (Case 1 and Case 2), because the gas injection pressure (0.7 MPa) is lower (the injection velocity is slower) and the injection position is far from the cylinder than the DI mode, the in-cylinder TKE and KE values are much smaller than that for the DI mode (Cases 3–8). A better mixing uniformity comes from a longer mixing path and mixing duration of the PFI mode. Secondly, as for the effect of the piston type, it can be easily found that Case 4 with the flat top piston has a larger TKE value than Case 3 with the bowl piston (as shown in
Figure 3), while Case 4 has a smaller KE than Case 3. Indeed, Case 4 has a flat top piston, which can shorten the jet impingement distance indirectly. The shortened impingement distance means a stronger impingement intensity. It is evident that the energy that passes through the injector to the engine is conservative no matter how the macroscopic (including the tumble flow and vortex flow) or microscopic (usually the TKE) part changes. For the flat top piston case, the macroscopic flow will be blocked by a shorter impingement distance, and so the TKE is enlarged. On the other hand, the shorter distance also means that the supersonic jet fails to achieve better development. So, the KE, related to the jet velocity directly, will be decreased for Case 4. Actually, this conclusion is quite similar to the authors’ previous research on the effect of injection timing [
24]. Both replacing it with the flat top piston and delaying the SOI could improve the mixing performance.
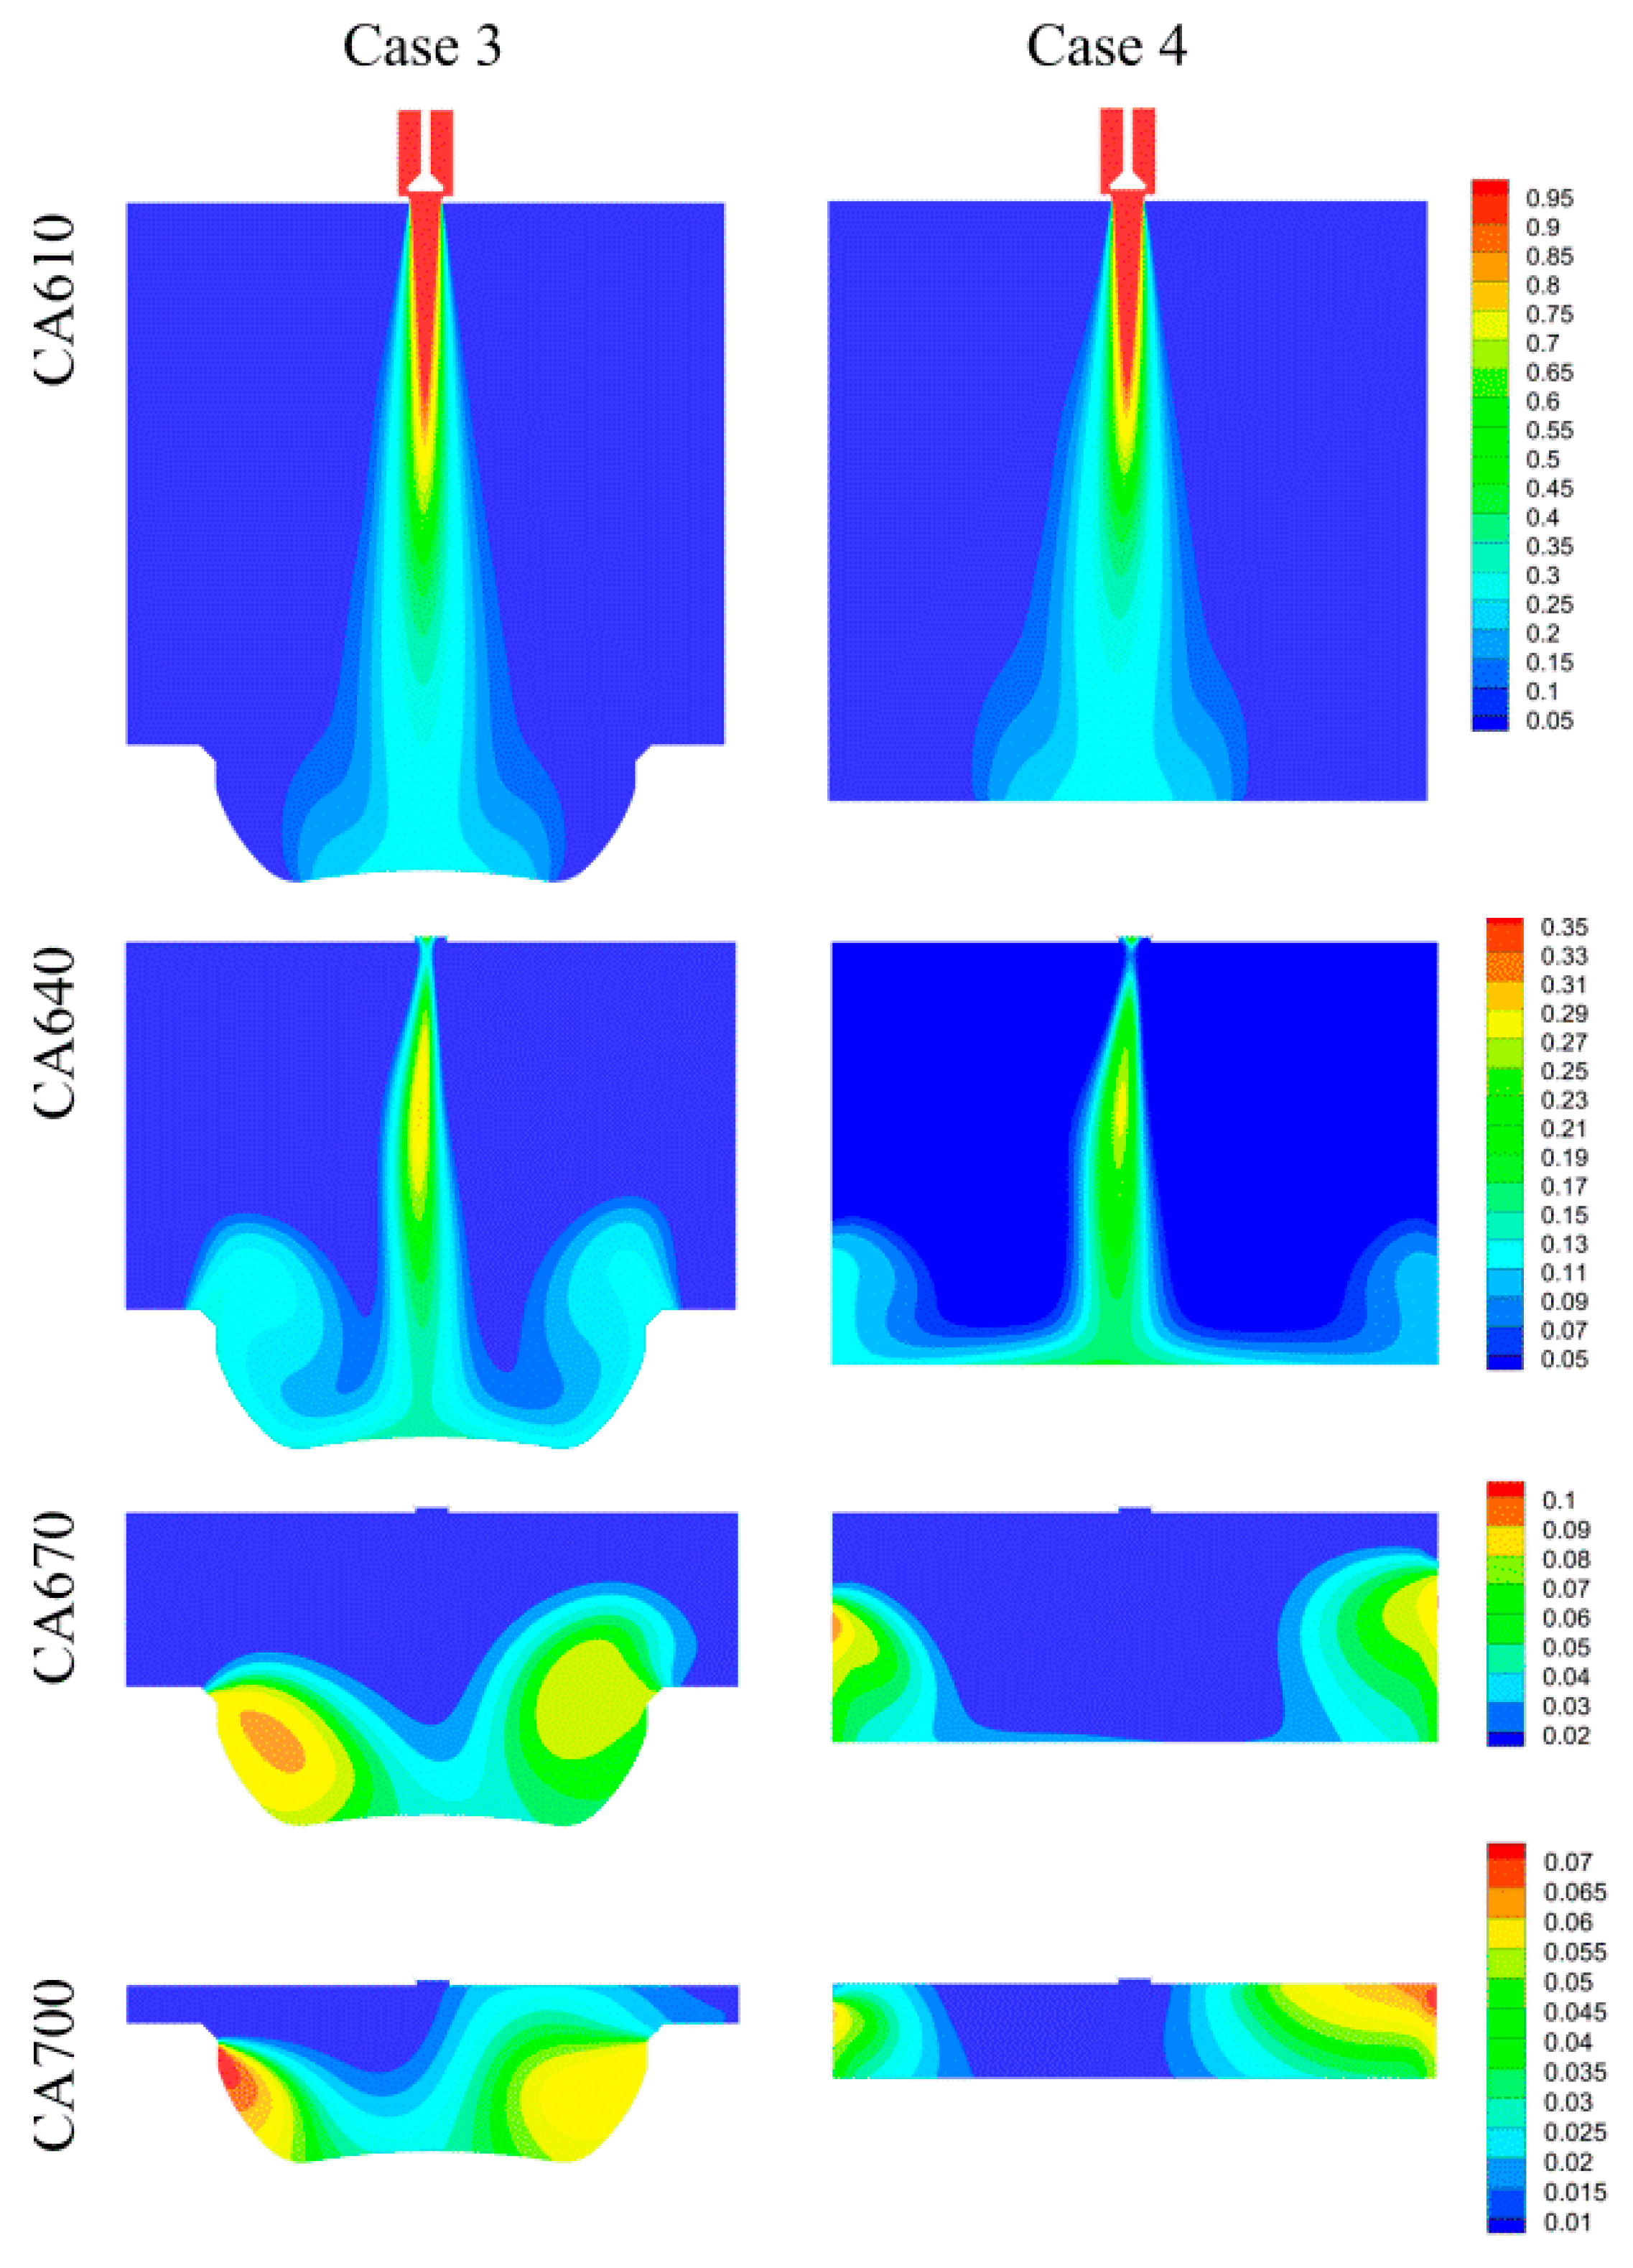
More specifically, the in-cylinder methane mass fraction distribution cloud diagrams of Case 3 and Case 4 from CA610 (after the SOI) to CA700 (the ignition time) are compared, as shown in
Figure 6. It can be seen that, in the case of the bowl piston, the tumble flow will be formed in the cylinder along the wall surface of the deep bowl after the gas fuel jet impinges on the top of the piston. This characteristic remains until the ignition moment, and most of the gas fuel is confined in the piston top. Due to the limiting effect of the deep bowl piston top, the mixing uniformity of Case 3 is bad, as shown in
Figure 2. While for the case of the flat top piston, the gas fuel jet is no longer limited by the outline of the piston. The impinging jet is formed along the flat plane of the piston. Then, the tumble flow is formed after the impinging jet corrodes with the cylinder wall. The lack of the piston outline’s guidance leads to the better mixing uniformity of Case 4, as shown in
Figure 2. However, although the latter has a better mixing performance, this kind of fuel distribution situation is not good for either the lean-burn or theoretical A/F combustion modes because almost all of the gas fuel is concentrated near the cylinder wall, which will lead to insufficient combustion and high heat load for the engine.
Finally, the effect of the injection angle on the mixing performance is discussed. By comparing the in-cylinder TKE and KE of Cases 5–8, as shown in
Figure 4 and
Figure 5, it can be found that Case 8 has the highest TKE, Case 5 takes second place, Case 6 takes third place, and Case 7 has the lowest value during the injection time, and that Case 7 has the highest KE, followed by Case 6, Case 5, and Case 8. What is more, by comparing the PDFs in the BMCR for Cases 5–8 at the ignition time, it is obvious that Case 5 has the best mixing uniformity, followed by Case 8, Case 6, and Case 7. There seems to be some correlation among them: for Cases 5–8, the case brings a higher TKE and lower KE, and this case will have a better mixing uniformity, as shown in
Table 3. This rule is not applicable to Case 5 and Case 8, however.
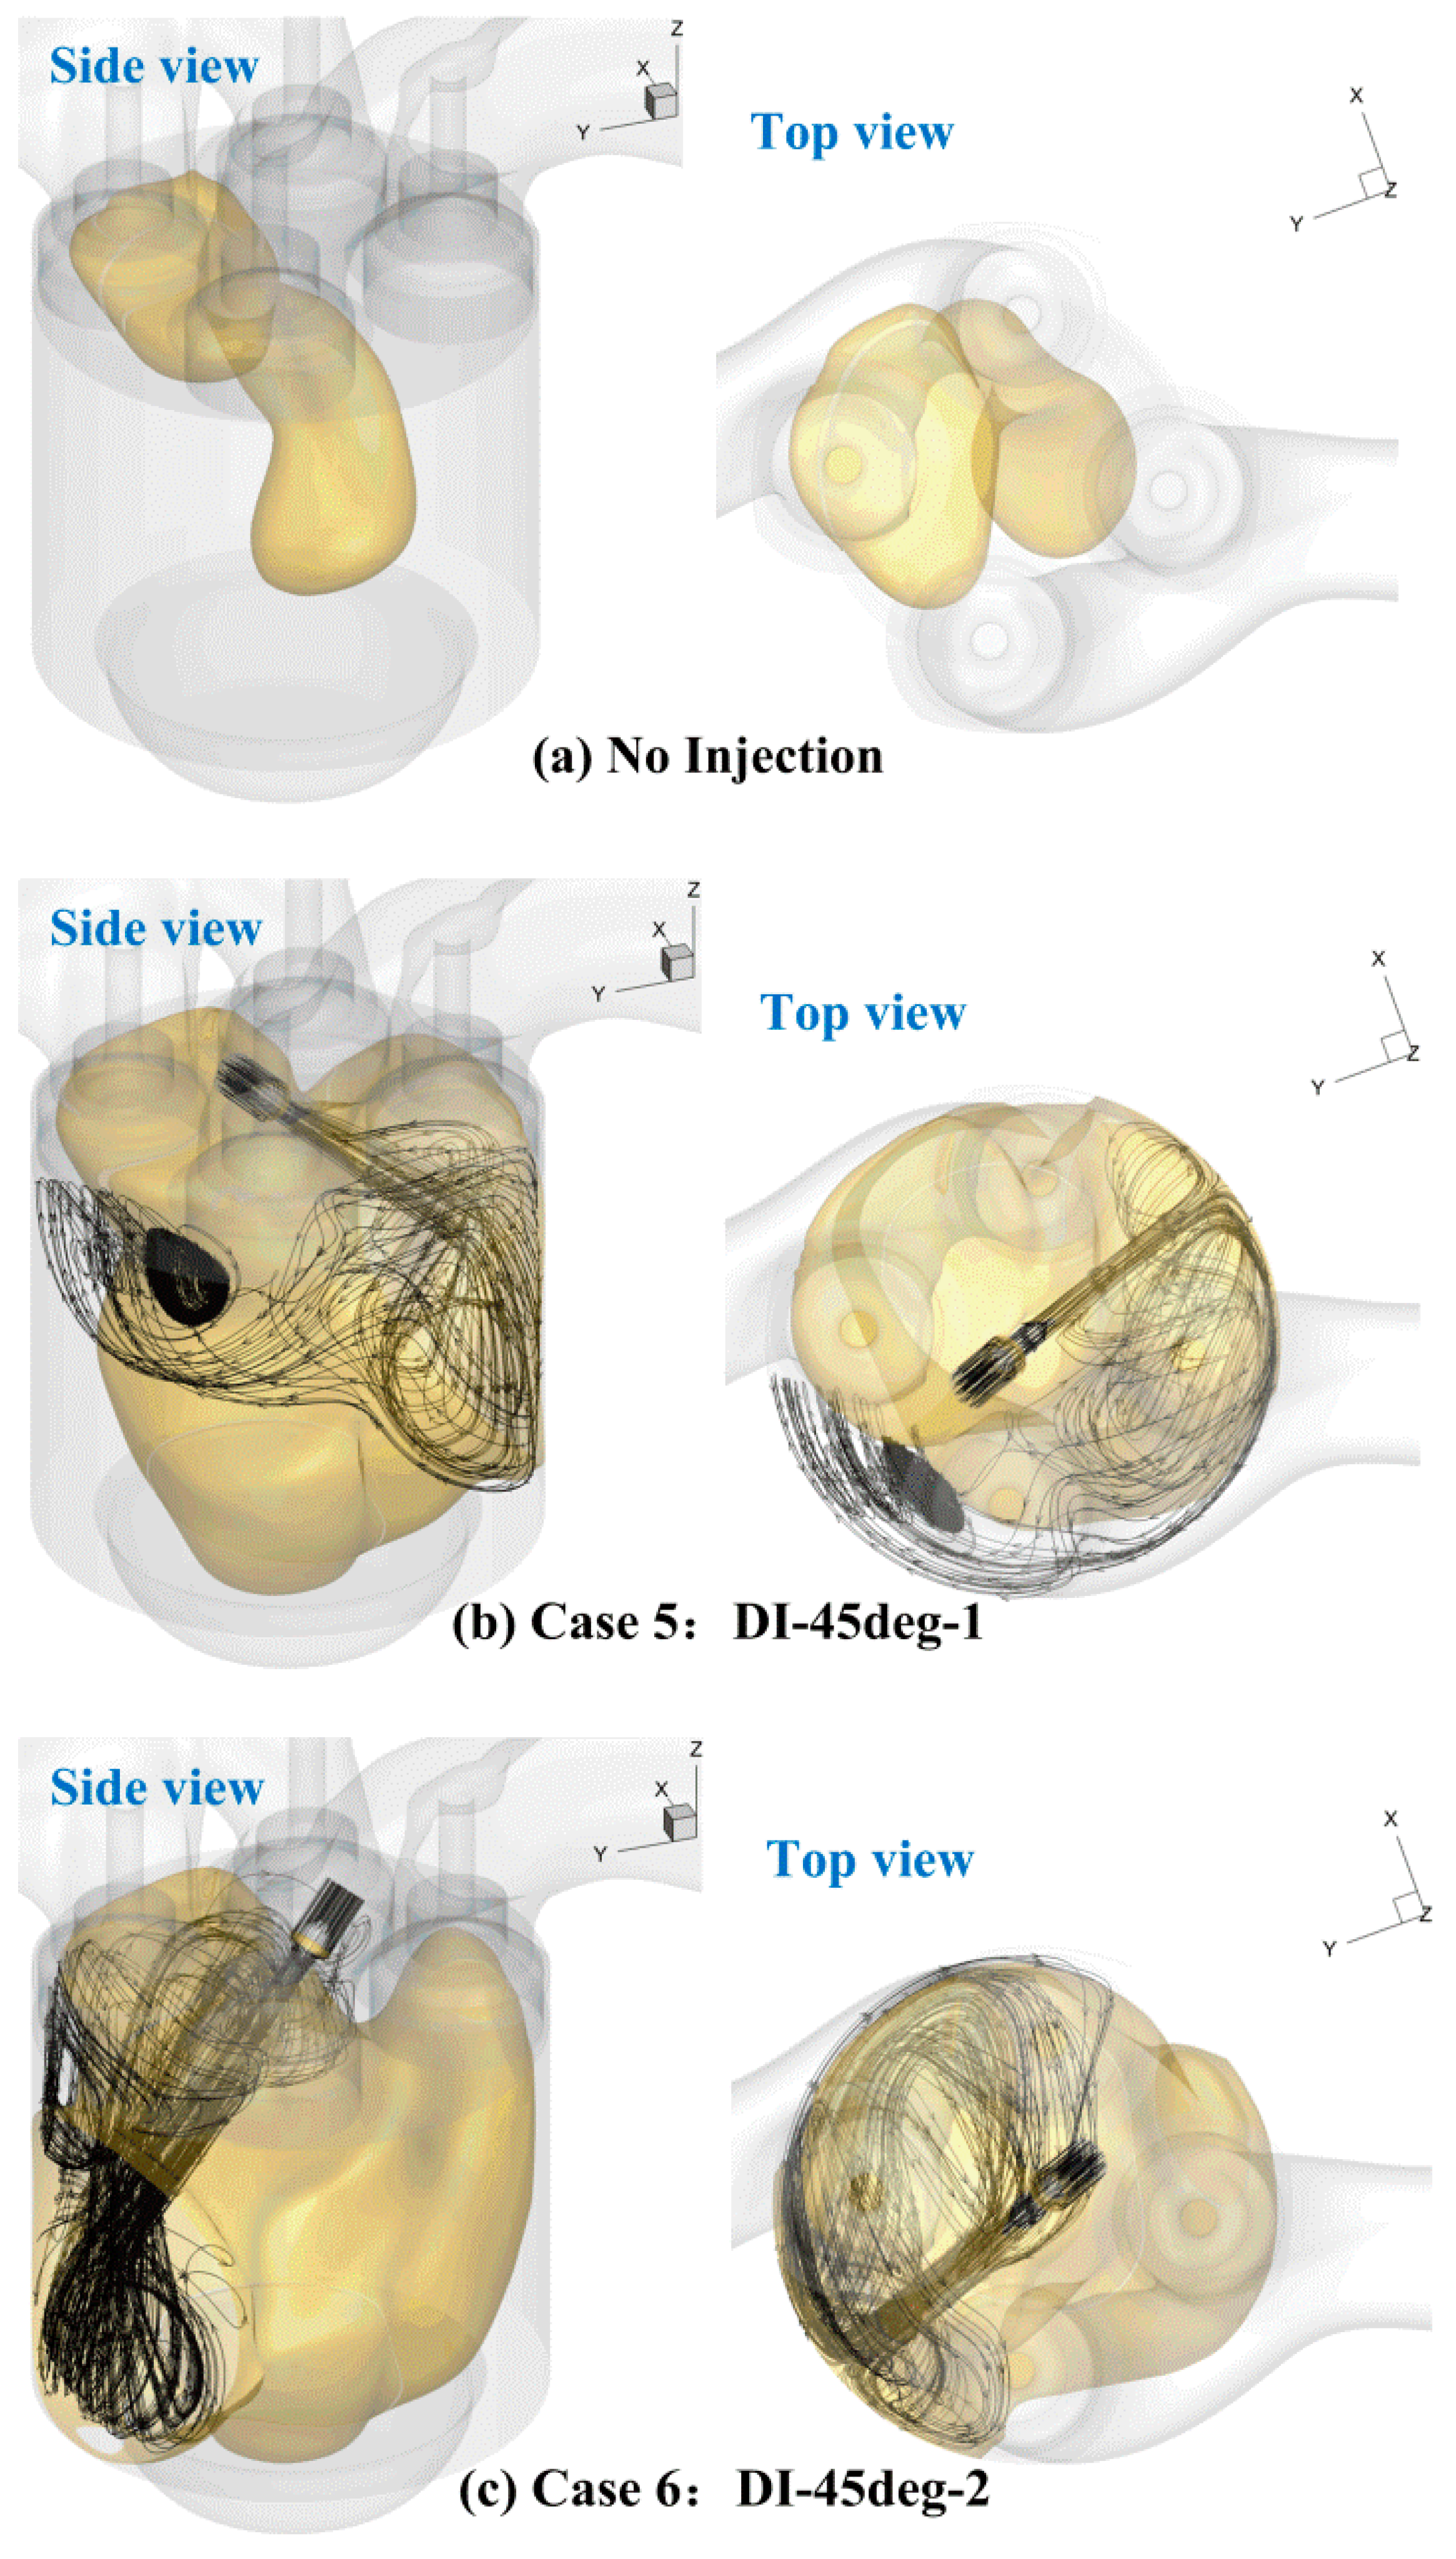
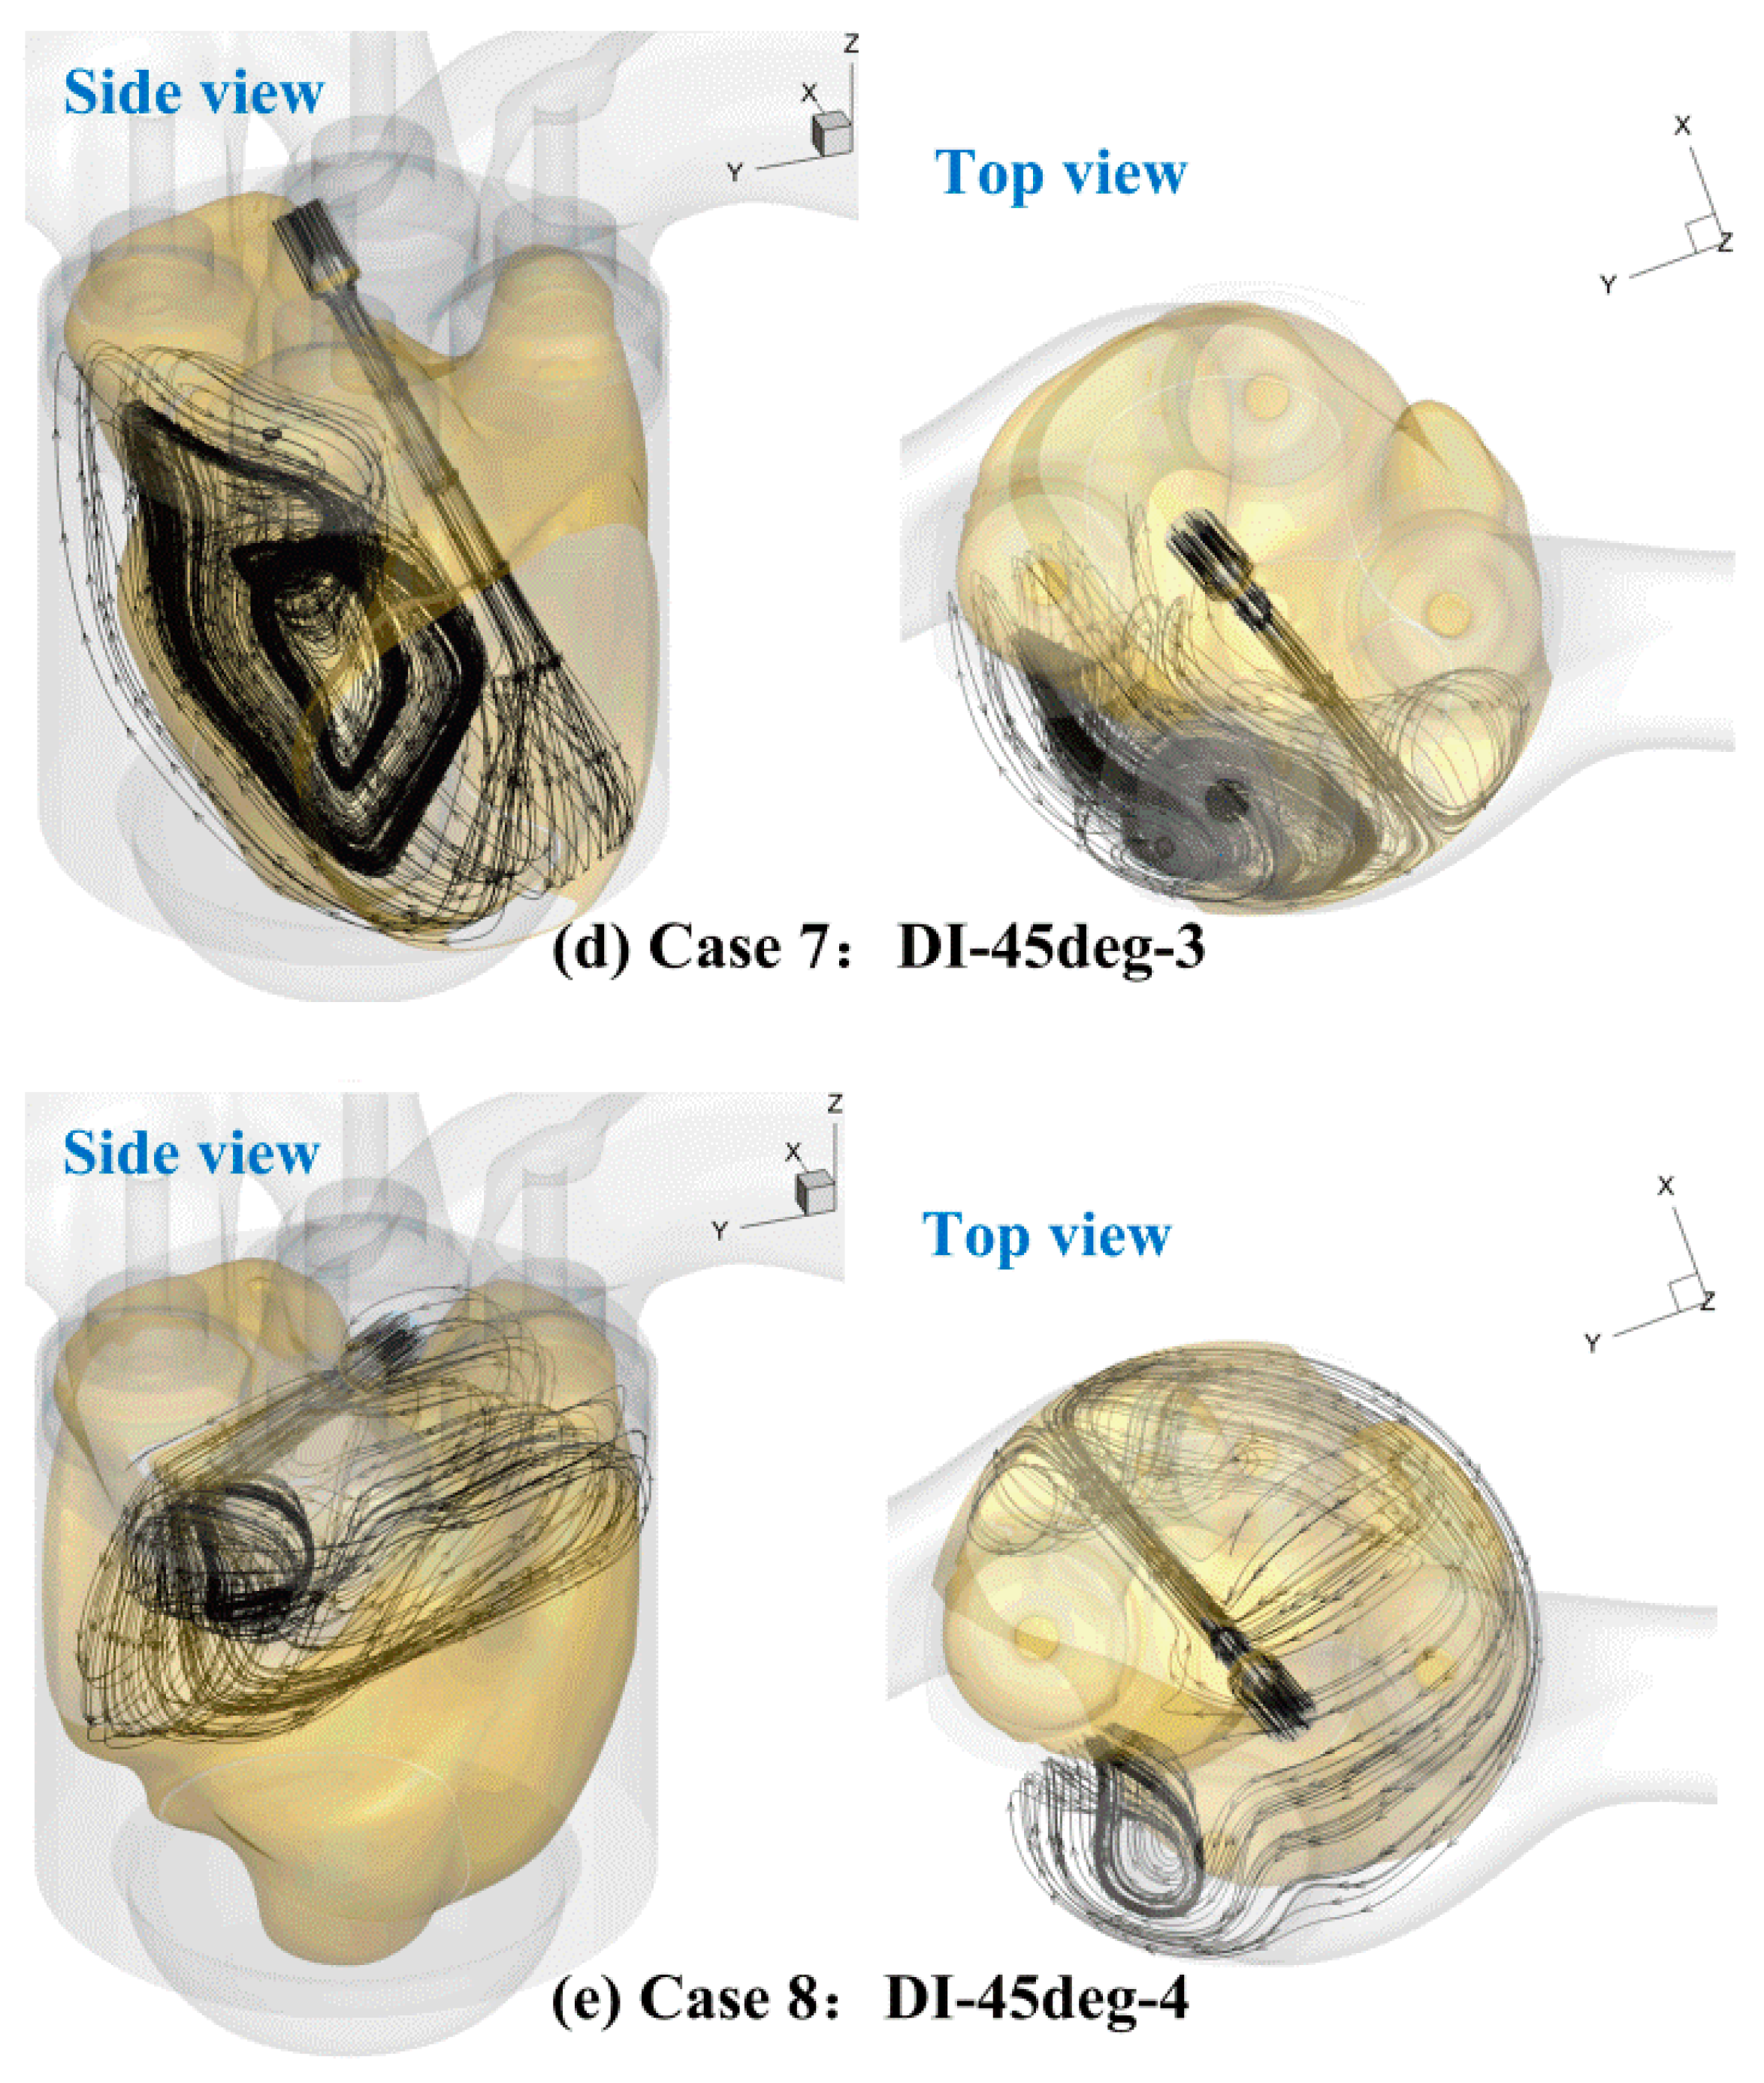
In order to explore the reasons for the different mixing uniformities of Cases 5–8, the moment CA610 (corresponding to a 250 °CA ATDC) is taken as the analysis node because, at this moment, the GID has remained at maximum lift for a while, and the gas fuel jet has been stable. The in-cylinder TKE iso-surface (50 (m
2/s
2)/kg) and jet streamline of each case at CA610 are shown in
Figure 7.
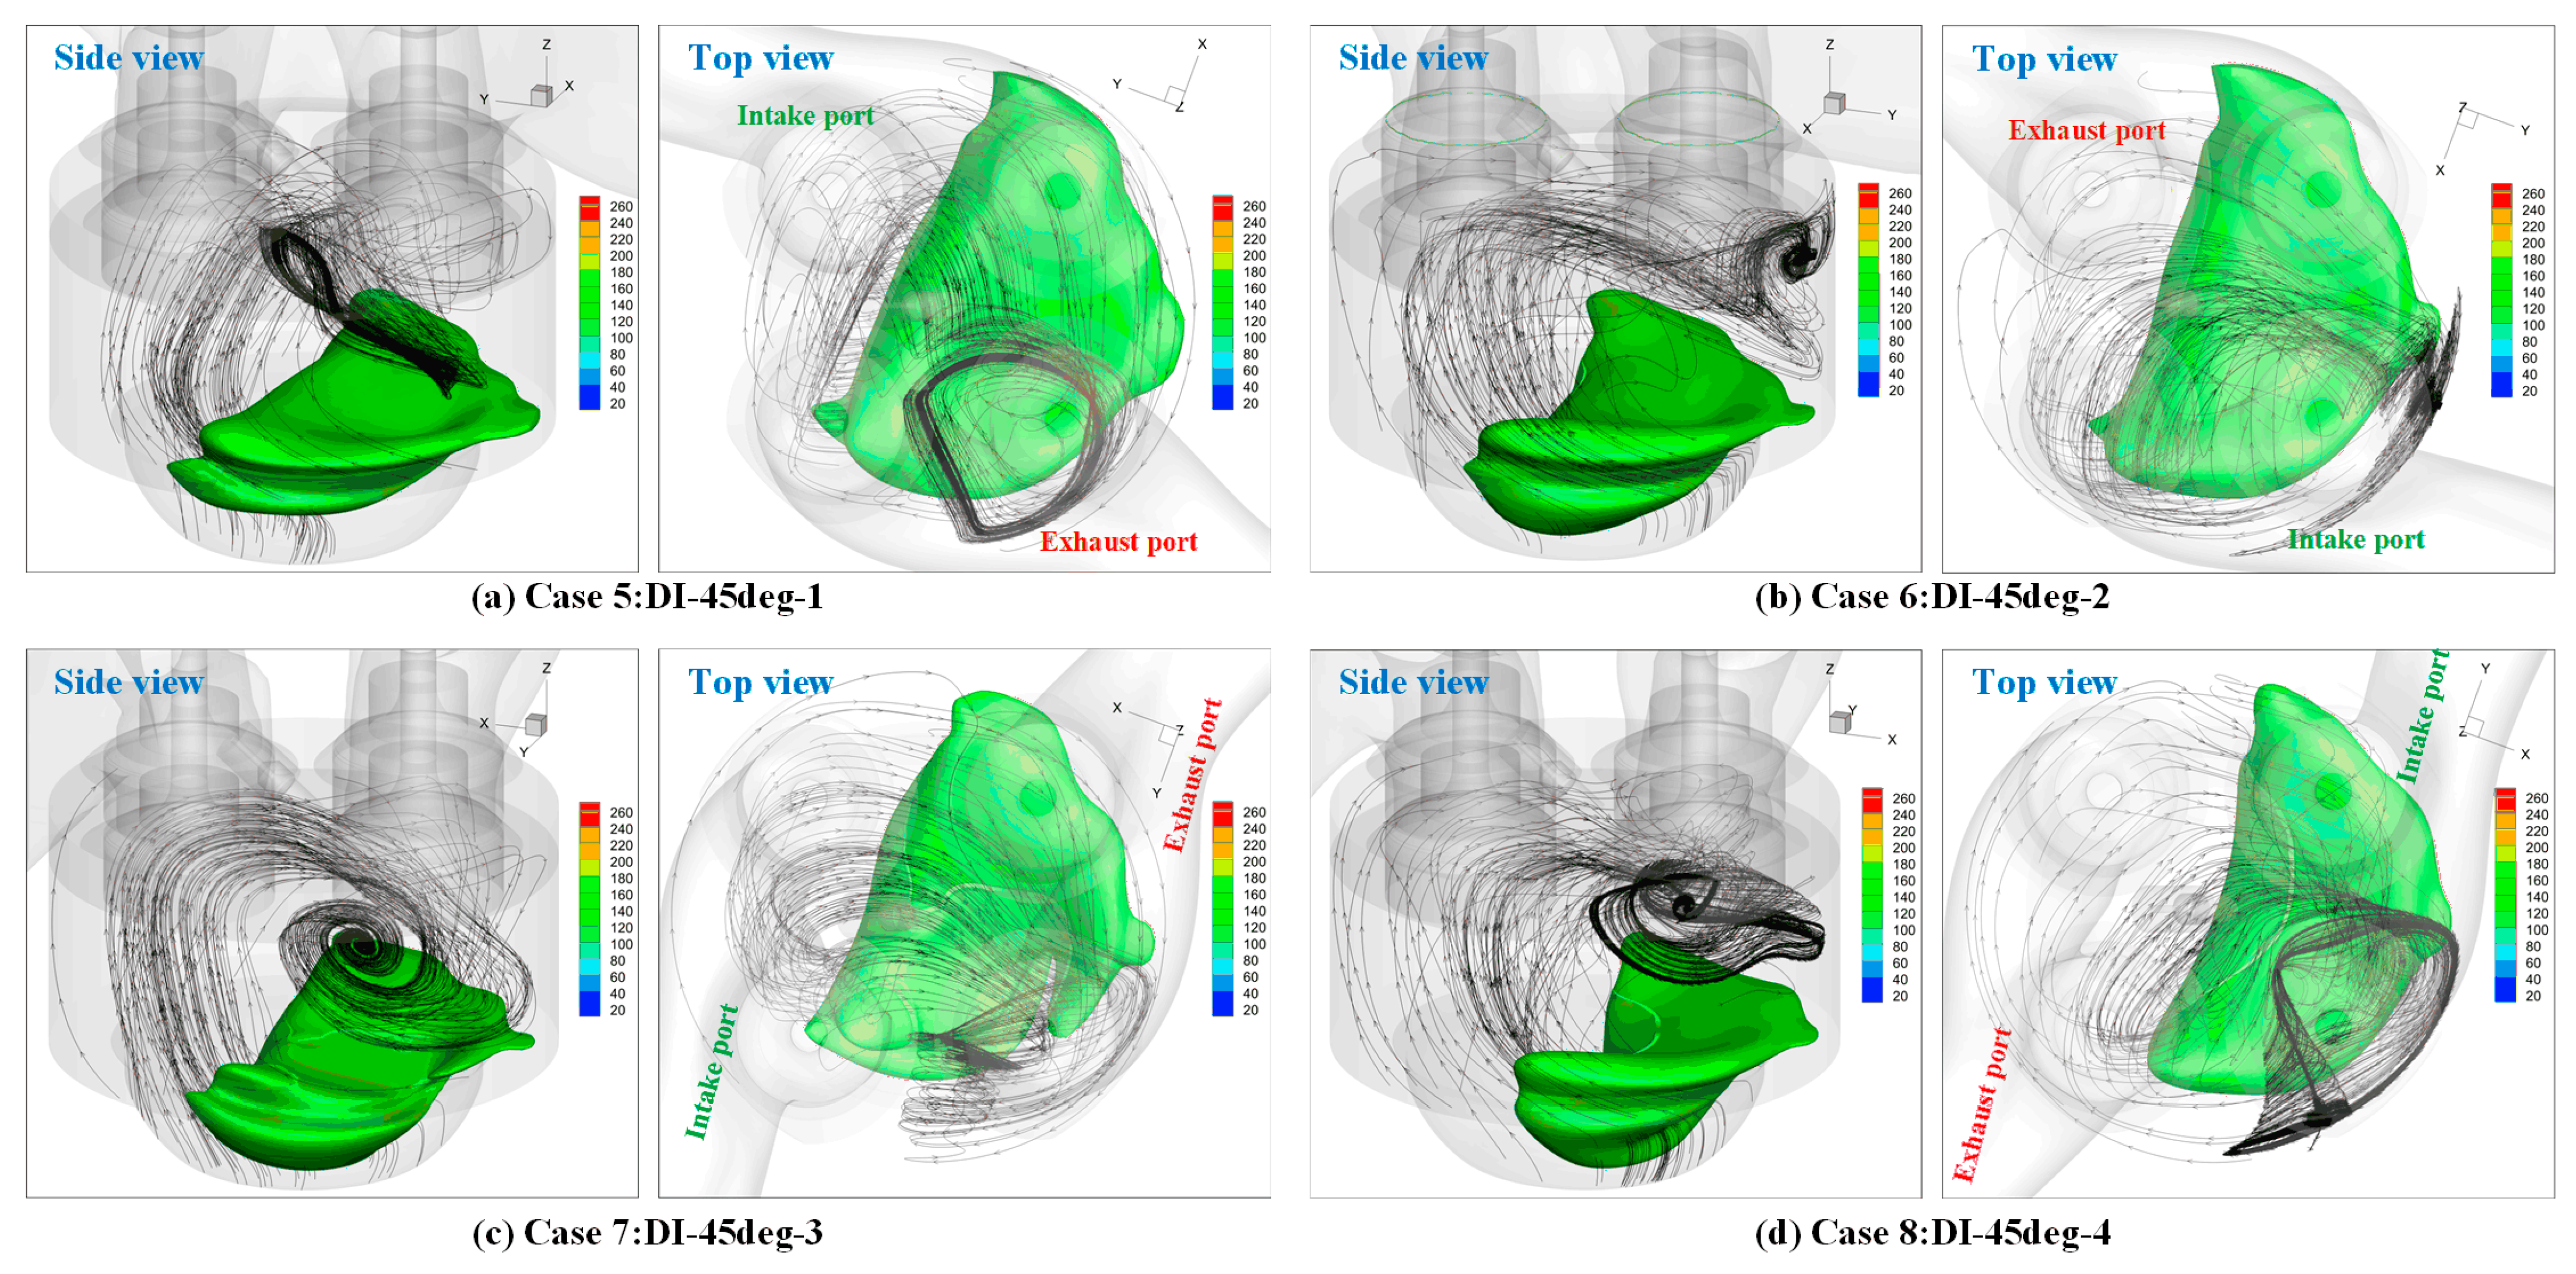
Figure 7a shows the in-cylinder TKE iso-surface for the basic case without any gas fuel injection, while the other conditions are the same as Cases 5–8. This case is used as the basis for comparison. It is obvious that the TKE of the basic case is formed just by the in-cylinder charge motion. It can be found that the iso-surface of the basic case is located on the underside the spiral intake port and near the lower right side of the tangential intake port. When the jet streamlines of Cases 5–8 are compared, it can be found that for Case 5, the gas jet will corrode with the stronger charge motion area, and the distribution of the streamlines is wide. While, for Case 6, the gas jet will impinge on the left side of the cylinder wall directly and keep away from the area with a stronger charge motion, unlike Case 5. The jet streamlines are mostly located near the cylinder wall and head. For Case 7, the situation is much more like Case 6. The gas jet impinges on the lower right side of the cylinder wall directly. Finally, for Case 8, the situation is much more like Case 5, however. The gas jet will corrode with the in-cylinder’s stronger charge motion area. Taking the rules shown in
Table 3 into consideration, it can be easily found that for Case 6 and Case 7, the gas jets keep away from the area with a stronger in-cylinder charge motion, and so they have the lowest TKE, highest KE, and the worst in-cylinder mixing uniformity. On the other hand, for Case 5 and Case 8, the gas jets corrode the area with a stronger in-cylinder charge motion, and so they have the highest TKE, lowest KE, and the best in-cylinder mixing uniformity. It can be concluded that directing the gas jet to the region with a stronger in-cylinder charge motion can bring a higher TKE and better mixing uniformity, although it will reduce the jet velocity (which is directly related to the KE). However, this still cannot explain why the mixing uniformity of Case 5 is still better than that of Case 8, although the latter has a stronger TKE, as shown in
Table 3.
Actually, the rule revealed in
Table 3 is just based on the TKE and KE values during the DOI. However, it is worth noting that the TKE of Case 8 will decrease significantly faster than that of the other cases after the EOI, as shown in
Figure 4. After the moment of CA640, Case 8 has the lowest TKE value. So, the moment CA640 (corresponding to a 280 °CA ATDC) is taken as another analysis node to compare the TKE of Case 5 with that of Case 8, as shown in
Figure 8. In
Figure 8, the viewing angle of Case 8 is adjusted to facilitate visual comparison. According to the TKE iso-surfaces (140 (m
2/s
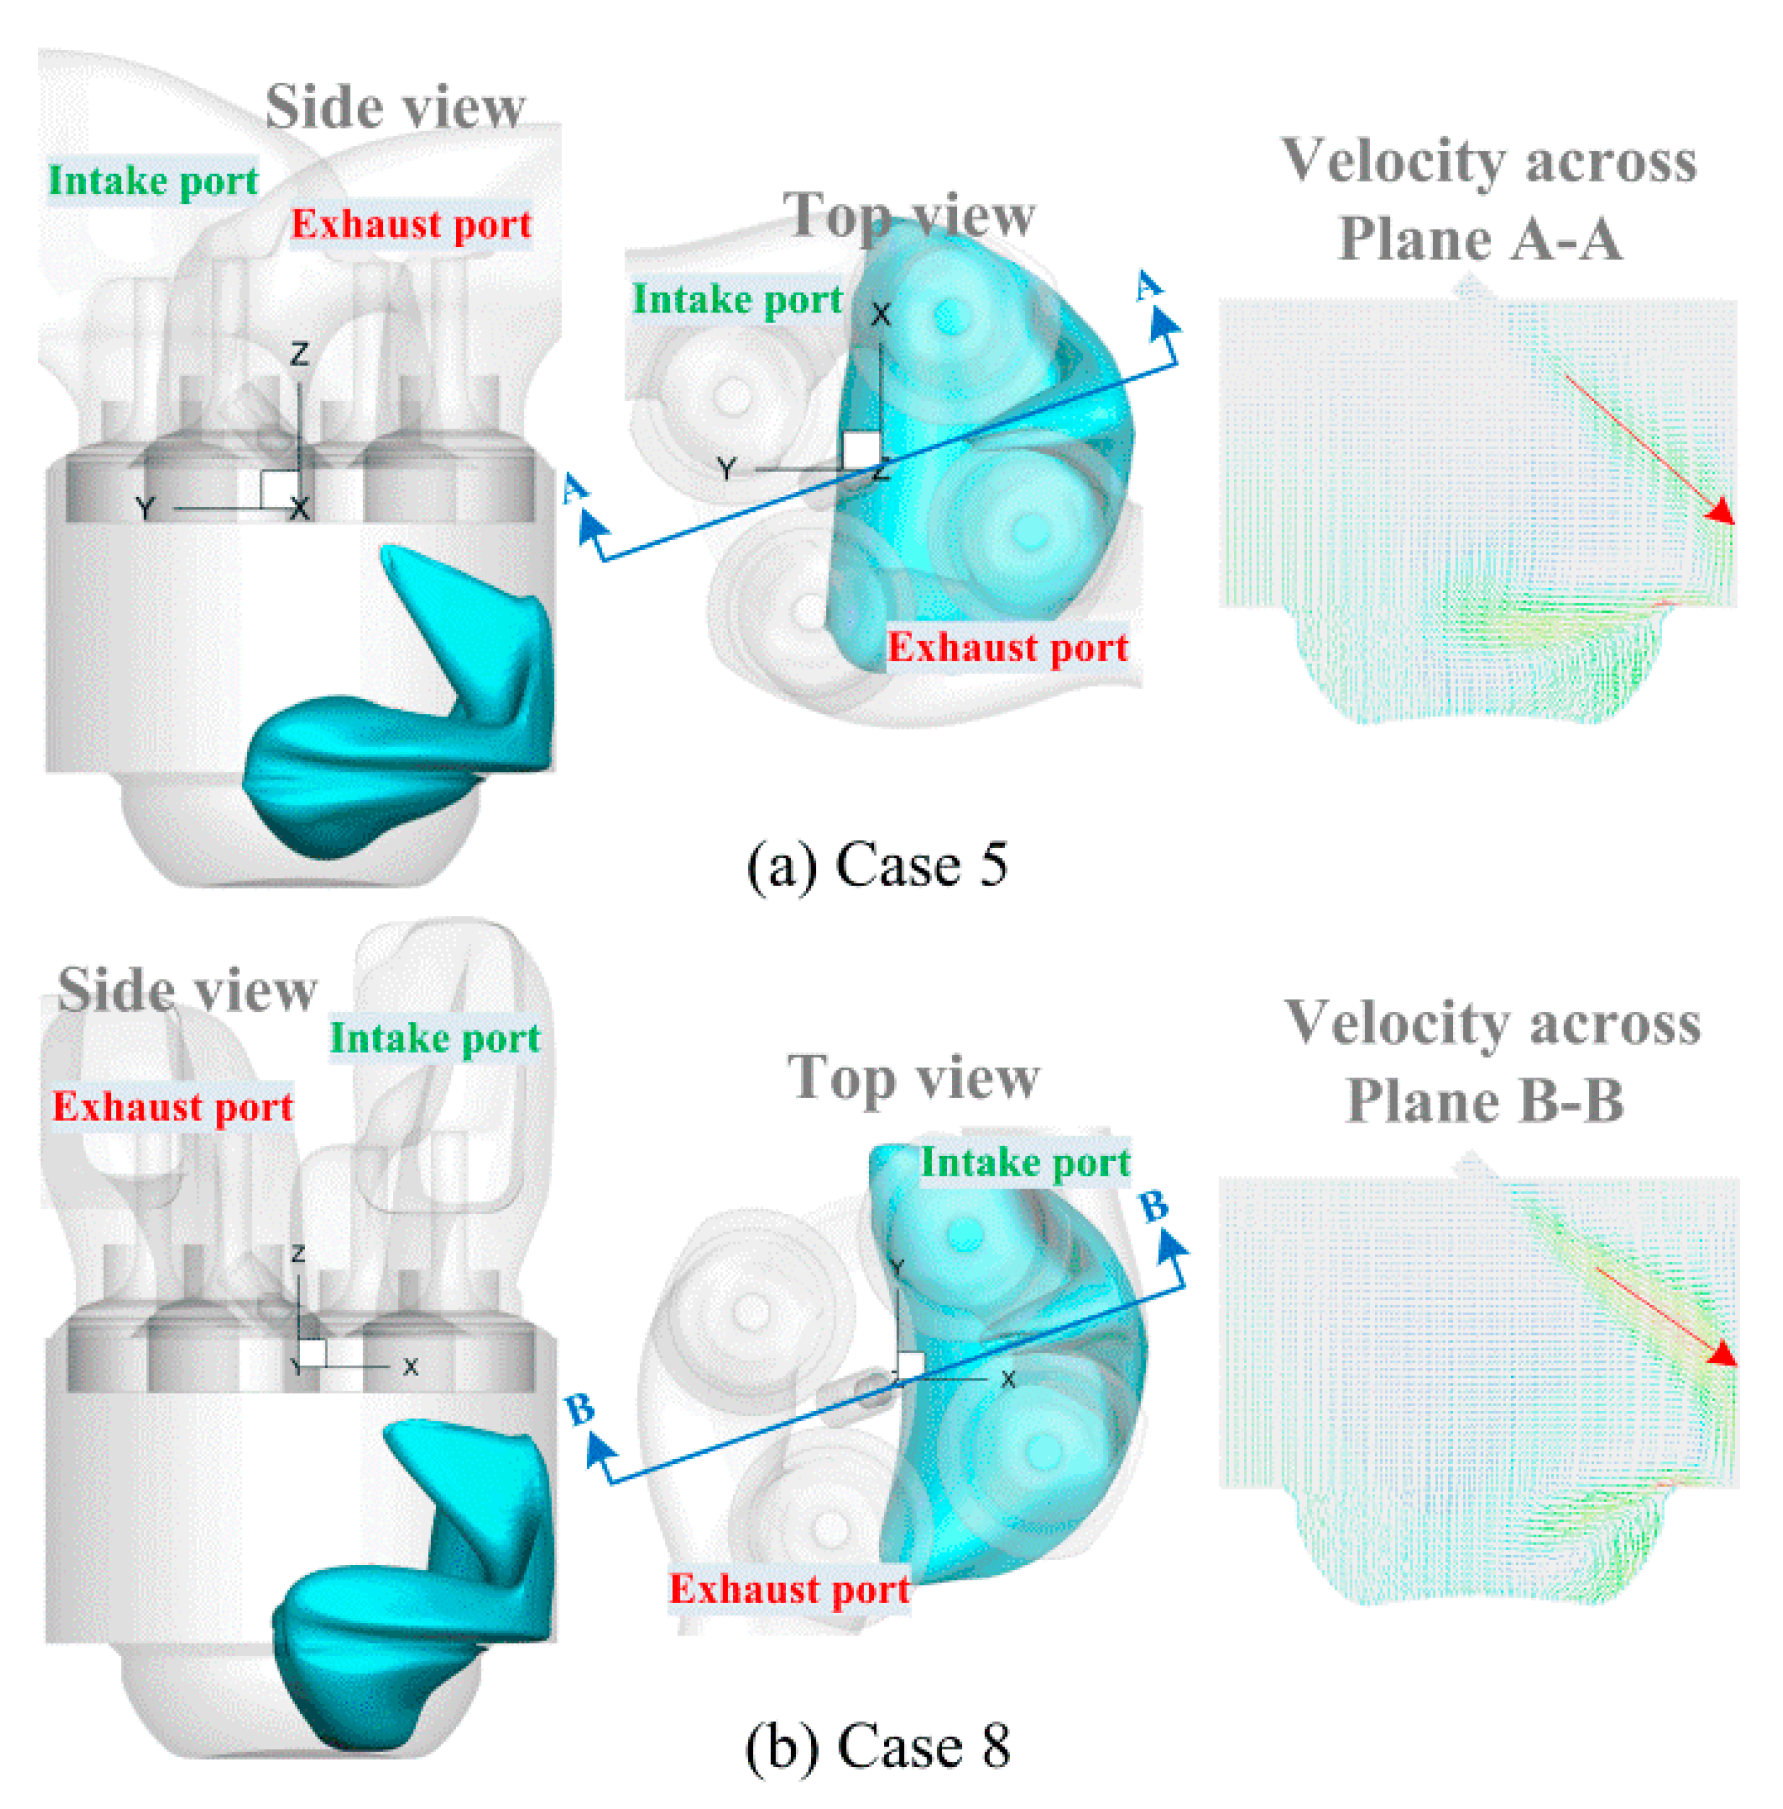
2)/kg) of Case 5 and Case 8, it can be found that the gas fuel impinging jets still exist because of an inertia effect although the injection process has been ended. For Case 5, the gas fuel jet will be directly guided to the cylinder’s center after being corroded with the right side of the cylinder wall. While for Case 8, the gas fuel jet will be pushed to the bowl piston top and have a smaller tendency to go through the center of the cylinder than in Case 5. This tendency can also be revealed visually in the velocity vector diagram of planes A-A and B-B. It can be seen that the impinging location of Case 8 is higher than that of Case 5. For Case 5, because of the lower impinging location, the gas fuel jet is reflected directly to the cylinder’s center. For Case 8, the gas fuel jet is too weak to keep its original direction after the EOI. That is because its injecting direction is to the region with the strongest charge motion than the other cases, as shown in
Figure 7e. So, the weakest gas fuel jet is forced to the upper side of the cylinder and flows along the cylinder wall, rather than reflect the cylinder’s center after being corroded with the right side of the cylinder wall, and then the gas fuel is guided to the bowl piston top. This part of the gas fails to develop, which leads to the deterioration of the mixing uniformity.
What is more, the TKE numerical order of each case begins to vary after the EOI, and after CA675, the order is just the opposite to that during the DOI, as shown in
Figure 4. This means that a lower TKE brings a better mixing uniformity after the EOI, which is completely opposite of the rule found during the DOI. So, the moment CA650 is taken, further analysis of this phenomenon was conducted, as shown in
Figure 9. It can be seen that the higher the TKE area brought by the gas fuel jet is, the more concentration near the piston crown after the EOI. In addition, for all the cases, the clockwise rigid vortex has been formed in the cylinder, which is obviously brought by the tangential intake port of the engine. More importantly, the rigid vortex is concentrated in the upper part of the cylinder, far away from the higher TKE area. That is, after the EOI, the mixing process in the cylinder is dominated by the rigid vortex, which has little correlation with the injection condition. Therefore, the mixing uniformities of Cases 6 and 7 are not improved, although they have a higher TKE after the EOI.
Finally, the in-cylinder FMF distributions of all the cases are compared at the ignition timing, as shown in
Figure 10, where a thin mixture (FMF < 2.5%) is hidden for the purpose of a clear contrast. As can be seen from
Figure 10, the in-cylinder fuel distribution of the PFI mode is the most uniform, and this conclusion is consistent with the result obtained from
Figure 3. There is little difference between Case 1 and Case 2. For Case 3, the gas fuel is mainly concentrated in the cavity of the deep bowl piston. For Case 4, on the contrary, the gas fuel is restricted near the cylinder wall. Both situations will bring trouble to the efficient combustion and improvement of the engine’s efficiency. For Cases 5–8, the gas fuel is located near the opposite side of each injecting direction. Besides, it can be easily found that the mixing uniformities of Cases 5–8 are better than Case 3 and Case 4. It can be concluded that changing the injection angle or changing the piston top structure will have a great impact on the mixing performance in the cylinder, which also directly verifies the necessity of optimizing the injection system of the CNG engine refitted from the diesel engine.


