Article

Study on the Algae Contamination and Its Effects on the Properties of RTV-Coated Insulators

1
College of Electrical Engineering, Southwest Minzu University, Chengdu 610225, China
2
School of Electronics and Information, Xi’an Polytechnic University, Xi’an 710699, China
3
State Grid Nanchong Power Supply Company, Nanchong 637000, China
4
Electric Power Research Institute, State Grid Sichuan Electric Power Company, Chengdu 610072, China
*
Author to whom correspondence should be addressed.
Energies 2022, 15(14), 5216; https://doi.org/10.3390/en15145216
Submission received: 21 March 2022 / Revised: 12 July 2022 / Accepted: 16 July 2022 / Published: 19 July 2022
(This article belongs to the Special Issue Advanced Research of High Voltage Insulation)

Abstract

:
The surface of organic insulating materials such as room temperature vulcanized silicone rubber (RTV) coatings often has serious contamination deposition. In humid areas such as the Southwest region of China, algae contamination layers are present on the surface of the insulators. In this study, the geographical and creeping distribution of algae contamination on the surfaces of RTV insulators were studied by investigating and sampling various substations in the Southwest region. The main components of soluble salts in the contamination were studied by atomic absorption spectroscopy and ion chromatography. The algal genome was extracted by the cetyltrimethylammonium bromide method, and the species of algae and other microorganisms in the contamination layer were determined. The effects of algae or their secretions on the surface resistance and hydrophobicity were studied by quantitatively inoculating algae and smearing extracellular secretions on the RTV surface. The damage of the algae contamination layer to the microstructure of the silicone rubber was investigated by microscopic observation and thermogravimetric analysis. Results showed that the growth of algae was positively correlated with the surface contamination of RTV. The extracellular secretion of algae destroys the surface microstructure of RTV and causes the removal of alumina hydroxide, leading to the reduction of siloxane. Therefore, the resistance and hydrophobicity of the RTV surface were reduced. It is of great significance to study the characteristics and effects of the algae contamination layer for RTV maintenance.

1. Introduction

Hydrophobic room temperature vulcanized silicone rubber coatings are widely used in power systems due to their good performance and the improved anti-pollution flashover level of the insulators. However, during operation, contaminants adhere to organic surfaces such as RTV coatings compared to the inorganic surfaces of porcelain and glass insulators. In humid areas of Southern China, algae growth has appeared on the surface of some insulators coated with RTV. Algae are suitable for growth in a humid and hot environment all year round, and grow and reproduce through photosynthesis through the moisture and carbon dioxide in the air. Especially in the basin area, algae are more varied and abundant [1].
Insulators with dense sheds have smaller gap distances between sheds, which are more likely to retain moisture, and the temperature of the micro-air gap is also higher. The above conditions are ideal for algae to grow [2,3]. In particular, in the basins of Southwest China, algae exist on a large number of insulators. Studies have shown that algal cells contain proteins, water, carbohydrates, and other substances, and their cells contain a lot of potassium and sodium ions [4]. Algae are conductive due to the presence of moisture and conductive particles, which greatly affects the external insulation performance in power transmission and transformation equipment, thus posing a potential threat to power grid safety.
In terms of investigating the pollution components on the surface of insulators, many scholars have conducted research on inorganic pollution. Guan et al. studied the effect of different soluble salt components on the flashover voltage of a suspension of porcelain insulators strings and showed that under the same salt density, at a higher CaSO4 content, the flashover voltage was higher [5]. Ma compared the contamination degree of live and deenergized insulators and found that the contamination degree of live insulators was 1.1 times higher than that of deenergized insulators [6].
However, there have been a few studies on the composition and influence of organic contamination on the surface of insulators. S.M. Gunbanski et al. studied the effect of biological contamination on the surface of insulators and found that the biological contamination layer had a certain effect on the insulator [7]. Jia et al. studied the insulators with algae and found that the algae had a significant inhibitory effect on the hydrophobic mobility of the insulators [8]. During the research, they did not mention the influence mechanism of organisms, especially algae, on the RTV insulators. At present, the research on the algae pollution layer on a RTV coating and its influence on the external insulation performance is not in-depth. In particular, there has been a lack of relevant research on the performance changes of RTVs with surface-attached biofouling layers.
Therefore, there is not enough available literature to accurately judge the influence of the contamination composition and distribution on the insulation performance of RTV coatings. Hence, it is difficult to guide the operation and maintenance of RTV insulators under complex contamination conditions [9]. It is important to note that hydrophobicity is completely lost even when the RTV coating has not yet reached its operating life (only 6 years of operation).
This brings potential risks to the operation of the power grid, causes economic losses, and prolongs the power outage time for annual inspections. Therefore, it is urgent to strengthen the research on the surface contamination characteristics of RTV coatings, especially the effect of the algae contamination layer on the performance and properties to formulate corresponding operation and maintenance strategies that ensure the safe and stable operation of power grids.
In order to explore the performance of RTV insulators under the condition of algal microorganisms and improve the maintenance method of contaminated insulators, the paper used RTV insulators in substations of the Southwest region in China as the research objects to investigate the algae contamination layers and study the effects of algae contamination on the performance and properties of RTV insulators.

2. Distribution of Algae Contamination Layer on RTV Coating

2.1. Geographical Distribution of Algal Contamination-Prone Regions

In a survey of some areas in the Southwest of China, we collected statistics on the distribution of algal contamination on insulators at substations or converter stations in some provinces and cities, and simplified the symbols of the regions and substations/converter stations for easier reading. In this paper, the symbols SCP and YNP represent provinces. Province SCP is located between 26°03′–34°19′ N and 97°21′–108°12′ E, and Province YNP is bounded between 21°8′–29°15′ N and 97°31′–106°11′ E. Symbols such as CD, ZG, LZ, DY, MY, GY, SN, NJ, LES, NC, MS, YB, GA, DZ, YA, BZ, ZY, AB, GZ, LS, and PZH represent cities in Province SCP. ZT represents cities in Province YNP. It can be seen from the survey that algae growth on the RTV coatings mostly occurred in the plains of the Southwest region in China, especially in the cities of ZG, SN, YA, GA, and other areas. However, no algae growth was found in PZH with its low latitude and dry and warm air, and in GZ, AB, and LS with a cold climate. Table 1 shows the growth of algae on the insulators at substations in SCP and the city ZT in YNP.
The substations with algae growth in the above-mentioned areas accounted for 15% of the total number of substations, and all of them were located in C-level and polluted areas. Among them, there were 45 substations in C-level polluted areas and 72 substations in D-level polluted areas. The algae growth is more likely to occur in substations with heavy contamination.
The above table shows that in addition to contamination deposition, a suitable climate is also a necessary condition for the growth of algae. Algae grow best in warm and humid environments. Low or high temperatures and low humidity are not conducive to algae growth. The northwestern SCP plateau and the southwestern SCP mountains have relatively long sunshine hours, which promote the photosynthesis in algae. However, high altitude and strong ultraviolet radiation have a destructive effect on algae cells.

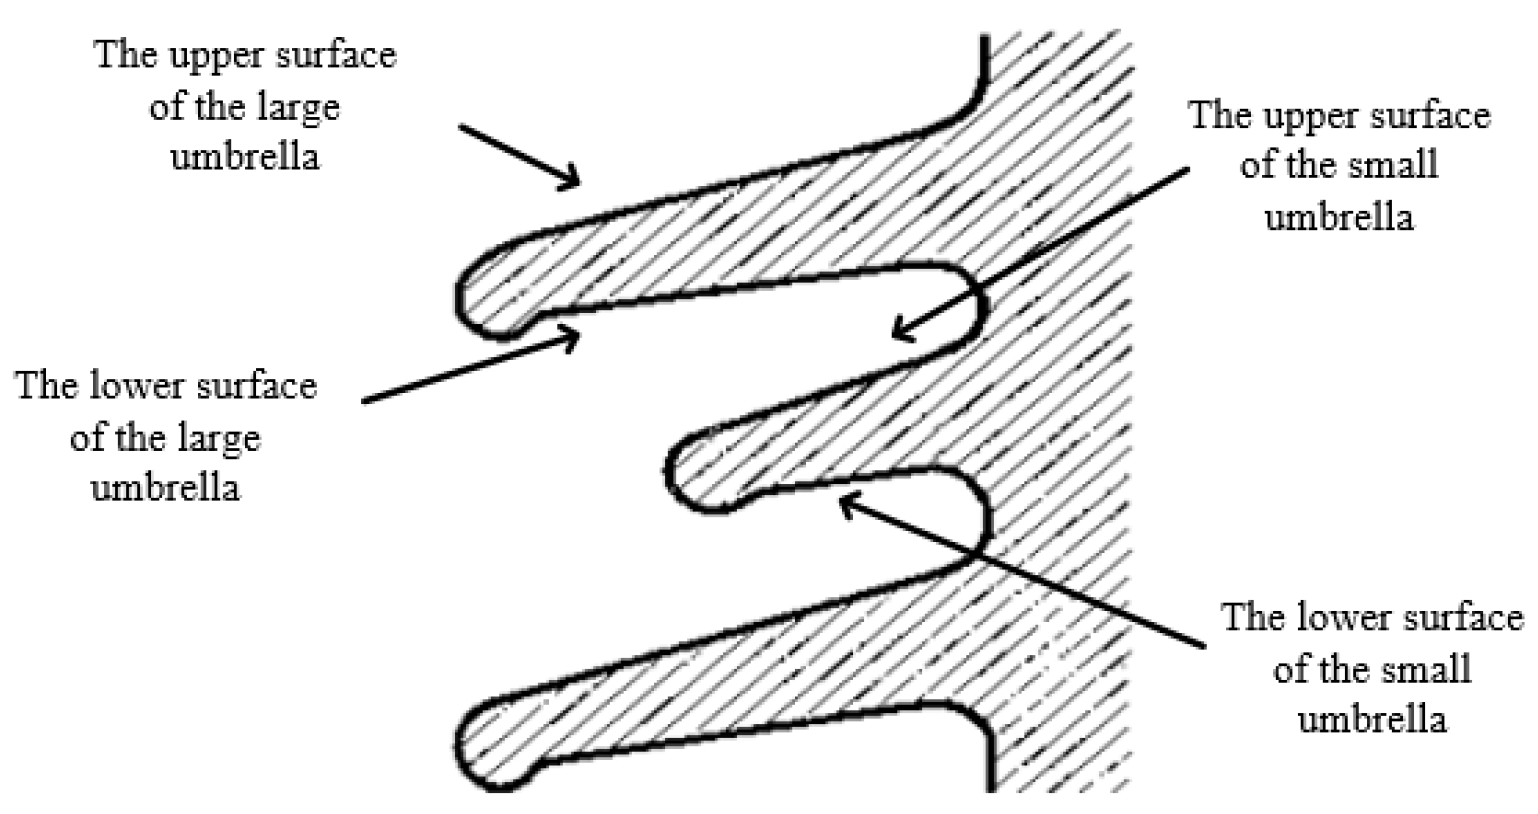
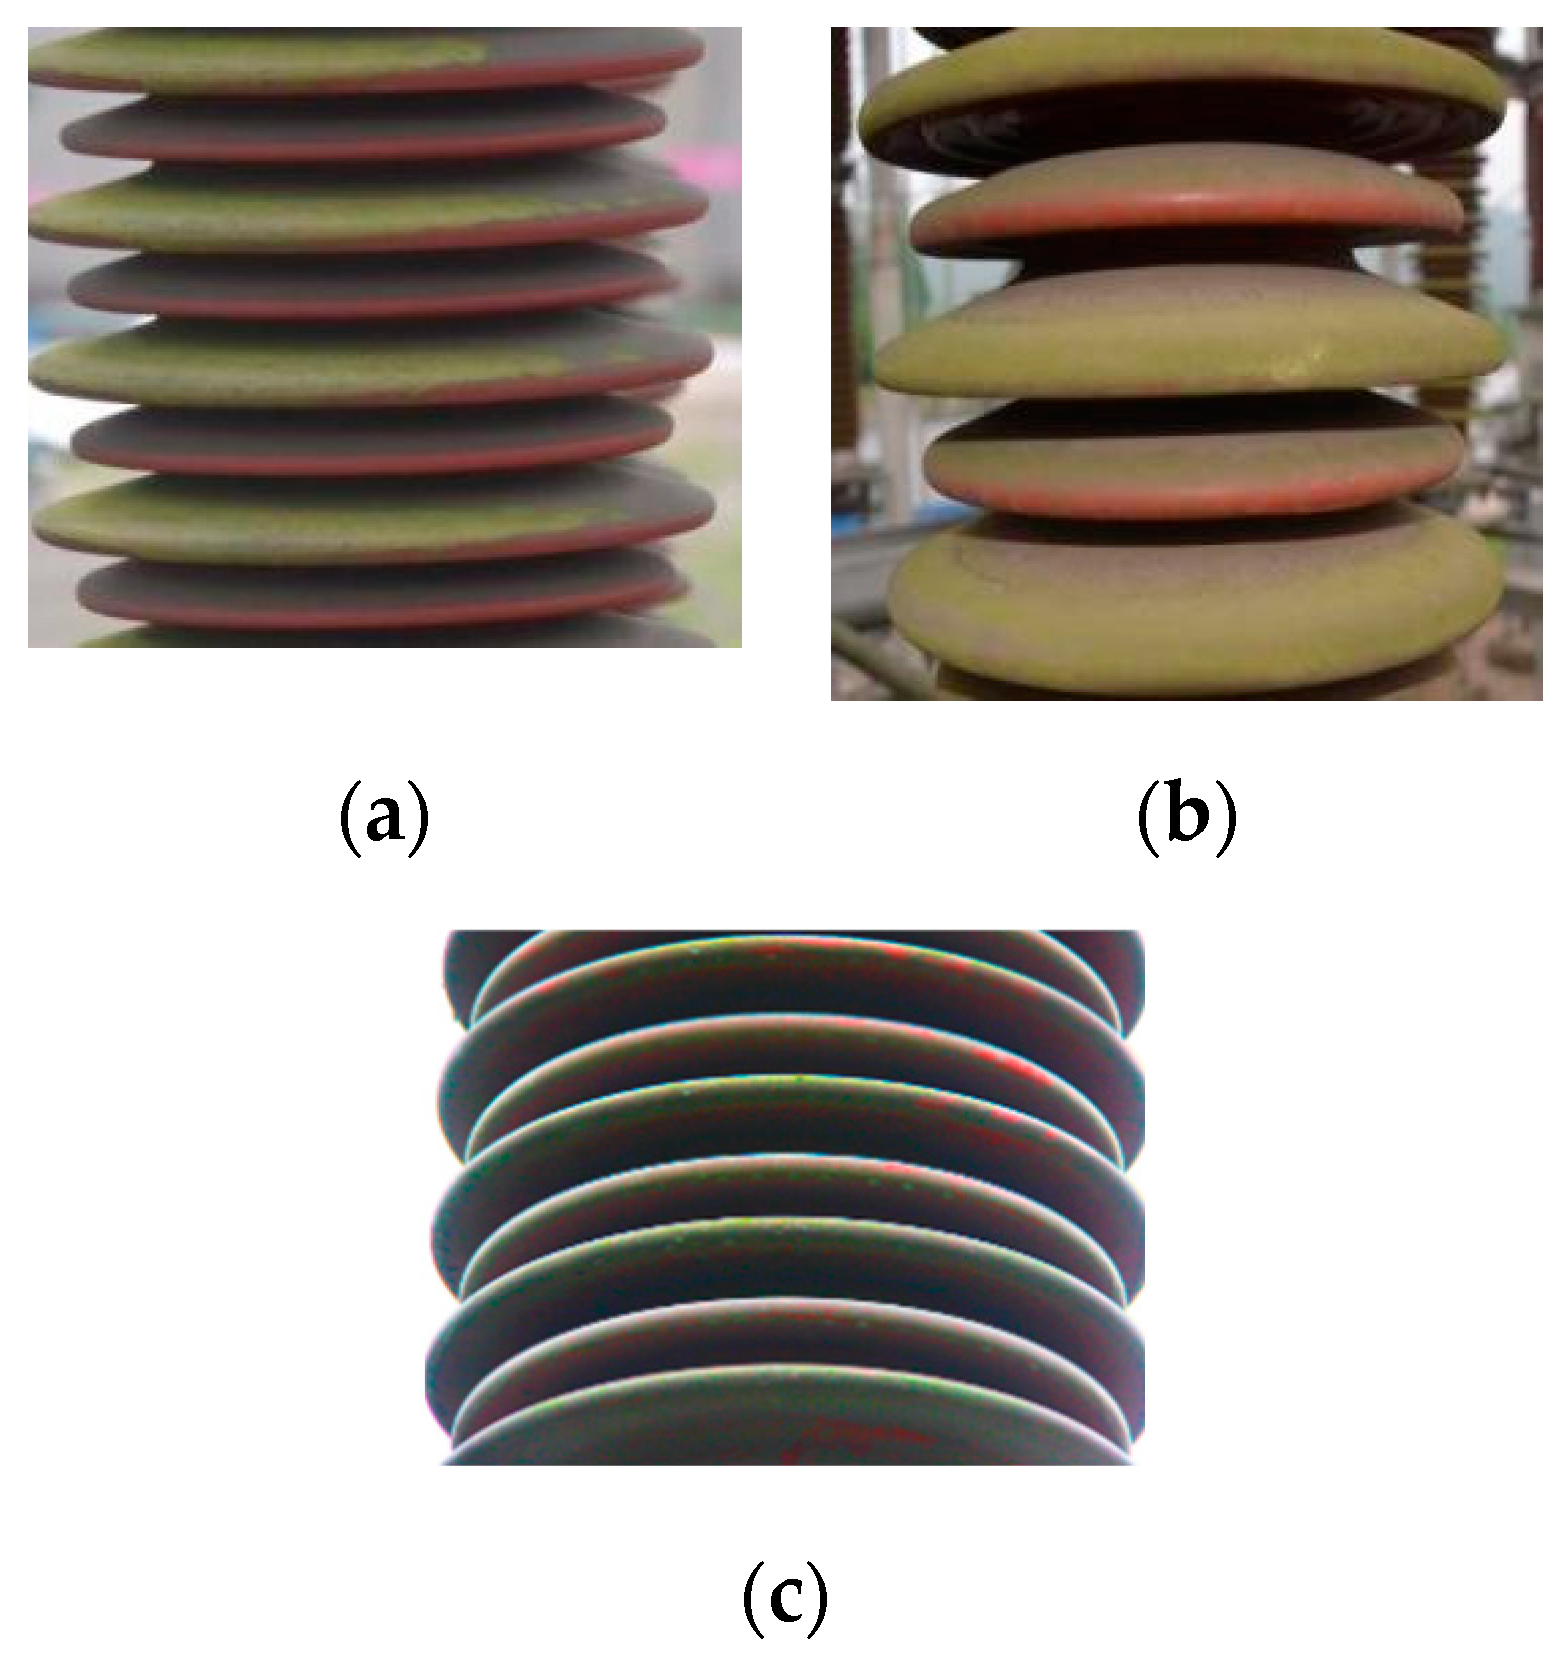
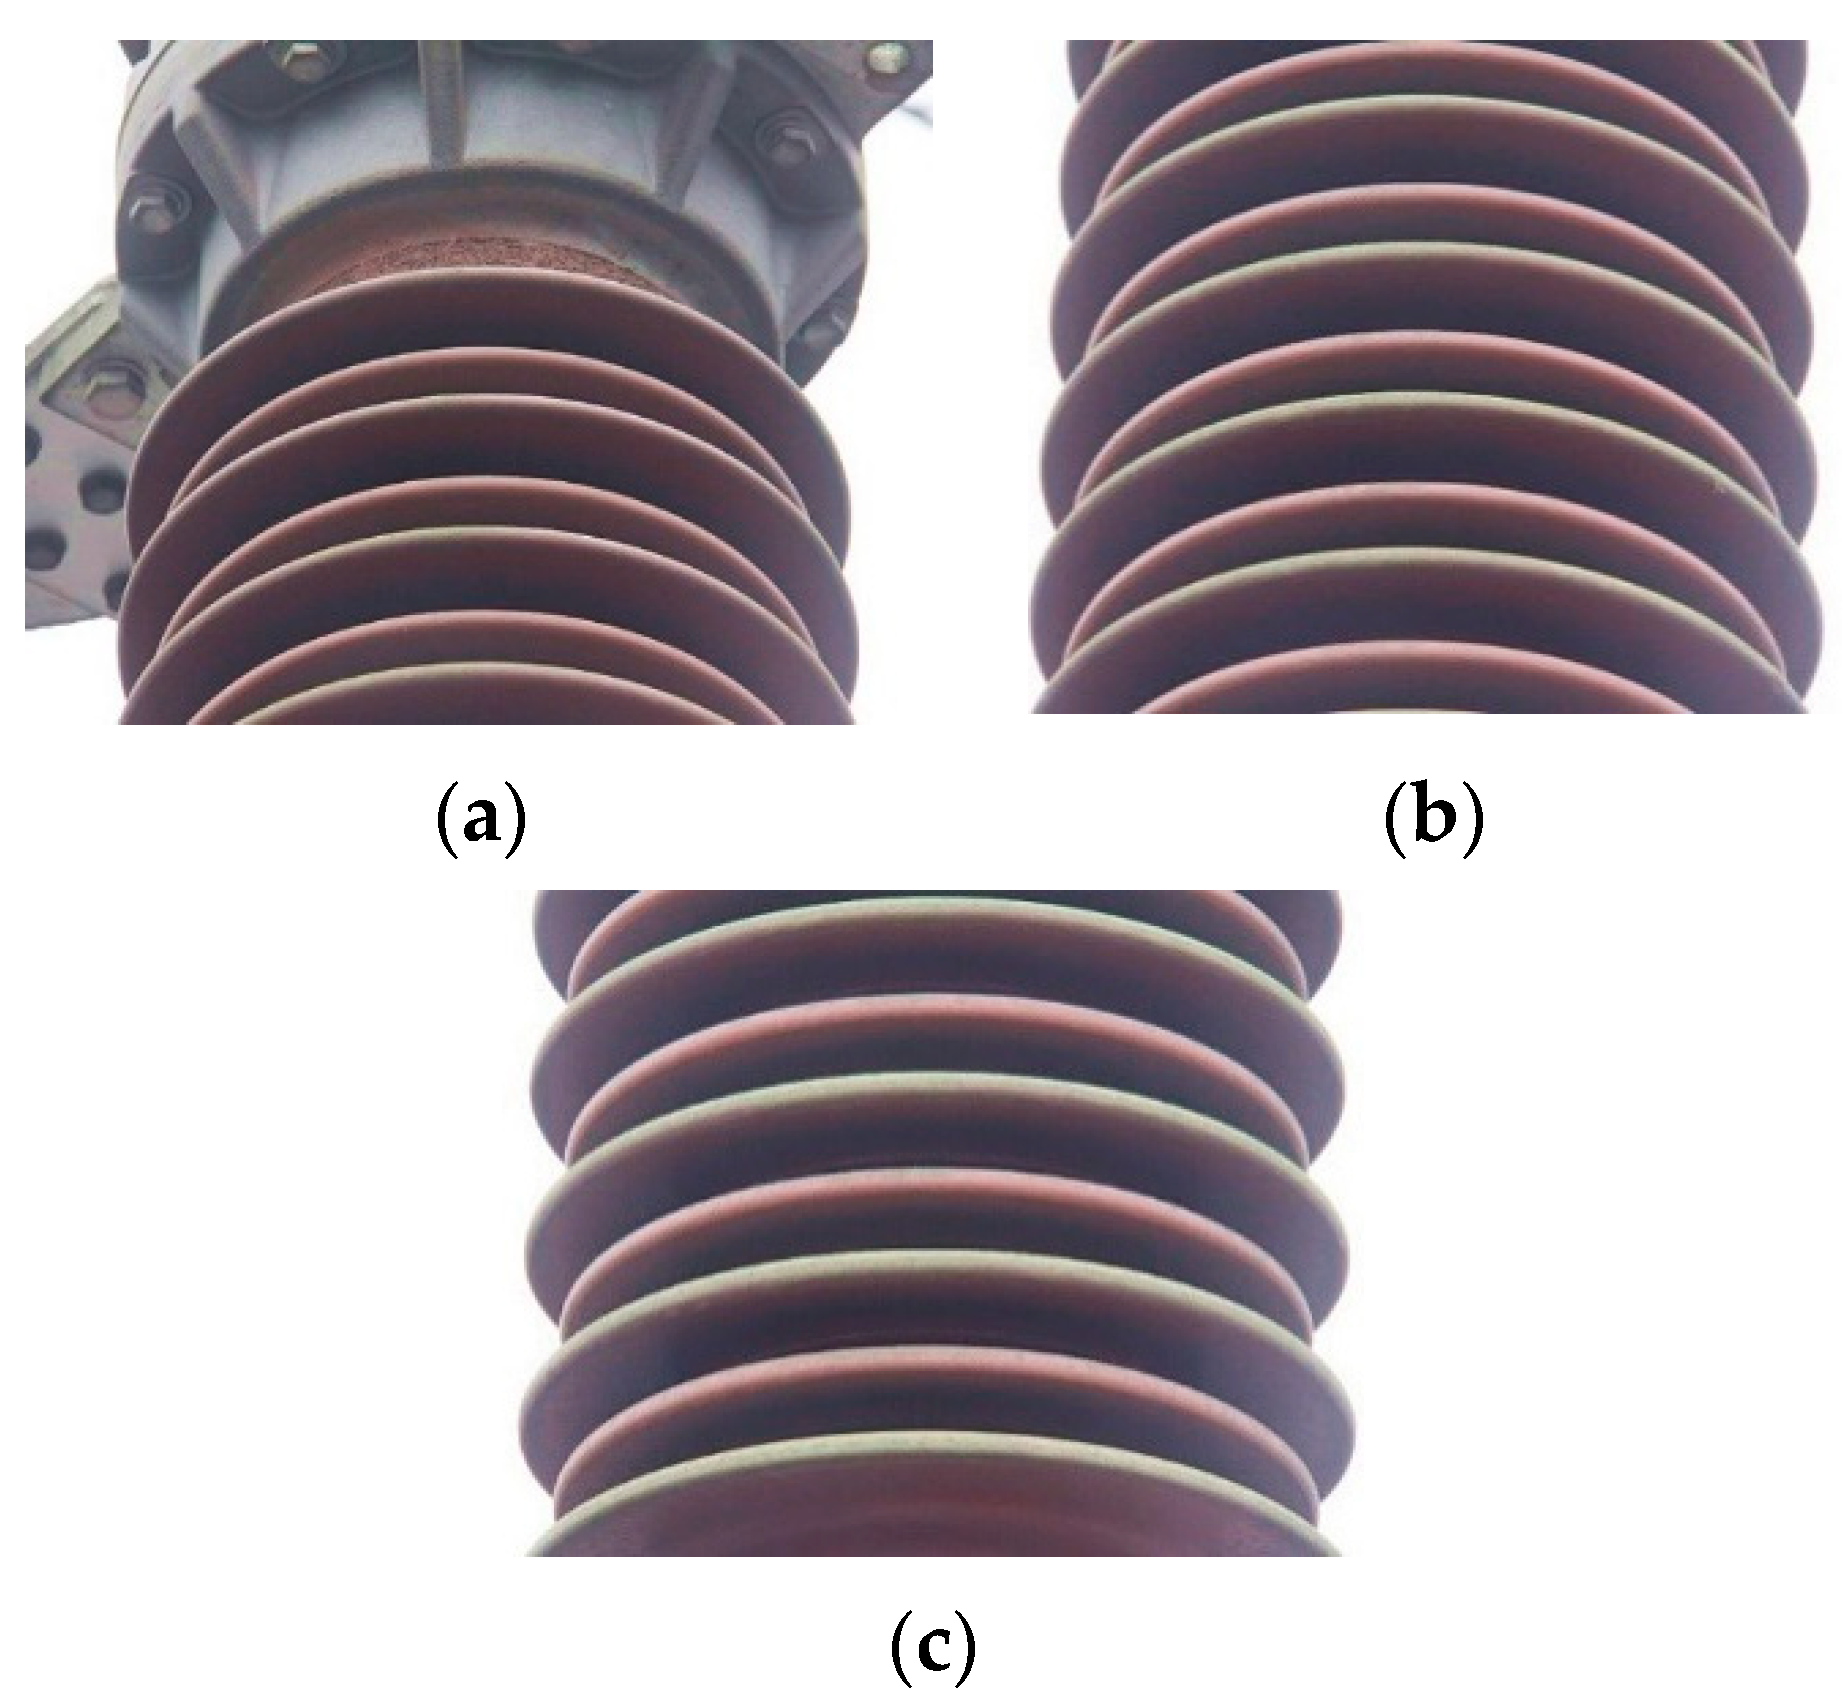
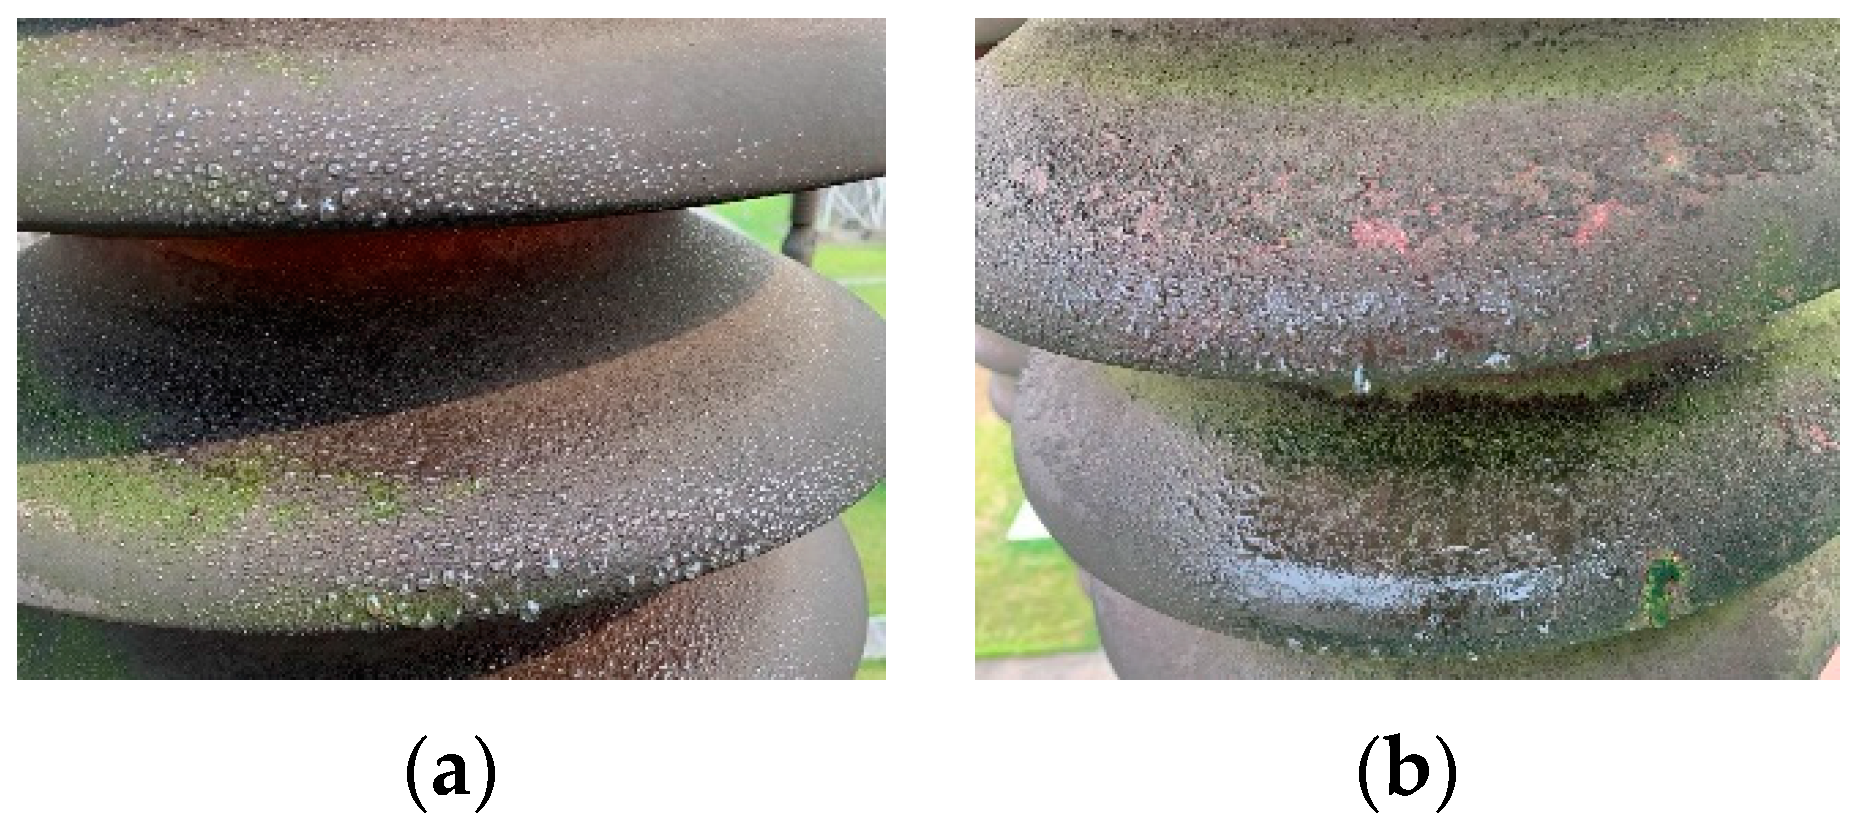
2.2. Spatial Distribution of Algae Contamination Layer on RTV Insulators

The algae on the surface of the RTV coating are mainly distributed on the edge of the upper surface of insulator sheds, and large insulator sheds grow more than the small insulator sheds. The symbols such as FLS, YXS, DES, CBS, BQS, EYS, XYS, JFS, XXS, CSS, DJWS, JNS, ZHS, and ZTS represent substations or converter stations in the above different cities. The schematic diagram of the insulator shed structure is shown in Figure 1 and the typical situation of algae growing on the insulator is shown in Figure 2.
Figure 2 shows that the algae contamination layers were mainly distributed on the upper surface of large and small umbrellas. The thickness of the algae contamination layers was higher when it was closer to the edge of the insulator sheds. In high humidity areas, a large amount of algae adhered to the lower surface of the insulators, the root of sheds, and even the small umbrellas.
(a)
Orientation
The algae growth on the RTV surface coating was directional. Table 2 shows the growth directions of the algae in the substation equipment at each substation. The table indicates that the algae grew in shady areas, and in severe cases, all around. SCP is between the 26°03′ and 34°19′ north latitude, and the sun shines all year round. The algae mainly grew on the shady side. During serious growth, the algae spread to the surrounding areas. Therefore, algae grew around the RTV coating of some substations in YAS and BZS. The algae tended to grow on the shady side. The surface of the RTV coating is protected from direct sunlight, which prevents the surface from drying, therefore keeping the surface moist, one of the necessary conditions for algae growth.
(b)
Vertical Height
The algae growth at the top of the pillar insulator was significantly less than that in the middle section and the bottom end, however, the algae growth at the bottom end was serious.
In the case of YA 110 kV BQS, the algae growth at the high voltage end of the 110 kV switch and grounding switch was less including the pillar insulators, circuit breakers, arresters, PT, and CT. Figure 3 shows the 110 kV circuit breaker at the BQS. The distribution of algae on the pillar insulator and arrester was similar to that of the circuit breaker.
This phenomenon can be observed at each substation (converter station) in Table 3. The substations or the converter stations are abbreviated.
This may be attributed to the height of the insulating struts with higher voltage levels, resulting in a relatively difficult spread of algal spores to higher places. On the other hand, high winds affected the adherence of algal spores to the RTV coating.
(c)
Voltage Type
To study the effect of the AC/DC electric fields on the algal growth on the surface of the insulators, the ±500 kV DYS converter station in SCP was studied. The converter station is inspected once a year, and the insulators are cleaned. After one year, due to the dust collection effect of DC voltage, the accumulation of contaminants on DC insulators was more serious than that in the AC insulators. However, the algae on the AC insulator surface was greater than that on the DC insulator (Figure 4).
Table 4 shows the random inspection results of the DYS converter station in 2018, where the first three are AC arresters, and the fourth is a DC pillar insulator. The contamination degree of the DC insulators was significantly higher than that of the AC insulators, however, the algae epiphyte phenomenon was not observed in the DC insulators. ESDD and NSDD represent the equivalent salt and non-soluble deposit density, respectively.
In 2019, 2020, and 2021, the above-mentioned insulators were continuously tracked and observed. The salt/non-soluble deposit density and the data of the attached algae varied slightly each year, however, no algal epiphytic phenomenon was observed in the DC pillar insulator.

2.3. Contamination Distribution

Six 35 kV disconnector RTV pillar insulators were tested at the BZ 110 kV XYS substation (six large umbrellas and five small umbrellas). The upper and lower surfaces of the upper, middle, and lower groups of umbrellas (one large umbrella in each group and one adjacent small umbrella) were selected for washing and testing [10]. The contamination distribution on the RTV pillar insulator surface was determined, and the distribution density of algae on the surface was measured (number of algae cells per unit area, units/cm2). The test parameters are given in Table 5.
The contamination distribution and algae coverage on the upper and lower surfaces are shown in Table 6. The algae coverage refers to the percentage area covered by the algae contamination layer to the total area of the measured site.
The above table reveals that the average salt density of the pillar insulators along the string was high at both ends and low in the middle, which was attributed to the field strength concentrated at both ends of the insulator in a dry state, and the two ends accumulate contamination due to the effect of the electric field. Therefore, the contamination along the string showed a high distribution at both ends and low in the middle, similar to the law of contamination accumulation in line with the insulator strings.
A small umbrella is shielded by a large umbrella, and the cleaning effect of the rainfall on the surface is greatly reduced, resulting in a high surface salt density. This results in a higher degree of contamination on the surface of a small umbrella than on the surface of a large umbrella.
On site observation suggests that the places with algae growth on the RTV insulator surface showed more contamination deposition and the parts without algae growth were relatively clean, consistent with the statistical results in Table 1. These results reveal that there is a strong positive correlation between the coverage of algae and the degree of surface contamination, and the area with a higher equivalent salt density has a higher coverage of algae, indicating a correlation between the algal growth and contamination deposition. On one hand, the growth of algae requires a certain soil as a basis. On the other hand, the growth of algae inhibits the surface hydrophobicity of the RTV, facilitating the adherence of the contamination to the RTV surface, resulting in higher levels of contamination in areas where algae thrive.

3. Properties of Algae Contamination Layer on RTV Coating

3.1. Soluble Components

To study the components of surface contamination, the upper surfaces of large and small umbrellas in the 35 kV insulation pillars of XYS and the upper surface of the large umbrella in the 110 kV busbar arrester of CBS were extracted for washing and testing. The ion concentration in the solution after washing was detected.
A total of 300 mL of double distilled water was used for washing and testing [11]. Cations were detected by atomic absorption spectrometry and the anions were detected by ion chromatography and the results are given in Table 7 and Table 8. The above table suggests that CaSO4 accounted for more than 90% as a main soluble salt on the surface of the RTV insulators at two places, followed by potassium and sodium salts.

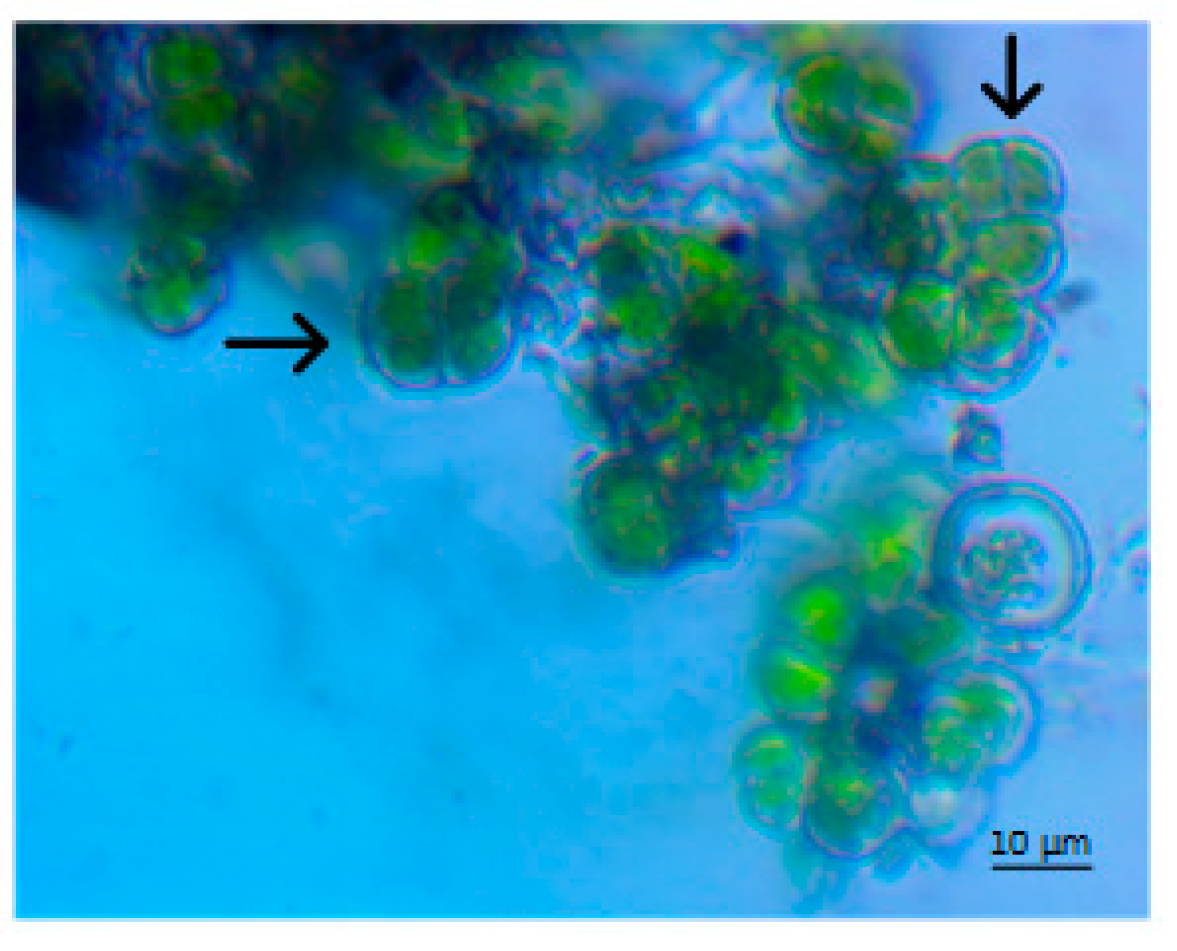
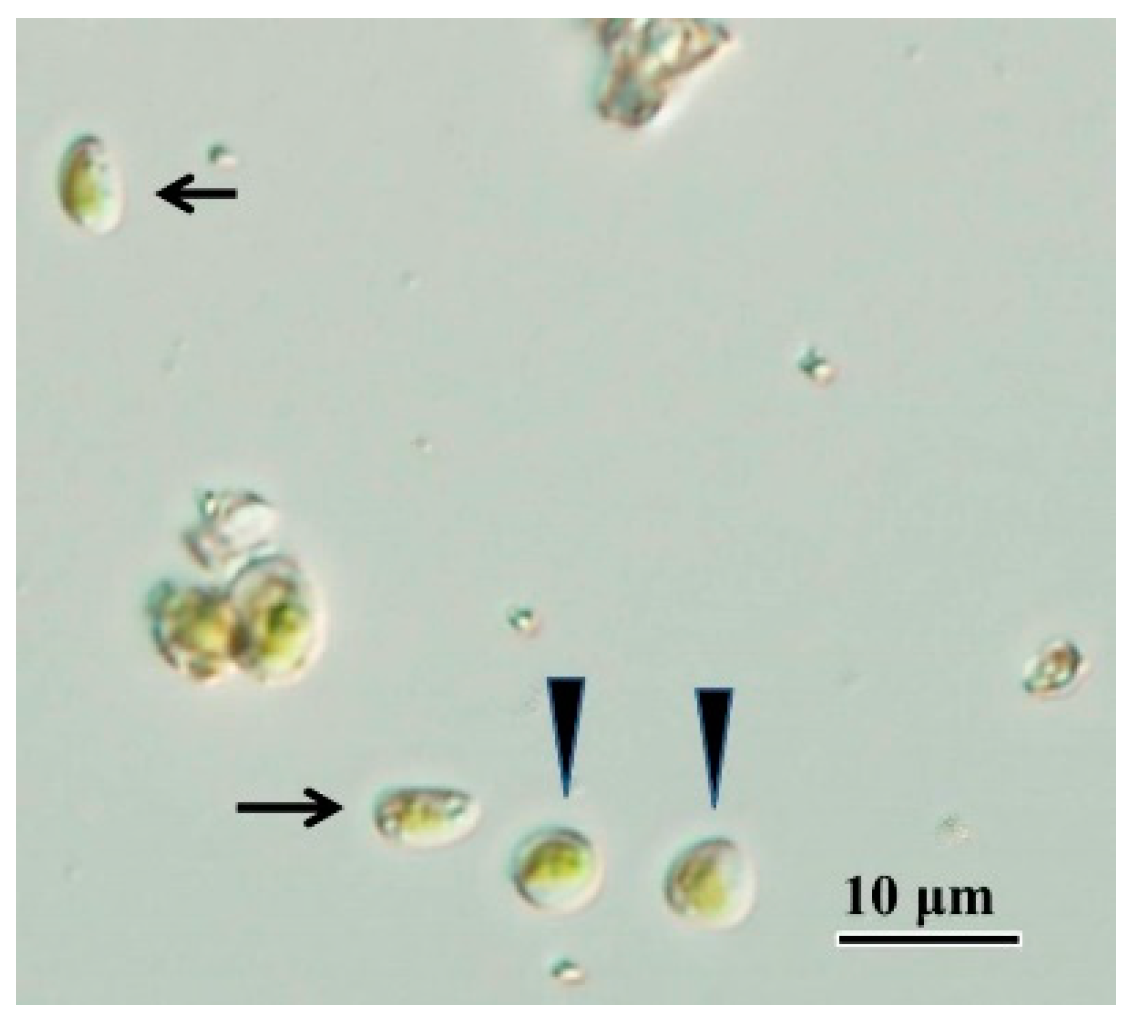
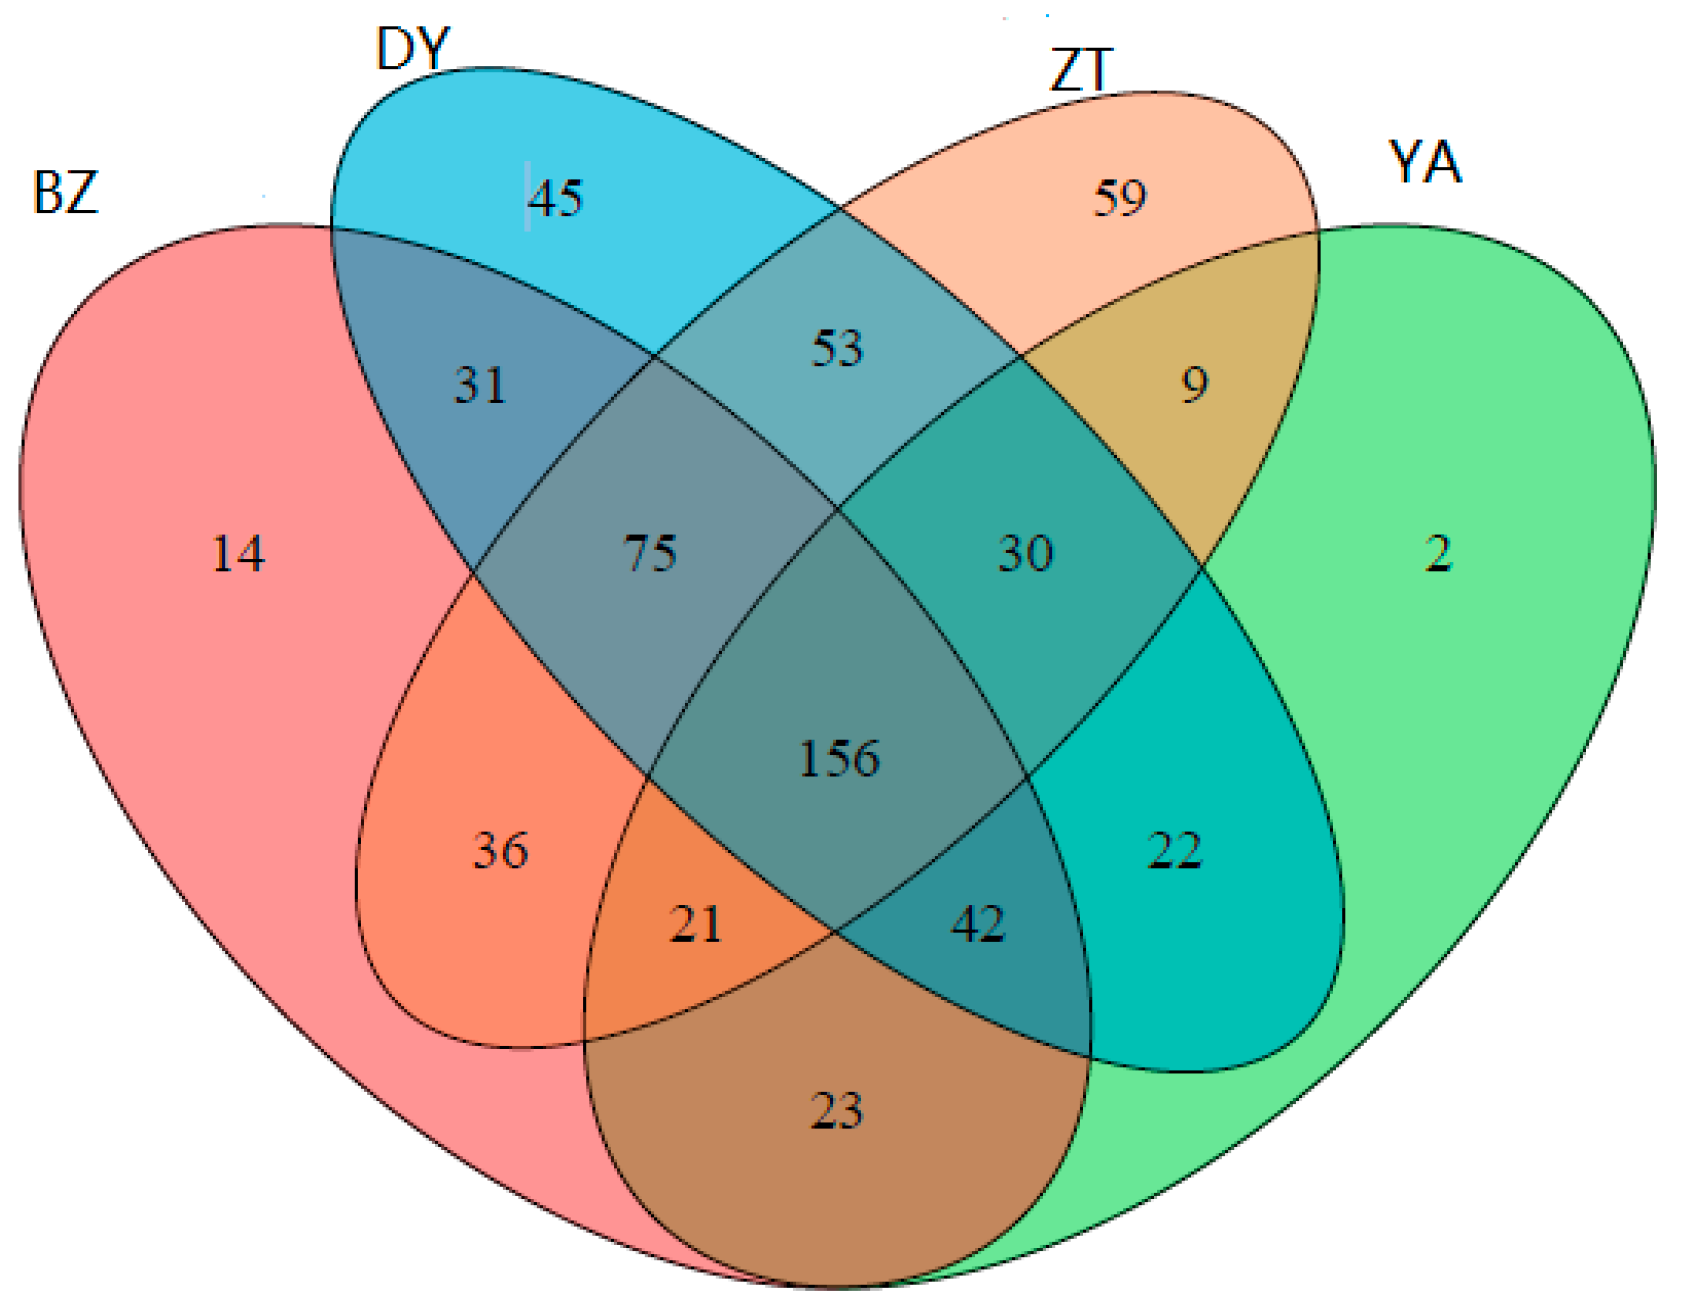
3.2. Algae Identification

To identify the microbial species on the insulator’s surface, quantitative sampling of the algae contamination on the surface of the insulator was necessary. During the sampling process, contaminants such as cells were manually collected with cell scrapers and cell shovels. This ensured minimal damage to the cells and access to all surfaces where cells were growing while ensuring that all contaminations from a certain area were removed.
Cell spatulas are commonly used to harvest cells (especially stem cells) from Petri dishes whereas cell scrapers are commonly used to harvest cells in culture flasks. However, both need to be individually packaged in sterile, heat-free packages. Cell scraping is more practical when collecting microorganisms on the surface of the insulator.
The sterile sampling bags were made of Food and Drug Administration-approved sturdy virgin polyethylene tubing. This eliminated the need for side sealing and also ensured that the bag mouth was opened to the maximum, convenient for placing samples. Microbial samples were collected using cell scrapers and sterile sampling bags on insulators in BZ, YA, and DY in Province SCP and ZT in Province YNP. Samples were stored at zero degrees Celsius and sent to freshwater algae species bank of the Institute of Hydrobiology for identification.
The identification uses the cetyltrimethylammonium bromide method to extract the algal genome and refers to molecular systematics. First, a 50 μL polymerase chain reaction system was constructed for DNA amplification. The forward and reverse primers were ddH2O. Polymerase chain reaction products were electrophoresed in 1.5% agarose gel and then ligated with plasma vectors and transformed to E. coli. Finally, positive clones were picked for sequencing. The obtained algal species are listed in Table 9.
The algae in the three regions of BZ, YA, and DY in SCP belonged to Apatococcus lobatus(indicated by arrows). The major classes belonged to Chlorophyta, Chlorophyceae, Chlorococcales, Chlorellaceae, and Apatococcus. Apatococcus lobatus cells are shown in Figure 5. These can be spherical or ellipsoid, which are often split into two or three planes to form irregular cubic shapes, sometimes forming short single row branches, mononucleated cells, with a single leaf-like chromophore, without protein nucleus, and reproduce asexually by zoospore and spore-like methods. The cell diameter is 12 μm to 22 μm. This genus is mostly aerial and is often found on the surface of stones and tree bark. In addition, its widespread distribution is in humid areas.
The algae in ZT, Province YNP contained two species, Chloroidium sp. and Heterochlorella luteoviridis (Figure 6).
Chloroidium sp. cells (indicated by arrows) are narrowly or broadly elliptical, chromosomal peripheral, lobulated or not, with or without protein nucleus, thin cell walls, thickening with age, and sometimes, granular structures are formed. Cells are 5 μm to 12 μm in diameter. According to the morphological characteristics, the algae species was Chlorella, which belongs to the Chlorophyta and Trebouxiophyceae. Heterochlorella luteoviridis cells (indicated by triangles) are spherical, mononuclear, the cell wall is thin, and the chloroplasts are pericyte. Cells are 4 μm to 14 μm in diameter. According to these morphological characteristics, this algal species belongs to Chlorophyta, Trebouxiophyceae, Trebouxiales, Trebouxiaceae, and Heterochlorella.
The temperature range for algae growth is wide. At 0 °C–30 °C, the number of algal cells increases. When the temperature reaches 35 °C, the survival rate drops sharply. The optimum temperature is 20 °C [12,13], and some reports suggest that the range of 25 ± 5 °C is suitable for growth [14]. The algae have strong adaptability to the pH of the environment. They can grow well in the range of pH 6.2–9.8. However, under strong acidic conditions, nutrient absorption is blocked and the growth is inhibited.
According to the culture and microstructure observations, in addition to the above-mentioned Apatococcus lobatus, Chlorella ellipsoidea, and Heterochlorella luteoviridis, the contamination layers also contained a small amount of Cyanobacteria, Chlorophyta, etc. However, the growth of these algae on the RTV-coated surface was not dominant and could only be observed after laboratory culture.

3.3. Other Microorganisms

It has been reported that there are fungi, moss, and other organisms on the composite insulation surface [15,16,17,18,19]. However, no moss was found in the samples retrieved from the substations in Province SCP. The fungal component of the microbes was identified by gene sequencing. Samples were sent to a biotech company for identification. The main identification process is as follows: polymerase chain reaction amplification of the internal transcribed spacer-1 region of the fungus, and the preparation of the Illumina Miseq sequencing library using the amplified product as a template. The primer used was the internal transcribed spacer-1 (5-TCCGTAGGTGAACCTGCGG-3).
Figure 7 shows a Venn diagram corresponding to the clustering results of operational taxonomic units (OTU). There are many types of fungi. Take the phylum as an example for statistics. As shown in the figure, different colors represent different fungal phyla. Except for a few unidentified fungi, there were 398, 305, 454, and 439 species of fungi in the insulator microorganisms in BZ, YA, and DY in Province SCP and ZT in Province YNP, respectively. The intersecting parts in the figure are the fungal species that coexist in two or more regions. The number of fungal species that crossed together in four regions was 156. In addition to algae and fungi, the contamination layers also contained small amounts of bacteria and amoeba.

4. Influence of Algae Contamination on RTV Surface Properties

4.1. Influence of Algae Contamination on RTV Surface Conductivity

To study the effect of algae on the RTV surface conductivity, the following resistance tests were performed under different conditions.
The size of the RTV test piece used for the experiment was 67 mm × 80 mm × 3.75 mm. The soaking liquid for experimental group 1 was algal liquid with stable growth while the soaking liquid for experimental group 2 was dead algal liquid. The control group was only soaked in the BG-11 nutrient solution. Results showed that the conductivity of the soaking liquids in experimental groups 1 and 2 was the same, and the conductivity of the soaking liquid in control group 3 was the smallest. The numerical values are given in Table 10.
To avoid the effect of different surface water content on the test results, the surface of the sample was completely air-dried before the experiment. The change in surface resistance was only determined by the attachment of algae to the surface of the test sample. The resistance at both ends of the test piece was measured with an insulation resistance meter and the value was read at 60 s. The measurement of the megohmmeter is the parallel connection of surface resistance and volume resistance, and the surface resistance value is much larger than the volume resistance. Therefore, the resistance value was regarded as the surface resistance, and then the estimated value of the surface conductivity was calculated. At the same time, we also calculated the resistance by applying a voltage to the sample and reading the current in real-time.
The presence of algae had a significant impact on the electrical conductivity of the RTV test piece surface. The surface resistance and resistance of the RTV surface soaked in culture solution and dried was 888 MΩ, the largest among the three. The dry surface resistance of the soaked algae liquid dropped rapidly to 8.52 MΩ, indicating that the presence of living algal cells significantly reduced the surface resistance of RTV.

4.2. Hydrophobicity Analysis of RTV Coatings

The effect of different algae contamination on the hydrophobicity was also studied on the clean parts with and without algae on the same RTV pillar insulator to compare the hydrophobic performance of the two parts. Figure 8a,b shows the test results, where (a) is the test area without epiphytic algae, and (b) is the test area with the algae epiphyte.
According to the hydrophobic classification standard [20], the surface hydrophobicity grade of the RTV coating covering the algae contamination layer was HC6, suggesting a low hydrophobicity. The surface hydrophobicity grade of the clean RTV paint without an algae contamination layer was HC2, revealing that the effect of algae growth on the hydrophobicity of the RTV surface was obvious.
To investigate the effect of the algae contamination layer on the hydrophobicity of the RTV coating, the hydrophobicity test was carried out during the annual inspection of the ±800 kV YBS converter station, ±800 kV FLS converter station, and ±500 kV DYS converter station, respectively. The converter station names were abbreviated. The water spray classification method was used to test the area covered by the algae contamination layer and the area not covered by the algae contamination layer. The obtained results are shown in Table 11.
The hydrophobicity of the RTV decreased to a certain extent in the areas covered by algae contamination. The effects of different algal cell densities and different growth degrees of algae on the hydrophobicity and hydrophobic transfer of RTV on the surfaces are discussed. The cultured prototheca liquid was released into different concentrations with deionized water. The size of the RTV test piece used for the experiment was 67 mm × 80 mm × 3.75 mm, and 10 mL of algal liquid was inoculated according to the surface area of the test piece. The salinity of the obtained algae solution had little effect, so it can be ignored. Finally, four groups of algal cell density gradient samples were set: 105·cm−2, 106·cm−2, 5 × 10⁶·cm−2, and 107·cm−2, respectively. There were four samples in each group and another four samples with only 10 mL of deionized water as the control group.
The test pieces inoculated with algal cells were first cultured in a climate chamber for 3 days and then placed in an incubator (temperature 25 ± 1 °C, light intensity 2000 lux, light–dark ratio 12 h:12 h, humidity RH 65%) for cultivation. The hydrophobicity of the experimental samples was evaluated. As shown in Figure 9, the hydrophobicity grade was measured by the static contact angle method. The method is used to measure the contact angle between the edge of a single water drop and the surface of the solid material with a contact angle measuring instrument to evaluate the hydrophobicity [21]. In the test, the graduated syringe was used to drip water onto the horizontal plane of the RTV test piece and use the contact angle measuring instrument to measure the contact angle. The above method was used to reflect the effect of different concentrations of algal liquid on the surface hydrophobicity of the RTV. Figure 10 shows the results of the hydrophobicity test of the RTV test piece cultured in the same humid environment.
It can be seen from the graph of the relationship between the contact angle and time that the control group that did not grow algae showed a stable hydrophobicity throughout. However, the experimental groups covered with algae all showed a downward trend with time. The decrease in hydrophobicity is related to the algae density. With the increase in algae density, the hydrophobicity decreases further. For example, on the surface of the RTV sample, the static contact angle decreased by 14.19% after 96 h of algae coverage at a density of 105/cm2. Moreover, the static contact angle decreased by 47.31% after being covered with 107/cm2 density algae. Hence, it means that the presence and growth action of algae make the hydrophobicity of the RTV drop significantly.
In order to study the inhibitory form of algae on hydrophobicity, after placing the RTV test piece with algae attached for 3 to 4 days, the algae on its surface completely dried and lost their activity. The hydrophobicity test was carried out, and it was found that the hydrophobicity of the test piece recovered, revealing that the inhibition of algae on the hydrophobic migration of RTV was not permanent. When algal cells lose activity, their inhibitory effect on hydrophobic migration disappears.

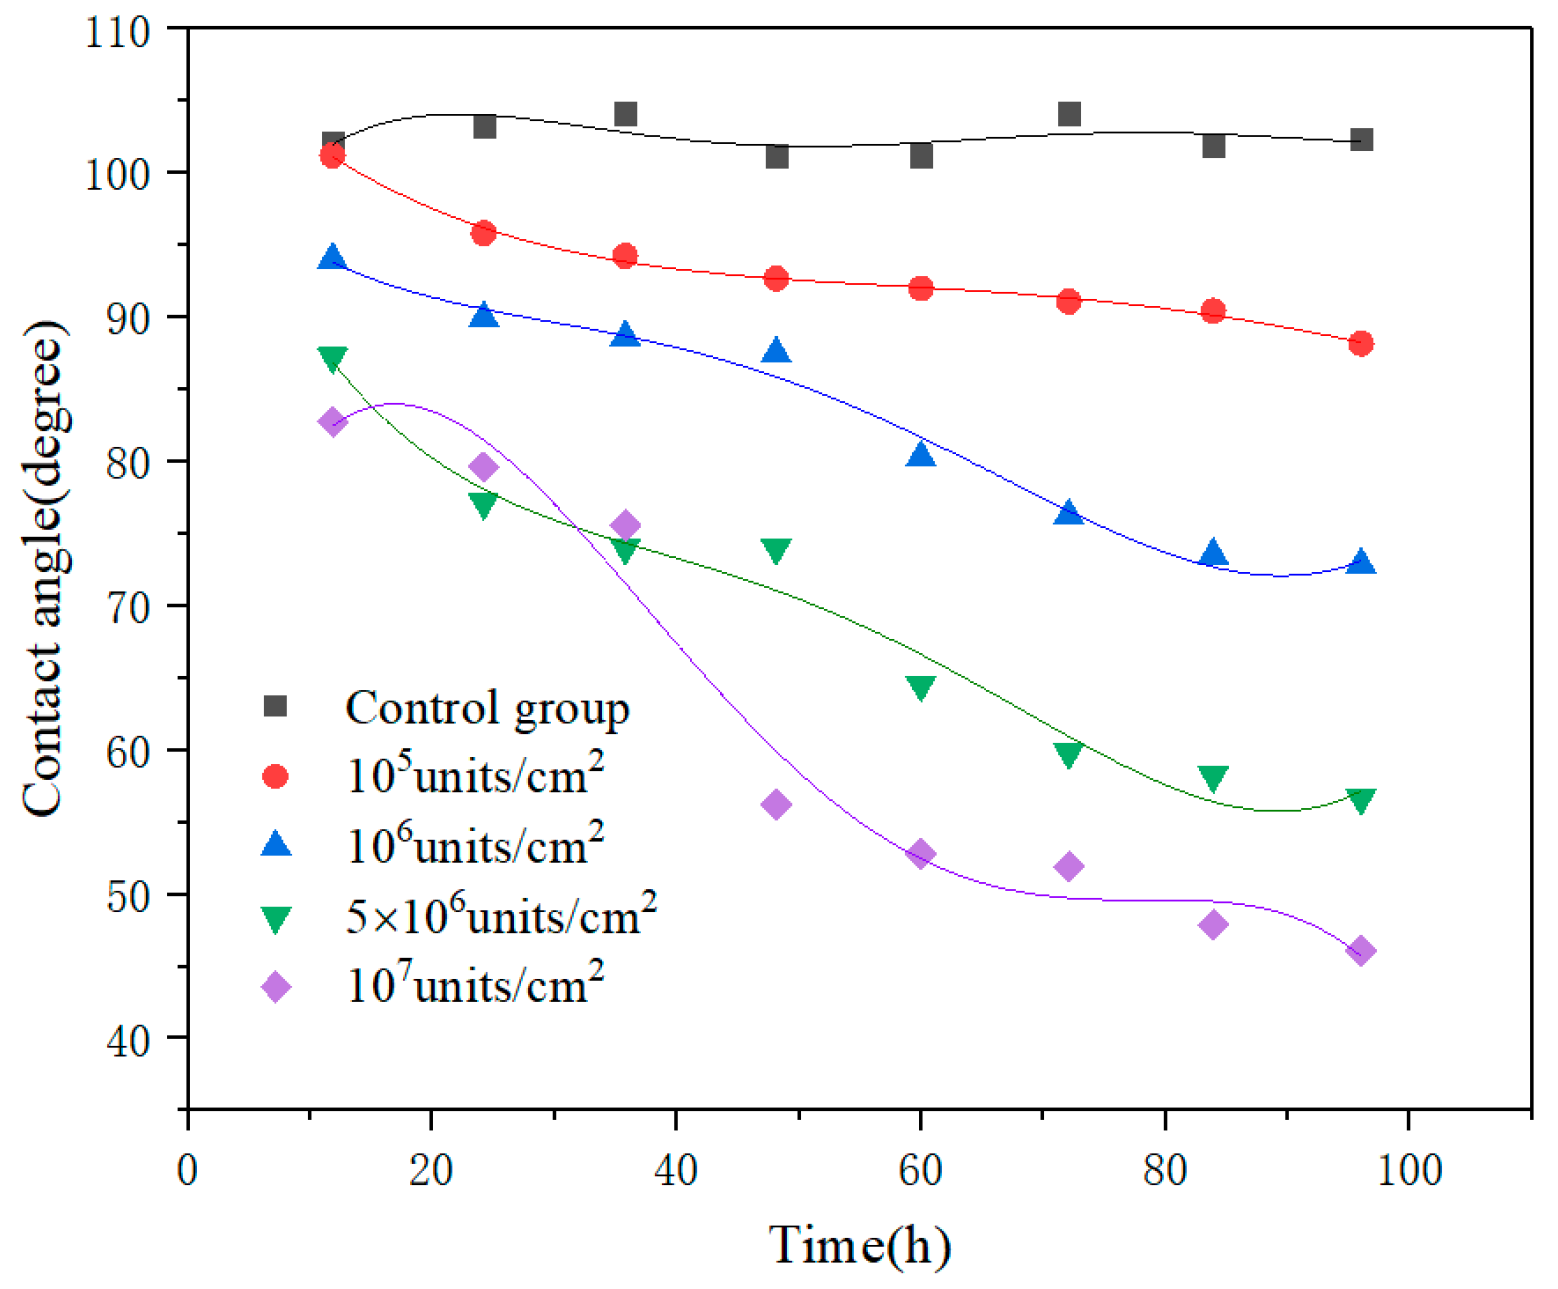
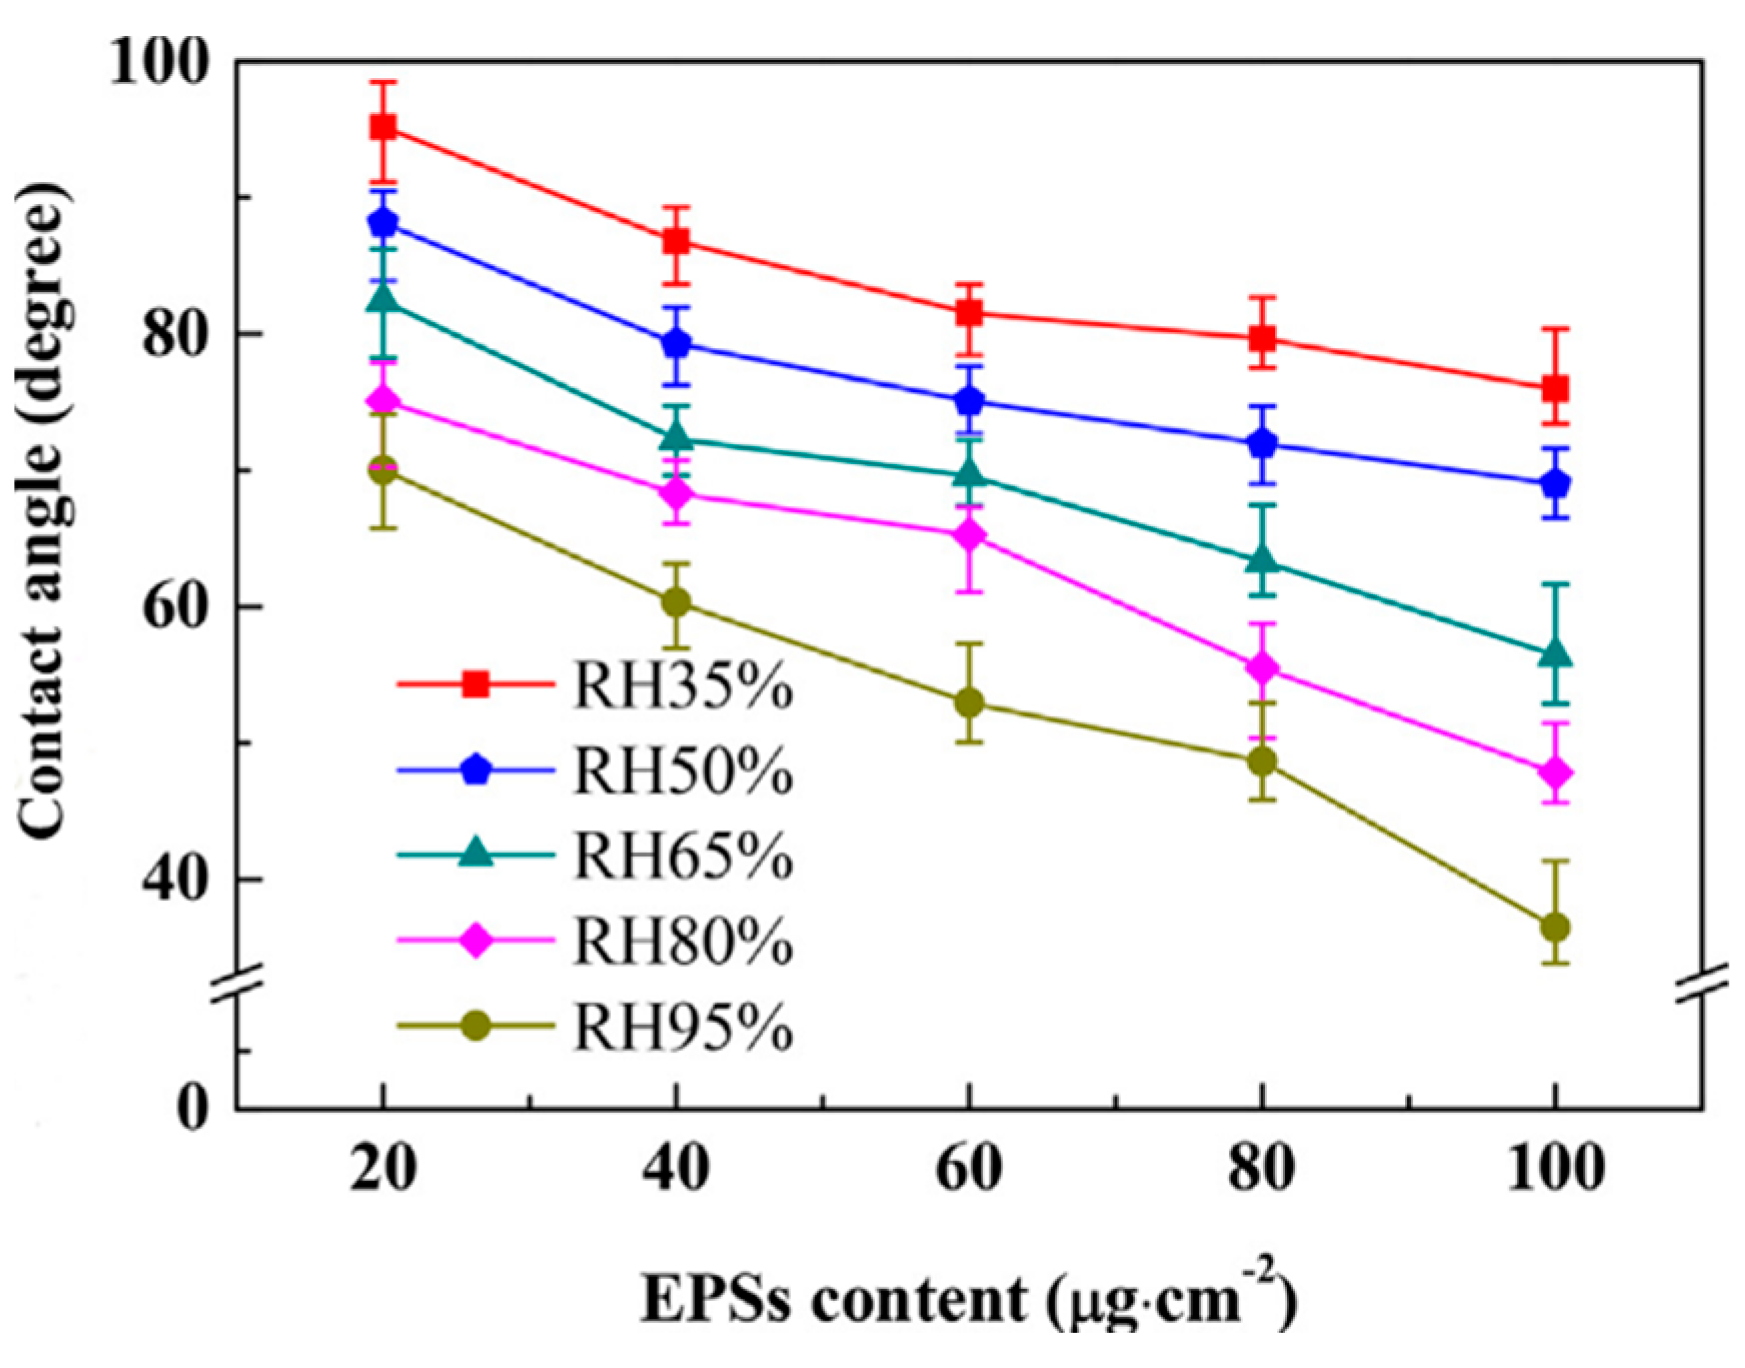
4.3. Effect of Extracellular Polymeric Substance on the Hydrophobicity of RTV

The extracellular polymeric substance (EPS) of algal fluid was extracted for analysis and its main components were mainly polysaccharides (68%), proteins (18.6%), fats (10.8%), and other trace components (2.6%) including DNA [22].
The extracellular organic secretions were separately extracted and quantitatively coated on the surface of the RTV silicone rubber. The relationship between the hydrophobic angle change and the concentration under different relative humidity conditions is shown in Figure 11.
It can be seen from Figure 11 that with the increase in the EPS density and the increase in the EPS humidity, the surface contact angle of the insulator decreased, which indicates that the hydrophobicity of the insulator decreased. Algal extracellular secretions have strong adhesion, so they have a strong ability to absorb moisture in the air. When algae grow on the RTV coating and produce secretions, it makes an otherwise hydrophobic surface hydrophilic. Therefore, it reveals that the secretion produced by the physiological activity of algal cells is one of the main reasons for the lower hydrophobicity.

5. Influence of Algal Fouling Layer on the Structure of RTV Materials

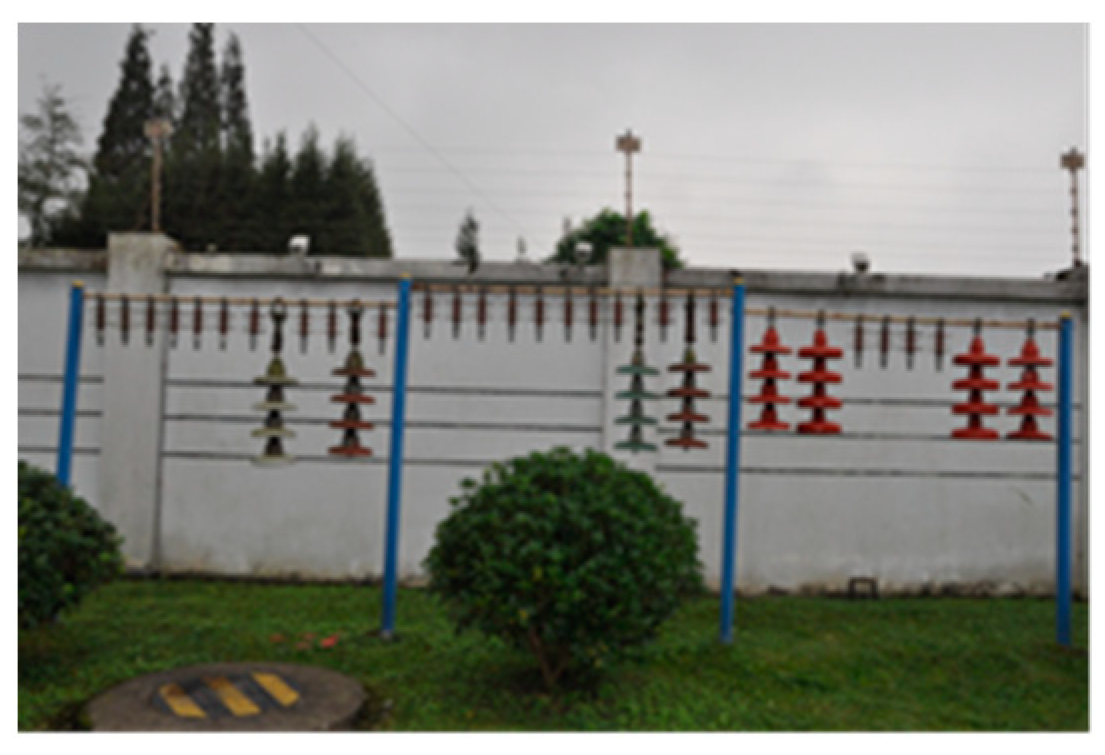
5.1. On Site Measurement Points and Test Product Introduction

The YA 220 kV CBS substation was selected as the field test point, as shown in Figure 12. The natural growth of algae on the surface of the RTV coating was observed by hanging insulators in this substation. The climate of YA in Province SCP is a subtropical monsoon humid climate. The average annual temperature is between 14.1 °C and 17.9 °C. In addition, there is a lot of rainfall, and the annual rainfall is more than 1000–1800 mm. The substation is surrounded by mountains, lush vegetation, and has a high humidity with a lot of rain. The following picture shows the actual suspension arrangement for the insulator string at the measuring point. In this test, XP-70 disc suspension porcelain insulators, all coated with RTV paint, were used as the test samples. Its structural height was 146 mm, the nominal disk diameter was 255 mm, and the creepage distance was 295 mm.
The algae and algae-free areas of the RTV coating were selected from the field test points for testing. At the first, fourth, seventh, and tenth months, the aging process of the silicone rubber in four stages was measured.

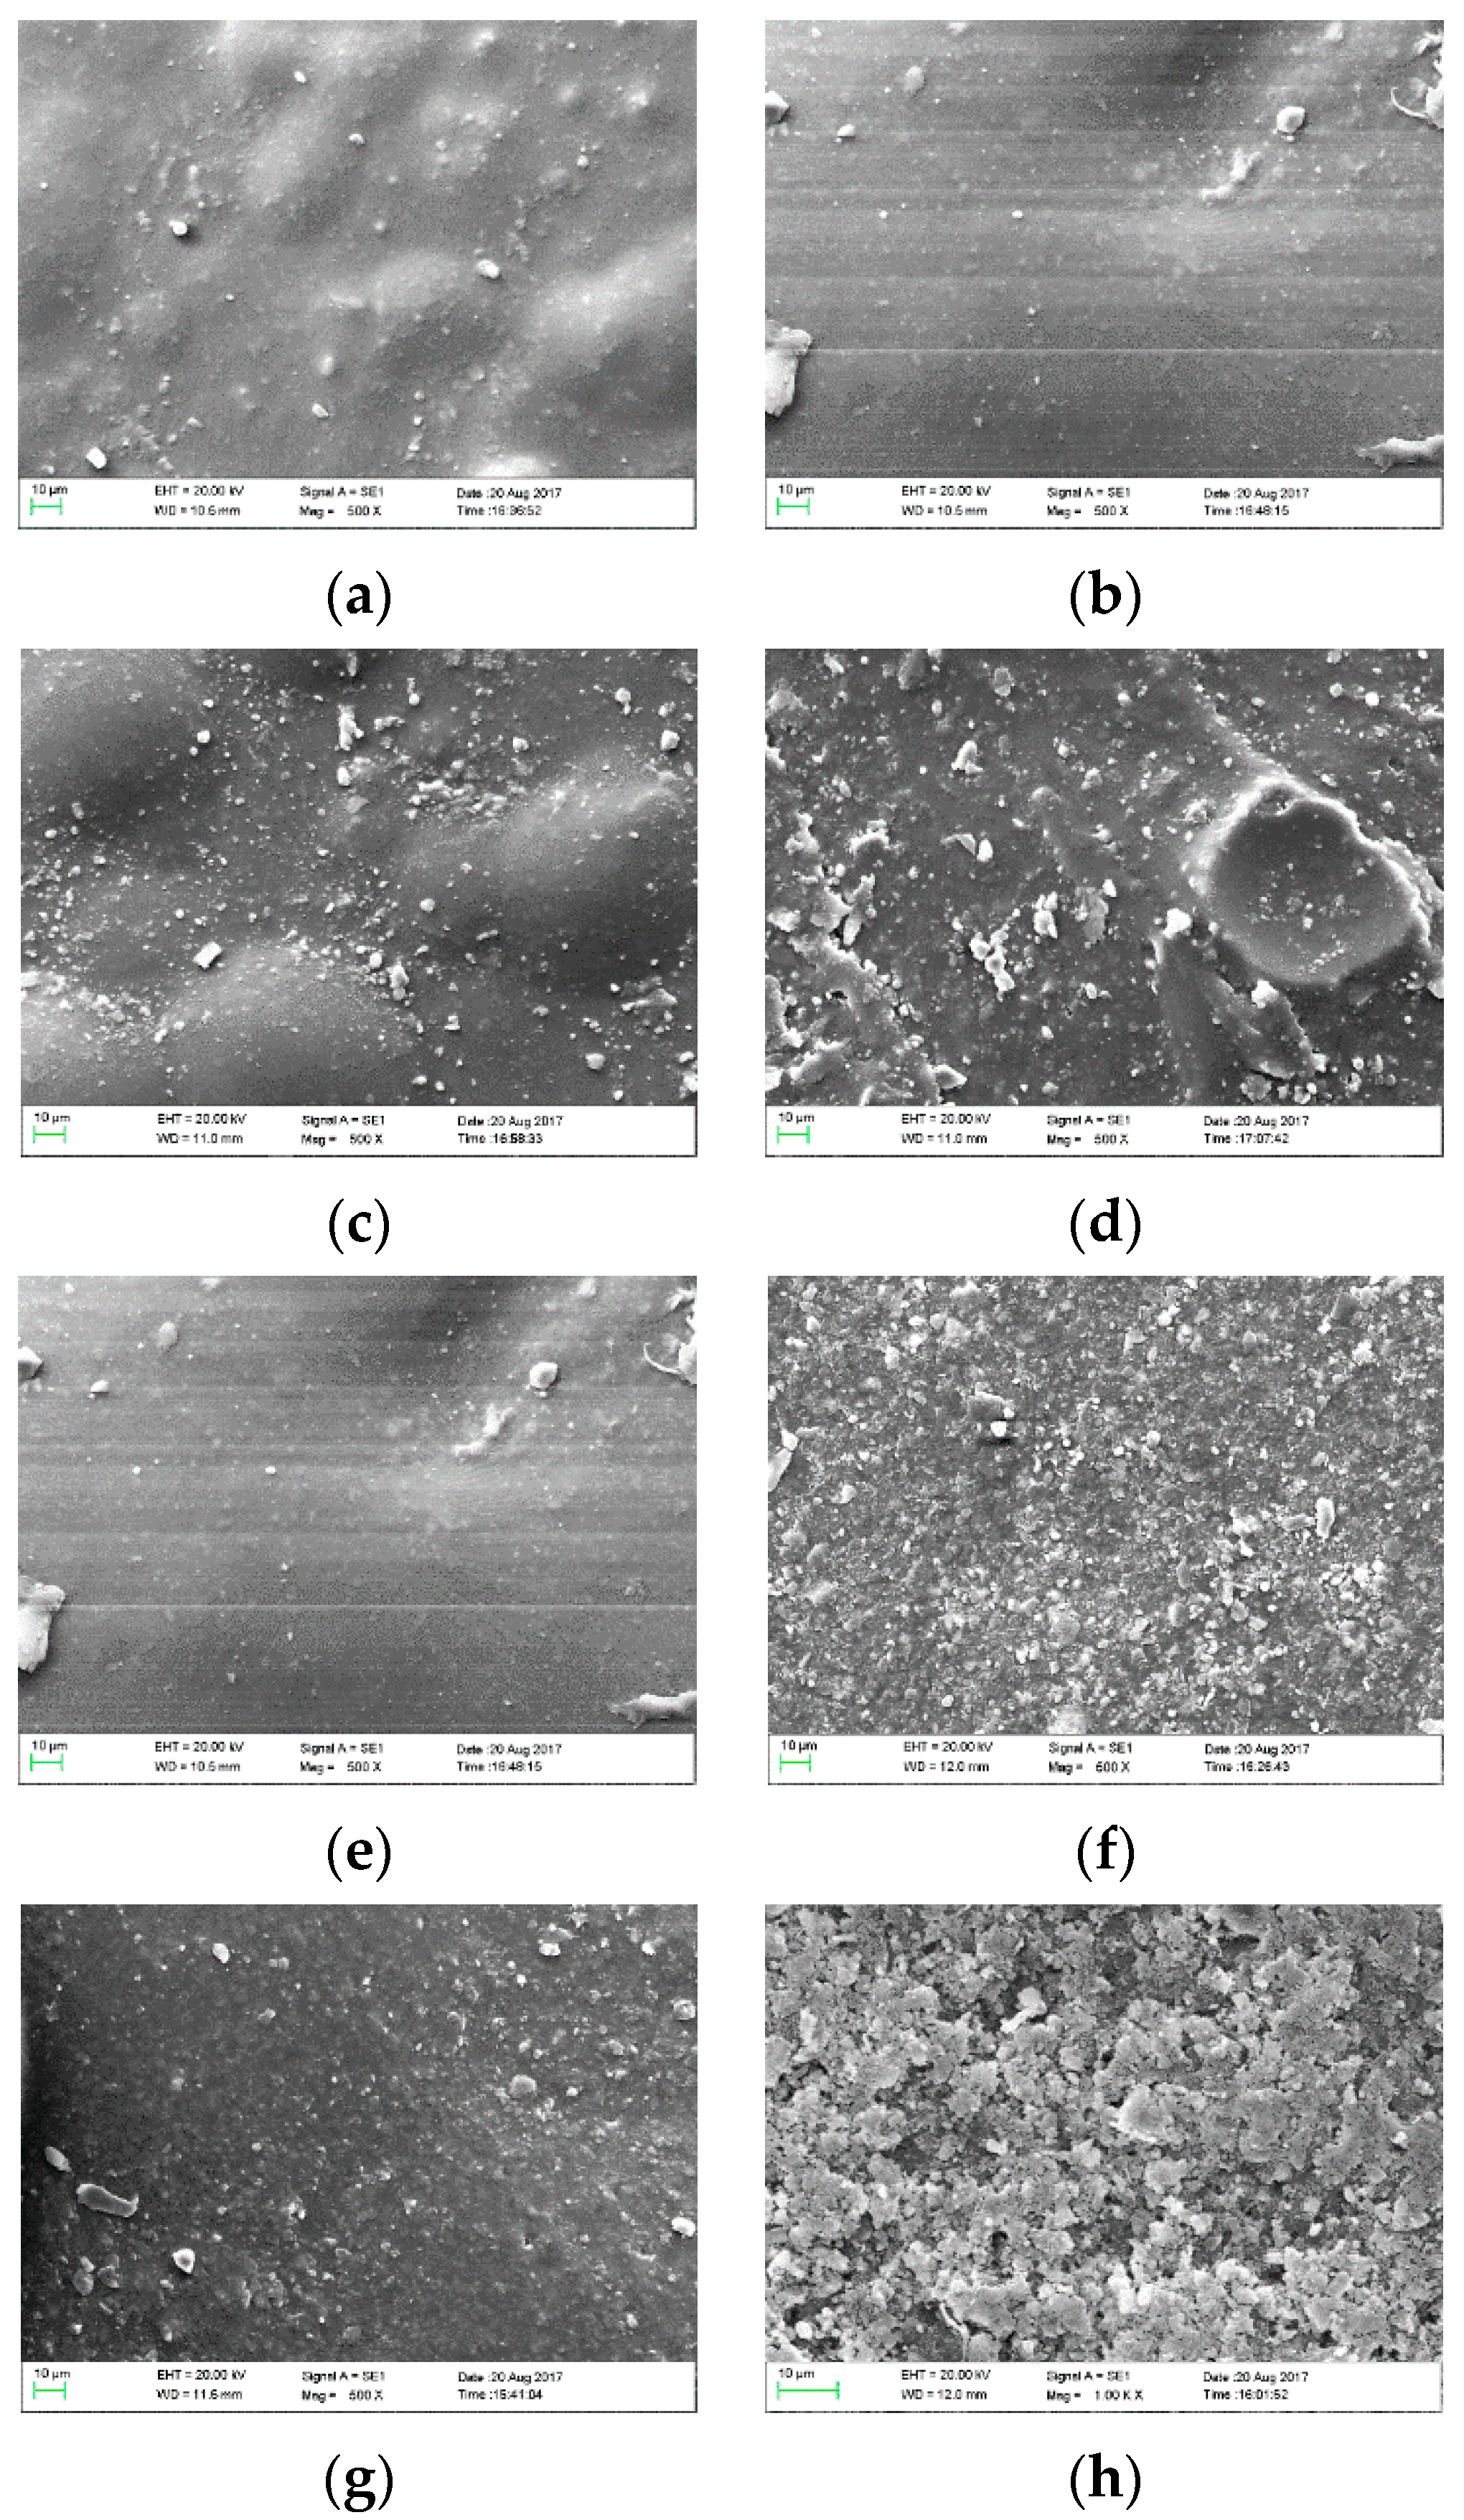
5.2. Surface Topography

The micromorphological changes in silicone rubber at different times were observed using a TGA-4000 (PerkinElmer) high-resolution scanning electron microscope (Figure 13).
By comparing the microscopic morphology of the algae-free area and the algae-containing area, it was observed that the algae-containing area was relatively rough and porous, while the algae-free area was relatively smooth and flat. At the first month, there was little difference in the surface microtopography between the algae-bearing and the algae-free areas. The reason may be because algae are in the early stages of growth and have less impact on the RTV. With the extension of time, the gap between the algae-bearing area and the algae-free area becomes more obvious. It is speculated that the reason is that the algae are already in a period of strong growth, and the EPS of the algae has a certain impact on the surface of the RTV. This results in increased damage to the silicone rubber surface relative to the algae-free area. After ten months, the microscopic morphology of the silicone rubber surface in the algae area had been damaged in a large area. At this time, the growth action of algae and the secretions produced by the algae further damaged the silicone rubber. This not only affects the outer layer, but even the structure of the inner layer.
Then, by comparing the microscopic morphology of the insulators with algae at different stages, the surface covered by the algae contamination layer was rougher and more grainy. The destruction of the surface topography progressed much faster than in the algae-free situation. The destruction of the RTV surface structure under the action of the growth of algae and the secretion produced by it not only affects the hydrophobic mobility, but is probably the main reason for the decrease in electrical resistance.

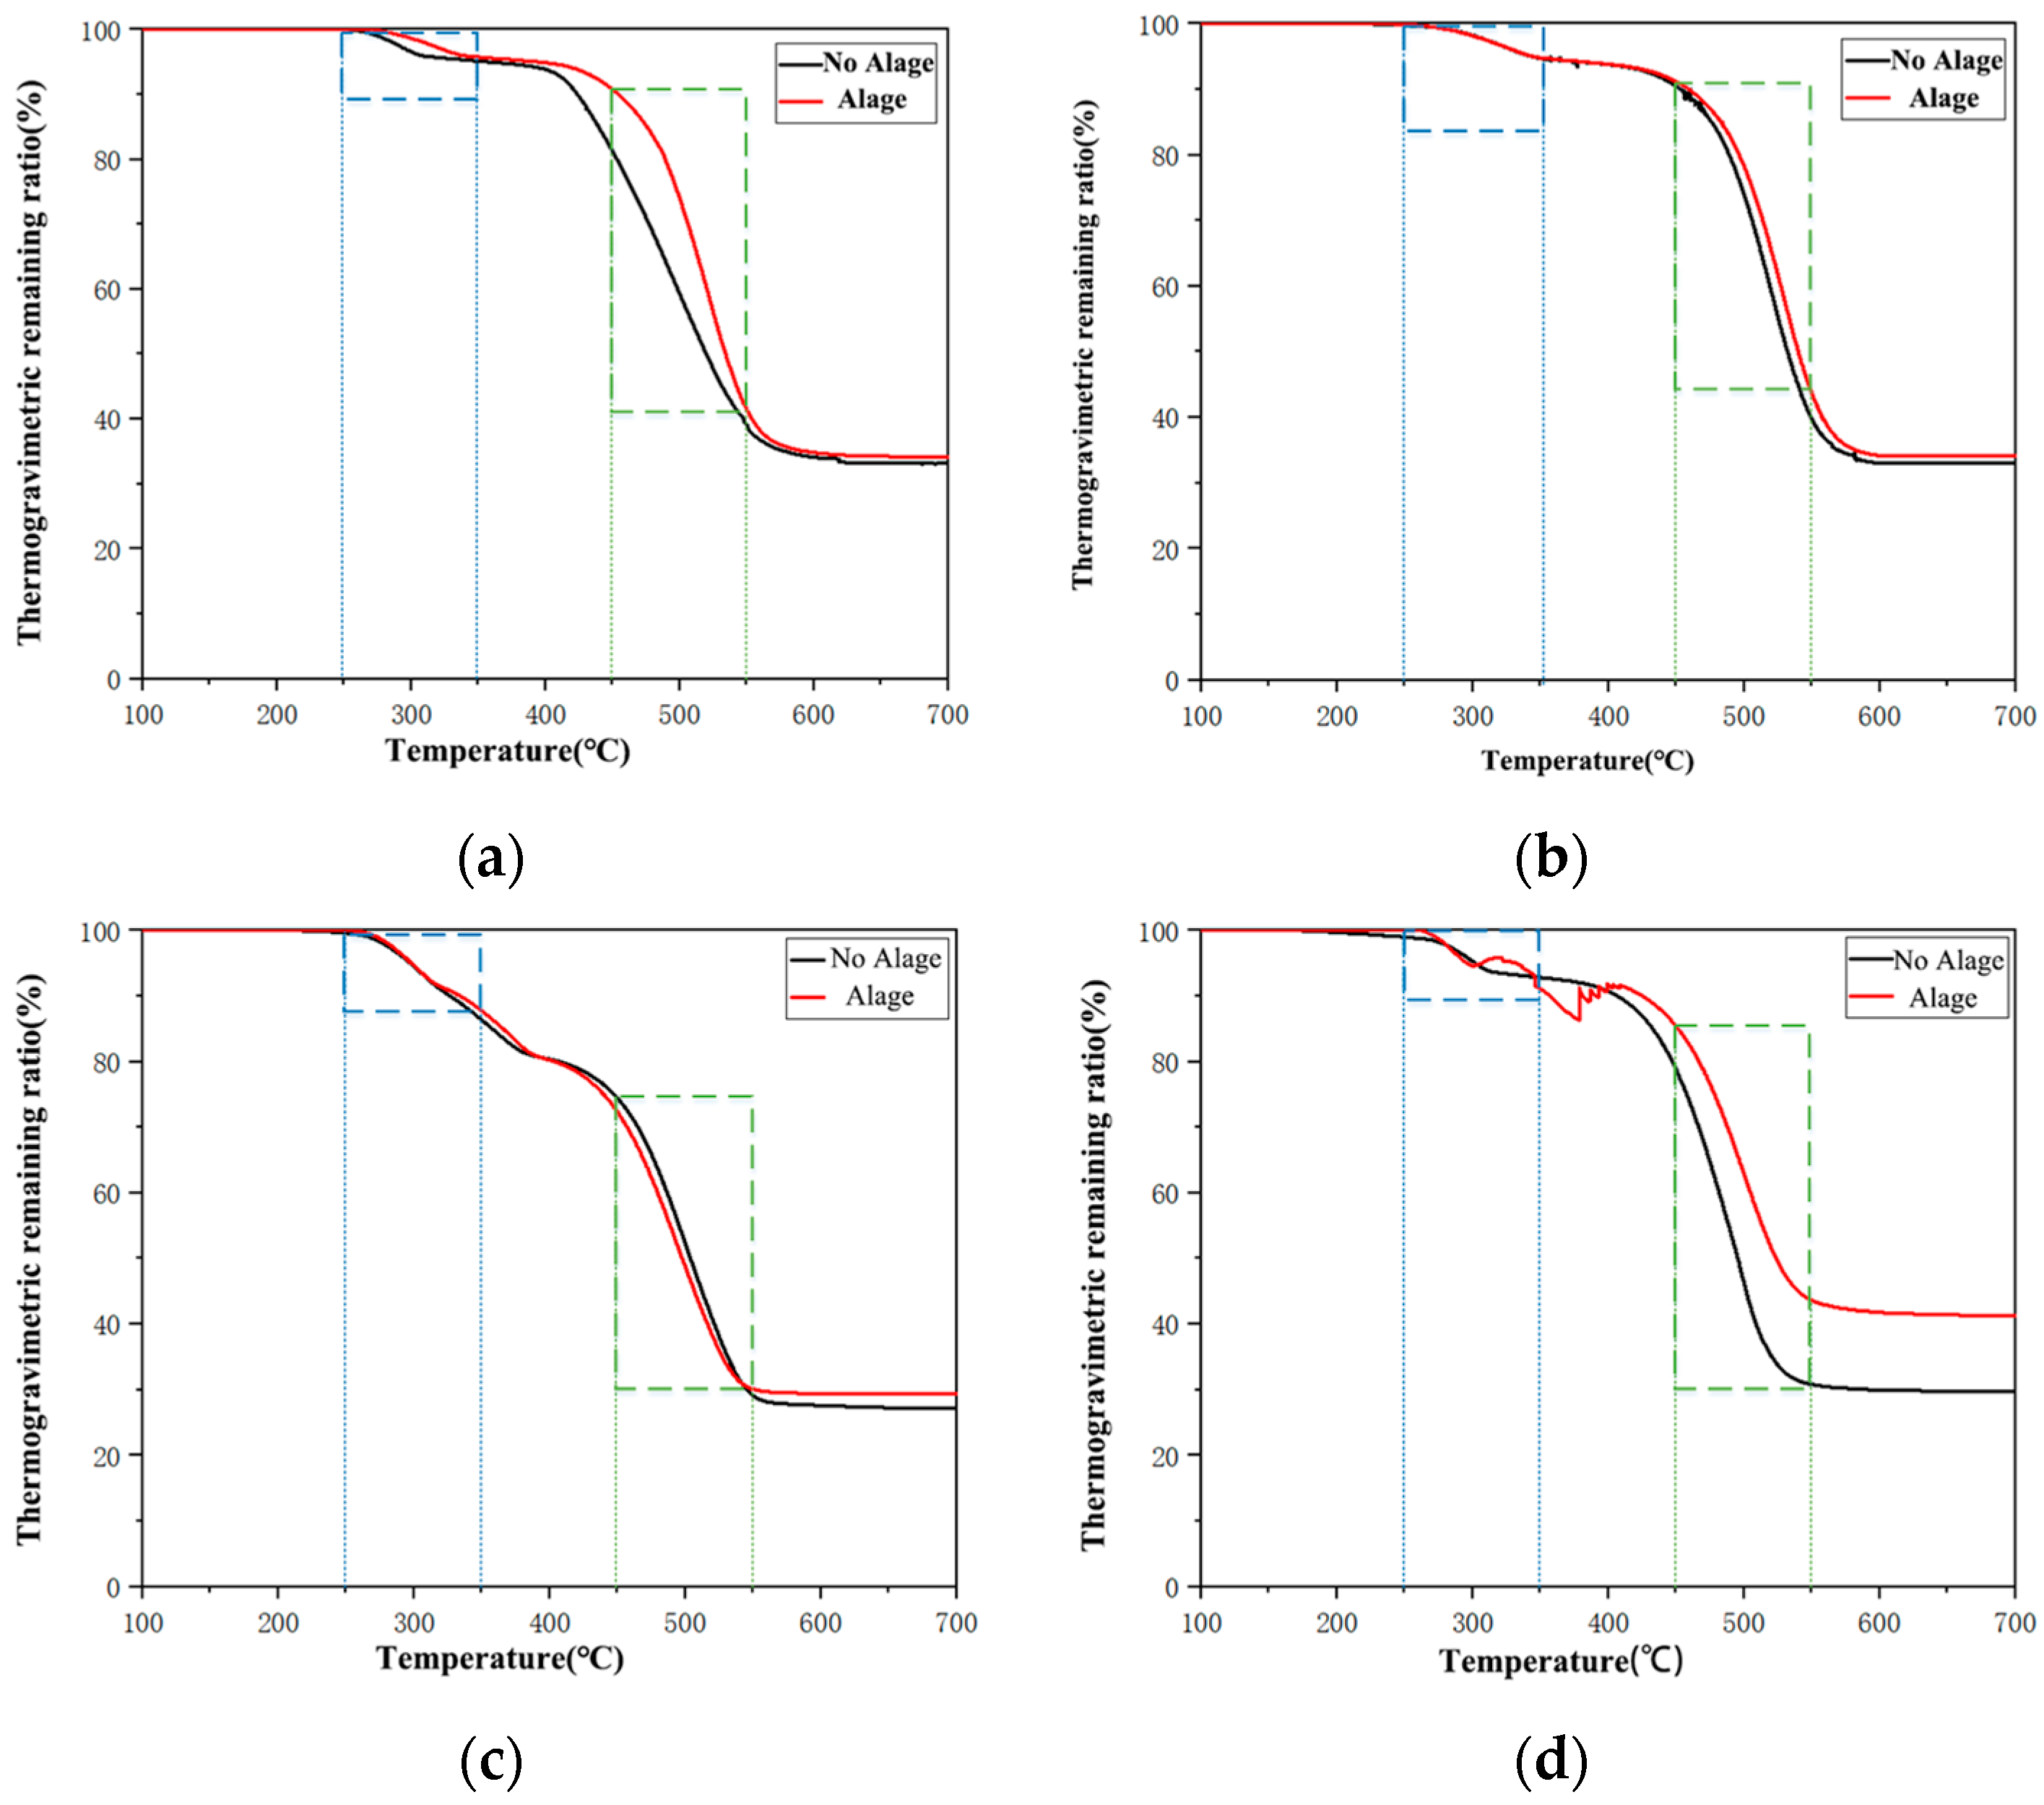
5.3. Thermogravimetric Analysis

Figure 14 is a thermogravimetric curve of samples from the algae-free area and the algae-bearing area from 1 to 10 months. The ordinate in the figure is the temperature (°C), and the ordinate is the remaining proportion of the thermal weight loss (%). The first process occurs at 250 °C–350 °C, attributed to the decomposition of the aluminum hydroxide filler. The second weight loss occurred at 450 °C–550 °C, mainly due to the decomposition of siloxane.
In the first process, the weight loss ratios of the algae-free area and algae-bearing area were almost the same, suggesting that the content of aluminum hydroxide fillers was similar between the two. In the second process, the weight loss ratio of samples in the algal area of the RTV silicone rubber was lower than that in the algae-free area, indicating that the algal regiosiloxane content was lower. In addition, the longer time covered by the algae contamination layer indicated a lower content of siloxane and aluminum hydroxide.
The main component of RTV is silicone rubber, with siloxane as the main chain of the molecule, endowing the RTV coating with better flexibility and hydrophobic recovery [23]. It is precisely due to the migration of small siloxane molecules and the dancing of the main chain, revealing that the silicone rubber has excellent hydrophobicity transfer. The reduction in algal regiosiloxane caused a gradual loss of the hydrophobicity transfer and its microstructure was destroyed, a large number of holes were formed, and the surface of the silicone rubber became rough.
On the other hand, aluminum hydroxide is a functional filler that enables RTV with excellent flame retardancy and tracking resistance. The rapid decomposition of aluminum hydroxide in the algae region leads to the direct reaction of heat and oxygen into the interior of the silicone rubber under outdoor operating conditions, accelerating the decomposition and aging of the silicone rubber. At the same time, the precipitation of aluminum hydroxide will adhere to the surface of the RTV, which will reduce the hydrophobic mobility.

6. Conclusions

The contamination components and distribution characteristics of the algae contamination layer on the coated surface of RTV insulators in some substations in the SCP area and their influence on the RTV performance were studied and the following conclusions were reached:
  • The degree of algal growth and coverage on the RTV insulator surface was positively correlated with its contamination level, and negatively correlated with the vertical height. No algal growth on the RTV surface was found under the DC voltage.
  • The soluble component in the algae contamination layer was mainly CaSO4. Biological species include algae (Apatococcus lobatus, Chloroidium sp., Heterochlorella luteoviridis) and fungi.
  • The coverage of algal cells reduced the surface resistance of RTV, and its extracellular secretions reduced the hydrophobicity.
  • The algae contamination layer coverage accelerated the destruction of the siloxane in the silicone rubber and the precipitation of the aluminum hydroxide filler, generating a large number of pores on the surface. These pores accelerated the aging of the RTV and the loss of hydrophobicity transfer.

Author Contributions

Conceptualization, Y.L. and H.Y.; Methodology, Y.L. and Y.T.; Software, F.L.; Validation, H.B.; Formal analysis, F.Z.; Investigation, Y.L.; Resources, H.Y. and X.L.; Data curation, C.Y. and Z.S.; Writing—original draft preparation, Y.L. and Z.S.; Writing—review and editing, H.Y. and Z.S.; Project administration Y.L. All authors have read and agreed to the published version of the manuscript.

Funding

This work was supported by the Science and Technology Planning Project of Xi’an (No. 21XJZZ0014), Chengdu Technology Innovation R&D Project (No. 2022-YF05-00971-SN) and Start-up Funds for Talent Introduction of Southwest Minzu University (No. RQD2022022).

Institutional Review Board Statement

Not applicable.

Informed Consent Statement

Not applicable.

Data Availability Statement

Data sharing not applicable. No new data were created or analyzed in this study. Data sharing is not applicable to this article.

Conflicts of Interest

The authors declare no conflict of interest.

References

  1. Wang, Z.; Yin, J.; Hao, X.; Wang, P.; Zhang, Q.; Lan, G.; Zhang, Q. Study on the Role of Algae in Travertine Deposition Based on Micro Lithofacies Analysis—A Case Study of Huanglong, Sichuan Province. Carsologica Sin. 2021, 40, 44–54. [Google Scholar]
  2. Wang, C.; Liang, Q.; Li, R. Influence of Interface Micro Air Gap on Insulation Performance of Composite Insulator. Water Resour. Power 2016, 34, 186–190. [Google Scholar]
  3. Nan, J.; Li, H.; Wan, X.; Huo, F.; Lin, F. Pollution Flashover Characteristics of Composite Crossarm Insulator with a Large Diameter. Energies 2021, 14, 6491. [Google Scholar] [CrossRef]
  4. Milner, H.W. The Chemical Composition of Algae. Algal Cult. Lab. Pilot Plant 1953, 600, 285–302. [Google Scholar]
  5. Guan, Z.; Zhang, R.; Xue, J.; Ma, S.; Li, N. Composition of Soluble Salt in Natural Pollution and its Influences on Flashover Voltage. Insul. Surge Arresters 1989, 6, 13–18. [Google Scholar]
  6. Ma, Z. A Comparision Experiment of Pollution Degree of Insulator at Work and Those out of Action. High Volt. Eng. 1993, 19, 33–35. [Google Scholar]
  7. Gubanski, S.M.; Fernando, M.A.R.M.; Pietr, S.J.; Matula, J.; Kyaruzi, A. Effects of Biological Contamination on Insulator Performance. In Proceedings of the 6th International Conference on Properties and Applications of Dielectric Materials (Cat. No. 00CH36347), Xi’an, China, 21–26 June 2000. [Google Scholar]
  8. Jia, Z.D.; Wang, Y.; Ouyang, X.G.; Zhang, X. Influence of Green Algae on Hydrophobic Property of HTV Silicon Rubber. High Volt. 2017, 43, 885–890. [Google Scholar]
  9. Cao, W.; Xue, H.; Shen, W.; Yang, H.; Zhao, L.; Wang, Y. The Effect of Dynamic Behaviours of the Water Droplet on DC/AC Flashover Performance on Silicone Rubber Surface: Experiment, Simulation and Theoretical Analysis. High Volt. 2021, 6, 637–646. [Google Scholar] [CrossRef]
  10. IEC/TS 60507; Artificial Pollution Tests on High Voltage Insulators to be Used on A. C. Systems. International Electrotechnical Commission: Geneva, Switzerland, 2013.
  11. IEC/TS 60815. Selection and Dimensioning of High-Voltage Insulators Intended for Use in Polluted Conditions. International Electrotechnical Commission: Geneva, Switzerland, 2008.
  12. Jiang, X. Effects of Temperatures, Light Intensities, and Nitro Gen Concentrations on the Growth and Fatty Acid Compositions of Nannochloropsis Oculata. Mar. Sci. 2002, 26, 9–13. [Google Scholar]
  13. Zhou, Z.; Chen, X.; Chen, C.; Zhang, Y. Effect of Apoprotein on Antioxidant Activity of Phycobiliproteins. Mar. Sci. 2003, 27, 73–76. [Google Scholar]
  14. Rocha, J.M.S.; Garcia, J.E.C.; Henriques, M.H.F. Growth Aspects of the Marine Microalga Nannochloropsis gaditana. Bimolecular Eng. 2003, 20, 237–242. [Google Scholar] [CrossRef] [Green Version]
  15. Fernando, M.A.R.M.; Gubanski, S.M. Tropical Environmental Impacts on Surface Properties of Nonceramic Insulators. In Proceedings of the PowerTech Budapest 99. Abstract Records (Cat. No. 99EX376), Budapest, Hungary, 29 August–2 September 1999. [Google Scholar]
  16. Gubanski, S.M.; Karlsson, S.; Fernando, M.A.R. Performance of Biologically Contaminated High Voltage Insulators. In Proceedings of the Industrial and Information Systems, First International Conference on IEEE, Tirtayasa, Indonesia, 8–11 August 2006. [Google Scholar]
  17. Gubanski, S.M.; Dernfalk, A.; Wallstrom, S.; Karlsson, S. Performance and Diagnostics of Biologically Contaminated Insulators. In Proceedings of the 2006 IEEE 8th International Conference on Properties & Applications of Dielectric Materials, Bali, Indonesia, 26–30 June 2006. [Google Scholar]
  18. Bengtsson, M.; Gronlund, R.; Sjoholm, M.; Weibring, P.; Kroll, S.; Edner, H.; Svanberg, S.; Dernfalk, A. Lidar Fluorescence Measurements of Algal Growth on Electrical Insulators. In Proceedings of the 2003 Conference on Lasers and Electro-Optics Europe (CLEO/Europe 2003) (IEEE Cat. No.03TH8666), Munich, Germany, 22–27 June 2003. [Google Scholar]
  19. Bengtsson, M.; Wallstrom, S.; Gronlund, R.; Anderson, B.; Sjoholm, M.; Larsson, A.; Kroll, S.; Svanberg, S. Development of a Tool for Remote Detection of Fungi and Algae on Electrical Insulators Using Laser Induced Fluorescence Combined with Principal Component Analysis. In Proceedings of the CLEO/Europe. 2005 Conference on Lasers and Electro-Optics Europe, San Jose, CA, USA, 12–17 June 2005. [Google Scholar]
  20. Sweden Transmission Research Institute. STRI Guide 92/1, Hydrophobicity Classification Guide; Sweden Transmission Research Institute: Ludvika, Sweden, 1992. [Google Scholar]
  21. Gu, Y.; Shi, Y.; Li, X.; Shi, Z.; Zhang, X.; Min, C.; Wei, J.; You, C. Effect of Microorganisms on Hydrophobicity of Silicone Rubber Materials. Insul. Surge Arresters 2020, 1, 166–173. [Google Scholar]
  22. Yang, S.; Jia, Z.; Ouyang, X.; Bai, H.; Liu, R. Hydrophobicity Characteristics of Algae-Fouled HVDC Insulators in Subtropical Climates. Electr. Power Syst. Res. 2018, 163, 626–637. [Google Scholar] [CrossRef]
  23. Lu, Z.; Yang, X. A Study on Hydrophobicity Transfer of Silicone Rubber. Proc. CSEE 2001, 5, 52–56, 74. [Google Scholar]
Figure 1. Schematic diagram of the insulator sheds.
Energies 15 05216 g001
Figure 2. The algae contamination layer distribution. (a) GA JFS 110 kV pillar insulator. (b) YA CBS 110 kV pillar insulator. (c) NJ CSS 220kV circuit breaker pillar insulator.
Energies 15 05216 g002
Figure 3. The different height positions of the 110 kV circuit breaker in YA 110 kV BQS. (a) High voltage side. (b) Middle. (c) Low voltage side.
Energies 15 05216 g003
Figure 4. The DC/AC pillar insulators of the DYS converter station. (a) DC pillar insulator. (b) AC pillar insulator.
Energies 15 05216 g004
Figure 5. A microscope image of Apatococcus lobatus.
Energies 15 05216 g005
Figure 6. The morphology of algal cells in ZT, Province YNP.
Energies 15 05216 g006
Figure 7. The fungal OTU cluster Venn diagram.
Energies 15 05216 g007
Figure 8. The hydrophobicity test results of the RTV post insulator. (a) Algae-free RTV surface. (b) Algal RTV surface.
Energies 15 05216 g008
Figure 9. The static contact angle.
Energies 15 05216 g009
Figure 10. The contact angle of the RTV covered with different densities of algae.
Energies 15 05216 g010
Figure 11. The relationship between the contact angle and EPS concentration.
Energies 15 05216 g011
Figure 12. The CBS substation site testing point.
Energies 15 05216 g012
Figure 13. The RTV micro-morphology at different periods. (a) 1 month (No algae). (b) 1 month (Algae). (c) 4 months (No algae). (d) 4 months (Algae). (e) 7 months (No algae). (f) 7 months (Algae). (g) 10 months (No algae). (h) 10 months (Algae).
Energies 15 05216 g013
Figure 14. The thermogravimetric analysis of the RTV coatings. (a) 1 month. (b) 4 months. (c) 7 months. (d) 10 months.
Energies 15 05216 g014
Table 1. Statistics on the growth of algae in Province SCP.
CityClimatic ConditionsNumber of
Substations/Number of Substations with Algae
Contamination Level of the Substation with Algae/ESDD, mg/cm2
Average Annual Temperature (°C)Average Annual Precipitation (mm)Average Annual Humidity (%)Annual Sunshine Hours(h)C
0.1–0.25
D
0.25–0.35
CD15.8892.27687565/321
ZG17.9989.276843.124/1019
LZ17.11233.2801008.237/110
DY16879.278920.661/413
MY16.5782.1711157.263/413
GY16.31233.2701198.434/312
SN17.11033.272989.222/624
NJ17.3899.1811107.931/13211
LES17.31223.280923.8546/1028
NC17.7768.9741199.0536/743
MS17.2873.277945.6541/413
YB18.2878.972949.5537/752
GA17.6980.2771259.818/1486
DZ17.41222.8711056.6541/615
YA16.21689.280843.442/651
BZ16.91246.872136415/624
ZY17.11002.7751273.6525/743
AB9789.1622132.226/0/
GZ7.1786.2691672.414/0/
LS17.7899.2542366.629/0/
PZH22722.3472896.134/0/
ZT1771474190026/624
Total////767/1174572
Table 2. The algae growth direction on the RTV coating for each substation.
SubstationVoltage LevelPillarCircuit BreakerCTPTArrester
YXS220 kVShadyShady//Shady
DYS500 kVShadyShady///
CBS220 kVAllAllMainly
Shady
Mainly
Shady
Mainly
Shady
BQS110 kVAllAllMainly
Shady
Mainly
Shady
All
EYS110 kVAllAllShadyShadyShady
XYS110 kVMainly
Shady
Mainly
Shady
ShadyMainly
Shady
Shady
JFS220 kVShadyShadyShadyShadyShady
XXS110 kVShadyShadyShadyShadyShady
CSS220 kVShadyShadyShadyShady/
DJWS220 kV/Shady///
JNS220 kVShadyShady///
ZHS110 kV/Shady///
Table 3. The degree of algal growth on different parts of the insulator.
Substation/Converter StationEquipmentAlgae Coverage (%)
UpperMiddleBottom
CBS220 kV circuit breaker9.712.119.3
BQS110 kV circuit breaker13.315.616.7
DYSAC Filter Field 500 kV pillars10.215.417.8
JFS220 kV circuit breaker32.744.942.2
JNS110 kV knife switch insulator42.347.853.1
XYS35 kV knife switch insulator22.933.734.3
ZTSSmoothing reactor12.115.624.3
Table 4. The contamination test and algae attachment on the DYS converter station in 2018.
NumberEquipmentPositionESDD
(mg/cm2)
NSDD
(mg/cm2)
Algae Coverage (%)
1500 kV#1 substation transformer high voltage side arrester B phaseUpper0.0070.03516.2
Lower0.0030.02113.5
2#61M busbar high voltage arrester F1 A phaseUpper0.0060.03821.6
Lower0.0030.02219.7
3#63M busbar high voltage arrester F1 A phaseUpper0.0080.03825.1
Lower0.0040.01918.4
4DC field flattening opposite pillar InsulatorUpper0.0240.0650
Lower0.0150.0510
Table 5. The algae shed parameters of the pillar insulators (mm).
Shed ShapesShed Diameter
D/D1/D2
Shed Spacing
S/S1/S2
Shed Overhang
P1/P2
Creepage DistanceAmountDry Arc DistanceTotal Creepage Distance
Large and small197/165/8973/31/4250/452106L
5S
4201225
Where D, D1, D2 are the disk diameter and strut diameter of large and small umbrellas, respectively; S, S1, and S2 are the umbrella spacings between adjacent large umbrellas, between the large umbrella and small umbrella below, and between the small umbrella and large umbrella below; P1 and P2 are the shed overhangs between the large and small umbrellas, respectively.
Table 6. The results of the contamination level measurements.
Test LocationESDD (mg/cm2)Algae Coverage (%)
Group1, large shed, upper0.12285.5
Group1, large shed, lower0.09516.1
Group1, small shed, upper0.41491.2
Group1, small shed, lower0.11017.4
Group3, large shed, upper0.15183.9
Group3, large shed, lower0.07216.3
Group3, small shed, upper0.22187.2
Group3, small shed, lower0.10616.1
Group5, large shed, upper0.13617.8
Group5, large shed, lower0.06813.2
Group5, small shed, upper0.15413.7
Group5, small shed, lower0.07816.7
AVG0.141/
Table 7. The concentrations of anions in the contamination solution (mg/L).
Test locationUpper Surface of XYS Substation Pillar Insulator Small ShedUpper Surface of XYS Substation Pillar Insulator Large ShedUpper Surface of CBS Substation Arrester Large Shed
Fe3+1.4753.8280.689
Na+11.4638.0785.318
Zn2+0.7250.4610.477
Cu2+//0.035
Mn2+0.7610.6780.411
K+12.67810.1835.993
Mg2+3.4503.32.9408
Ca2+108.041103.159169.89
Table 8. The concentrations of cations in contamination solution (mg/L).
Test LocationUpper Surface of XYS Substation Pillar Insulator Small ShedUpper Surface of XYS Substation Pillar Insulator Large ShedUpper Surface of CBS Substation Arrester Large Shed
Cl15.62512.03119.2
NO3<3.125<1.5631.38
SO42−219.375145.469147
PO43−<15.625<7.813
Table 9. The types of algae in different regions.
RegionsAlgae Species
SCPBZApatococcus lobatus
YAApatococcus lobatus
DYApatococcus lobatus
YNPZTChloroidium sp.
Heterochlorella luteoviridis
Table 10. The results of the surface conductivity and resistance tests.
Sample NumberLiquid Conductivity (μS)Surface Resistance (MΩ)
117148.52
21750835
31209888
Table 11. The hydrophobicity test results of the RTV coating of the converter station.
Converter StationEquipmentAreas Covered by Algae Contamination LayerAreas Not Covered by Algae Contamination Layer
FLSP1-WN-Q1HC5HC3
WN-Q3HC5HC2
WN-Q1-Q11HC5HC3
DYSWA-W3-T1-AHC6HC4
WA-Z1-W12-T1-CHC4HC3
YBSP2-WP-Q21-BHC5HC3
P1-WN-L1HC4HC2
P1-WN-L2HC4HC3
P2-WN-L2HC4HC2
Publisher’s Note: MDPI stays neutral with regard to jurisdictional claims in published maps and institutional affiliations.

