Article

Neural Network-Based Demand-Side Management in a Stand-Alone Solar PV-Battery Microgrid Using Load-Shifting and Peak-Clipping

by
Godiana Hagile Philipo
1,2,*,
Josephine Nakato Kakande
1,3 and
Stefan Krauter
1
1
Electrical Energy Technology—Sustainable Energy Concepts, Faculty of Computer Science, Electrical Engineering and Mathematics, Paderborn University, Pohlweg 55, D-33098 Paderborn, Germany
2
Department of Material, Energy, Water and Environmental Sciences, The Nelson Mandela African Institution of Science and Technology, Arusha P.O. Box 447, Tanzania
3
Department of Electrical and Computer Engineering, CEDAT, Makerere University, Kampala P.O. Box 7062, Uganda
*
Author to whom correspondence should be addressed.
Energies 2022, 15(14), 5215; https://doi.org/10.3390/en15145215
Submission received: 25 May 2022 / Revised: 25 June 2022 / Accepted: 13 July 2022 / Published: 19 July 2022
(This article belongs to the Special Issue Sustainable Energy Concepts for Energy Transition)

Abstract

:
Due to failures or even the absence of an electricity grid, microgrid systems are becoming popular solutions for electrifying African rural communities. However, they are heavily stressed and complex to control due to their intermittency and demand growth. Demand side management (DSM) serves as an option to increase the level of flexibility on the demand side by scheduling users’ consumption patterns profiles in response to supply. This paper proposes a demand-side management strategy based on load shifting and peak clipping. The proposed approach was modelled in a MATLAB/Simulink R2021a environment and was optimized using the artificial neural network (ANN) algorithm. Simulations were carried out to test the model’s efficacy in a stand-alone PV-battery microgrid in East Africa. The proposed algorithm reduces the peak demand, smoothing the load profile to the desired level, and improves the system’s peak to average ratio (PAR). The presence of deferrable loads has been considered to bring more flexible demand-side management. Results promise decreases in peak demand and peak to average ratio of about 31.2% and 7.5% through peak clipping. In addition, load shifting promises more flexibility to customers.

1. Introduction

Undoubtedly, the availability, acceptability, efficiency and affordability of energy are fundamental to advanced civilization and better quality of life [1,2]. Energy access is essential in achieving healthy and productive households with a growing modern economy [3]. Several reports advocate that the use of electricity by rural communities in developing countries could be advantageous to its inhabitants, especially for services related to water [4], agriculture, health, education and commerce [5,6]. Poor access to electricity in rural areas has been linked to community development gaps, leading to rural to urban migration and putting further stress on already strained urban infrastructure systems [7,8,9]. However, in Sub-Saharan African countries, only about two-fifths of the population has access to electricity, the lowest proportion in the world [3,10]. In East Africa, the situation is still critical, since about 80% of the population has no or unreliable access to electricity, the majority being people in rural areas [11,12]. Rural area electrification in developing countries poses challenges in constructing power generation and transmission networks [6]. Several studies have depicted that, despite the political efforts to improve grid transmission and power generation, emphasis is more on the urban and industrial loads due to their higher demand [13] and political relevance.
Different solutions to bring electricity to rural areas include national grid extension, stand-alone systems and microgrids [14]. Microgrids, small electricity networks, are popular solutions due to their ability to operate autonomously. They play a crucial role in developing an electricity infrastructure built around renewable energy technologies that are available locally at considerably reduced costs. Furthermore, microgrids can speed up electricity access to areas where grid extension is impossible within a short to medium period. Microgrids have several advantages, such as their ability to create a decentralized system of aggregated loads, and even in the scenario of interconnection, the option of operating in an isolated mode [15]. However, microgrids face several setbacks regarding stability and reliability due to their intermittent nature, the non-uniform distribution of renewable energy resources and the stochastic behavior of energy needed to power loads [10]. During periods of low renewable energy production, where the energy generated is insufficient to cater to the increased demand, energy storage and/or load shedding are adopted to address energy deficits [16,17]. Load shedding is when utilities intervene on the supply side to reduce power consumption, whereby customers are disconnected for a particular time [10,18]. Customers usually dislike this experience, as it is a source of several losses and discomforts [18]. Other alternatives to cater for higher consumption are the use of large storage devices, which are very expensive, and expansion of generation capacity, which takes years in developing countries, particularly on the African continent [19,20,21]. Demand-side management (DSM) is the best approach for supply–demand matching by which customer demand can be shaped to improve utilization factors and load balance [22]. In addition, DSM programs may defer capital investment in generation, transmission and distribution networks and storage, and improve system load [23,24,25].
DSM can be implemented in several ways, and Figure 1 shows several categorizations of DSM with associated load shapes. Peak clipping aims at reducing demand during peak hours. Utilities achieve this control by incentivizing customers not to consume power during peak hours, directly controlling loads or setting up higher prices. The method is helpful in cases with no possibility of setting up or installing new power plants [23]. Valley filling focuses on raising usage during periods of very low electricity profile to keep demand and supply balanced, avoiding the startup and ramp-up costs of generators [26]. Load growth is more common when using electric vehicles, where customers are encouraged to increase usage up to a certain threshold for grid stability [27]. Load shifting gives consumers options to shift their usage pattern to off-peak hours based on cheap tariffs. It is the combination of load clipping and valley filling [10,12]. Flexible load shaping is when consumers are flexible enough to shift their loads to different low usage slots. Usually, customers willing to participate in this are identified and incentivized for their participation [26,28]. Energy efficiency is when the overall load profile is lowered thought the day by using more energy-efficient devices or through cyclic operation [29].

2. Related Works

Several studies have been dedicated to demand-side management and load scheduling over the years: The authors of [30] proposed an energy management framework for appliances scheduling during peak and off-peak hours due to cost variations. Customers could meet their daily energy requirements and save electricity costs, although the resulting system was found complex. A strategy to decrease electricity costs through power usage scheduling for both deferrable and non-deferrable loads was proposed, which led to the creation of additional peaks during a period of low price of electricity [31]. The same also happened when consumer load-scheduling targeting optimal demand management caused more peaks in an incentive system [32]. In [33], control of domestic refrigerators was performed to reduce peak demand and improve the voltage profile. The method was successful without interfering with the quality of service. A real-time pricing mechanism was achieved using bidirectional communication between customer and utility. Appliance scheduling during peak and off-peak hours was possible through an intelligent system without risking customer comfort [34]. An energy management model to minimize peak energy consumption and electricity cost was proposed and implemented using the combination of modified, enhanced differential evolution (mEDE) and the grey wolf optimization (GWO) algorithms [35]. Using the binary particle swarm optimization (BPSO) algorithm, a DSM strategy was simulated in a MATLAB/Simulink environment to alleviate power shortages in the Nigerian grid. The simulation results showed a reduction in the network blackout areas per scheduled outage from 36.62% in the existing network to 14.08% in the proposed network. Additionally, the load curve was maintained nearer to the desired one [36].
By MATLAB/Simulink, demand-side management for household appliances is investigated by dividing loads according to their priority. Depending on the power generated from sources, loads are able to switch themselves off/on. Results proved the economic benefit of a real-time system versus a flat rate system, and improvement in electricity bills was achieved [37]. A demand-side management (DSM) mode was simulated in a MATLAB/Simulink environment to visualize the load profile before and after DSM for a household in Bangladesh. By implementing three different DSM approaches, as shown in Table 1, a better load profile was achieved, along with total power consumption and total unit (kWh) consumption. This study is expected to be a tool to spread the benefits of DSM and hence change electricity usage behavior among Bangladesh customers [38].
Based on previous studies, most of the demand-side management strategies are implemented in developed countries by combining the use of grid-connected microgrids [39,40,41], more than one renewable energy source [42,43], electric vehicles [25] and different advanced and costly storage techniques to assist load scheduling and peak reduction. Therefore, the authors have concluded that DSM has not been fully utilized in East Africa, and the concept of using flexible loads is not emphasized. Additionally, there is limited research on stand-alone systems fully supplied by RES, a standard solution for microgrids in East Africa. This study contributes with the less complex way of reducing storage cost and depletion through load shaping to enhance load curve adaptation towards the availability of solar power. In East Africa, the current regulations do not support grid integration of microgrids and other renewable energy technologies that can enhance grid stability. Additionally, East African communities face a scarcity of energy capital, making generation capacity far below optimal and undersized generation capacity common. This study is ideal for such microgrids.
In this work, we used two DSM methods in a model solar PV-battery microgrid using actual measured data of demand and irradiance to demonstrate the usefulness of efficient use of power that is still lacking in East Africa. A model system was simulated in MATLAB/Simulink with possibilities of deferrable loads that can participate in DSM. The main contributions of this work are listed below.
  • Load shifting and load clipping DSM approaches were adopted for a typical microgrid in East Africa.
  • Substantial power saving can be achieved through generation-demand matching without deep discharge of the battery storage.
  • The overall load profile is improved by widely exploiting the available renewable energy resources, hence reducing total dependence on storage and the national grid, both of which are scarce in Africa.
The subsequent sections of the paper are organized as follows. Section 3 elaborates on the methodology, model development and simulation. Section 4 contains the detailed results and discussion, and Section 5 concludes the paper.

3. Materials and Methods

3.1. Modelling of the Case Study

The case study in this work is a microgrid located in East Africa, which is supplied with solar PV coupled with battery storage. The given microgrid is an isolated microgrid without a grid connection.

3.2. Load Categorization

According to literature, residential loads are classified into the following three categories based on power or time flexibility:
(1)
Shiftable interruptible load,
(2)
Shiftable non-interruptible load,
(3)
Consistent load.
The shiftable interruptible load comprises appliances whose operations can be interrupted and scheduled to operate at any time, for example, personal computers, water pumps, electric iron and microwave ovens. The shiftable non-interruptible loads cannot be interrupted during operation, but they are flexible to be operated at any time. These include appliances such as blenders and washing machines. Consistent loads are appliances that are required to run almost all the time, for instance, fans, refrigerators and water dispensers [44]. Appliances have been further categorized as time-shiftable, power-shiftable and critical appliances by the authors of [35]. Time shiftable appliances are those whose starting time can be shifted to any time slot within a scheduling time horizon, and they can tolerate delay. The appliances are flexible to being shut down, shifted or delayed when necessary, although they operate with a fixed power rating, for example, washing machines and dishwashers. Power-shiftable appliances’ power can be changed between their minimum and maximum values based on environmental status variations during the time horizon. They can decrease or increase power use under some circumstances; as examples, take electric heaters and air conditioners [45]. Critical appliances cannot be interrupted or shut down until their operations are completed. They operate at fixed power ratings and can only be delayed or shifted before starting the process; otherwise, user comfort will be compromised.
Table 2 represents household appliance categories from [44] and the related on/off times as described by the study performed in Bangladesh [38]. The appliances with almost similar characteristics to African ones were used to simulate this case study. A decision on the rating of deferrable loads to be switched on/off or shifted was made. It is noted that the profiles will not be the same, since no two appliances can be of the same ratings and used for the same program all the time [46]. In addition, [47] estimated shiftable demand by subtracting base demand from its peak for the days with similar characteristics. This background gave the basis for evaluating this study’s deferrable load profile, as shown later.
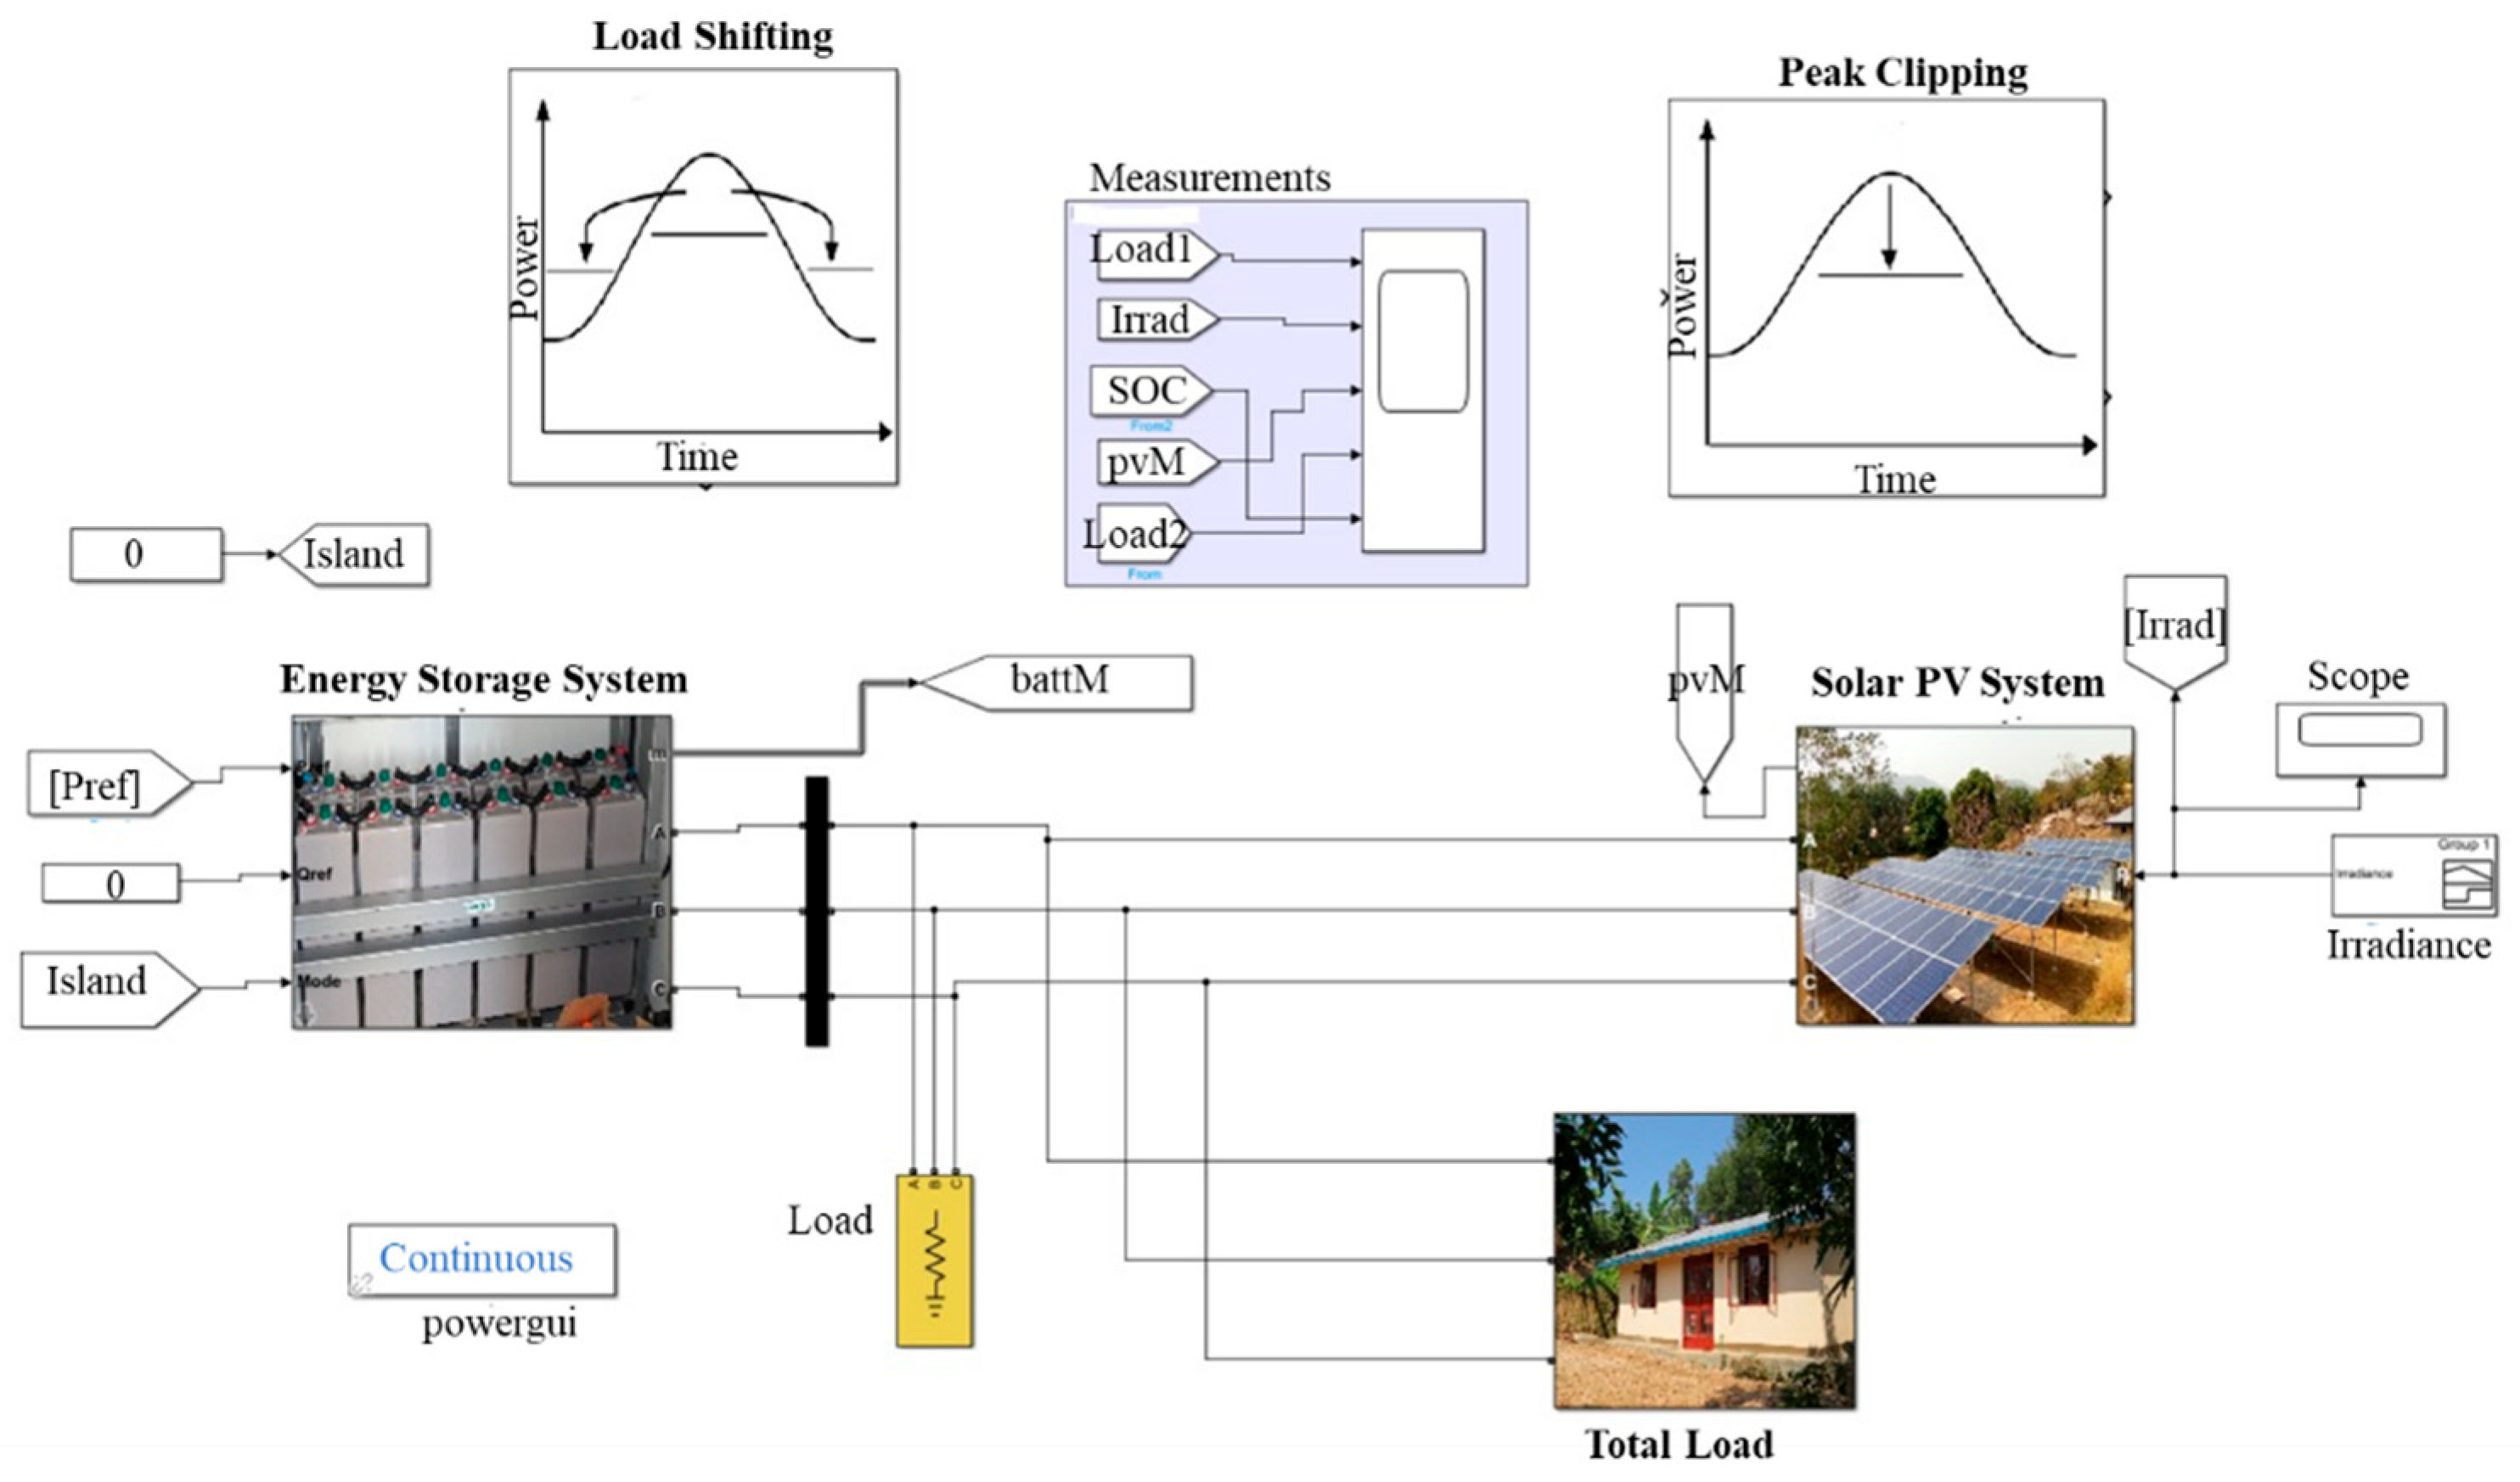
A MATLAB/Simulink-based model has been implemented to simulate the proposed idea. A microgrid model with possible shiftable loads was simulated for 24 h, starting from midnight and running for the next 24 h. Figure 2 shows the block diagram of the model in Simulink, in which a three-phase system was connected to a battery and solar PV with consumer loads. Irradiation measurement and battery state measurement were also connected. Two management subsystems, which represent DSM by load shifting and peak clipping, will be discussed further.
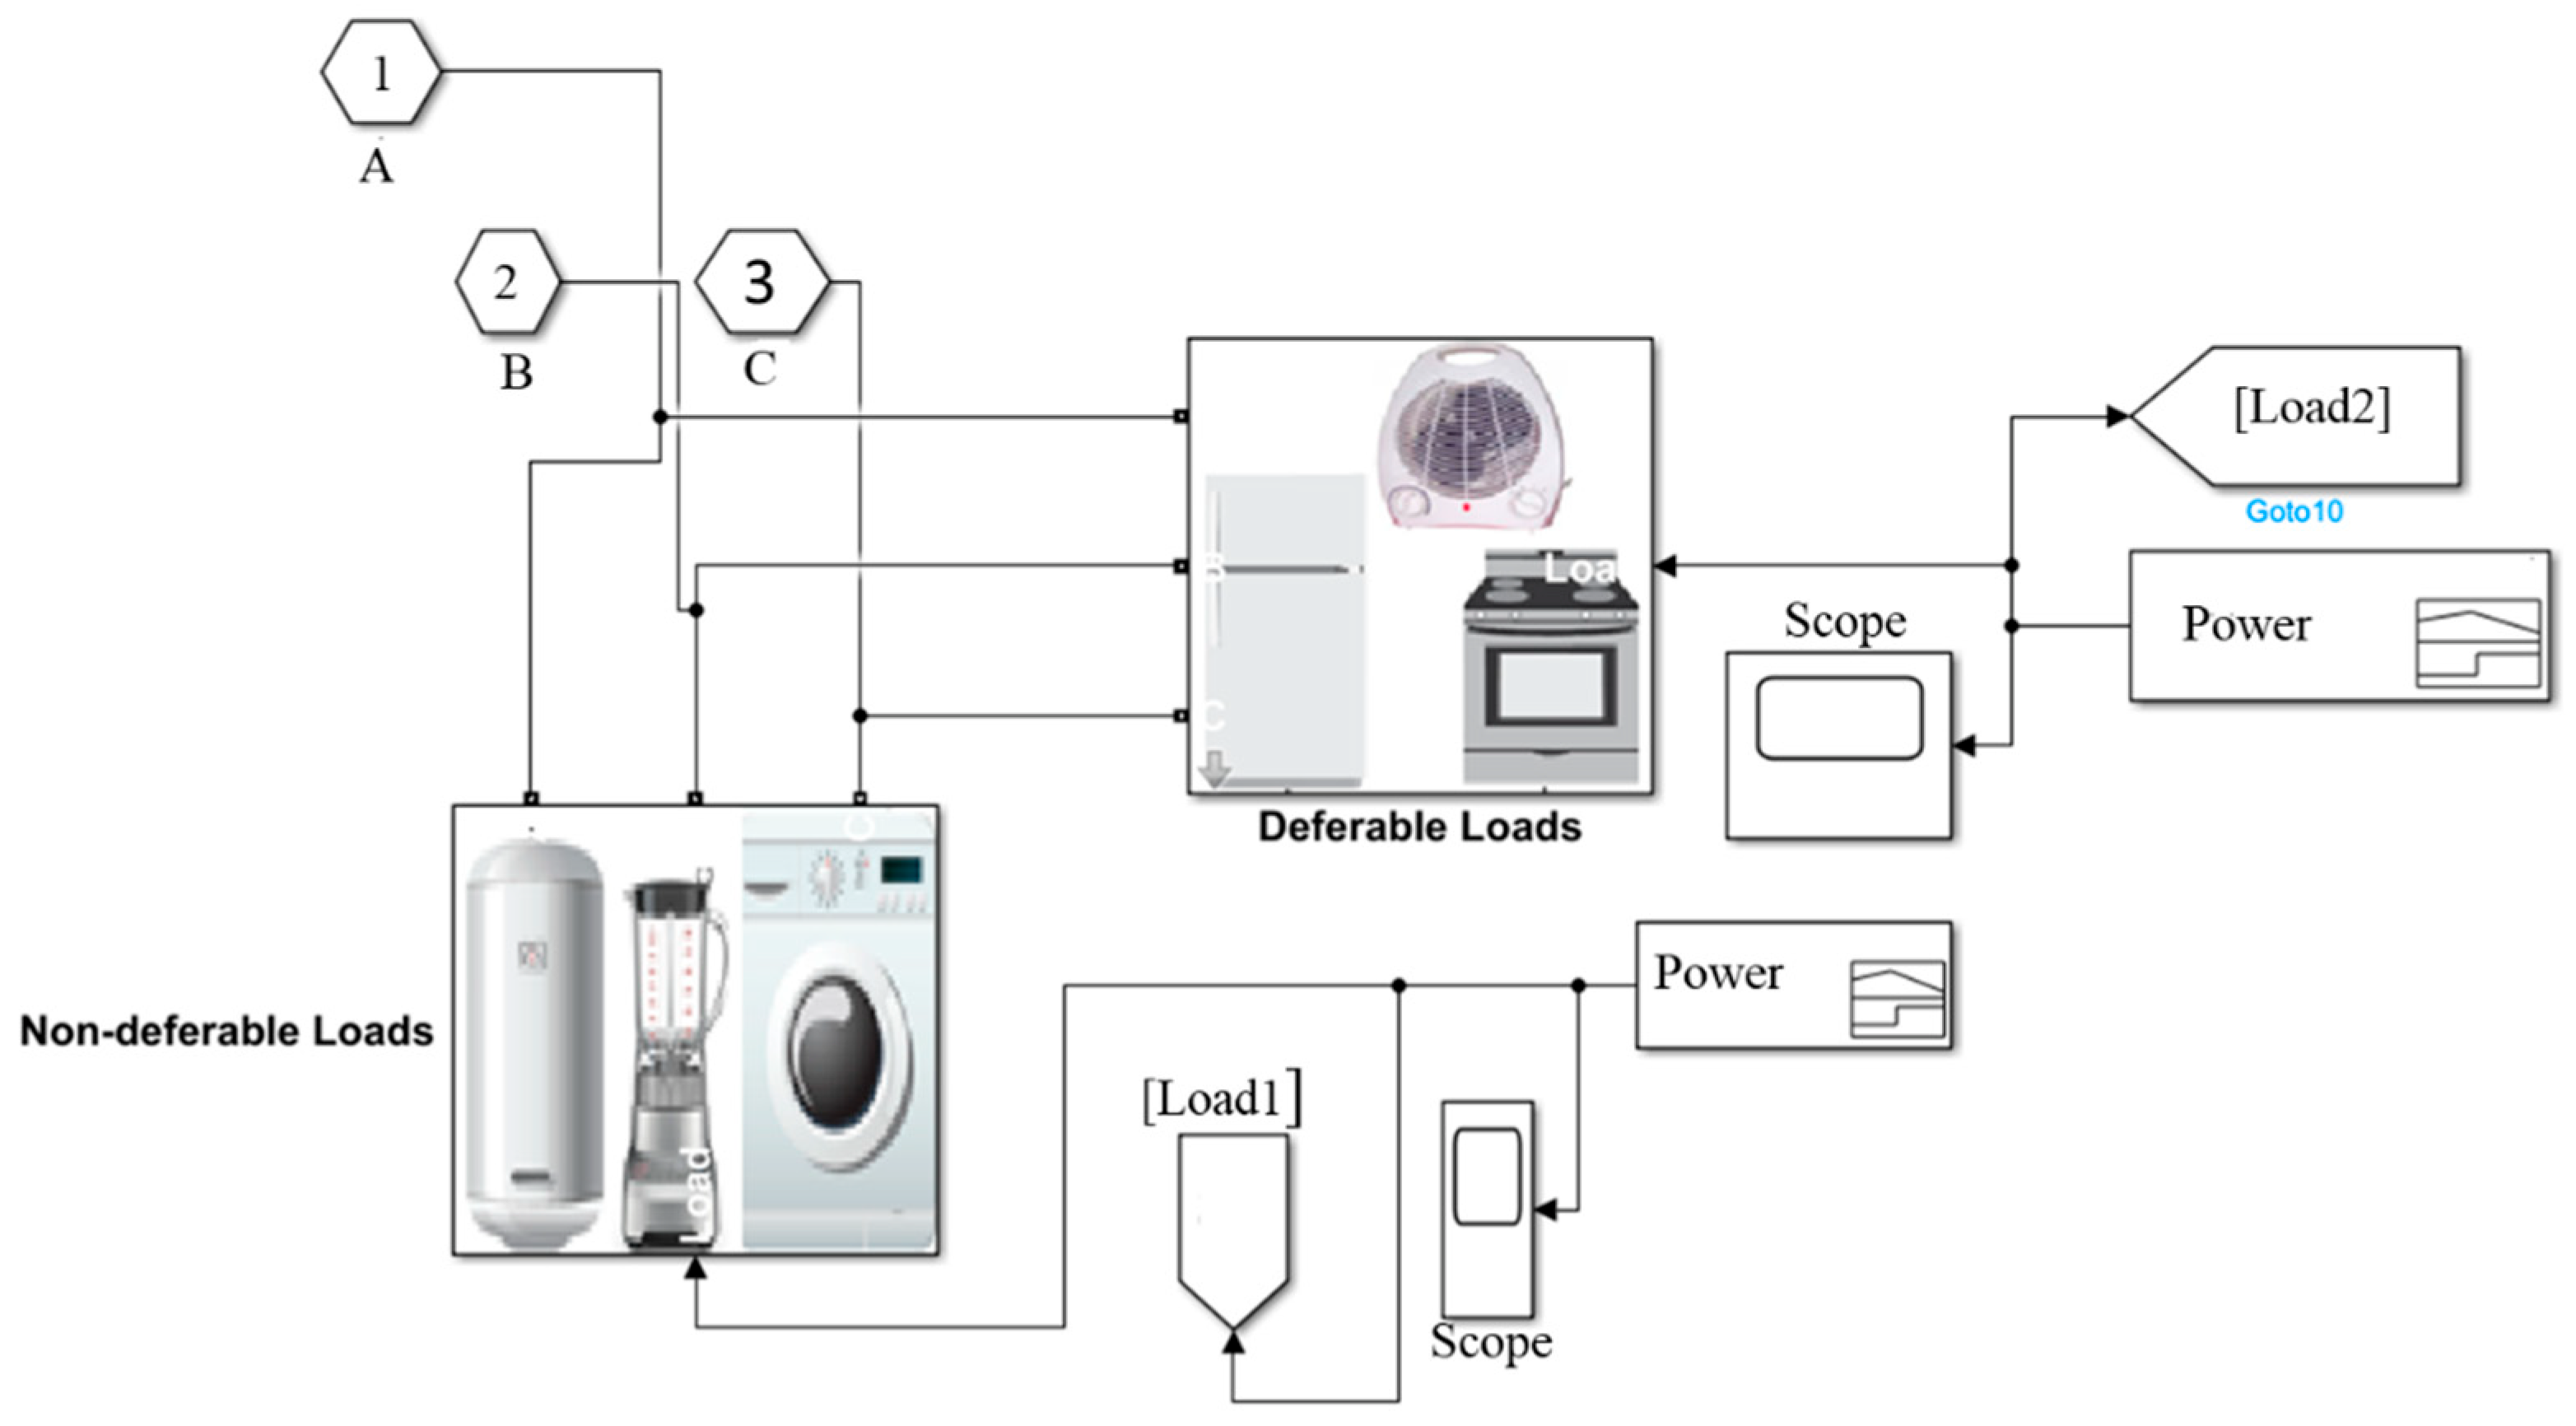
The total load was divided into deferrable and non-deferrable load to enhance switching on/off loads during peak and off-peak hours. Figure 3 represents the simulation of the two categories of load in Simulink.
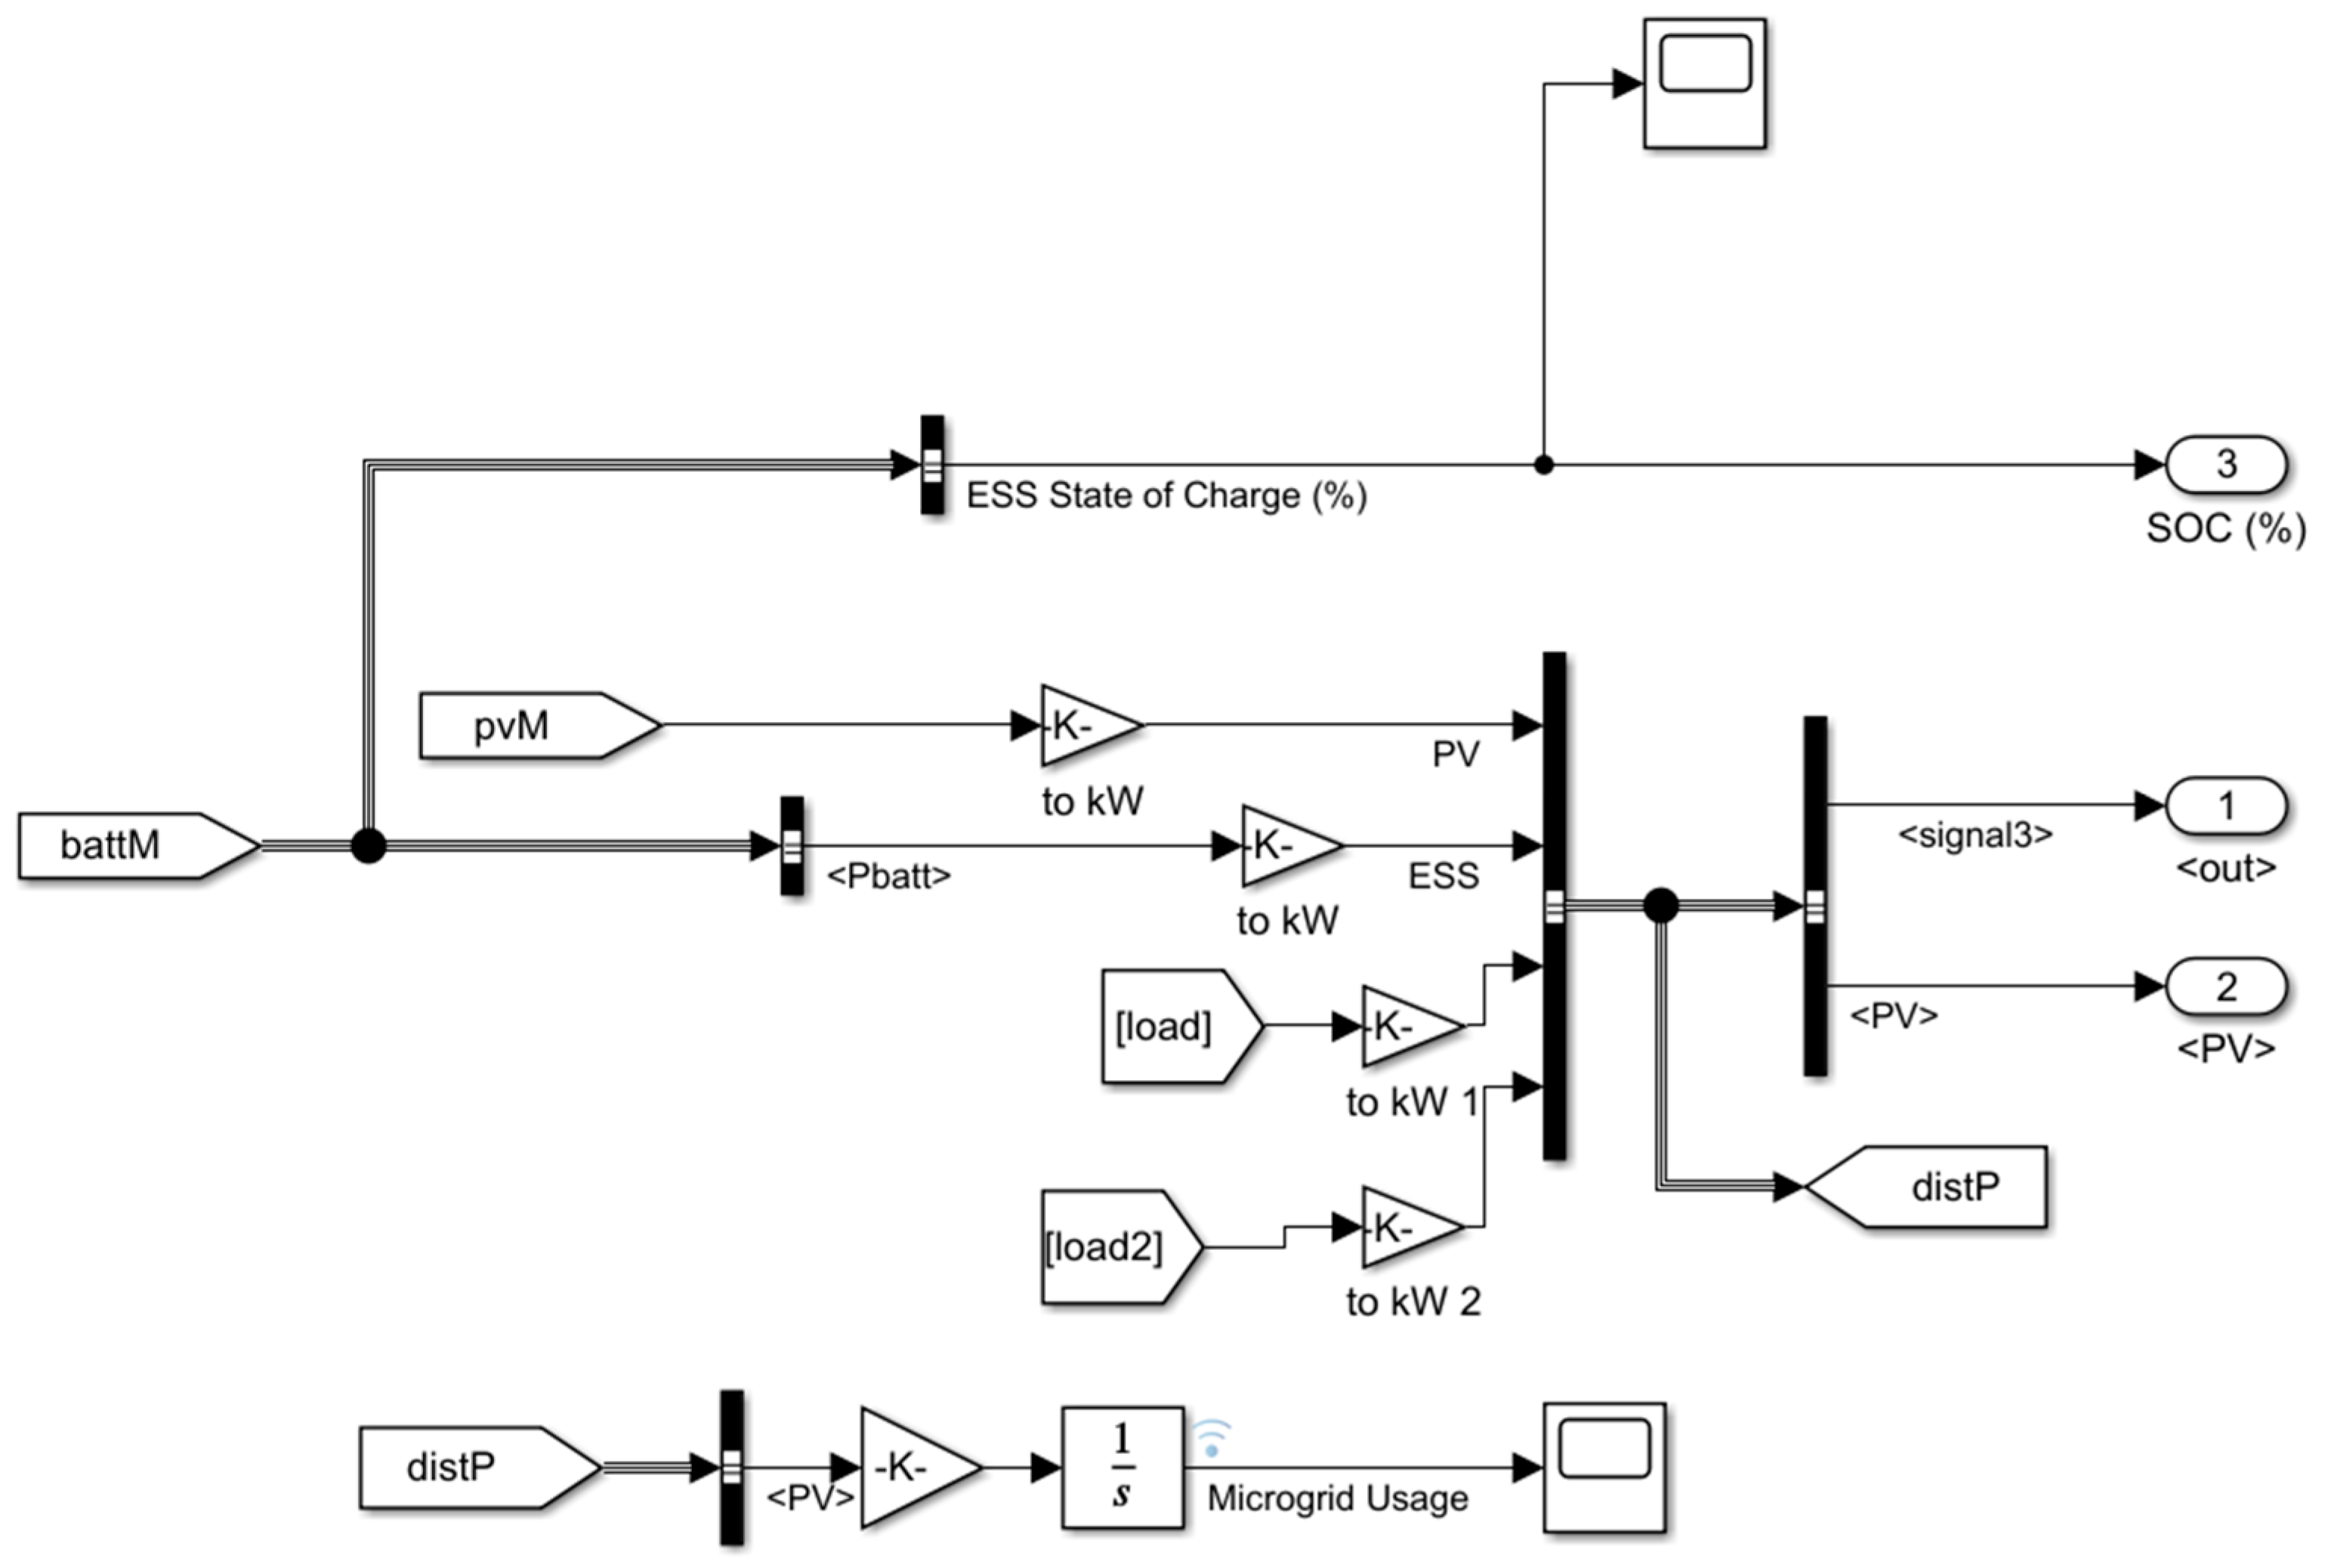
Figure 4 shows the energy inlet and outlet from the microgrid, including the battery’s state of charge (SOC).

3.3. Artificial Neural Network

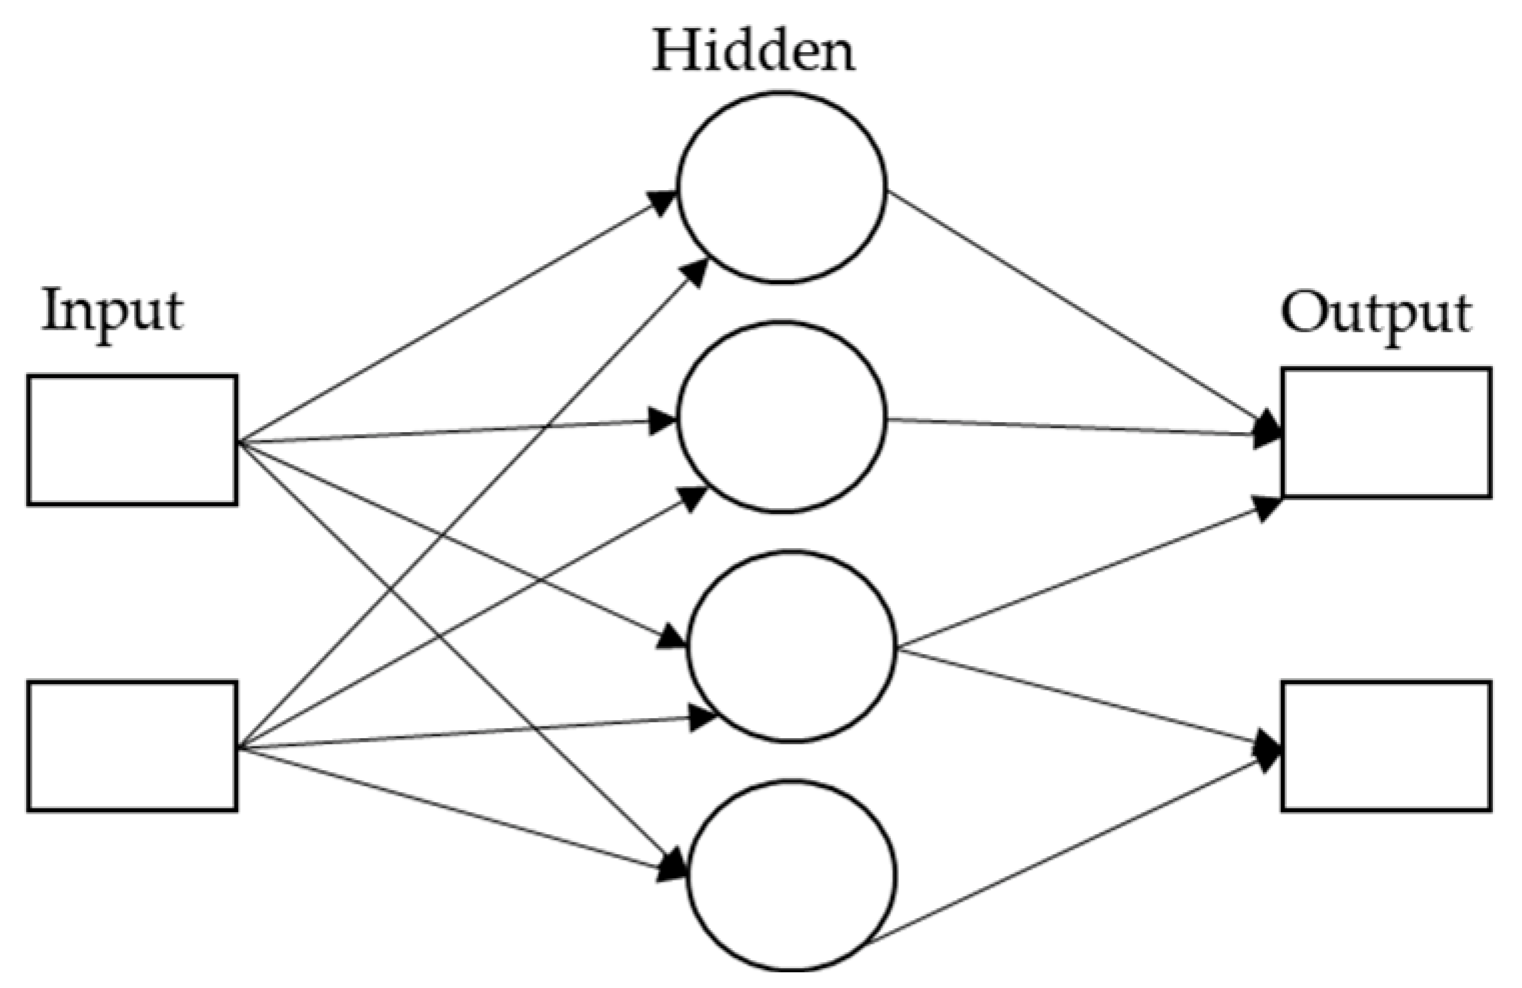
An artificial neural network (ANN) is associated with an information processing system that uses a mathematical model inspired by biological neurons. Based on internal or external information in the network, an ANN can adapt, learn and change its structure to create a precise relationship between variables [50,51]. In the ANN model, nodes called neurons are directly interconnected to form a neural network for distributed parallel processing, as depicted in Figure 5. Mathworks Matlab ANN Toolbox software was used for the simulation. Three layers of feedforward architecture, namely, input, hidden and output layers containing 2, 20 and 1 neuron(s), respectively, were used. The training algorithm that performed better was the Levenberg–Marquardt Algorithm. The algorithm converged to a quadratic error of 10-2 at 40 steps, and regression close to 1 showed a close correlation between outputs and targets, as shown in Figure 6.
The flowchart in Figure 7 represents the algorithm used in the proposed model.
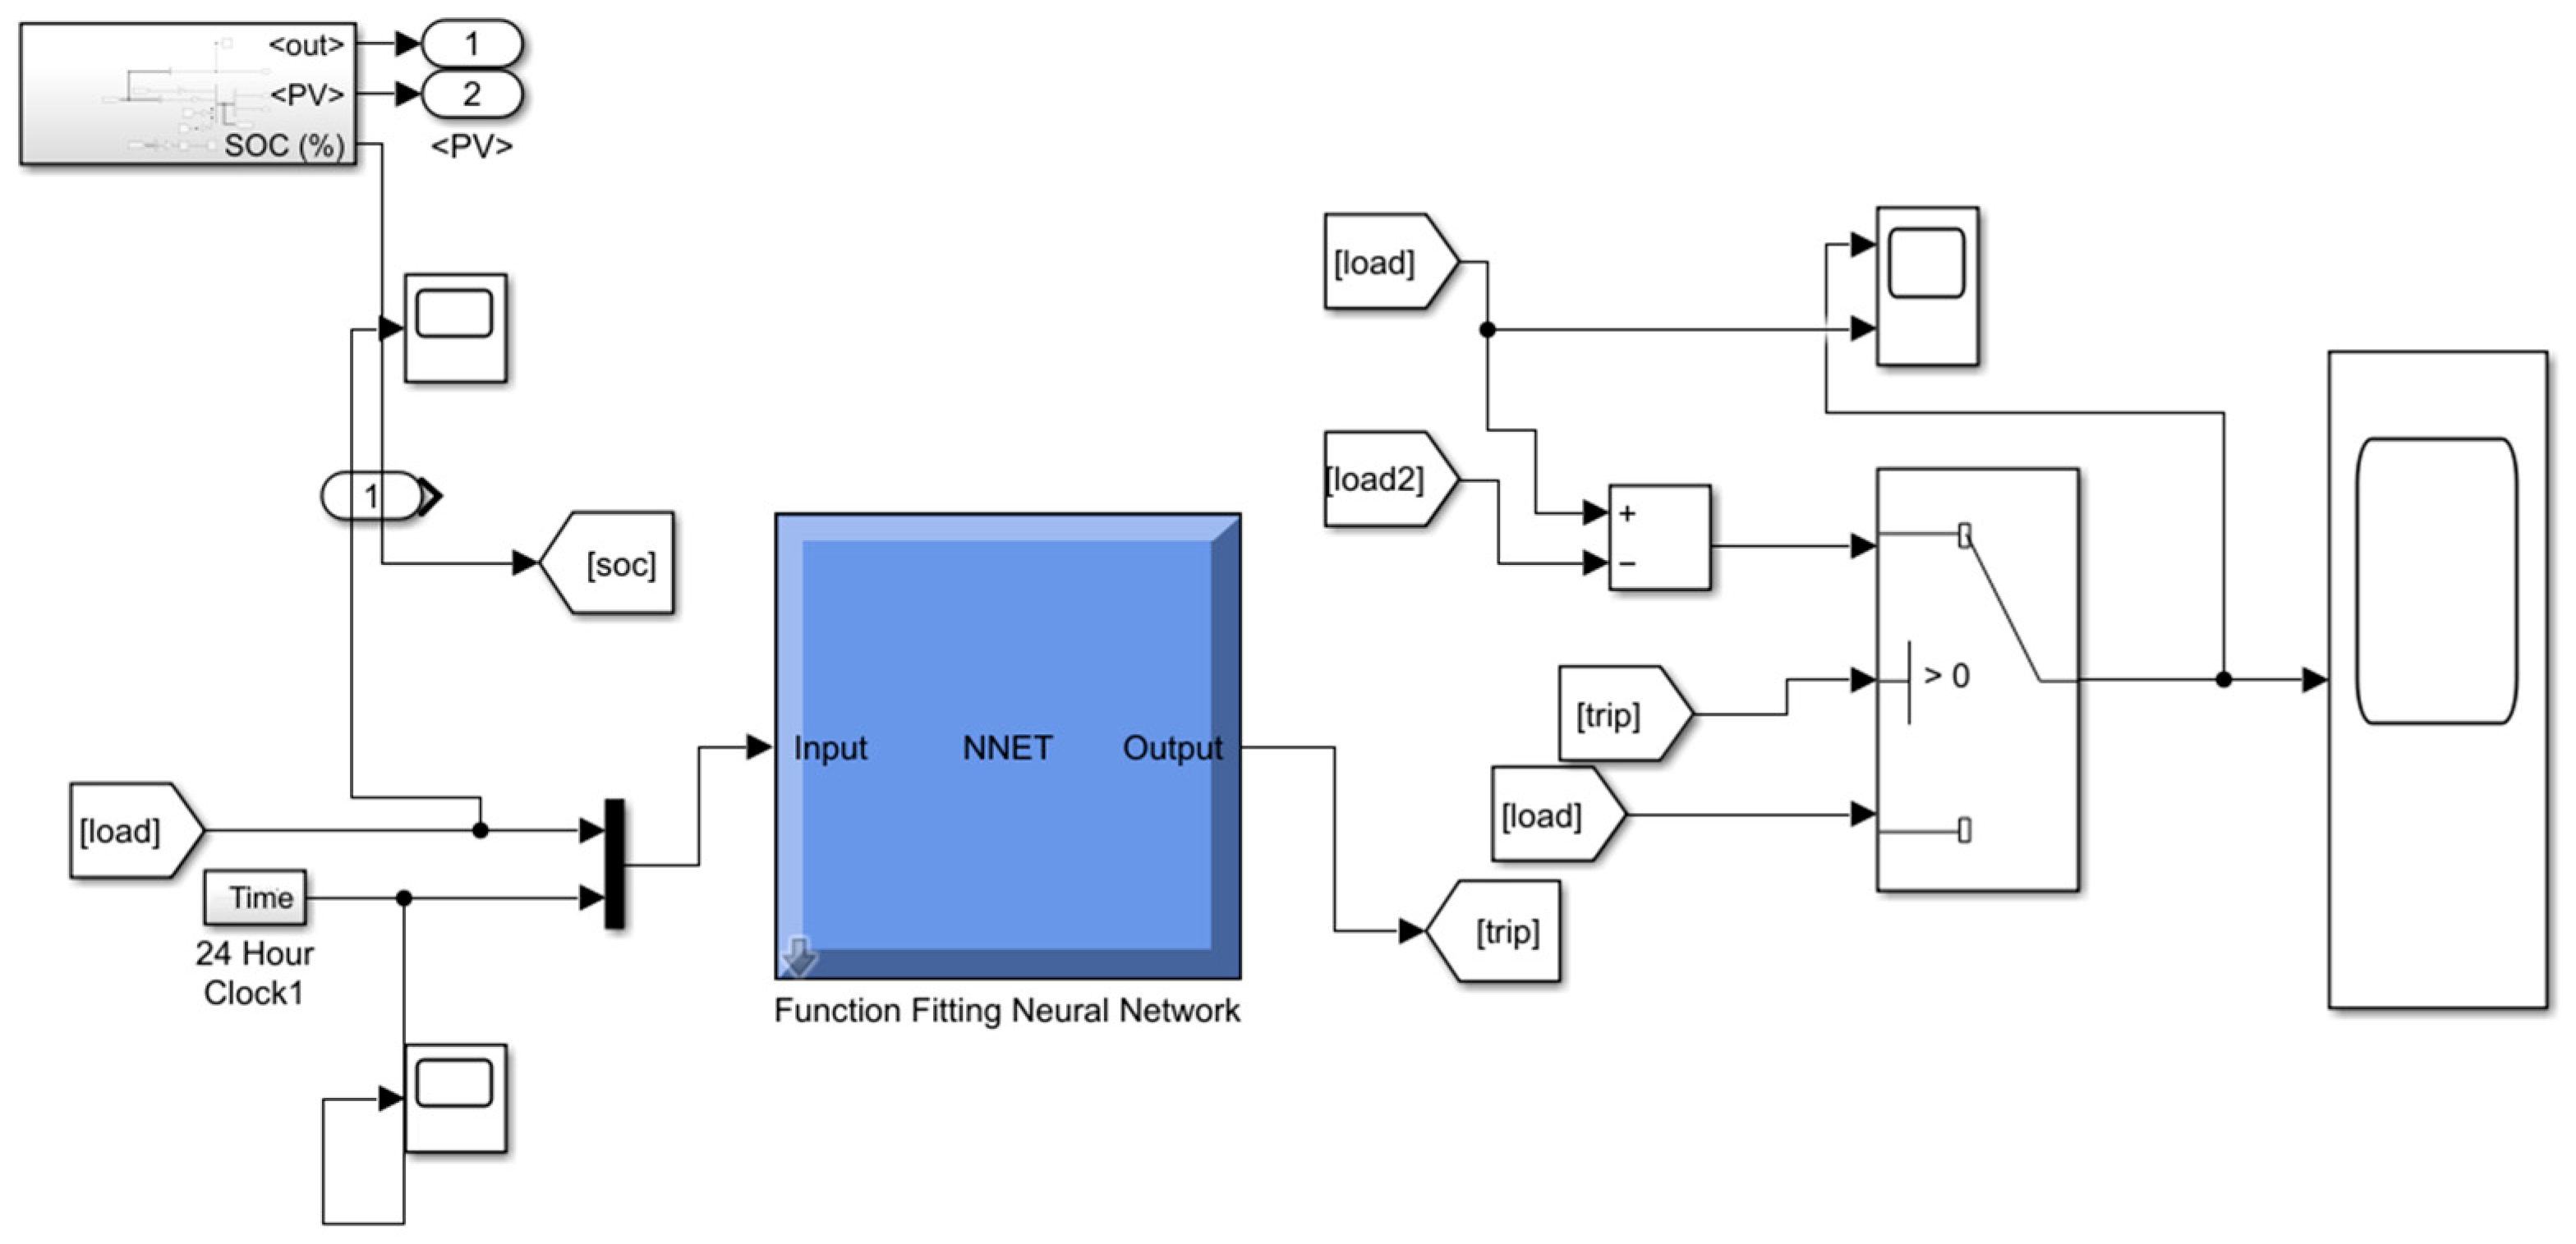
In Figure 8 and Figure 9, the two DSM strategies (load shifting and peak clipping) are further explained. The approaches make use of ANN to achieve the results. The use of switches allows control of the on and off time of the shiftable loads. Unlike Figure 9, Figure 8 uses a multiport switch with an additional input number 3 with an asterisk symbol to achieve load shifting. This input takes care of hours of off-peak electricity, allowing loads to be added. When the control signal detects neither 1 for peak clipping nor 2 for regular operation, it jumps to 3 to enable load addition.
The input data provided to the ANN control scheme were the consumer usage and the time horizon of the day (24 h). Outputs were the interruptible loads switching conditions that decreased or increased loads during peak or off-peak times. The overall horizon was 24 h; based on this; the ANN returned instructions for generated signal pre-defined deferrable loads to either switch off/on or shift to other time of the day depending on the solar power generated. This scenario used the cases of peak clipping and load shifting, as shown in Figure 8 and Figure 9, respectively.

4. Results and Analysis

4.1. Basic Case

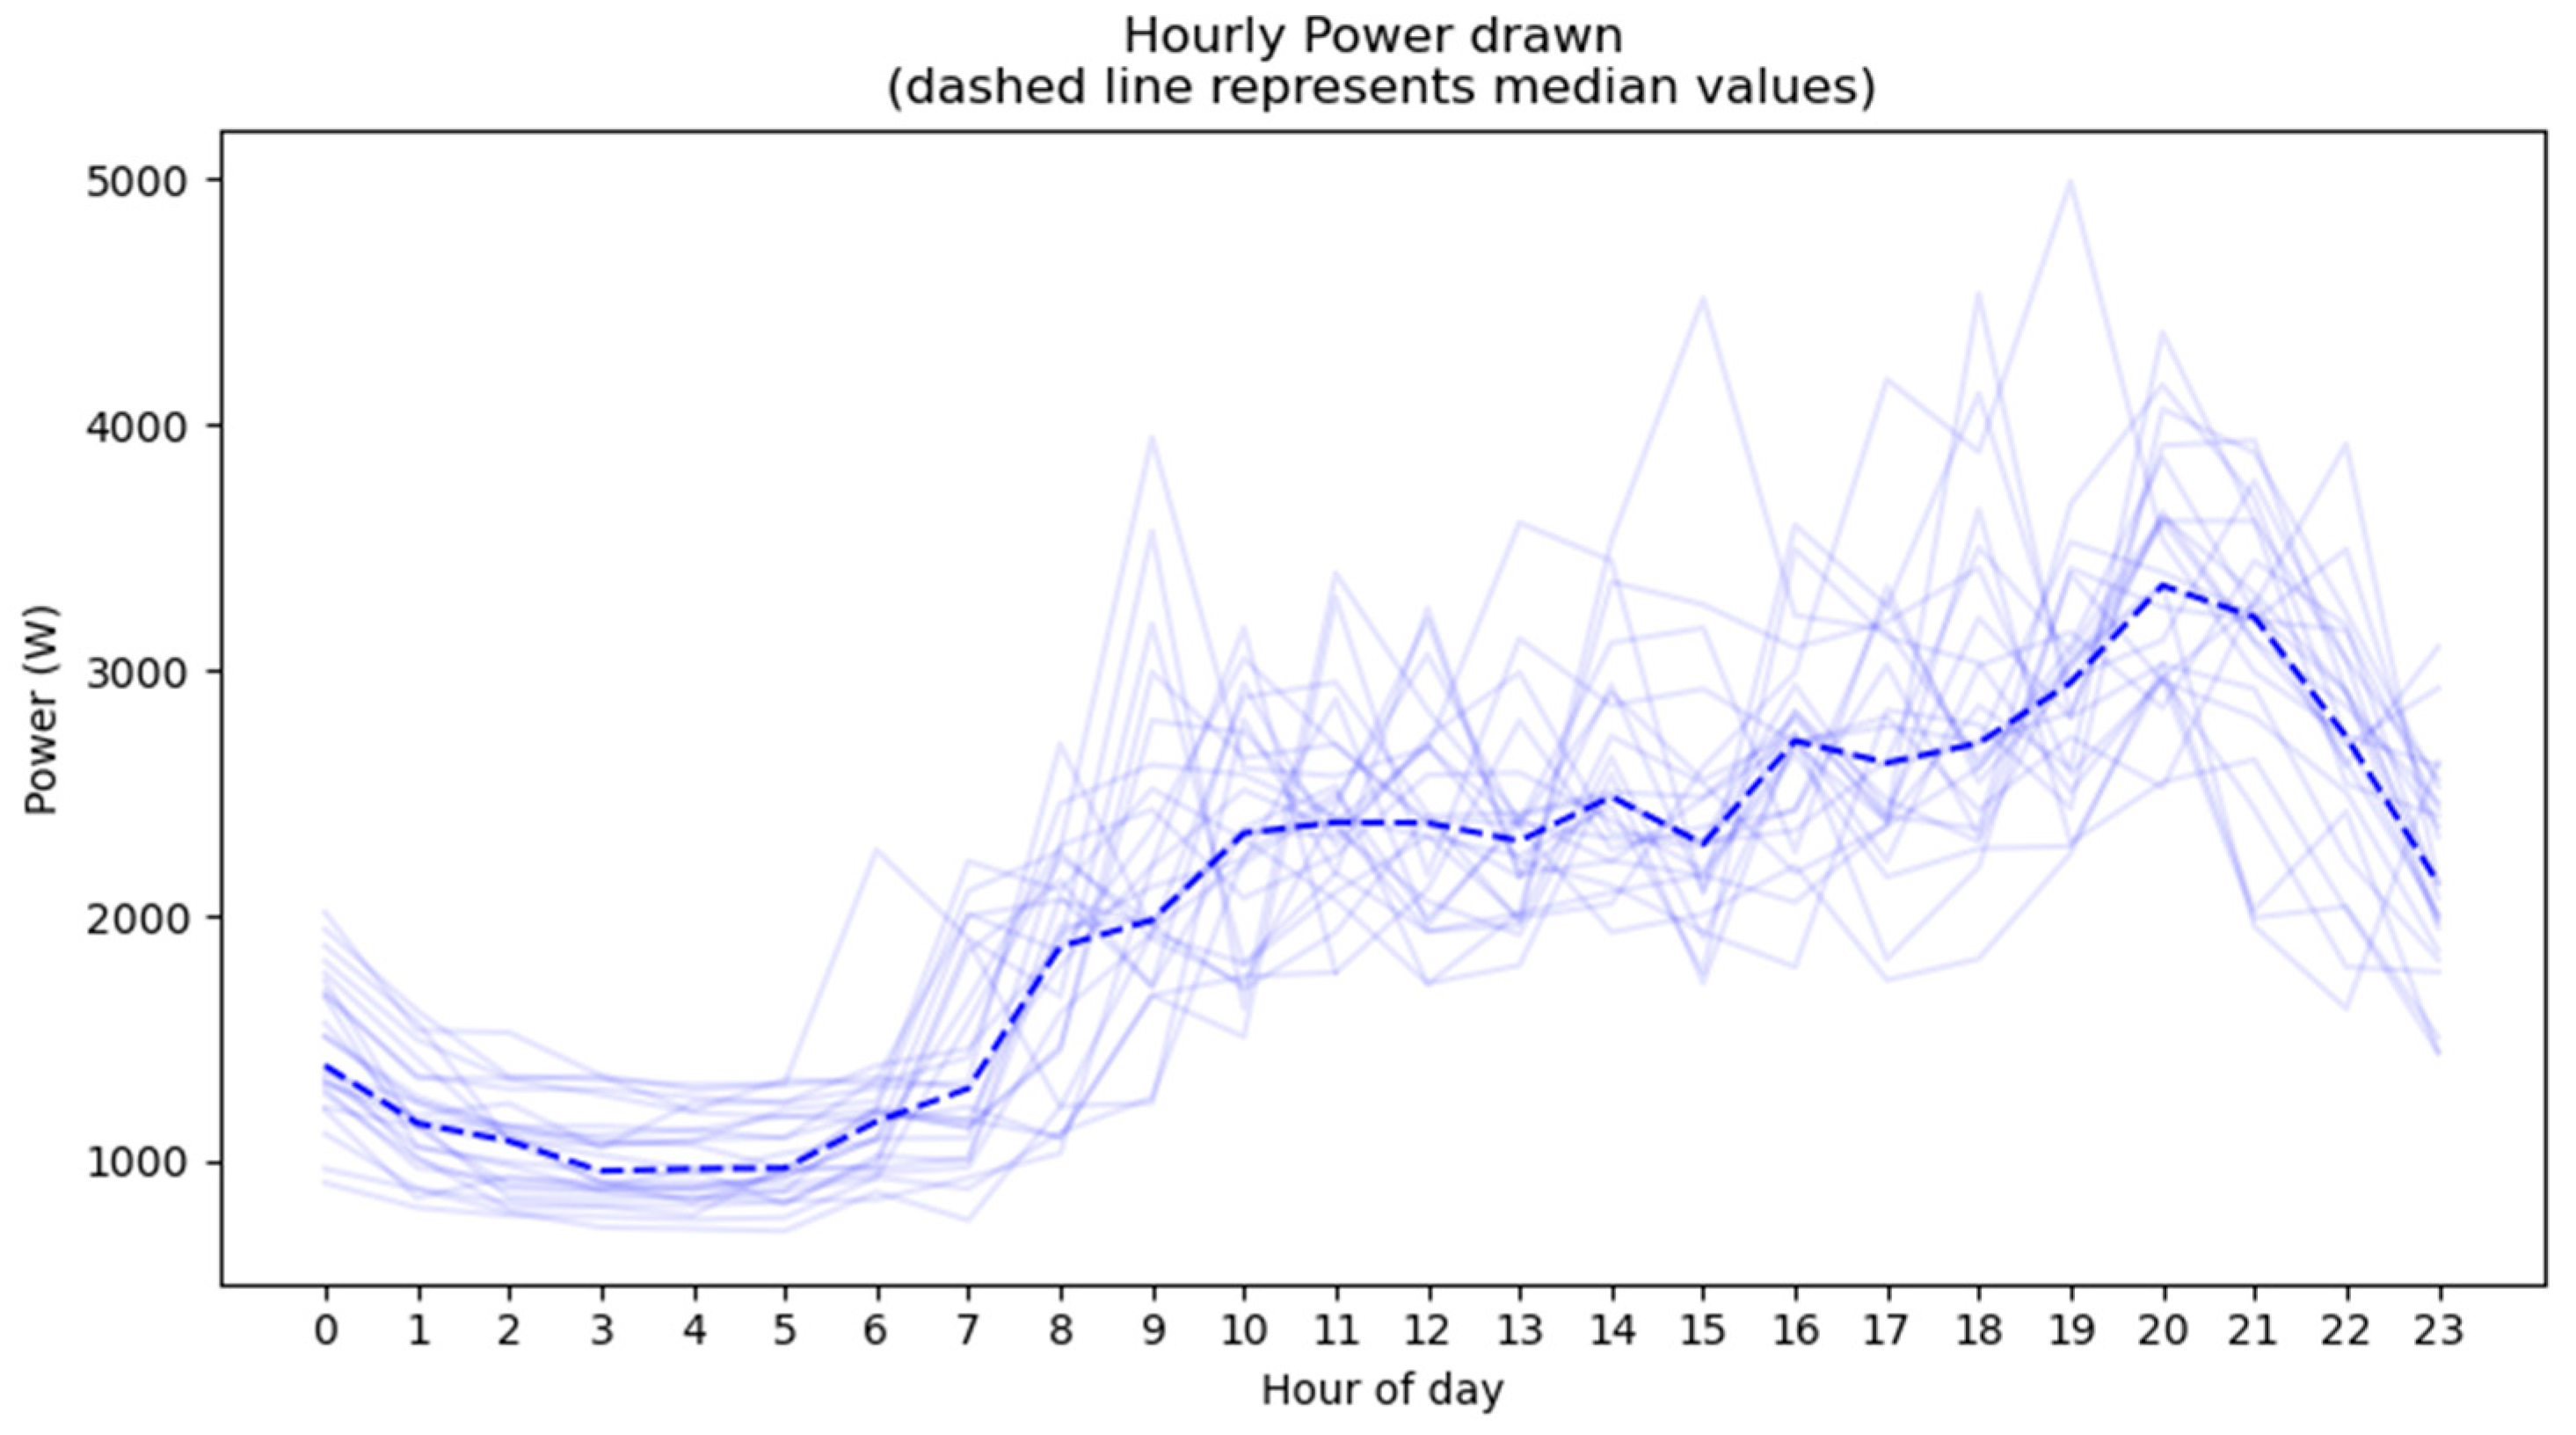
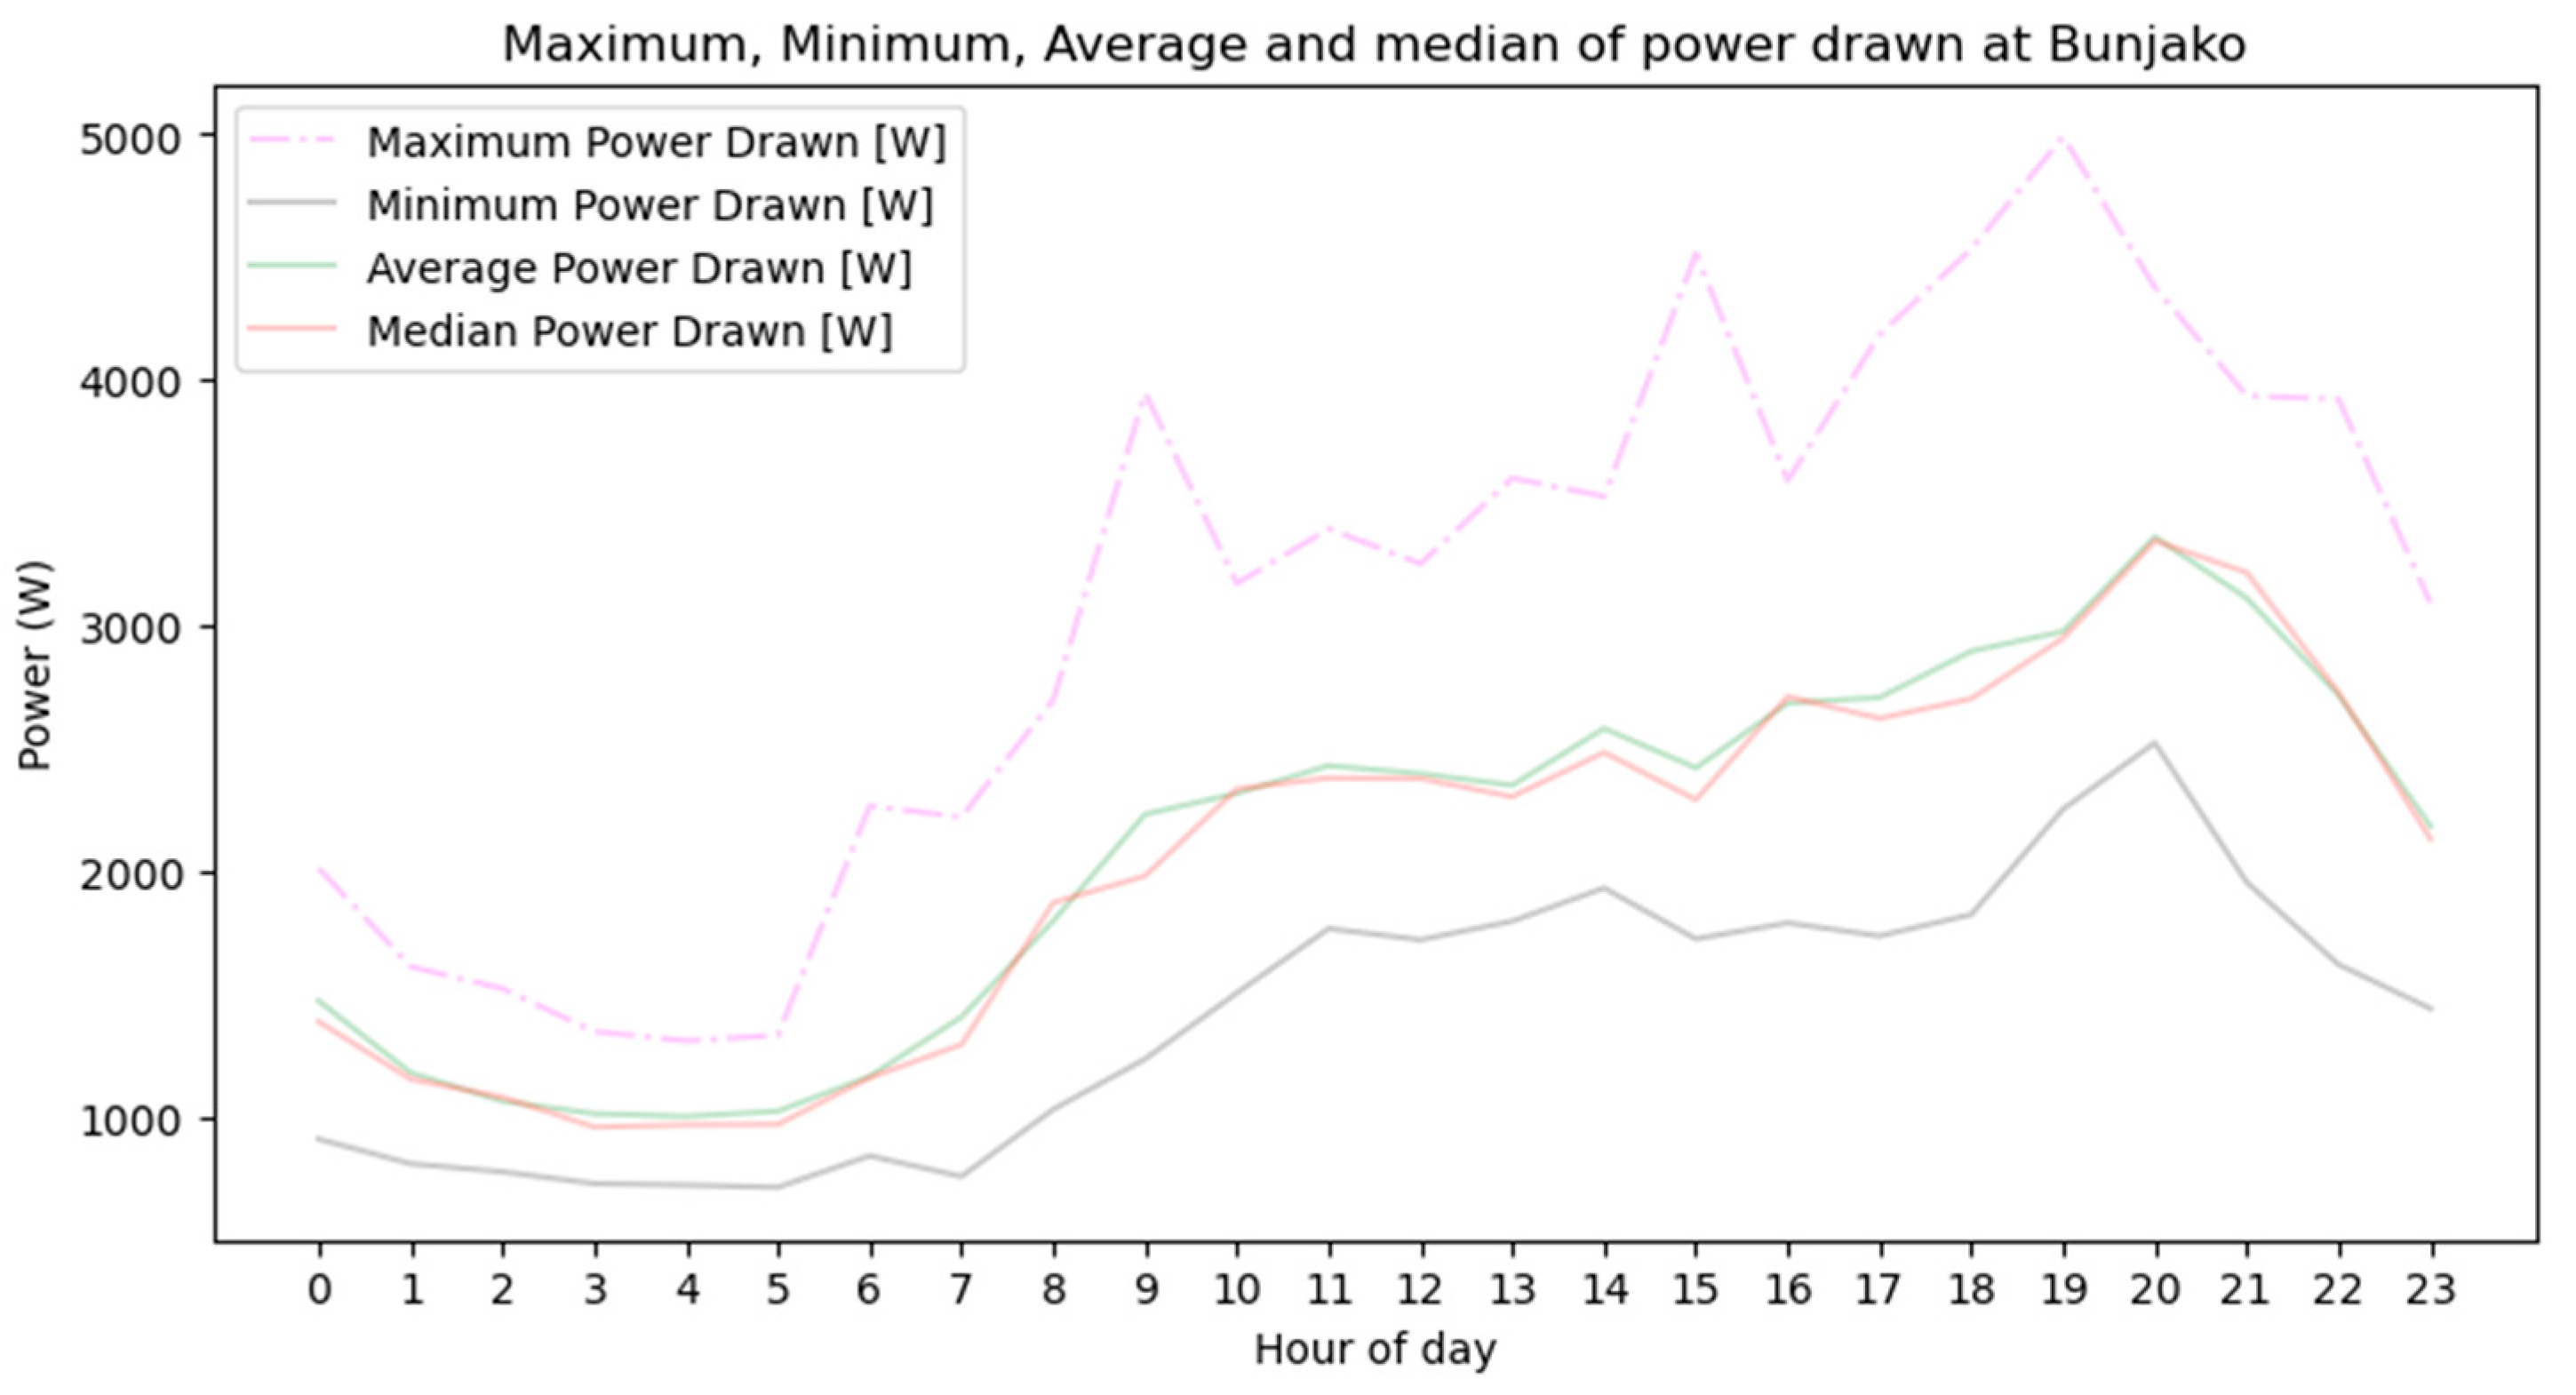
This work employed the dataset from one of two microgrids at Bunjako, an island in Uganda (East Africa). This specific microgrid has a total installed solar capacity of 80 kWp. The two existing isolated microgrids plus another planned mini-grid aim to power four of the eight villages on the island, targeting a combined total of 500 connections. Figure 10 shows the total daily power consumption profiles of the customers connected to one of the mini-grids for a period spanning July 2021 to September 2021, sampled into a daily load profile. Peak demand of about 5 kW was observed between 1800 to 2200 h, implying that most of the customers are back home and have switched on various electric appliances, for example, lights, fans, televisions and so forth. Demand–response strategies and control werew not considered or implemented in this case. Figure 11 shows the median, average, maximum and minimum power consumed from the grid in a 24 h time horizon. The average electricity demand of the data samples ranges from 1000 W to 2000 W, with a total range from a minimum of about 750 W to a maximum of 5000 W. The median and average values are closely related, and all the profiles peak in the evening, a typical load profile for users in the village.
Electricity consumption significantly depends on the day, whether weekend or weekday and the types of activities taking place on that day. It may further depend on several factors, such as whether people stay at home most of the time; the kinds of people present in the households, e.g., students; and the nature of economic activities. The box plot in Figure 12 shows the variation in power consumed for different days of the week. The central line on each box plot represents the median value, and the dots are the outliers.
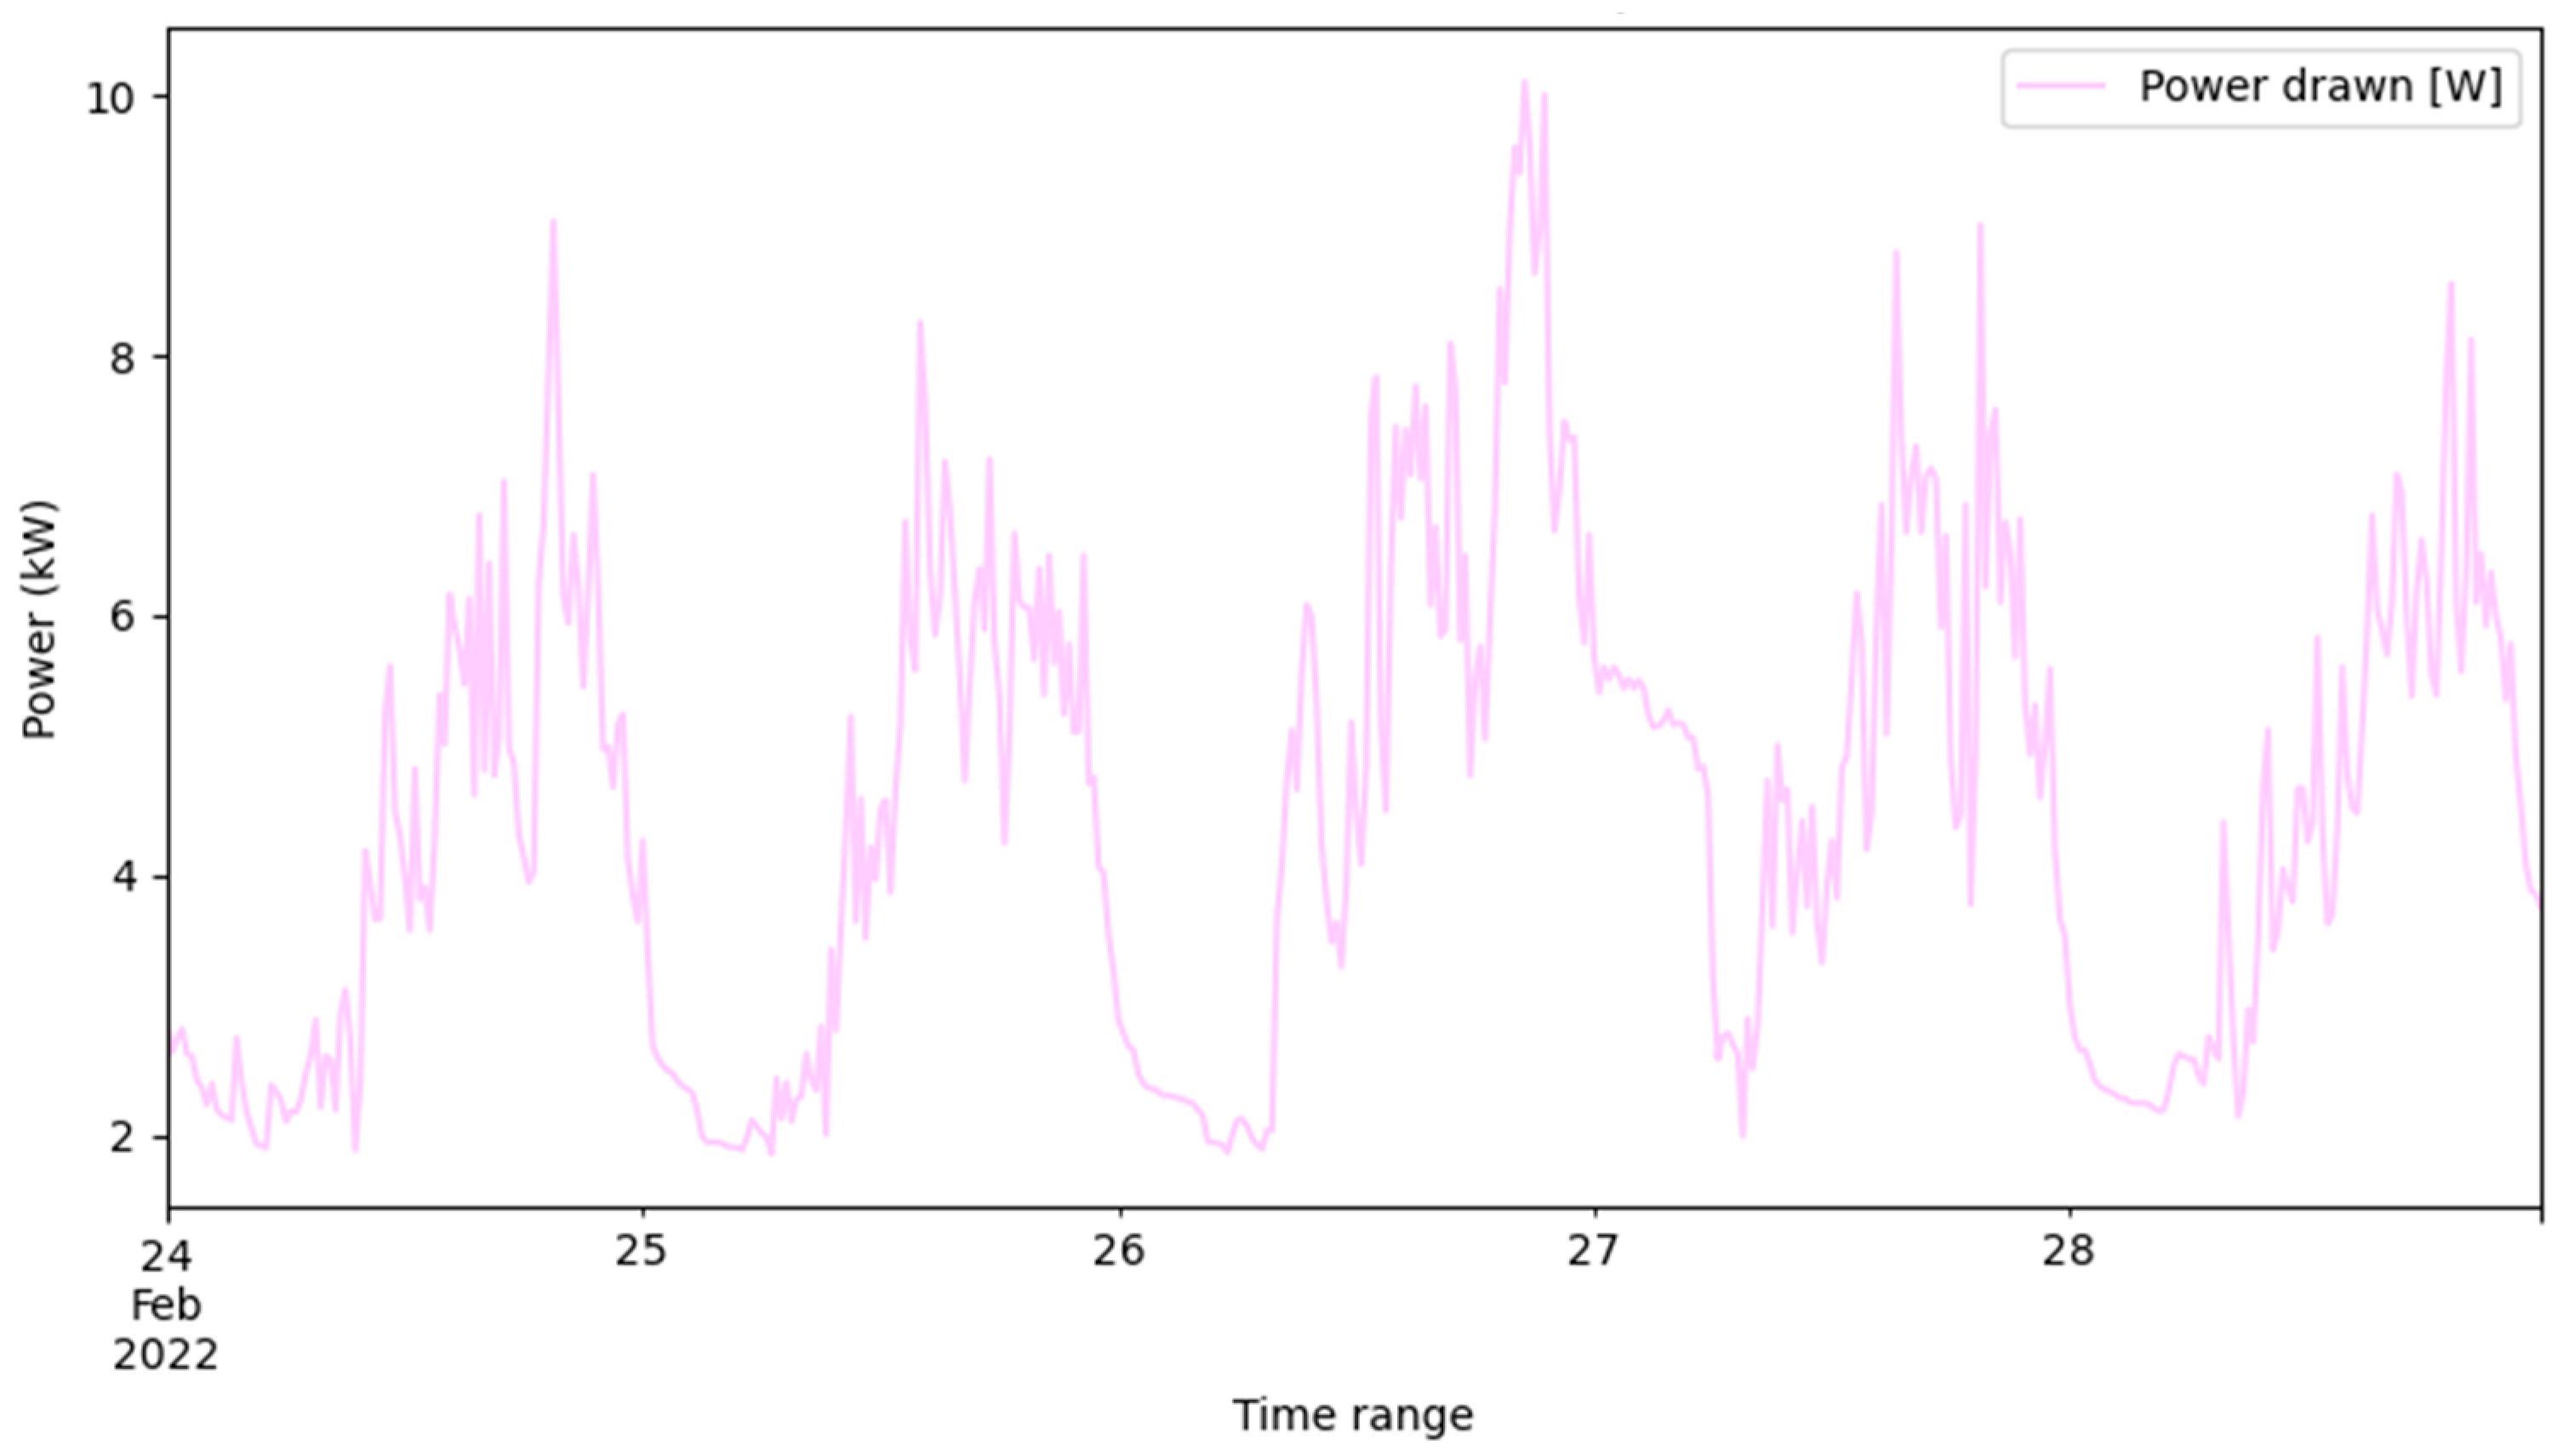
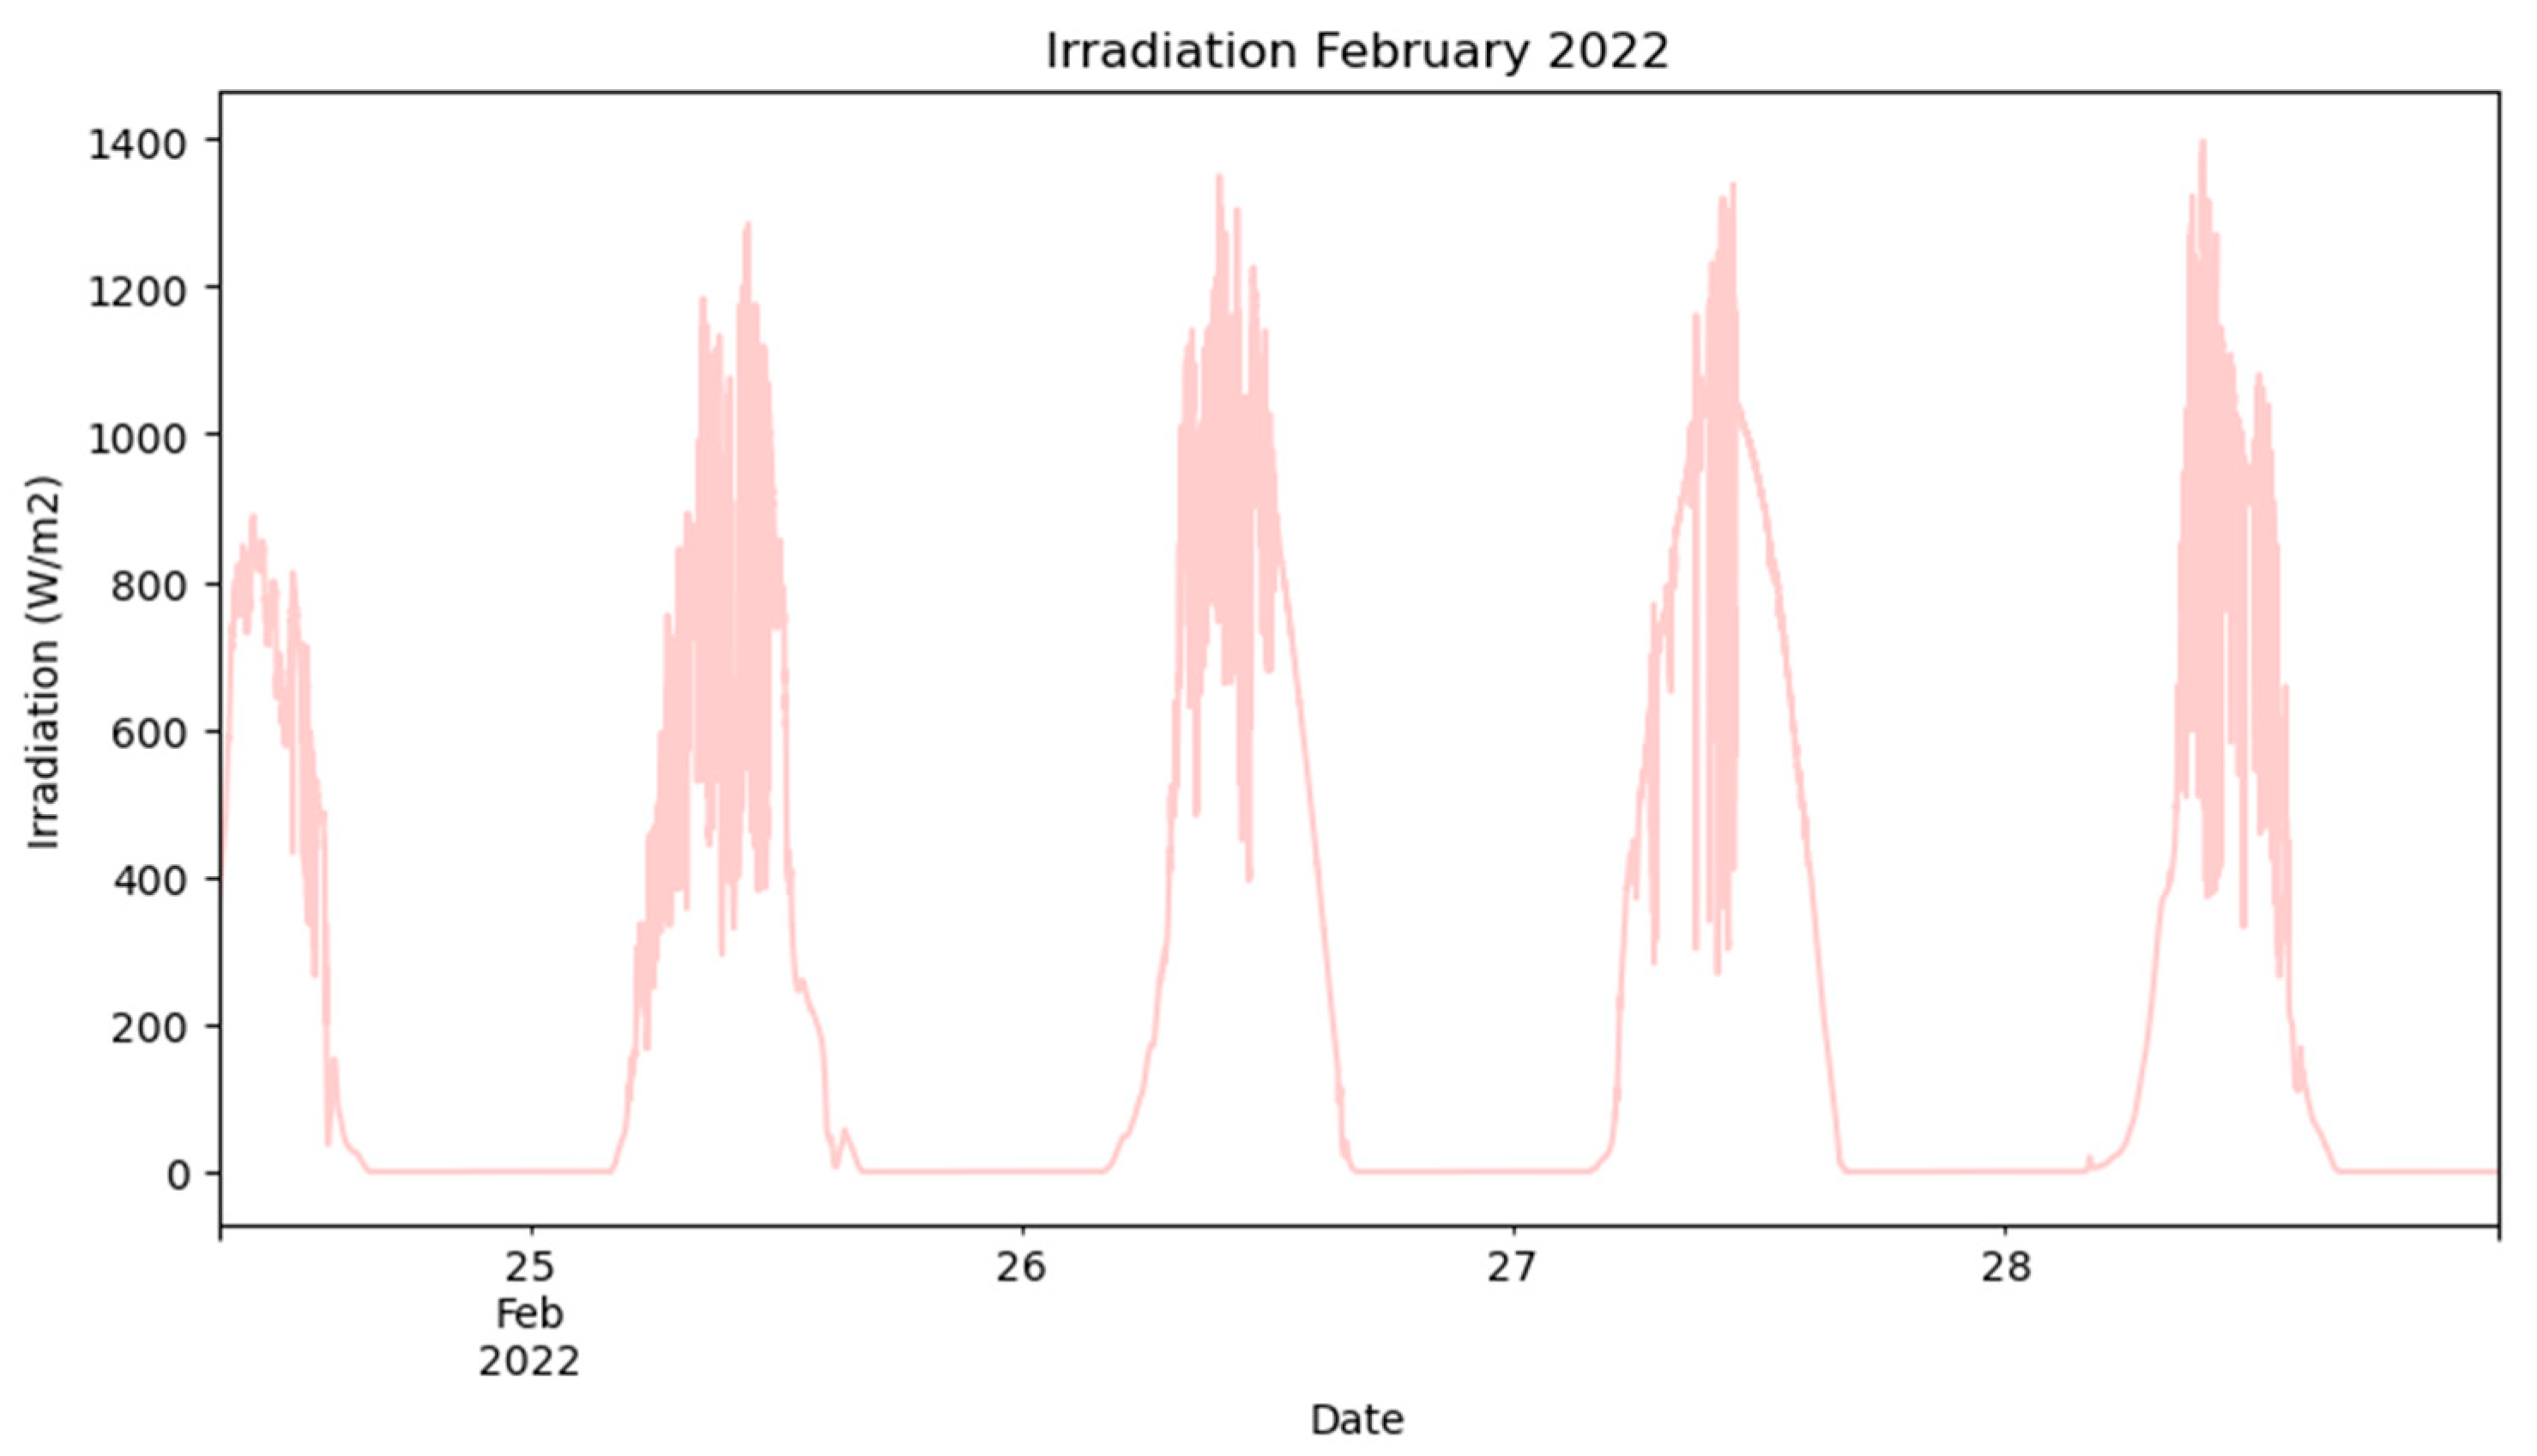
The analysis was performed by considering a week in February for which the irradiance was measured using irradiation sensors. The aim was to see the trend and the fitting between the load profiles and irradiation, hence generating solar power. Figure 13 shows the measured power consumed and Figure 14 shows the measured irradiance from 22–28 February 2022.
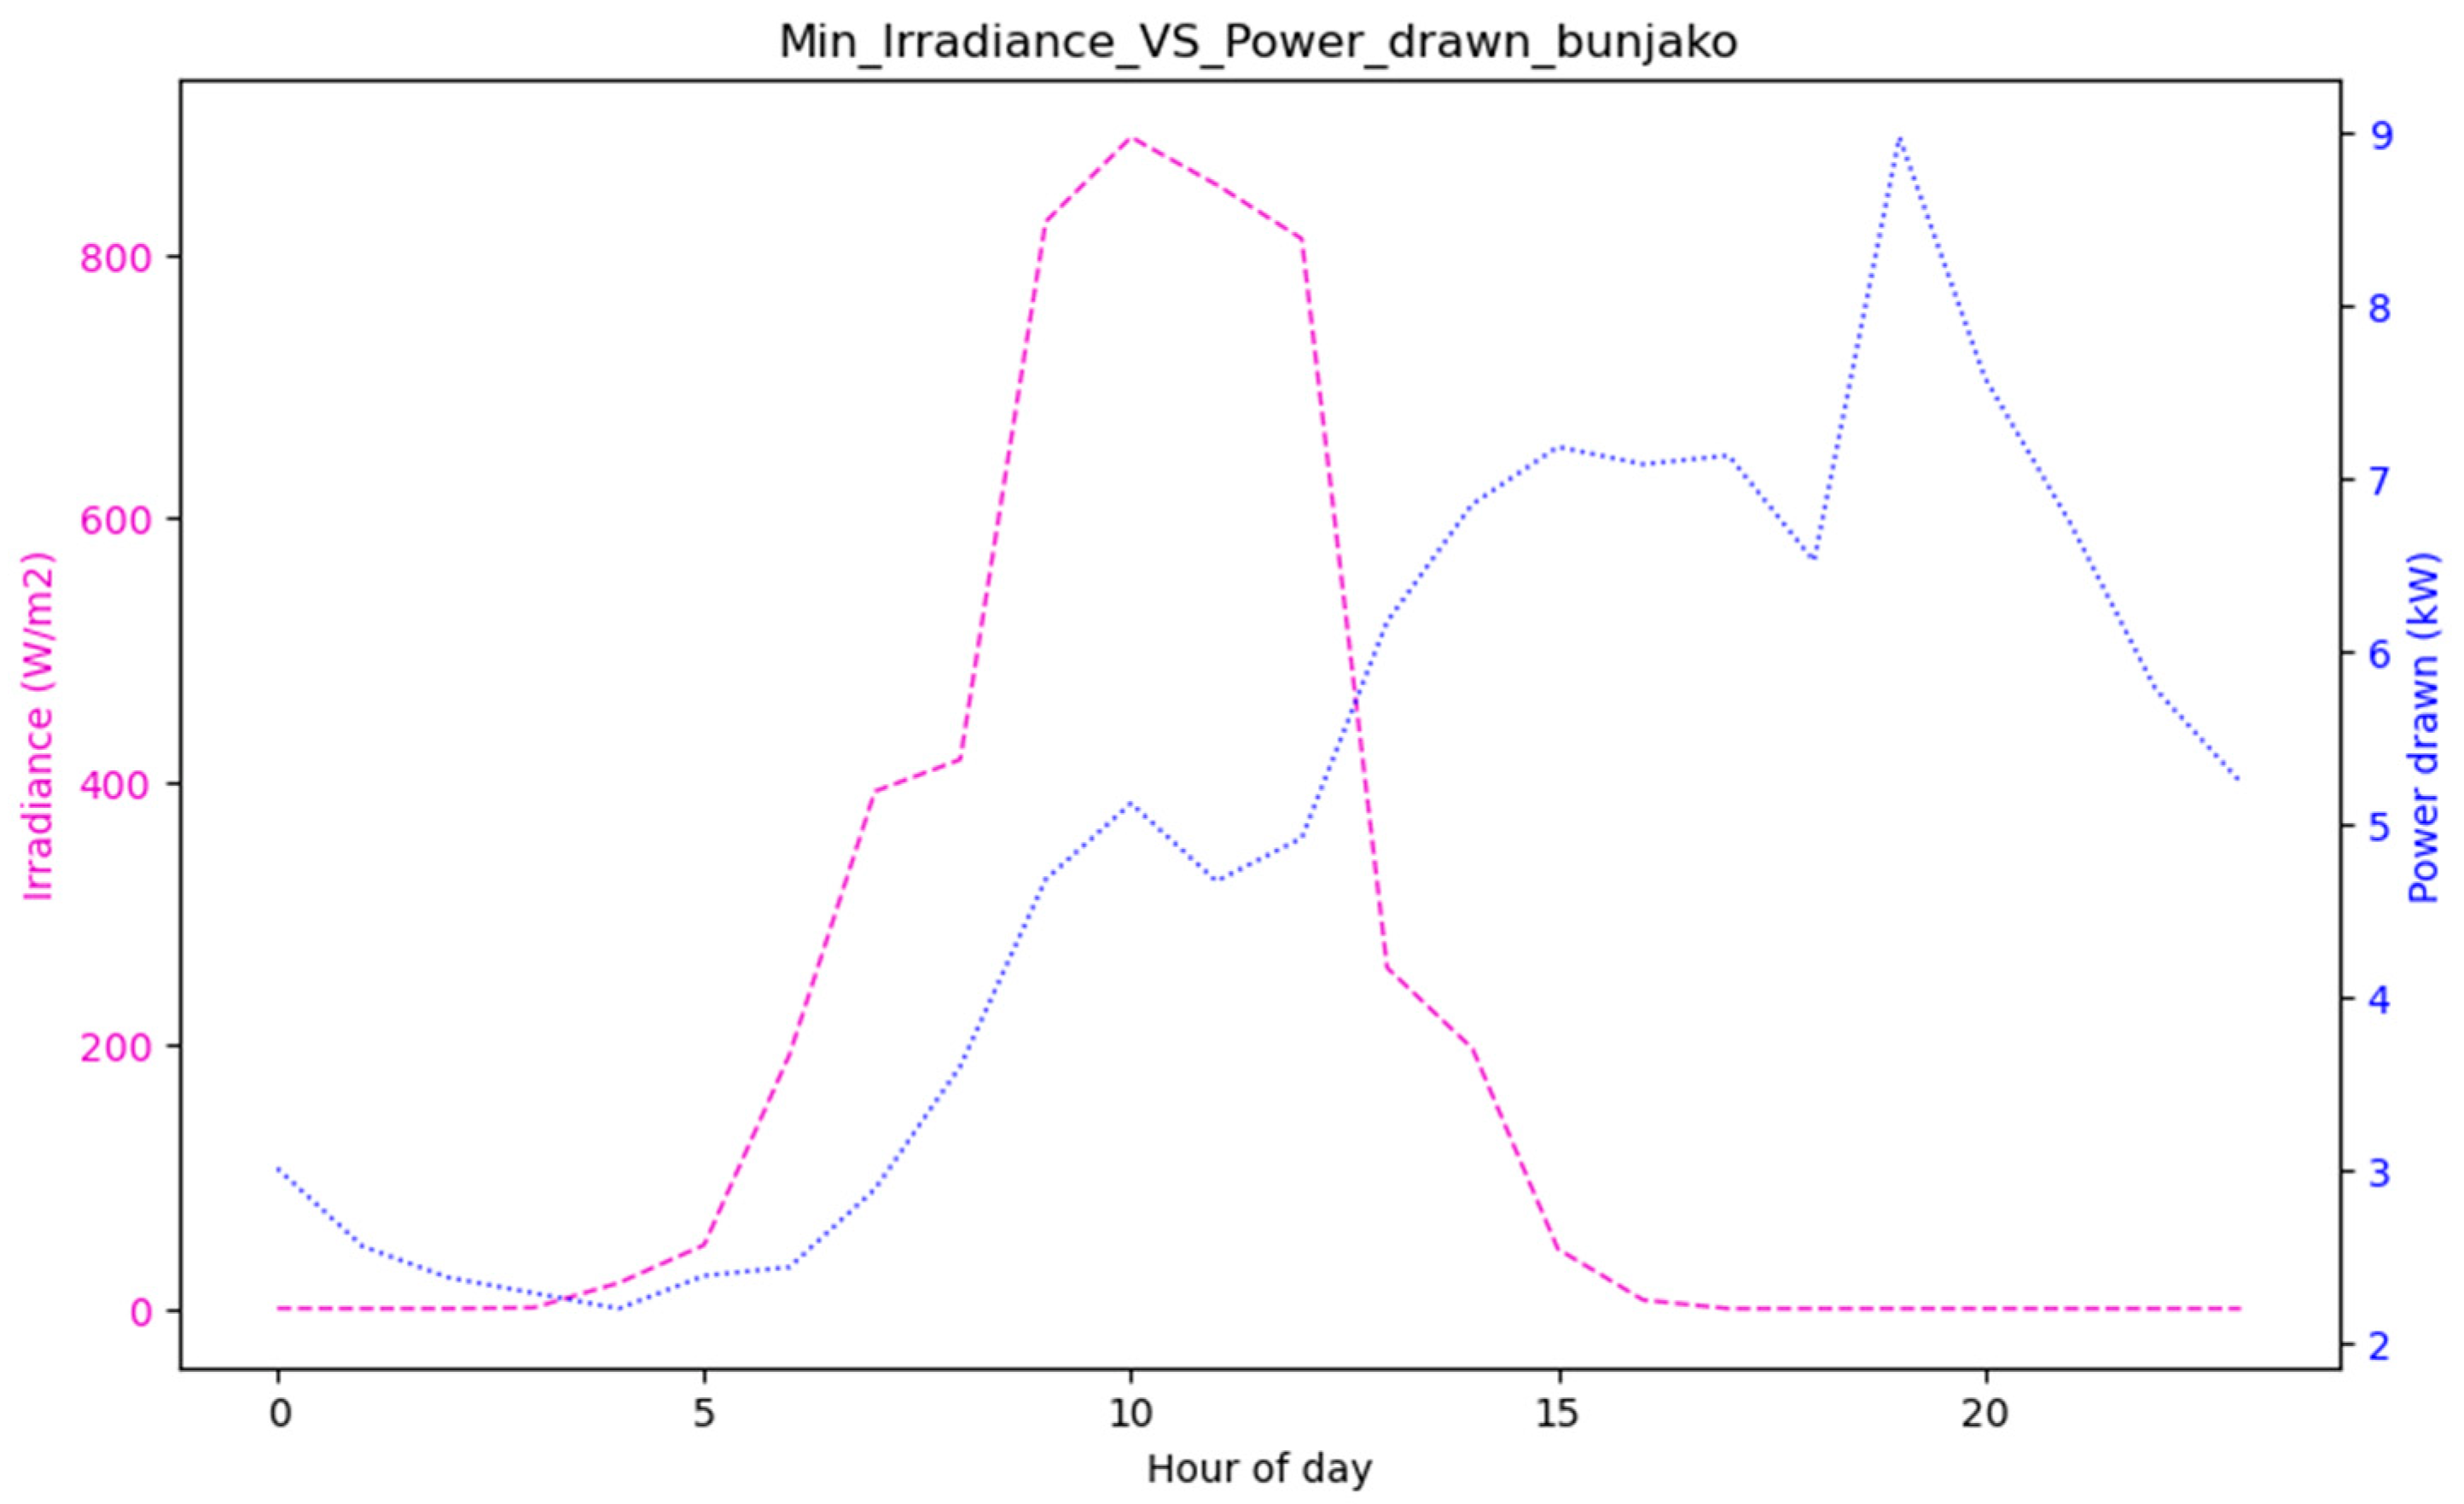
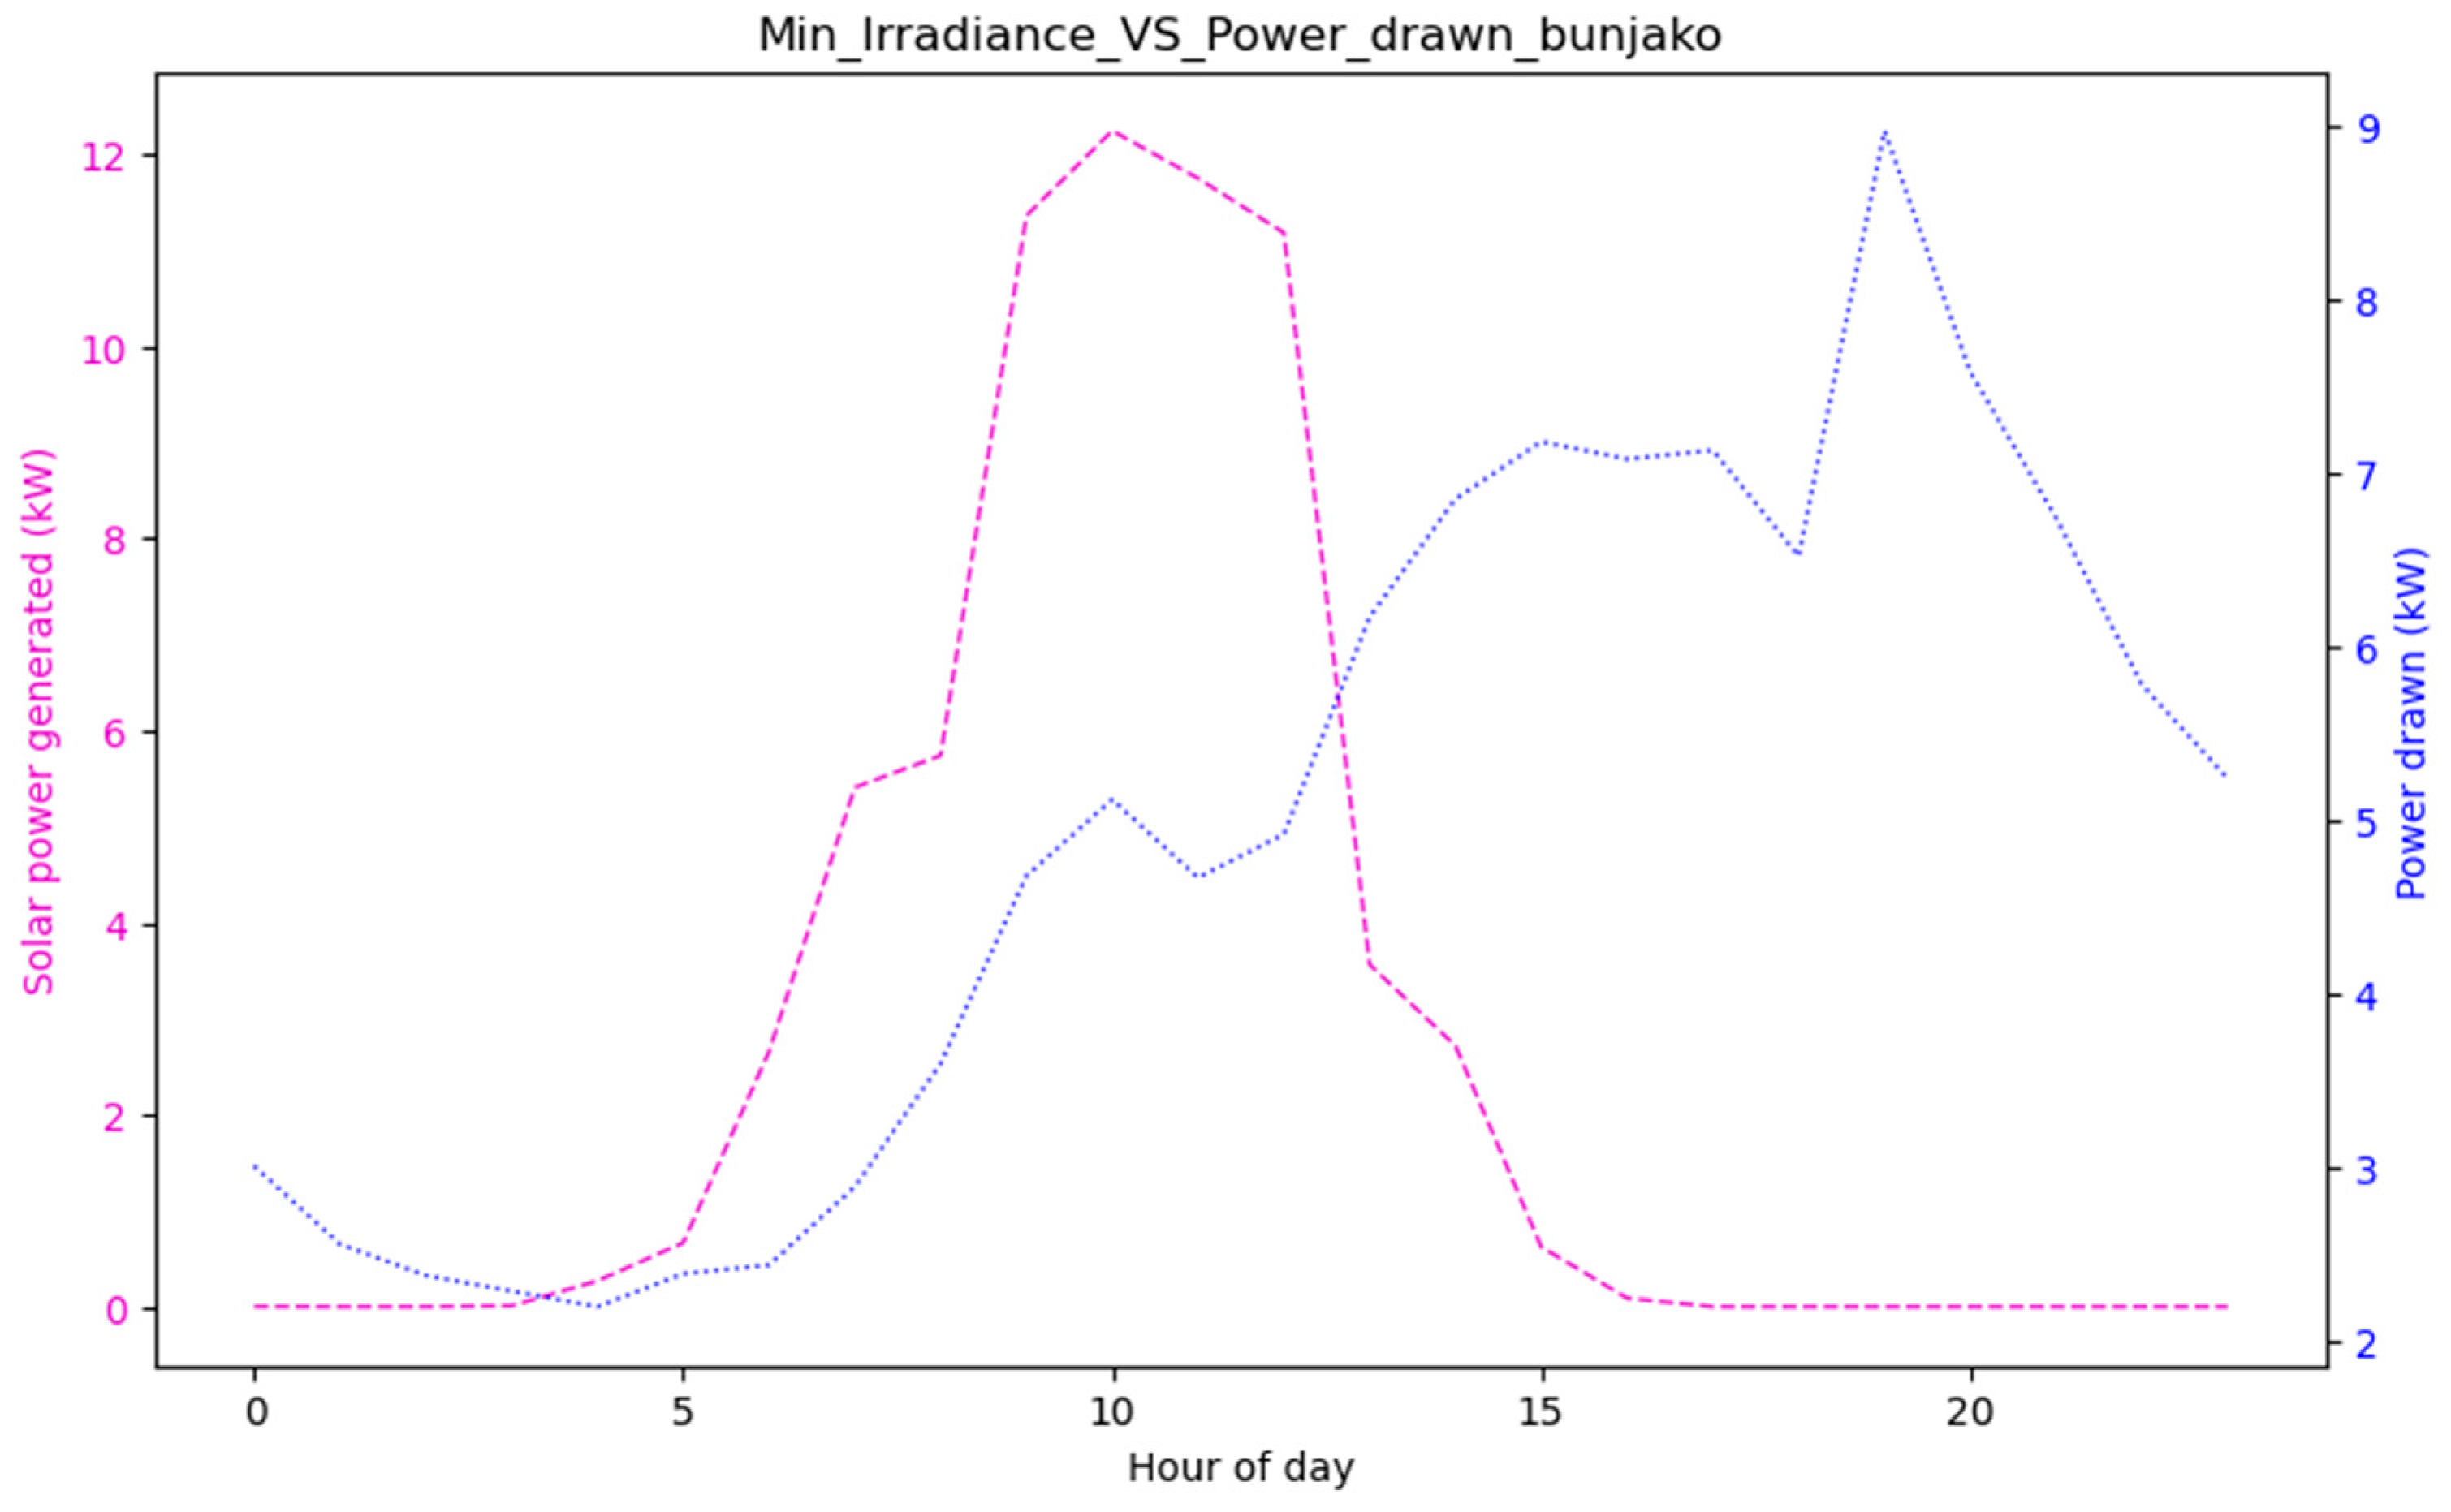
Figure 15 compares the average hourly power consumed and minimum irradiance measured at the Bunjako microgrid (0°0′10″ N, 32°8′4″ E). As is typical, average irradiation peaks around 11 am and after that declines, and the power consumption displays an increasing trend during the hours of waning and no irradiance [52]. The solar power output generated, as shown in Figure 16, was estimated using the following global formula [53].
S o l a r   p o w e r   g e n e r a t e d   i n   W = A × r × I × P R
where
  • A = total area in meters squared of the solar panel (For this case study the total area is 900 m2);
  • r = percentage solar panel yield efficiency (here it is 20.4%);
  • I = solar irradiance (in W/m2);
  • PR = performance ratio (0.75, default value).
Figure 17 represents measurements of the microgrid model before DSM. The model takes irradiance and demand data from the measurements, and accordingly, the profile of deferrable loads is decided on based on the peak and base load profile.

4.2. Effect of Peak Clipping

Peak clipping is achieved using an energy controller or switches. The energy consumption trend is monitored; if it approaches unwanted levels, the controller switches deferrable loads off. Examples of deferrable loads that are eligible to be switched off are washing machines, pumps, and water purifiers. In this work, the loads to be shut down are decided based on consumer priority and hence grouped as deferrable and non-deferrable loads.
Figure 18 represents power usage reduction through DSM using the peak-clipping strategy. A significant improvement in the load profile can be observed: A decrease of about 31.2% in peak demand. This method shows a remarkable improvement in the PAR of the system, as shown in Table 1. However, a question regarding customer comfort exists, as discussed by [10,54], regarding the importance of considering priority for both utility and customer points of view. The obtained results show better applicability than the ones in [24], where the authors performed peak clipping DSM using a mixed integer linear programming model and a considerable amount of energy, equivalent to 24.14 $/kW. However, the methodology involves the interaction of microgrid with grid power, which is not a typical case for microgrids in East Africa. Additionally, the results are further differentiated from those in [55], in which peak clipping was achieved by trying to purchase less energy from the grid and use most of the energy from the battery, which is a costly solution in the East African scenario.

4.3. Effect of Load Shifting

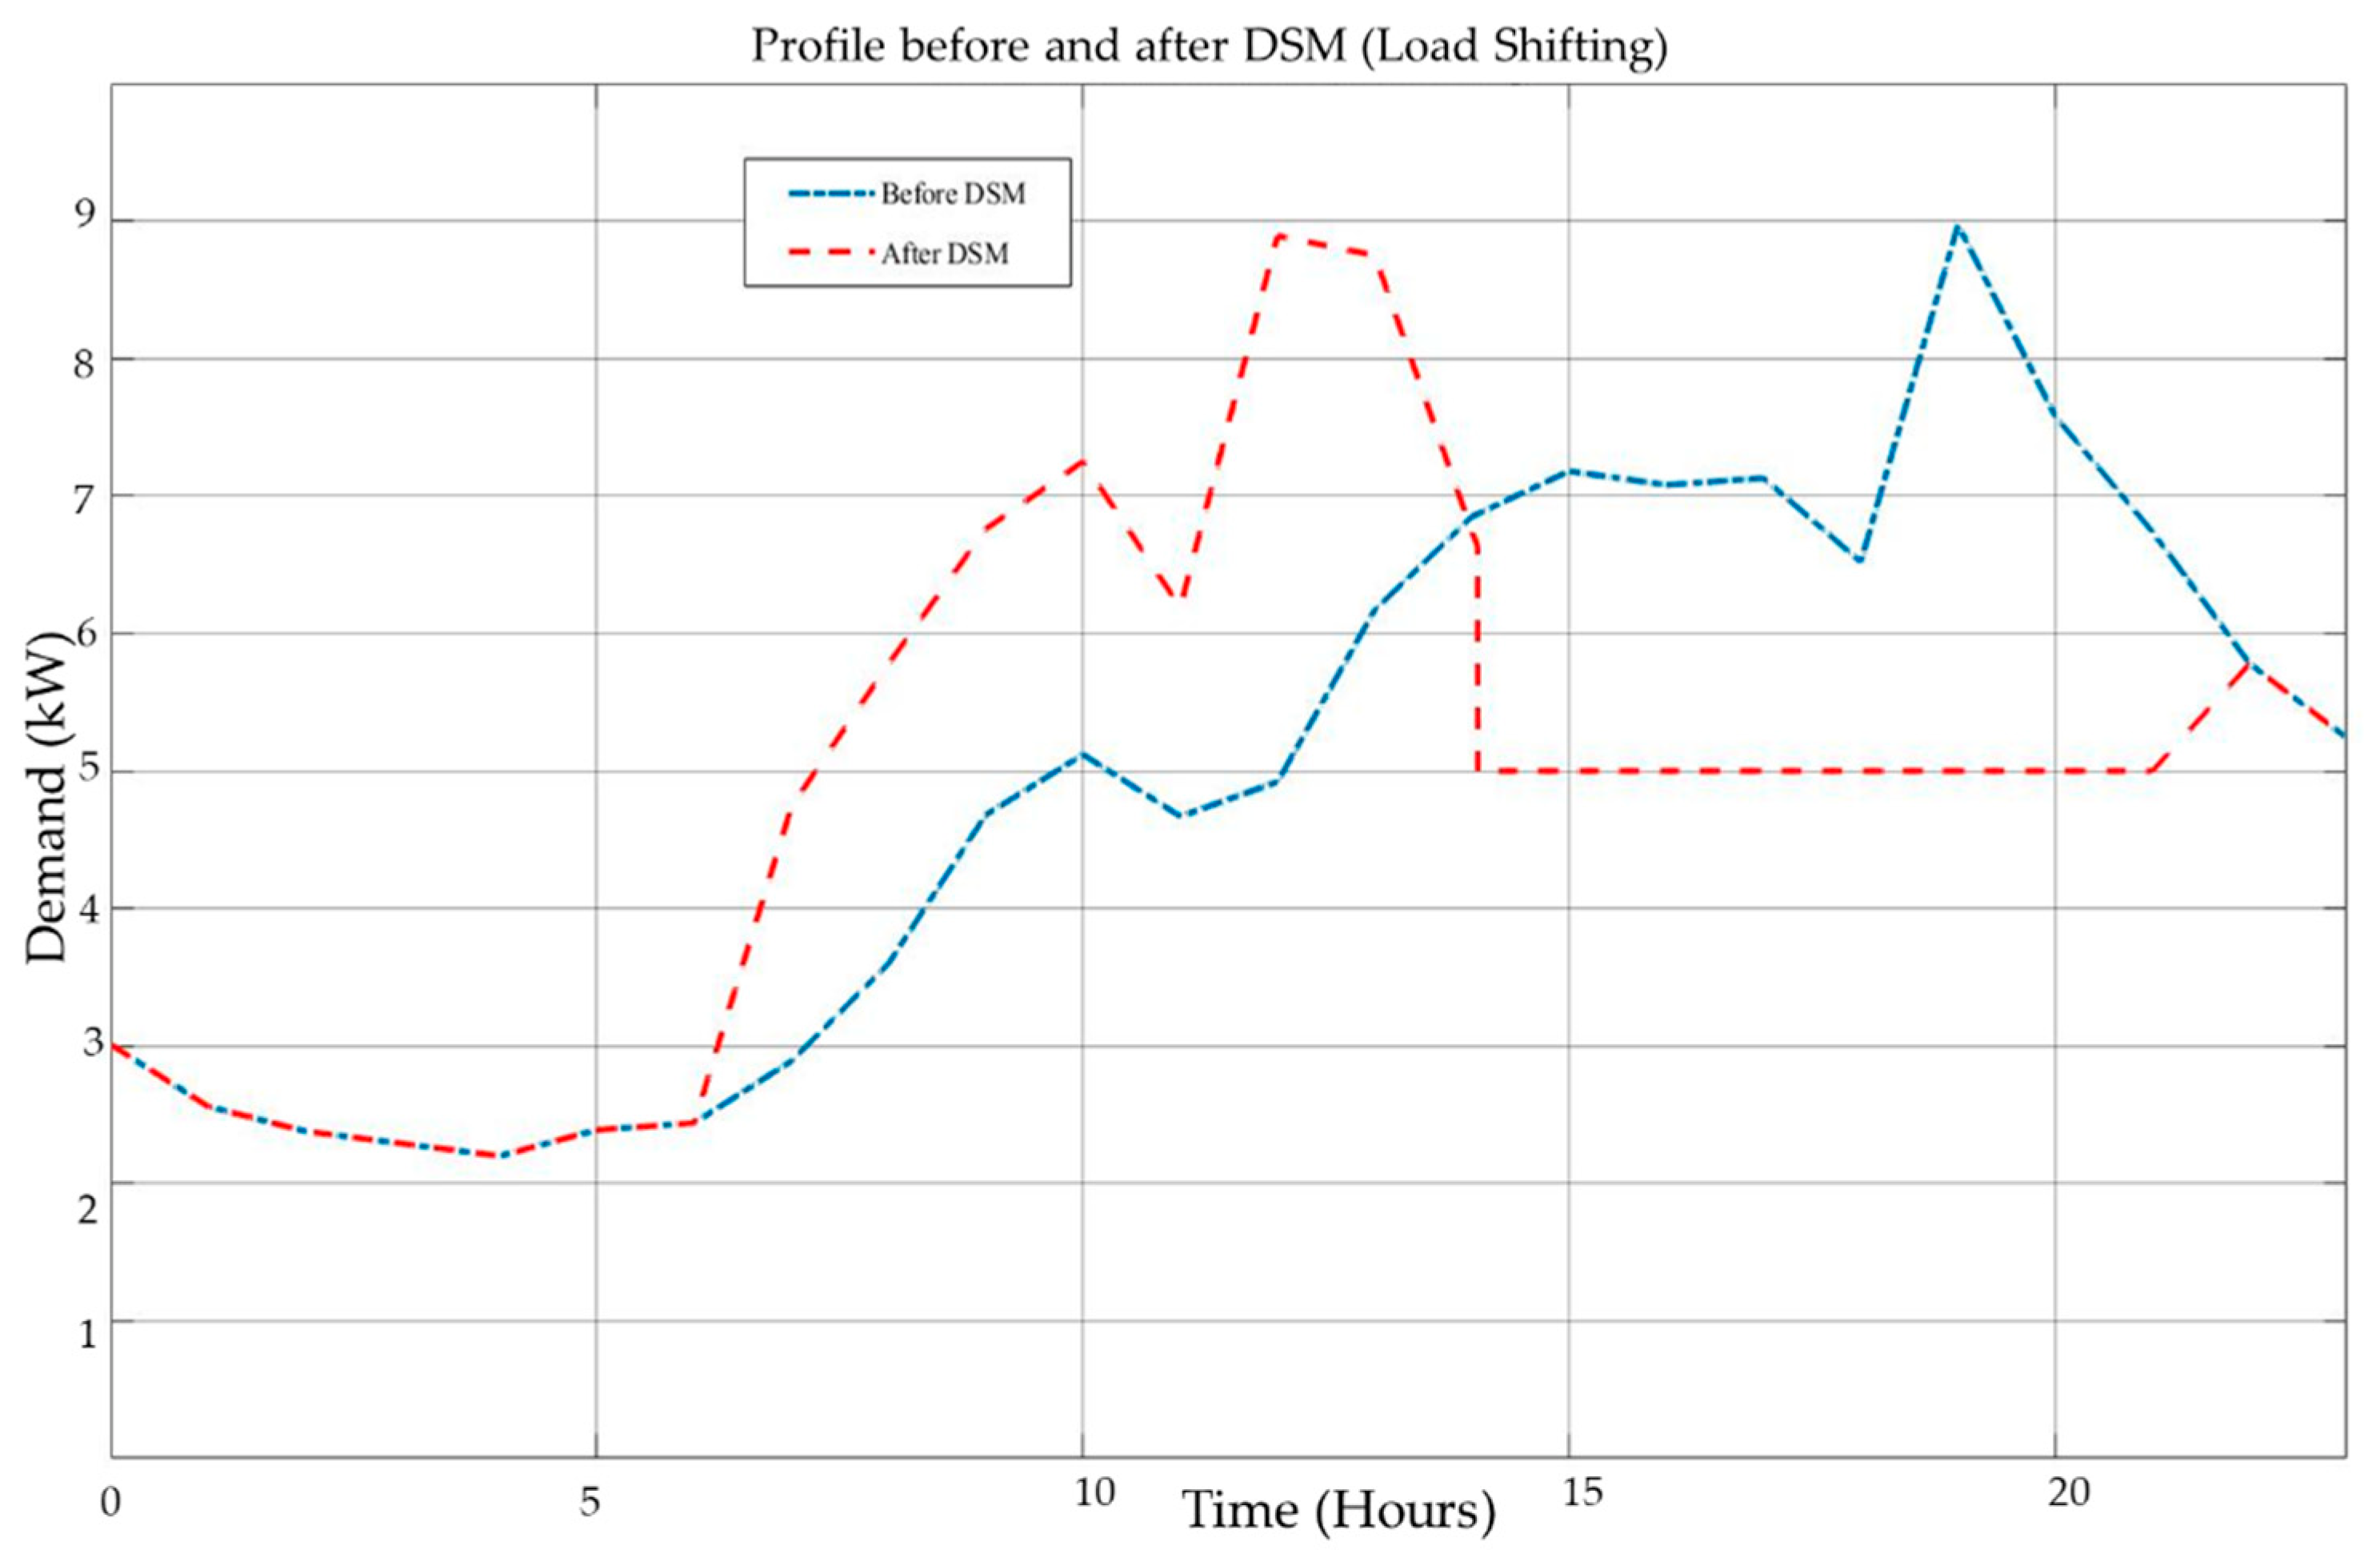
Figure 19 represents DSM through load shifting. A close look at the simulation results shows that deferrable load operation was shifted within the 24 h of a day. Most of the operation was taken towards hours when the solar irradiance is higher to reduce storage needs. Shifting most of the usage pattern towards hours of more generation gives a window for most critical loads whose operation cannot be stopped to be supplied even during peak hours, as shown in the results for around 18:00–19:00. Critical loads, such as security systems and fridges, have strict energy necessities, and once their operation is initiated, it becomes hard to reschedule [56]. However, adaptable and manageable appliances can be rescheduled from peak hours to off-peak ones if the demand for these devices cannot be satisfied [57].
During peak hours, the clipping scheme keeps energy consumption and discomfort lower by switching off excess loads. Load shifting allows rescheduling of appliances to off-peak hours with less energy consumption reduction, as shown in Figure 20. The results comparable to those in [56]. Likewise, a MATLAB simulation of load shifting considering solar output was implemented using deferrable and non-deferrable loads. Results are showed a peak demand reduction of about 45% in the main grid [53].
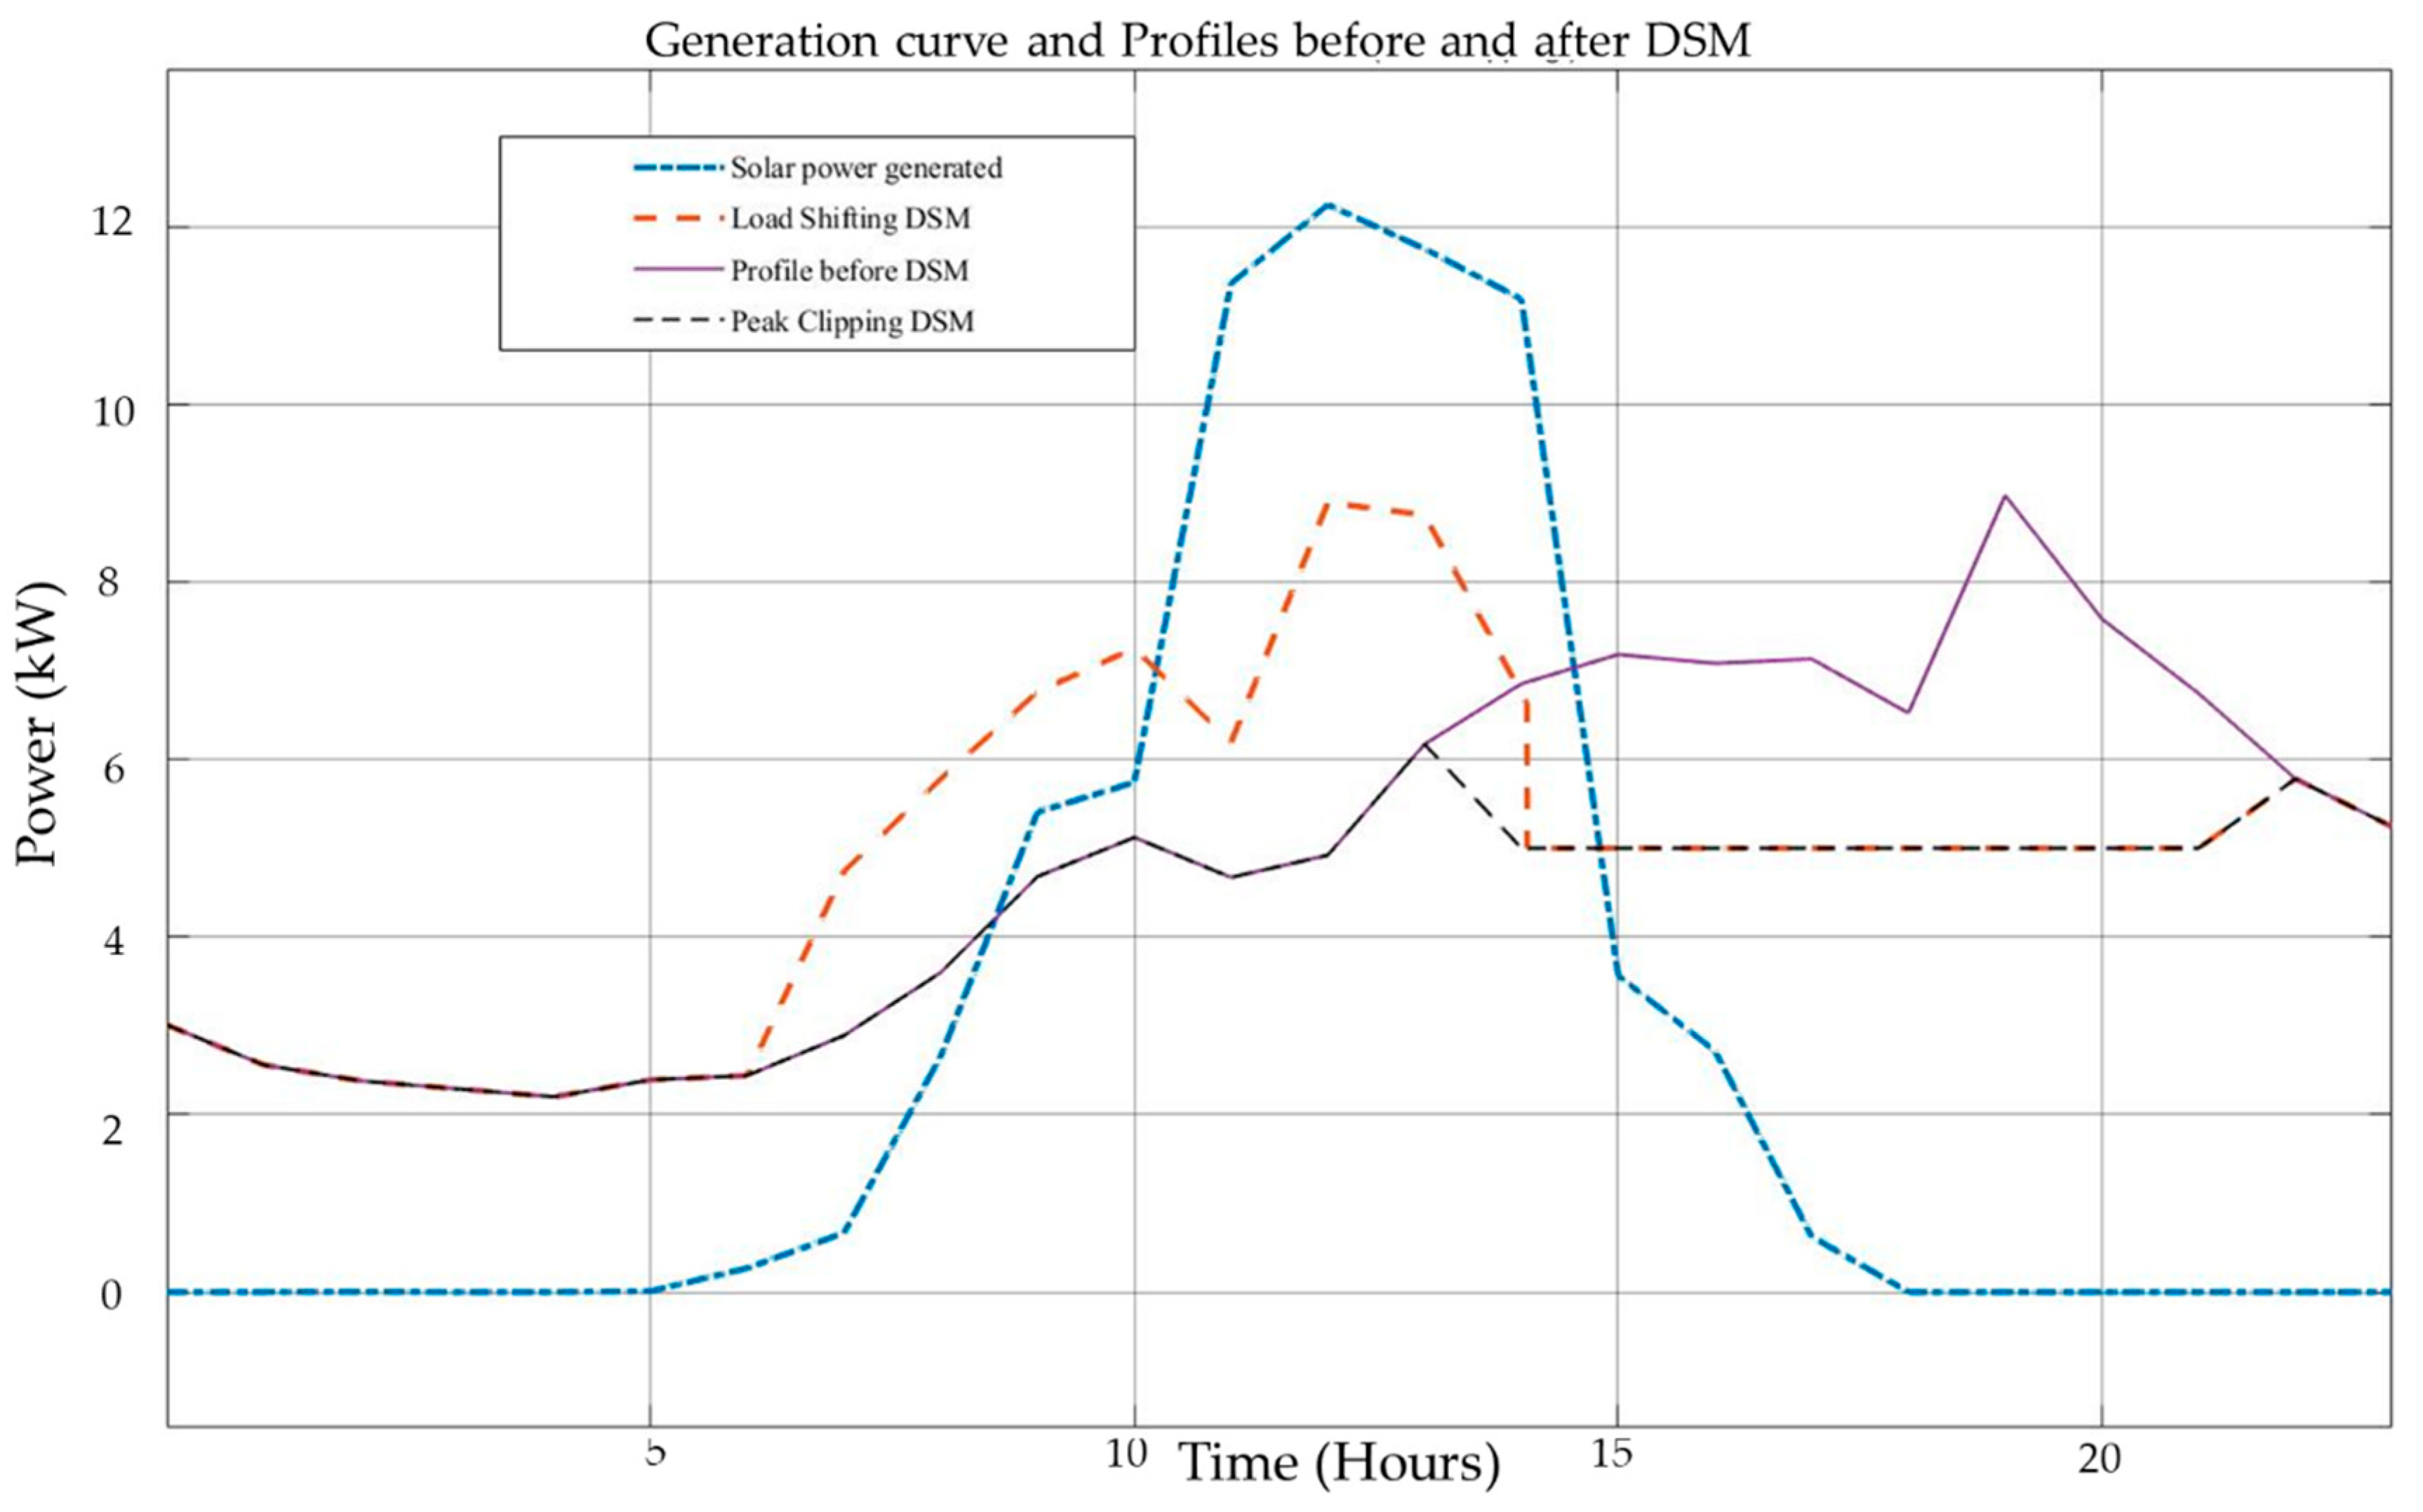
Figure 21 compares the estimated solar generation profile and demand before and after applying DSM. It can be observed that the consumption was shifted to hours with more solar production and clipped during less production. These results are essential for improving overall system stability and sustainability.
Table 3 represents the statistical parameters of the profiles before and after DSM. The parameters displayed are the maximum (largest) and minimum (smallest) values of power consumed within the 24 h time horizon. Peak to peak power represents the difference between the maximum and minimum values of power consumed before and after DSM. The mean and median values are the average and median of all the values within the original load profile and profiles after DSM. The other statistical parameters are the root mean square value of power consumed. Maximum and minimum hours represent the maximum and minimum hours (the time of day) in which the maximum and minimum mini-grid demand occur, respectively. The calculated peak-to-average ratio (PAR) and the percentage reduction in peak after DSM are shown.

4.4. Peak to Average Ratio (PAR)

PAR measures how an electric system’s reliability and efficiency are affected by peak electricity consumption. It is calculated as the ratio of the peak to time-averaged power level. Customers’ power consumption behavior directly affects the peak consumption of the system. By maintaining the balance between supply and demand, PAR can be minimized, which benefits both utility and consumer. One of the primary goals of DSM is PAR minimization, and hence maintaining reliability and stability of the grid. PAR is given as follows,
PAR = Max   ( Power ) 1 24 ( t = 1 24 Power )
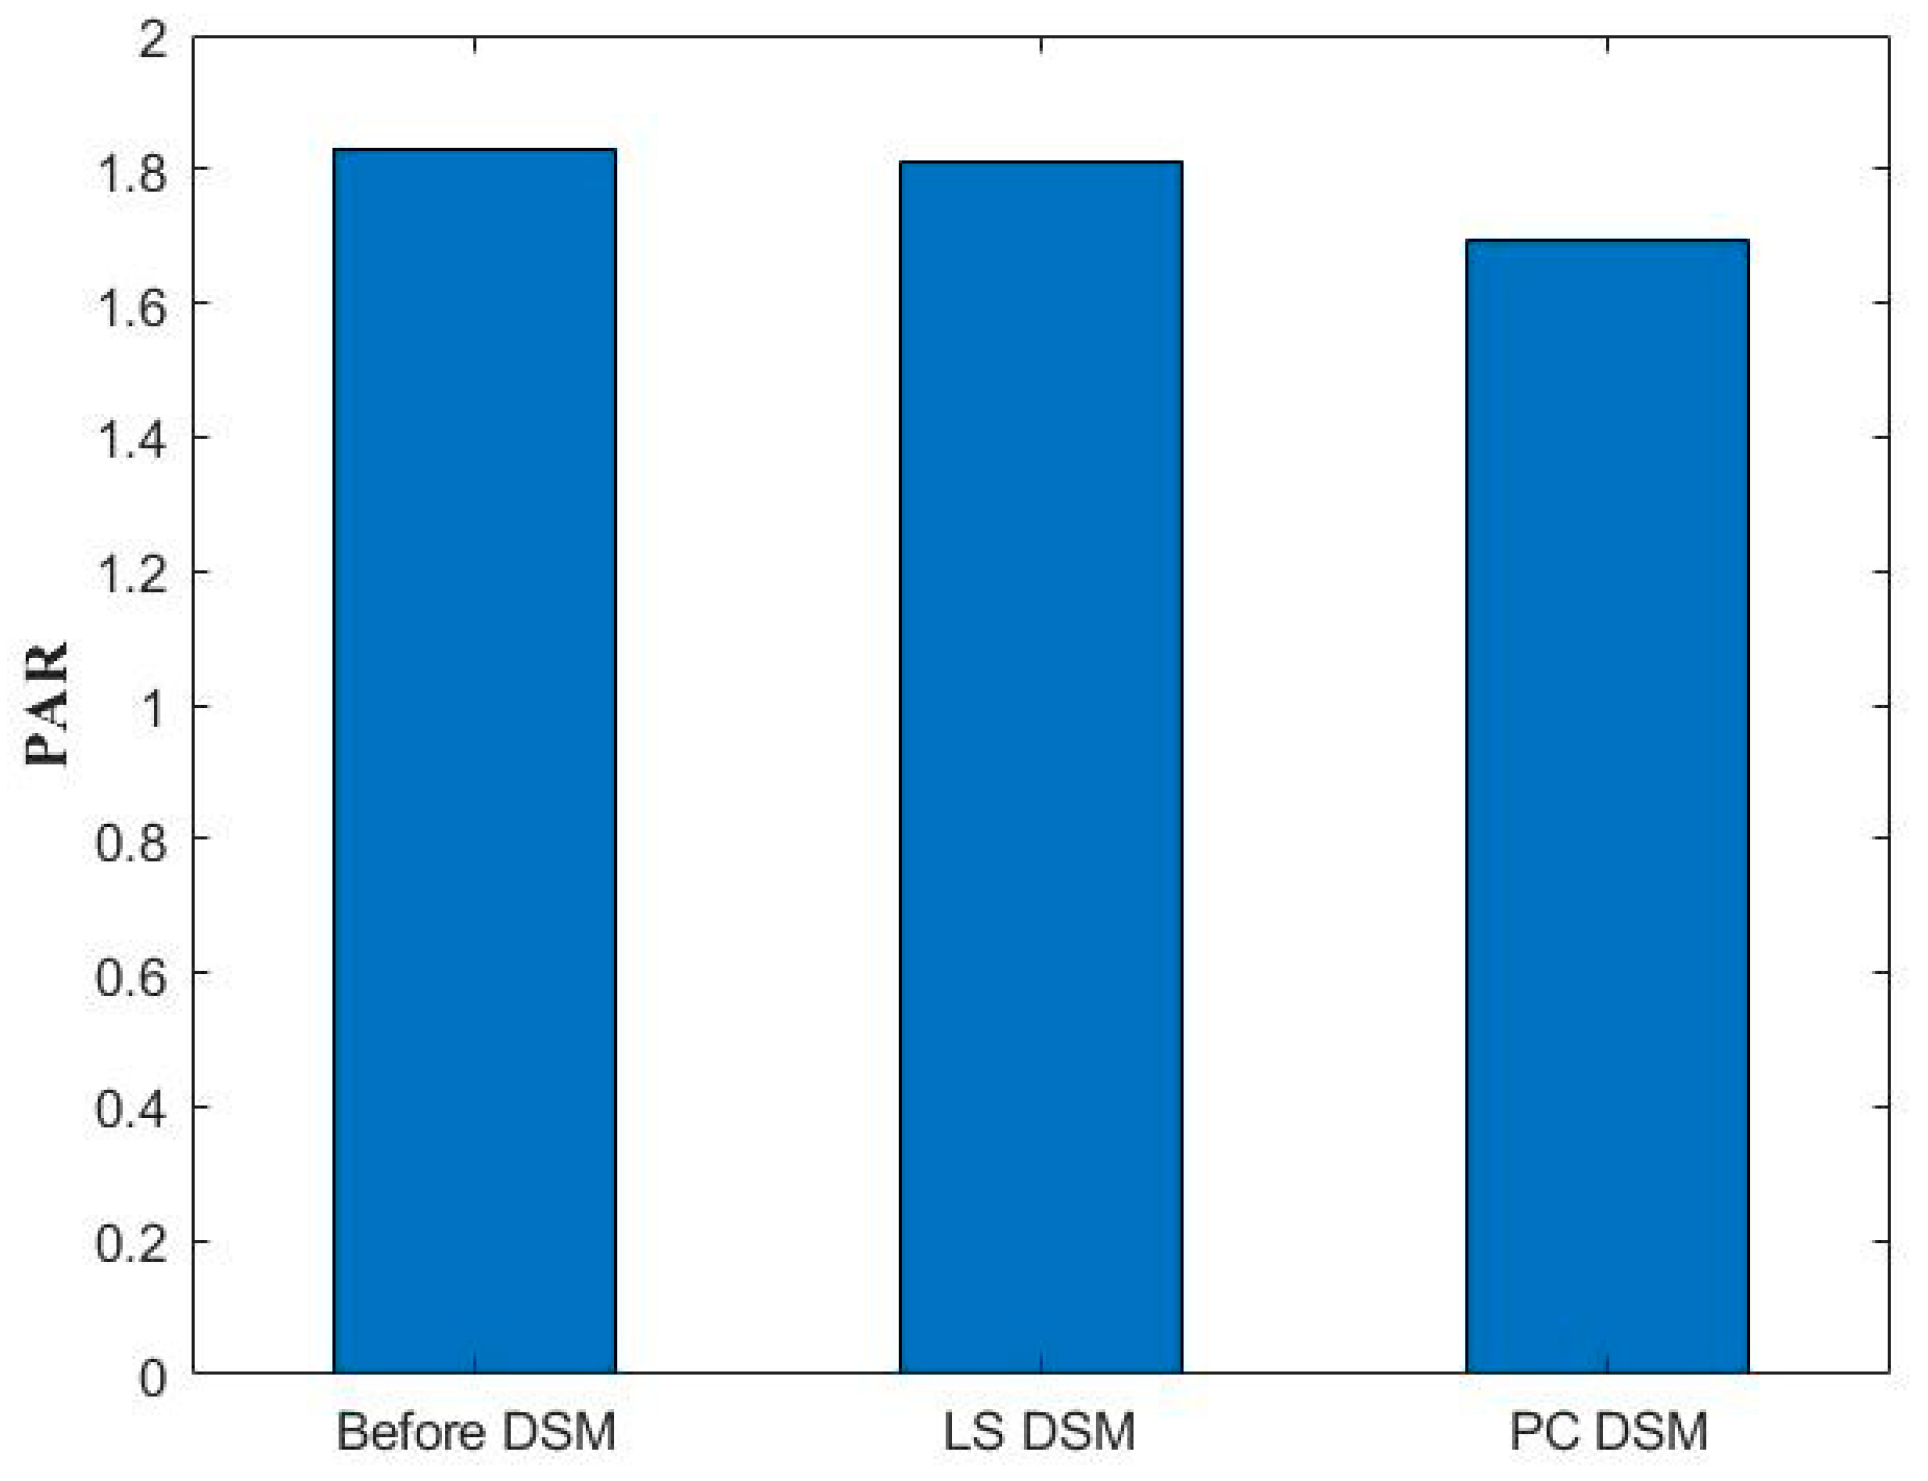
The plotted histogram, as shown in Figure 22, compares the PAR of demand profiles before and after DSM using the two approaches. The profile before DSM has a PAR of 1.831, whereas PC DSM and LS DSM have PAR of 1.693 and 1.813, respectively. Less reduction in PAR in the case of load shifting resulted from the generated peak power consumption (see Figure 19) after the loads were shifted. It can be seen clearly from the results that peak clipping performed better in terms of minimizing PAR, having comparable results with Load shifting. The results match those in [58]. Those authors performed load scheduling of appliances using binary particle swarm optimization. The results showed a reduced PAR from 1.85 to 1.42 for commercial loads, 1.23 to 0.96 for home and agricultural loads and 1.85 to 1.42 for industrial loads.

5. Conclusions

In this work, we proposed scheduling household appliances based on load shifting and peak clipping through DSM. We simulated the scheme in a MATLAB/Simulink environment. The concepts of shiftable and non-shiftable appliances were modelled considering their operating times and the possibility of rescheduling. The proposed method was tested using real-time data of a solar microgrid in East Africa for 24 h days. After applying the proposed DSM strategies, it was observed that the load profile matched better with the solar generation, since most of the usage pattern was shifted to hours of more power generation, as shown in the results. This method provides a framework for more sustainable rural microgrids through properly utilizing renewable sources. A decrease in power consumption from the microgrid promises grid stability, and thus subsequent saves expenses. Therefore, the proposed method efficiently reduces energy consumption during the unavailability of the sun. Due to the improved matching of load to generation, the required storage capacity can be reduced.

Author Contributions

Conceptualization, G.H.P. and J.N.K.; methodology, G.H.P.; software, S.K.; validation, S.K., G.H.P. and J.N.K.; formal analysis, G.H.P. and J.N.K.; investigation, G.H.P. and J.N.K.; data curation, S.K.; writing—original draft preparation, G.H.P. and J.N.K.; writing, review and editing, G.H.P. and J.N.K.; review and editing, S.K.; visualization, S.K., G.H.P. and J.N.K.; supervision, S.K.; project administration, S.K.; funding acquisition, S.K. All authors have read and agreed to the published version of the manuscript.

Funding

This research was funded by the German Federal Ministry of Education and Research (BMBF) for funding this project within the compound assignment “CLIENT II–Art-D Grids: Africa Research and Teaching Platform for Development–Sustainable Modular Grids for Grid Stability”. Project: 03SF0607B.

Institutional Review Board Statement

Not applicable.

Informed Consent Statement

Not applicable.

Data Availability Statement

Data may be available upon request and agreement from the authorized organization.

Conflicts of Interest

The authors declare no conflict of interest.

Nomenclature

ANNArtificial Neural Network
BPSOBinary Particle Swarm Optimization
DSMDemand Side Management
GWOGrey Wolf Optimization
LSLoad Shifting
LPMLiters per minute
MATLABMatrix Laboratory
PARPeak to Average Ratio
PCPeak Clipping
PVPhotovoltaic
RESRenewable Energy Sources
SOCState of Charges

References

  1. Schnitzer, D.; Shinde, D.L.; Carvallo, J.P.; Deshmukh, R.; Apt, J.; Kammen, D.M. Microgrids for Rural Electrification: A Critical Review of Best Practices Based on Seven Case Studies; United Nations Foundation: Washington, DC, USA, 2014; pp. 11–24. [Google Scholar] [CrossRef]
  2. Takalani, R.; Bekker, B. Load and Load Growth Models for Rural Microgrids, and How to Future-Proof Designs. In Proceedings of the 2020 International SAUPEC/RobMech/PRASA Conference, Cape Town, South Africa, 29–31 January 2020; pp. 10–15. [Google Scholar] [CrossRef]
  3. Blimpo, M.P.; Cosgrove-Davies, M. Accès à l’Électricité En Afrique Subsaharienne; World Bank Publications: Washington, DC, USA, 2020; ISBN 9781464814884. [Google Scholar]
  4. Gambino, V.; Micangeli, A.; Naso, V.; Michelangeli, E.; di Mario, L. A Sustainable and Resilient Housing Model for Indigenous Populations of the Mosquitia Region (Honduras). Sustainability 2014, 6, 4931–4948. [Google Scholar] [CrossRef] [Green Version]
  5. Dell’Era, A.; Bocci, E.; Sbordone, D.; Villarini, M.; Boeri, F.; Di Carlo, A.; Zuccari, F. Experimental Tests to Recover the Photovoltaic Power by Battery System. Energy Procedia 2015, 81, 548–557. [Google Scholar] [CrossRef] [Green Version]
  6. Micangeli, A.; Del Citto, R.; Checchi, F.; Viganò, D.; Nouboundieu, S.; Cestari, G. Rural Electrification in Central America and East Africa, Two Case Studies of Sustainable Microgrids. Iberoam. J. Dev. Stud. 2018, 7, 82–113. [Google Scholar] [CrossRef]
  7. Yadoo, A.; Cruickshank, H. The Role for Low Carbon Electrification Technologies in Poverty Reduction and Climate Change Strategies: A Focus on Renewable Energy Mini-Grids with Case Studies in Nepal, Peru and Kenya. Energy Policy 2012, 42, 591–602. [Google Scholar] [CrossRef]
  8. Independent Evaluation Group World Bank. The Welfare Impact of Rural Electrification: A Reassessment of the Costs and Benefits; Independent Evaluation Group World Bank: Washington, DC, USA, 2008; ISBN 9780821373675. [Google Scholar]
  9. Khandker, S.R.; Barnes, D.F.; Samad, H.A. Vietnam: Welfare Impacts of Rural Electrification. Econ. Dev. Cult. Change 2013, 61, 659–692. [Google Scholar] [CrossRef] [Green Version]
  10. Philipo, G.H.; Chande Jande, Y.A.; Kivevele, T. Demand-Side Management of Solar Microgrid Operation: Effect of Time-of-Use Pricing and Incentives. J. Renew. Energy 2020, 2020, 6956214. [Google Scholar] [CrossRef]
  11. Williams, N.J.; Jaramillo, P.; Cornell, B.; Lyons-Galante, I.; Wynn, E. Load Characteristics of East African Microgrids. In Proceedings of the 2017 IEEE PES PowerAfrica, Accra, Ghana, 27–30 June 2017; pp. 236–241. [Google Scholar] [CrossRef]
  12. Philipo, G.H.; Chande Jande, Y.A.; Kivevele, T. Clustering and Fuzzy Logic-Based Demand-Side Management for Solar Microgrid Operation: Case Study of Ngurudoto Microgrid, Arusha, Tanzania. Adv. Fuzzy Syst. 2021, 2021, 6614129. [Google Scholar] [CrossRef]
  13. Azurza, O.; Arranbide, I.; Zubia, I. Rural Electrification Based on Renewable Energies. A Review. Renew. Energy Power Qual. J. 2012, 1, 497–502. [Google Scholar] [CrossRef]
  14. Villarini, M.; Bocci, E.; Moneti, M.; Di Carlo, A.; Micangeli, A. State of Art of Small Scale Solar Powered ORC Systems: A Review of the Different Typologies and Technology Perspectives. Energy Procedia 2014, 45, 257–267. [Google Scholar] [CrossRef] [Green Version]
  15. Ustun, T.S.; Ozansoy, C.; Zayegh, A. Recent Developments in Microgrids and Example Cases around the World—A Review. Renew. Sustain. Energy Rev. 2011, 15, 4030–4041. [Google Scholar] [CrossRef]
  16. Mulongoti, D.; Mugala, G.; Kumwenda, B.; Louie, H. Determining the Effects of Load-Shedding on Residential Electricity Consumption Using Meter Data, A Case of Kitwe, Zambia. In Proceedings of the 2016 IEEE Global Humanitarian Technology Conference (GHTC), Seattle, WA, USA, 13–16 October 2016. [Google Scholar]
  17. Mišák, S.; Stuchlý, J.; Platoš, J.; Krömer, P. A Heuristic Approach to Active Demand Side Management in Off-Grid Systems Operated in a Smart-Grid Environment. Energy Build. 2015, 96, 272–284. [Google Scholar] [CrossRef]
  18. Calderaro, V.; Galdi, V.; Lattarulo, V.; Siano, P. A New Algorithm for Steady State Load-Shedding Strategy. In Proceedings of the 2010 12th International Conference on Optimization of Electrical and Electronic Equipment, Brasov, Romania, 20–22 May 2010; pp. 48–53. [Google Scholar] [CrossRef]
  19. Heffner, G.; Maurer, L.; Sarkar, A.; Wang, X. Minding the Gap: World Bank’s Assistance to Power Shortage Mitigation in the Developing World. Energy 2010, 35, 1584–1591. [Google Scholar] [CrossRef]
  20. Barton, J.P.; Infield, D.G. Intermittent Renewable Energy. IEEE Trans. Energy Convers. 2004, 19, 441–448. [Google Scholar] [CrossRef]
  21. Cecati, C.; Citro, C.; Siano, P. Combined Operations of Renewable Energy Systems and Responsive Demand in a Smart Grid. IEEE Trans. Sustain. Energy 2011, 2, 468–476. [Google Scholar] [CrossRef]
  22. Ma, J.; Chen, H.H.; Song, L.; Li, Y. Residential Load Scheduling in Smart Grid: A Cost Efficiency Perspective. IEEE Trans. Smart Grid 2016, 7, 771–784. [Google Scholar] [CrossRef]
  23. Panda, S.; Mohanty, S.; Rout, P.K.; Sahu, B.K.; Bajaj, M.; Zawbaa, H.M.; Kamel, S. Residential Demand Side Management Model, Optimization and Future Perspective: A Review. Energy Rep. 2022, 8, 3727–3766. [Google Scholar] [CrossRef]
  24. Moghimi, M.; Leskarac, D.; Panchal, C.; Lu, J.; Stegen, S. Energy Management System for Peak Shaving in an Experimental Microgrid Employing MILP Optimization. Int. J. Eng. Inov. Technol. 2018, 7, 28–33. [Google Scholar] [CrossRef]
  25. Narimani, M.R.; Maigha; Joo, J.Y.; Crow, M. Multi-Objective Dynamic Economic Dispatch with Demand Side Management of Residential Loads and Electric Vehicles. Energies 2017, 10, 624. [Google Scholar] [CrossRef] [Green Version]
  26. Kothari, D.P.; Nagrath, I.J. Scilab Textbook Companion for Modern Power System Analysis Book Description; Tata McGraw—Hill Education: New Delhi, India, 2013; ISBN 0070494894. [Google Scholar]
  27. Maharjan, S.; Zhang, Y.; Gjessing, S.; Tsang, D.H.K. User-Centric Demand Response Management in the Smart Grid with Multiple Providers. IEEE Trans. Emerg. Top. Comput. 2017, 5, 494–505. [Google Scholar] [CrossRef]
  28. Lampropoulos, I. Energy Management of Distributed Resources in Power System Operations; Technische Universiteit Eindhoven: Eindhoven, The Netherlands, 2014; ISBN 9789038635972. [Google Scholar]
  29. Palensky, P.; Dietrich, D. Demand Side Management: Demand Response, Intelligent Energy Systems, and Smart Loads. IEEE Trans. Ind. Inform. 2011, 7, 381–388. [Google Scholar] [CrossRef] [Green Version]
  30. Adika, C.O.; Wang, L. Smart Charging and Appliance Scheduling Approaches to Demand Side Management. Int. J. Electr. Power Energy Syst. 2014, 57, 232–240. [Google Scholar] [CrossRef]
  31. Althaher, S.; Member, S.; Mancarella, P.; Member, S. Management System Under Dynamic Pricing. IEEE Trans. Smart Grid 2015, 6, 1874–1883. [Google Scholar] [CrossRef]
  32. Abid, S.; Alghamdi, T.A.; Haseeb, A.; Wadud, Z.; Ahmed, A.; Javaid, N. An Economical Energy Management Strategy for Viable Microgrid Modes. Electronics 2019, 8, 1442. [Google Scholar] [CrossRef] [Green Version]
  33. Niro, G.; Salles, D.; Alcântara, M.V.P.; Da Silva, L.C.P. Large-Scale Control of Domestic Refrigerators for Demand Peak Reduction in Distribution Systems. Electr. Power Syst. Res. 2013, 100, 34–42. [Google Scholar] [CrossRef]
  34. Manzoor, A.; Javaid, N.; Ullah, I.; Abdul, W.; Almogren, A.; Alamri, A. An Intelligent Hybrid Heuristic Scheme for Smart Metering Based Demand Side Management in Smart Homes. Energies 2017, 10, 1258. [Google Scholar] [CrossRef] [Green Version]
  35. Hafeez, G.; Alimgeer, K.S.; Wadud, Z.; Khan, I.; Usman, M.; Qazi, A.B.; Khan, F.A. An Innovative Optimization Strategy for Efficient Energy Management with Day-Ahead Demand Response Signal and Energy Consumption Forecasting in Smart Grid Using Artificial Neural Network. IEEE Access 2020, 8, 84415–84433. [Google Scholar] [CrossRef]
  36. Akpojedje, F.O.; Ogujor, E.A. Demand Side Management Strategy for Alleviating Power Shortages in Nigerian Power System: A Case Study. Niger. J. Technol. 2021, 40, 927–937. [Google Scholar] [CrossRef]
  37. Muneer, A.; Jauhar, T.A.; Qaisar, A.; Amjad, F. Demand Side Management and the Improved Energy Cost Factor of Distributed Energy Generation. Eng. Proc. 2022, 12, 104. [Google Scholar] [CrossRef]
  38. Islam, M.A.; Saimon, S.A.; Chowdhury, M.E.H.; Mostafa, S.M.G.; Al Masud, M.A.; Alam, M.S. Demand Side Management in a Model House for Better Load Profile in the Perspective of Bangladesh. In Proceedings of the 2021 5th International Conference on Electrical Engineering and Information Communication Technology (ICEEICT), Dhaka, Bangladesh, 18–20 November 2021. [Google Scholar] [CrossRef]
  39. Ahmad, A.; Khan, A.; Javaid, N.; Hussain, H.M.; Abdul, W.; Almogren, A.; Alamri, A.; Niaz, I.A. An Optimized Home Energy Management System with Integrated Renewable Energy and Storage Resources. Energies 2017, 10, 549. [Google Scholar] [CrossRef] [Green Version]
  40. Ahmed, M.S.; Mohamed, A.; Homod, R.Z.; Shareef, H. Hybrid LSA-ANN Based Home Energy Management Scheduling Controller for Residential Demand Response Strategy. Energies 2016, 9, 716. [Google Scholar] [CrossRef] [Green Version]
  41. Gupta, I.; Anandini, G.N.; Gupta, M. An Hour Wise Device Scheduling Approach for Demand Side Management in Smart Grid Using Particle Swarm Optimization. In Proceedings of the 2016 National Power Systems Conference (NPSC), Bhubaneswar, India, 19–21 December 2016. [Google Scholar] [CrossRef]
  42. Hossain, M.A.; Pota, H.R.; Squartini, S.; Abdou, A.F. Modified PSO Algorithm for Real-Time Energy Management in Grid-Connected Microgrids. Renew. Energy 2019, 136, 746–757. [Google Scholar] [CrossRef]
  43. Gudi, N.; Wang, L.; Devabhaktuni, V. A Demand Side Management Based Simulation Platform Incorporating Heuristic Optimization for Management of Household Appliances. Int. J. Electr. Power Energy Syst. 2012, 43, 185–193. [Google Scholar] [CrossRef]
  44. Nawaz, A.; Hafeez, G.; Khan, I.; Jan, K.U.; Li, H.; Khan, S.A.; Wadud, Z. An Intelligent Integrated Approach for Efficient Demand Side Management with Forecaster and Advanced Metering Infrastructure Frameworks in Smart Grid. IEEE Access 2020, 8, 132551–132581. [Google Scholar] [CrossRef]
  45. Zhu, J.; Lin, Y.; Lei, W.; Liu, Y.; Tao, M. Optimal Household Appliances Scheduling of Multiple Smart Homes Using an Improved Cooperative Algorithm. Energy 2019, 171, 944–955. [Google Scholar] [CrossRef]
  46. Degefa, M.Z.; Sale, H.; Petersen, I.; Ahcin, P. Data-Driven Household Load Flexibility Modelling: Shiftable Atomic Load. In Proceedings of the 2018 IEEE PES Innovative Smart Grid Technologies Conference Europe (ISGT-Europe), Sarajevo, Bosnia and Herzegovina, 21–25 October 2018; pp. 5–10. [Google Scholar] [CrossRef] [Green Version]
  47. Denholm, P.; Ong, S.; Booten, C. Using Utility Load Data to Estimate Demand for Space Cooling and Potential for Shiftable Loads; National Renewable Energy Lab: Golden, CO, USA, 2012; p. 23. [Google Scholar]
  48. Winch Energy Completes Funding for African Solar Projects|Energy Global. Available online: https://www.energyglobal.com/special-reports/17022021/winch-energy-completes-funding-for-african-solar-projects/ (accessed on 19 May 2022).
  49. Lundstrom, B.; Patel, S.; Attree, S.; Salapaka, M.V. Fast Primary Frequency Response Using Coordinated Der and Flexible Loads: Framework and Residential-Scale Demonstration. In Proceedings of the 2018 IEEE Power & Energy Society General Meeting (PESGM), Portland, OR, USA, 5–10 August 2018; pp. 1–5. [Google Scholar] [CrossRef]
  50. Babu, P.R.; Divya, V.P.S. Application of ANN and DSM Techniques for Peak Load Management a Case Study. In Proceedings of the 2008 IEEE Region 8 International Conference on Computational Technologies in Electrical and Electronics Engineering, Novosibirsk, Russia, 21–25 July 2008; pp. 384–388. [Google Scholar] [CrossRef]
  51. Macedo, M.N.Q.; Galo, J.J.M.; De Almeida, L.A.L.; De, A.C. Demand Side Management Using Artificial Neural Networks in a Smart Grid Environment. Renew. Sustain. Energy Rev. 2015, 41, 128–133. [Google Scholar] [CrossRef]
  52. Akmam Naamandadin, N.; Jian Ming, C.; Azani Mustafa, W. Relationship between Solar Irradiance and Power Generated by Photovoltaic Panel: Case Study at UniCITI Alam Campus, Padang Besar, Malaysia. J. Adv. Res. Eng. Knowl. 2018, 5, 16–20. [Google Scholar]
  53. Prasad, J.; Jain, T.; Sinha, N.; Rai, S. Load Shifting Based DSM Strategy for Peak Demand Reduction in a Microgrid. In Proceedings of the 2020 International Conference on Emerging Frontiers in Electrical and Electronic Technologies (ICEFEET), Patna, India, 10–11 July 2020. [Google Scholar] [CrossRef]
  54. Moghaddam, M.P.; Abdollahi, A.; Rashidinejad, M. Flexible Demand Response Programs Modeling in Competitive Electricity Markets. Appl. Energy 2011, 88, 3257–3269. [Google Scholar] [CrossRef]
  55. Moghimi, M.; Leskarac, D.; Bennett, C.; Lu, J.; Stegen, S. Rule-Based Energy Management System in an Experimental Microgrid with the Presence of Time of Use Tariffs. MATEC Web Conf. 2016, 70, 10011. [Google Scholar] [CrossRef]
  56. Diyan, M.; Silva, B.N.; Han, K. A Multi-Objective Approach for Optimal Energy Management in Smart Home Using the Reinforcement Learning. Sensors 2020, 20, 3450. [Google Scholar] [CrossRef]
  57. Lu, R.; Hong, S.H.; Yu, M. Demand Response for Home Energy Management Using Reinforcement Learning and Artificial Neural Network. IEEE Trans. Smart Grid 2019, 10, 6629–6639. [Google Scholar] [CrossRef]
  58. Bhongade, S. Demand-Side Management in an Indian Village. J. Inst. Eng. Ser. B 2021, 103, 63–71. [Google Scholar] [CrossRef]
Figure 1. Different demand-side management (DSM) techniques adapted from [28].
Energies 15 05215 g001
Figure 2. Microgrid Simulink model of the case study (image sources [48]).
Energies 15 05215 g002
Figure 3. Simulink model of deferrable and non-deferrable loads (image sources adapted from [49]).
Energies 15 05215 g003
Figure 4. Block diagram of energy inlets and outlets to and from the microgrid.
Energies 15 05215 g004
Figure 5. Neural network basic scheme.
Energies 15 05215 g005
Figure 6. Training performance and regression plots.
Energies 15 05215 g006
Figure 7. Flow chart of the proposed algorithm.
Energies 15 05215 g007
Figure 8. Simulink energy management model through load shifting (LS) using a neural network.
Energies 15 05215 g008
Figure 9. Simulink energy management model through peak clipping (PC) using a neural network.
Energies 15 05215 g009
Figure 10. Bunjako daily load profile spanning from July to September 2021.
Energies 15 05215 g010
Figure 11. Median, average, maximum and minimum power consumed from Bunjako microgrid (from July to September 2021).
Energies 15 05215 g011
Figure 12. Variation in power consumed for different days of the week.
Energies 15 05215 g012
Figure 13. Measured power (22–28 February 2022).
Energies 15 05215 g013
Figure 14. Measured irradiance (22–28 February 2022).
Energies 15 05215 g014
Figure 15. Comparisons between average hourly power consumed (in kW) and minimum daily irradiance (in W/m2) measured at Bunjako (22–28 February 2022).
Energies 15 05215 g015
Figure 16. Comparisons between average hourly power consumed (in kW, doted line) and estimated solar power generated (in kW, dashed line) at Bunjako Island (22–28 February 2022).
Energies 15 05215 g016
Figure 17. Simulink measurement results before the application of DSM in Bunjako Island.
Energies 15 05215 g017
Figure 18. Load profile before and after DSM (peak clipping) in Bunjako Island.
Energies 15 05215 g018
Figure 19. Load profile before and after DSM (load-shifting), 24 h system, Bunjako Island.
Energies 15 05215 g019
Figure 20. Load profile before and after DSM (peak-clipping and load-shifting).
Energies 15 05215 g020
Figure 21. Comparison of solar generation and demand before and after DSM.
Energies 15 05215 g021
Figure 22. PAR values for load shifting and peak clipping for the case of Bunjako Island, July–September 2021.
Energies 15 05215 g022
Table 1. Load profile before and after DSM for households in Bangladesh adapted from [38].
Measure for DSMTotal (in kWh)Power Saved with DSM (in kWh)Power Saved (in %)
Without DSM4700
Energy efficiency331429.78
Dynamic load control4348.51
Load shifting4700
Table 2. Household appliances categories, ratings and hours of operation [23,44].
Appliance CategoryAppliance NamePower Rating
(kW)
Hours of
Operation/Day
Shiftable interruptiblePersonal computer0.034
Microwave1.50.5
Pump (41 m, 75 LPM)0.94
Shiftable non-interruptibleBlender0.34
Iron12
Washing machine0.52
ConsistencyRefrigerator0.36
Fan0.058
Water Purifier0.59
Table 3. Statistical parameters of profiles before and after DSM.
Statistical ValueOriginal ProfileLoad ShiftingPeak Clipping
Maximum power (kW)8.9708.8906.170
Minimum power (kW)2.2002.2002.200
Peak to peak power (kW)6.7706.6903.970
Mean power (kW)4.8994.9033.645
Median power (kW)4.9895.0002.899
RMS power (kW)5.2895.1903.873
Maximum load hour191213
Minimum load hour444
PAR1.8311.8131.693
% Peak reduction0.000%0.892%31.215%
Publisher’s Note: MDPI stays neutral with regard to jurisdictional claims in published maps and institutional affiliations.