Article

Methane Hydrate Behavior for Water–Oil Systems Containing CTAB and Synperonic PE/F127 Surfactants

by
Antonio Pavón-García
1,
Abel Zúñiga-Moreno
2,
Ricardo García-Morales
1,
Hugo I. Pérez-López
1 and
Octavio Elizalde-Solis
1,*
1
Departamento de Ingeniería Química Petrolera and Sección de Estudios de Posgrado e Investigación, Escuela Superior de Ingeniería Química e Industrias Extractivas, Instituto Politécnico Nacional, UPALM, Ed. 8, Lindavista, Ciudad de México 07738, Mexico
2
Laboratorio de Investigación en Fisicoquímica y Materiales, Departamento de Ingeniería Química Industrial, Escuela Superior de Ingeniería Química e Industrias Extractivas, Instituto Politécnico Nacional, Edif. Z-5, 2° piso, UPALM, Lindavista, Ciudad de México 07738, Mexico
*
Author to whom correspondence should be addressed.
Energies 2022, 15(14), 5213; https://doi.org/10.3390/en15145213
Submission received: 18 May 2022 / Revised: 5 July 2022 / Accepted: 15 July 2022 / Published: 19 July 2022
(This article belongs to the Special Issue Exploitation of Geological Resources in Unconventional Reservoirs)

Abstract

:
Methane hydrates were studied in systems containing aqueous dissolved surfactants in oil emulsions with a volume ratio of 40/60. Two commercial surfactants, named synperonic PE/F127 and cetyltrimethylammonium bromide, were evaluated at 0, 350, 700 and 1500 ppm. Experiments were made by applying the cooling–heating path in an isochoric high-pressure cell at different initial pressures of 5.5, 8.0, 10.0 and 12.0 MPa. The obtained parameters were induction time, temperature onset, pressure drop, and dissociation conditions. The results revealed that the dissociation curve for methane in water-in-oil emulsions was not modified by the surfactants. The crystallization (onset) temperature was higher using synperonic PE/F127 in comparison with zero composition, while the opposite occurred with cetyltrimethylammonium bromide. Both surfactants induced a delaying effect on the induction time and a lesser pressure drop.

Graphical Abstract

1. Introduction

Gas hydrates are formed by gas encapsulation in a crystalline structure made up of water. Three predominant factors intervene in its formation: the moisture presence in the gas, low temperatures near or below the normal water freezing point, and high pressure. Interest in gas hydrates began due to the clogging problem during oil and gas transportation in flow assurance. Currently, the application of additives to prevent hydrate formation continues and is still fundamental [1].
Regarding the mitigation of hydrate formation by chemicals, these are classified into two broad categories: thermodynamic hydrate inhibitors (THIs) and low dosage hydrate inhibitors (LDHIs). The latter in turn is divided into two groups: kinetic inhibitors (KHIs) and anti-agglomerant agents (AAs). THIs are aimed on changing the temperature and pressure conditions where gas hydrates are formed toward lower temperatures and higher pressures. Then, the liquid–hydrate–gas (Lw-H-G) equilibrium line is moved to the left in a pressure–temperature diagram. Nevertheless, the abovementioned conditions represent a disadvantage since these are achieved at a high dosage of chemicals: methanol, ethylene glycol and triethylene glycol are clear examples for THIs [1,2,3].
Conversely, KHIs have been applied due to their ability for delaying the hydrate nucleation time, and more importantly, for slowing down the hydrate growth rate. Surfactants such as Synperonic PE/F127 and cetyl-trimethyl-ammonia bromide (CTAB) are some cases. Moreover, AAs, such as quaternary ammonium salts, are surface-active substances whose action mechanism consists of producing a liquid current (slurry) that can be transported through the pipeline; hence, these chemicals allow for gas hydrate formation but decrease the cohesive forces between particles, preventing the hydrate adhesion to the pipeline wall. This causes the hydrate to travel along with the gas stream, until the current reaches higher temperature and lower pressure conditions to allow for gas hydrate dissociation into its original components [2,3,4,5,6].
The study of gas hydrates using different chemicals in systems containing water in oil is necessary to develop technology for ensuring gas and oil transportation, as well as the safe exploitation of gas hydrate sources. Some investigations about the formation and dissociation process have been carried out elsewhere [6,7,8,9,10,11,12,13,14,15,16,17,18,19,20,21].
Lv et al. investigated the self-preservation effect of methane hydrates in water + oil (represented by diesel sample) dispersion systems by using two inhibitors: tetra-n-butylammonium bromide (TBAB) and Lubrizol. The experiments were carried out using low- and high-water cuts. The addition of surfactants, able to lower hydrate particle size, could weaken the self-preservation effect at low water cuts attributed to surface absorption, as well as the structure and morphology alterations of ice film. Conversely, surfactants enhanced the self-preservation effect in systems containing oil at high water cuts due to kinetics and dispersion characteristics; however, the effect became increasingly suppressed as the oil content increased [6]. Turner et al. studied methane hydrate formation in a water-in-oil emulsion by controlling the water droplets size dispersed in crude oil. The Focus Beam Reflectance Measurement Probe inserted in the autoclave validated the preservation of the size distribution for water droplets in crude oil during the hydrate particle formation; as a concluding remark, water droplets behaved as individual reactors, producing gas hydrate particles. The primary mechanism for the conversion of droplets to hydrates appeared to be the hydrate layer formation on the outside of the droplet followed by the gradual conversion toward the core [15]. Shestakov et al. performed constant cooling ramp and isothermal methods to appraise the temperature dependence on the methane hydrate nucleation rate on a 50 wt% water-in-oil emulsion. The nucleation in the complex systems occurred on different nucleation centers; thus, its mechanism could not be described by the classical theory, and a new approach was proposed based on the analysis of isothermal survival curves [16]. Tong et al. determined the effect of dissolved wax (less than 5%) on the hydrate formation in water-in-oil emulsions (5:1). Wax crystals impeded the nucleation rate rising and delayed nucleation since the mass transfer resistance reduced hydrate strength, increased hydrate porosity, and inhibited heat transfer during hydrate decomposition [17]. Daraboina et al. analyzed the natural gas hydrate formation in gas–crude oil–water (with and without dissolved salts) systems where the Luvicap Bio (a commercial formulation based on PVCap polymer) was tested. Three different crude oils were used in the experiments. The temperature of hydrate formation diminished in the presence of crude oil and was affected by the crude oil type. In addition, the kinetic inhibitor effectiveness was not affected by salts but decreased significantly in crude oil [18]. Stoporev et al. checked out the nucleation rate for water in different oil samples via the analysis of survival curves using the isothermal method. The results indicated that induction time was proportional to oil density, and the opposite trend was obtained for nucleation rates [19].
Therefore, our contribution is centered in the flow assurance field, where the operating pressure for offshore pipelines can reach 12 MPa [22], and there could be the risk of blockage associated with gas hydrates and wax precipitation; furthermore, a high content of water cuts can be reached from mature fields [23]. Two surfactants, synperonic PE/F127 and CTAB, were evaluated in the methane hydrate formation–dissociation processes for systems containing water-in-oil emulsions. Dissociation condition, temperature onset, induction time and pressure drop were determined with a volume ratio of 40/60 water in oil at initial pressures ranging from 5.5 to 12.0 MPa and surfactant concentration in the interval of 0–1500 ppm.

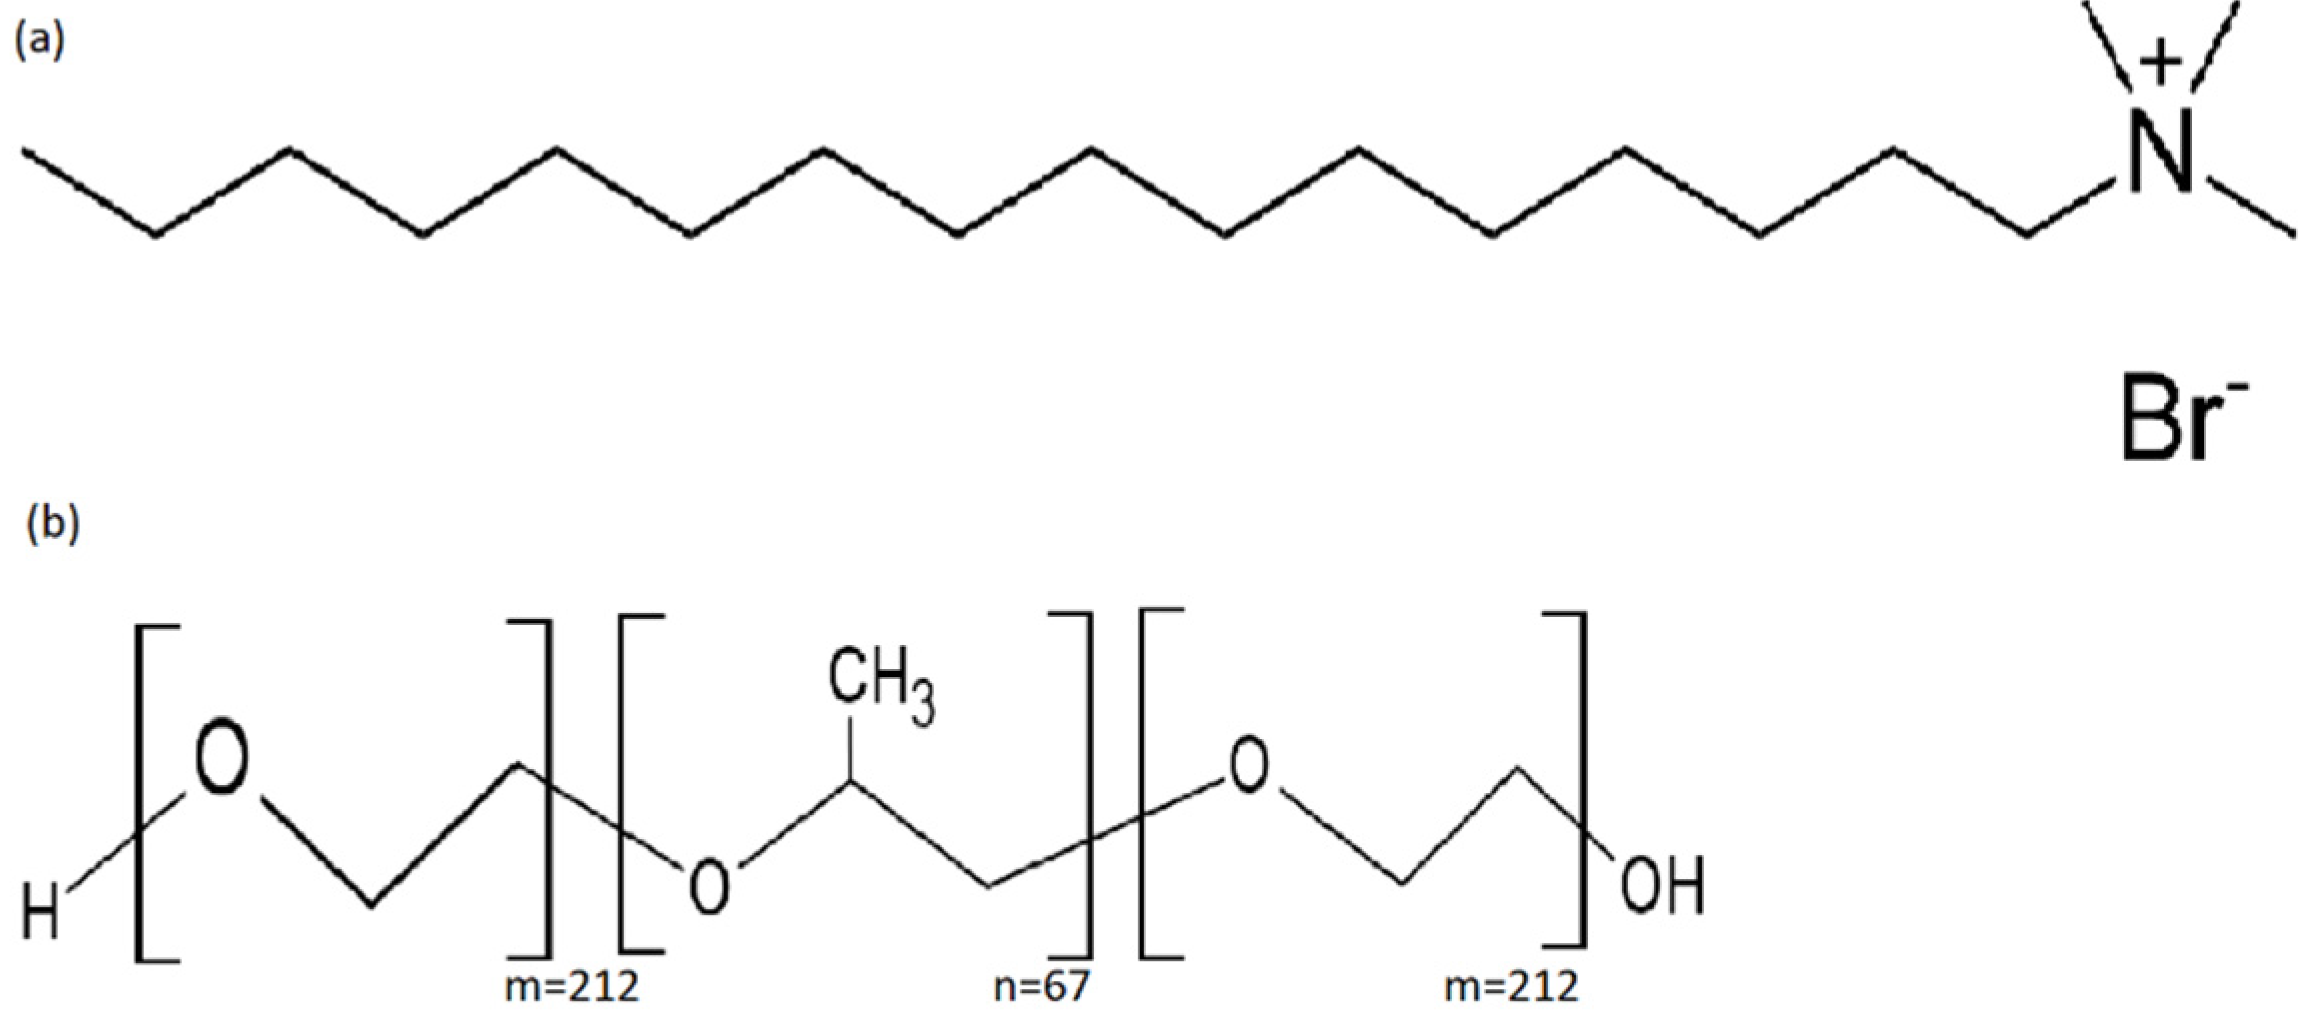
2. Materials and Methods

Synperonic PE/F127 was acquired from Uniqema, and cetyltrimethylammonium bromide (CTAB) was provided by Sigma-Aldrich (St. Louis, MO, USA). Both chemical structures are depicted in Figure 1. CTAB is a cationic surfactant with positive charge conferred by a hydrophilic head, while the hydrophobic tail is constituted by an alkyl chain. The polymeric surfactant, synperonic PE/F127, has a polyethylene oxide (PEO)–polypropylene oxide (PPO)–polyethylene oxide (PEO) structure with 212 PEO units and 67 PPO units. The hydrophilic group is assigned to PEO, and the hydrophobic group is conferred to PPO. Deionized water has a resistivity of 18.2 MΩ-cm pretreated in a Barnstead Easypure II RF, and high purity methane (99.99%) was supplied by Gas Innovations.
The oil sample was obtained from the Tekel reservoir located in the Campeche basin, Gulf of Mexico. Oil was characterized, and the results are listed in Table 1. The ASTM D2007-11 standard test [24] was applied to obtain the SARA analysis, and the API gravity was determined according to the ASTM D1298-12b standard test method [25]; meanwhile, salt content was determined by using the ASTM D3230-19 standard test [26]. Molecular weight evaluation was carried out in a cryoscope (Precision systems Inc., 5009 Cryette, MA, USA). Oil characterization results specified that the sample belonged to a heavy oil class.
The experimental equipment for gas hydrate measurements is schematically shown in Figure 2. It mainly consists of a high-pressure autoclave of 600 cm3 made of stainless steel (1), a liquid bath controller (2), a pressure manometer (Crystal Engineering, XP2i) (3), a PT-100-Ω probe (4), a temperature (ASL, F200) indicator (9)—the manometer and the probe were calibrated and communicated to a data acquisition system developed with free software—a computer (10), a stirring shaft with a propeller coupled to a motor (5), which has a controller (6), as well as a piston pump (7) and a gas cylinder (8).
The procedure was categorized into the liquid phase emulsion formulation and gas hydrate measurements. Water-in-oil emulsions were prepared with a volume ratio of 40/60, respectively. The disperse phase, comprising the surfactant-diluted aqueous solution, was previously prepared by successive loadings at 0, 350, 700 and 1500 ppm. First, 210 cm3 of the continuous phase composed of heavy oil was placed into a glass beaker submerged in a liquid bath at 298 K. Thereupon, the surfactant aqueous solution was dispersed drop by drop into the oil until the volume ratio achieved 40/60 under mixing conditions at 20,000 rpm through a homogenizer (IKA, Ultra-Turrax) for 5 h. Droplet diameter was measured in an optical microscope (Nikon LV100, NY, USA), with 50X objective and episcopic light illumination coupled to a Fluorescence Illumination System of 120 W (EXCITE 120 EXFO series). For instance, the water droplets were less than 5 μm after emulsion preparation, as shown in Figure 3. Finally, 350 cm3 of water-in-oil emulsion was fed to the high-pressure autoclave immersed in the recirculating liquid bath controller for the gas hydrate experiments. These were performed by the isochoric method with cooling–heating cycles.
At the beginning, the data acquisition system was activated for monitoring variables continuously as depicted in Figure 4. Air was expelled from the entire circuit and the autoclave by degassing with a vacuum pump. Then, agitation was stated at 580 rpm and temperature was set at 293.15 K by turning on the liquid bath regulator. Autoclave pressurization was carried out by feeding methane from the gas cylinder, which flowed through the pump to attain the required initial pressure. After stabilization by detecting variations less than 0.05 MPa and 0.1 K for at least 3 h, the system was cooled down by setting the temperature to 273.15 K. The beginning of gas hydrate formation was detected by the sudden pressure drop and increasing temperature. This process ended when the pressure and temperature became stable. Thereafter, the system was heated at a rate of 2 K/h for formation process analysis; conversely, a slow constant rate of 0.2 K/h was applied to ensure accurate dissociation conditions using fresh water. The run finished when the temperature reached an initial value of 293.15 K [27,28,29,30].
After 24 h, a new run was able to be performed. Experiments were evaluated thrice to check for repeatability of nucleation, formation and dissociation processes. A new fresh water-in-oil emulsion with the specific surfactant composition was loaded into the autoclave at fixed initial pressure to start again with the new run.

3. Results and Discussion

Temperature, pressure and time were monitored in real time and recorded in files by the data acquisition for all the experimental runs. These parameters were processed with the aim of determining the induction time and pressure drop, as well as the hydrate formation onset and dissociation conditions. In this work, the hydrate formation in water-in-oil emulsions was hypothesized to occur by the proposed shell mechanism, valid for small water droplets in the order of micrometers. Briefly, the nucleation took place around water droplets at the gas-water interface. The porous hydrate shells wrapped the water drops while these were slowly converted to a completely solid hydrate due to a perturbation of the mass transfer in these emulsions [31,32]. The water droplets were less than 5 μm after emulsion preparation. However, the apparatus setup limitations did not allow to completely validate the size preservation of droplets in gas hydrates, and hence this mechanism. Consequently, the profile for water droplets diameter in-situ must be verified in further tests.

3.1. Dissociation

Temperature and pressure dissociation (liquid–hydrate–gas equilibrium) conditions for gas–water-in-oil emulsions with surfactant were obtained by solving two equations: the cooling path from 293.15 to 273.15 K was fitted to a first-order polynomial equation, while the second equation was adjusted from selected data of the heating trajectory whose trend agreed with a straight line. These in turn were taken from the beginning of the break down for the hydrate crystal dissociation. The standard uncertainties from dissociation conditions were within 0.5 K and 0.08 MPa, which were estimated by apprising the linked errors from instrument calibration, linear equations and repeatability [33]. According to Figure 4, methane dissociation conditions for water-in-oil emulsions were not modified in the presence of CTAB or synperonic PE/F127 since both surfactants were dissolved at dosages lower than 1500 ppm. Therefore, CTAB or synperonic PE/F127 were not thermodynamic additives but acted during nucleation and formation processes. The Lw-H-G equilibrium conditions for the methane–water system gathered from a selection [34,35,36,37,38,39,40,41,42,43,44] of the available data sets from the NIST databank [45] are also depicted in Figure 5. The trend between both phase equilibrium curves agreed. Although the dissociation coordinates for the methane–water-in-oil emulsion were observed to have a weak displacement on the right-side with respect to the corresponding sets for the methane–water system, this difference was suggested to belong to experimental error estimated for the uncertainties, in which temperature presented the highest deviation.

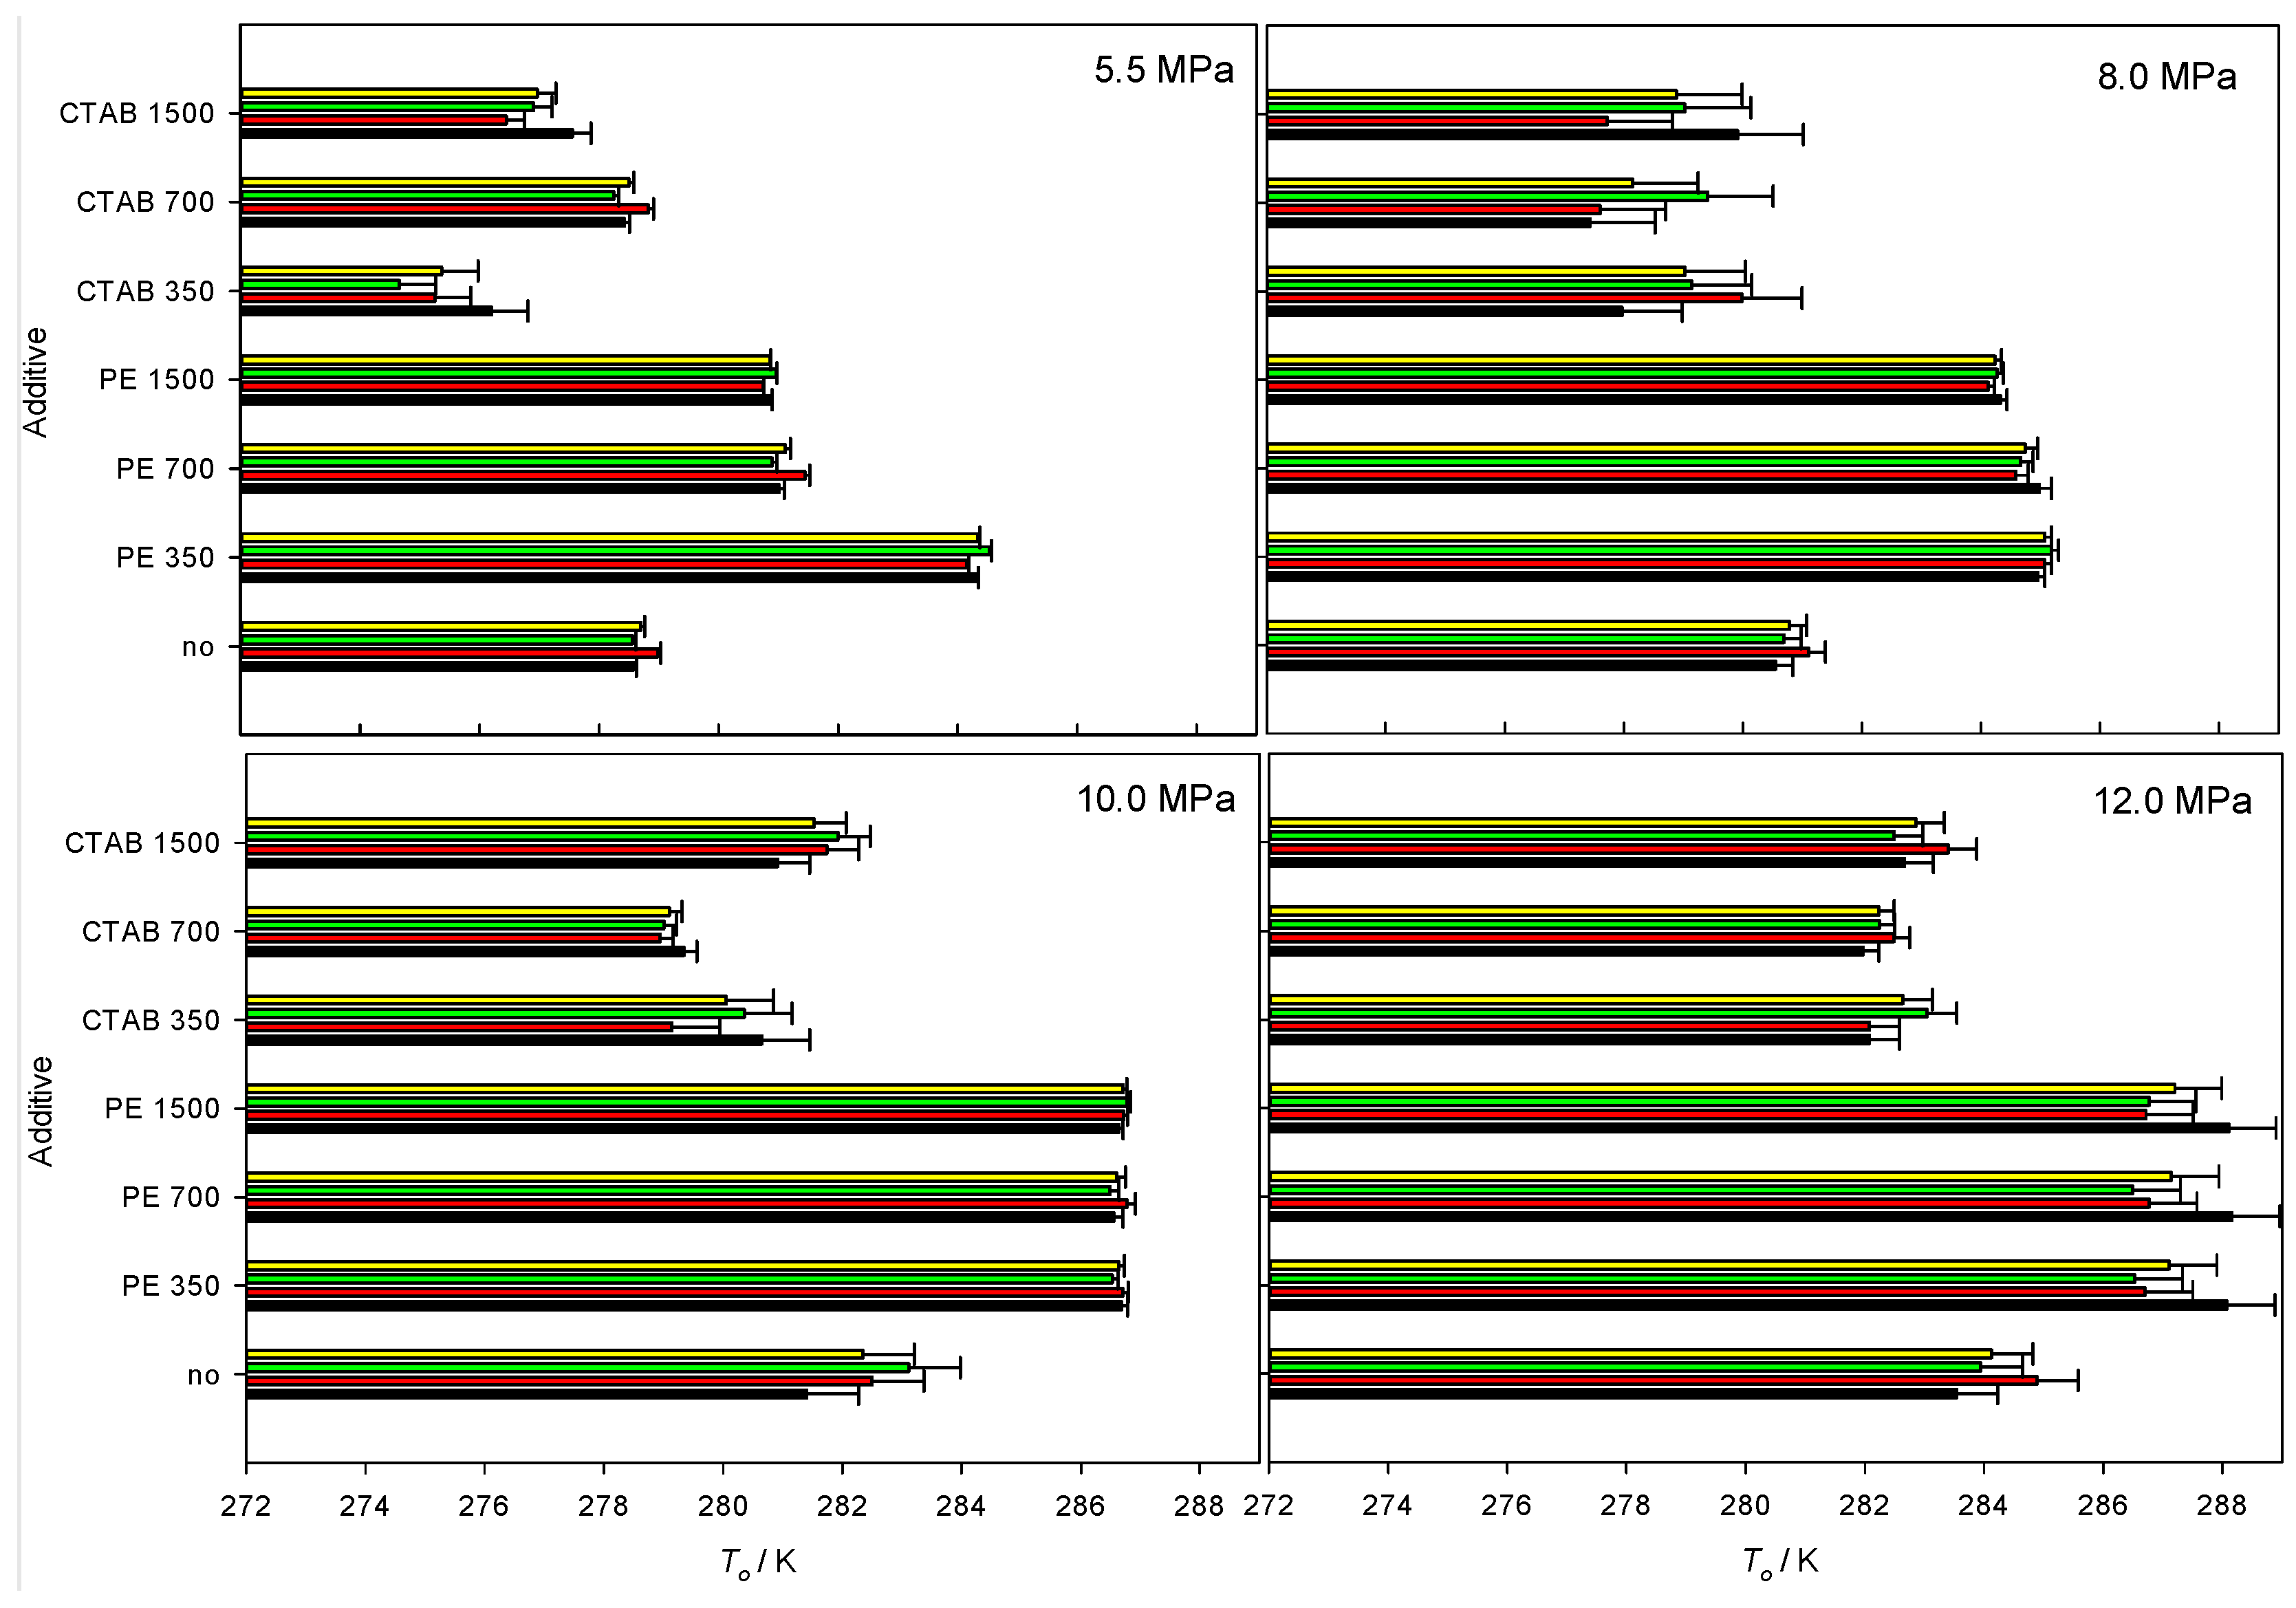
3.2. Temperature Onset

This property was estimated at the beginning of crystal growth while the system was cooling. Temperature onset (To) was detected by the observation of a sudden change in the pressure versus temperature trend. Results for temperature onset are depicted in Figure 6 for the experiments, which was performed as a function of the initial pressure, with error bars corresponding to the standard deviation. Regarding the concentration for synperonic PE/F127, the temperature onset was kept above the required one for hydrate formation, beginning with the methane–water-in-oil emulsion, whose value was To = 278.56 K, run 1; thus, the highest temperature (To = 284.31 K) was attained at the lowest concentration (350 ppm) of polymer and at 5.5 MPa. It was deduced that the polymeric surfactant seemed to reduce the gas–liquid interface and facilitated the formation of the first crystalline structures to assess the hydrate formation onset; this mechanism has been described in detail for promoter agents elsewhere [46]. In contrast, systems with CTAB reached the beginning of crystal formation at a lower temperature in comparison with the absence of the surfactant. Similar to the system containing the synperonic PE/F127, the remarkable effect on the temperature onset was achieved at a low concentration (350 ppm) of CTAB, where To = 276.20 K. Therefore, CTAB retarded temperature onset. Run 2 and run 3 were performed with the aim of obtaining repeatable results and calculating an average from triplicated runs. It could be assumed that the same behavior was observed between fresh and repeatable runs. Although temperature onset was random, To was high for the fresh samples in comparison with runs 2 and 3. A possible blockage in the gas–liquid mass transfer process caused by CTAB due to the hydrophobic activity, which was provoked to reach temperature onset at a lower condition compared with the absence of the surfactant. The contrasting effect on temperature onset gathered with synperonic PE/F127 could be explained with a reduction in the interfacial tension, a common mechanism for polymeric surfactants [5,46,47], and the smaller water droplets observed during the preparation of this emulsion contrasted with the absence of this surfactant. The temperature onset increased as the initial pressure (stated at 5.5–10.0 MPa) increased by taking into account the fixed composition of the surfactant; for instance, To is ordered as follows: 278.56–283.54, 280.88–288.11, and 279.91–282.57 K for compositions at zero, 1500 ppm PE/F127, and 1500 ppm CTAB, respectively.

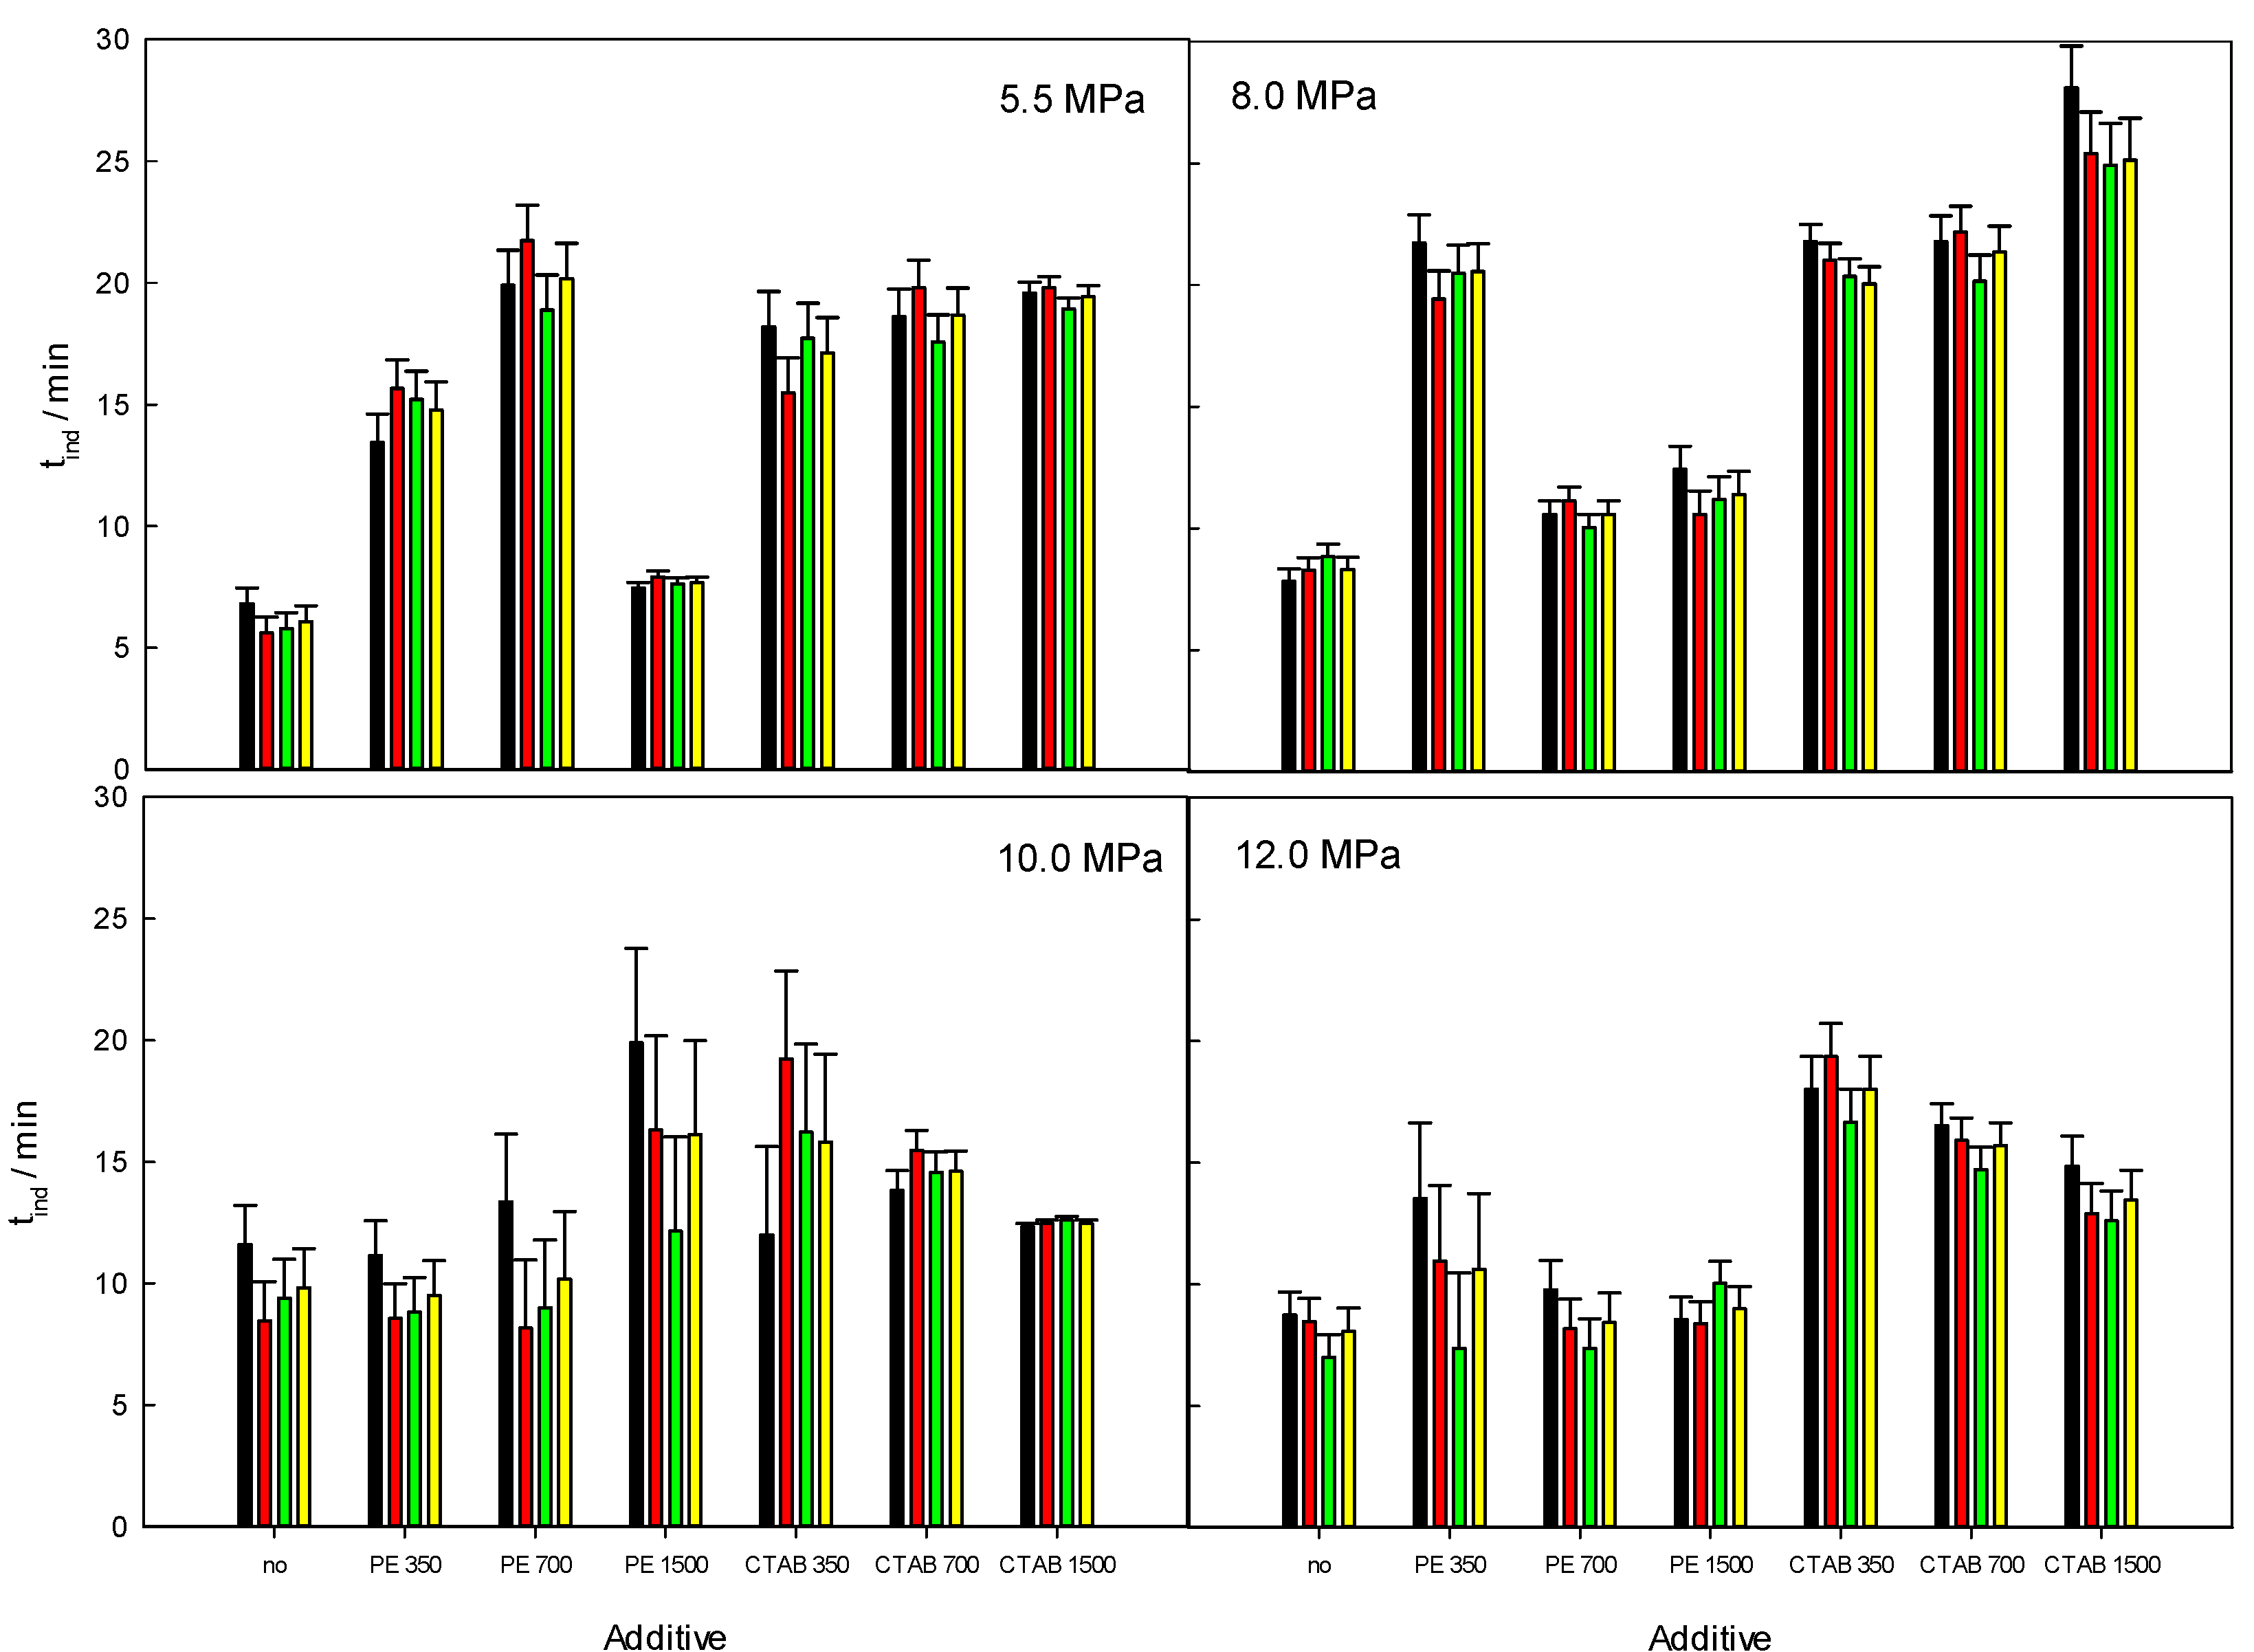
3.3. Induction Time (tind)
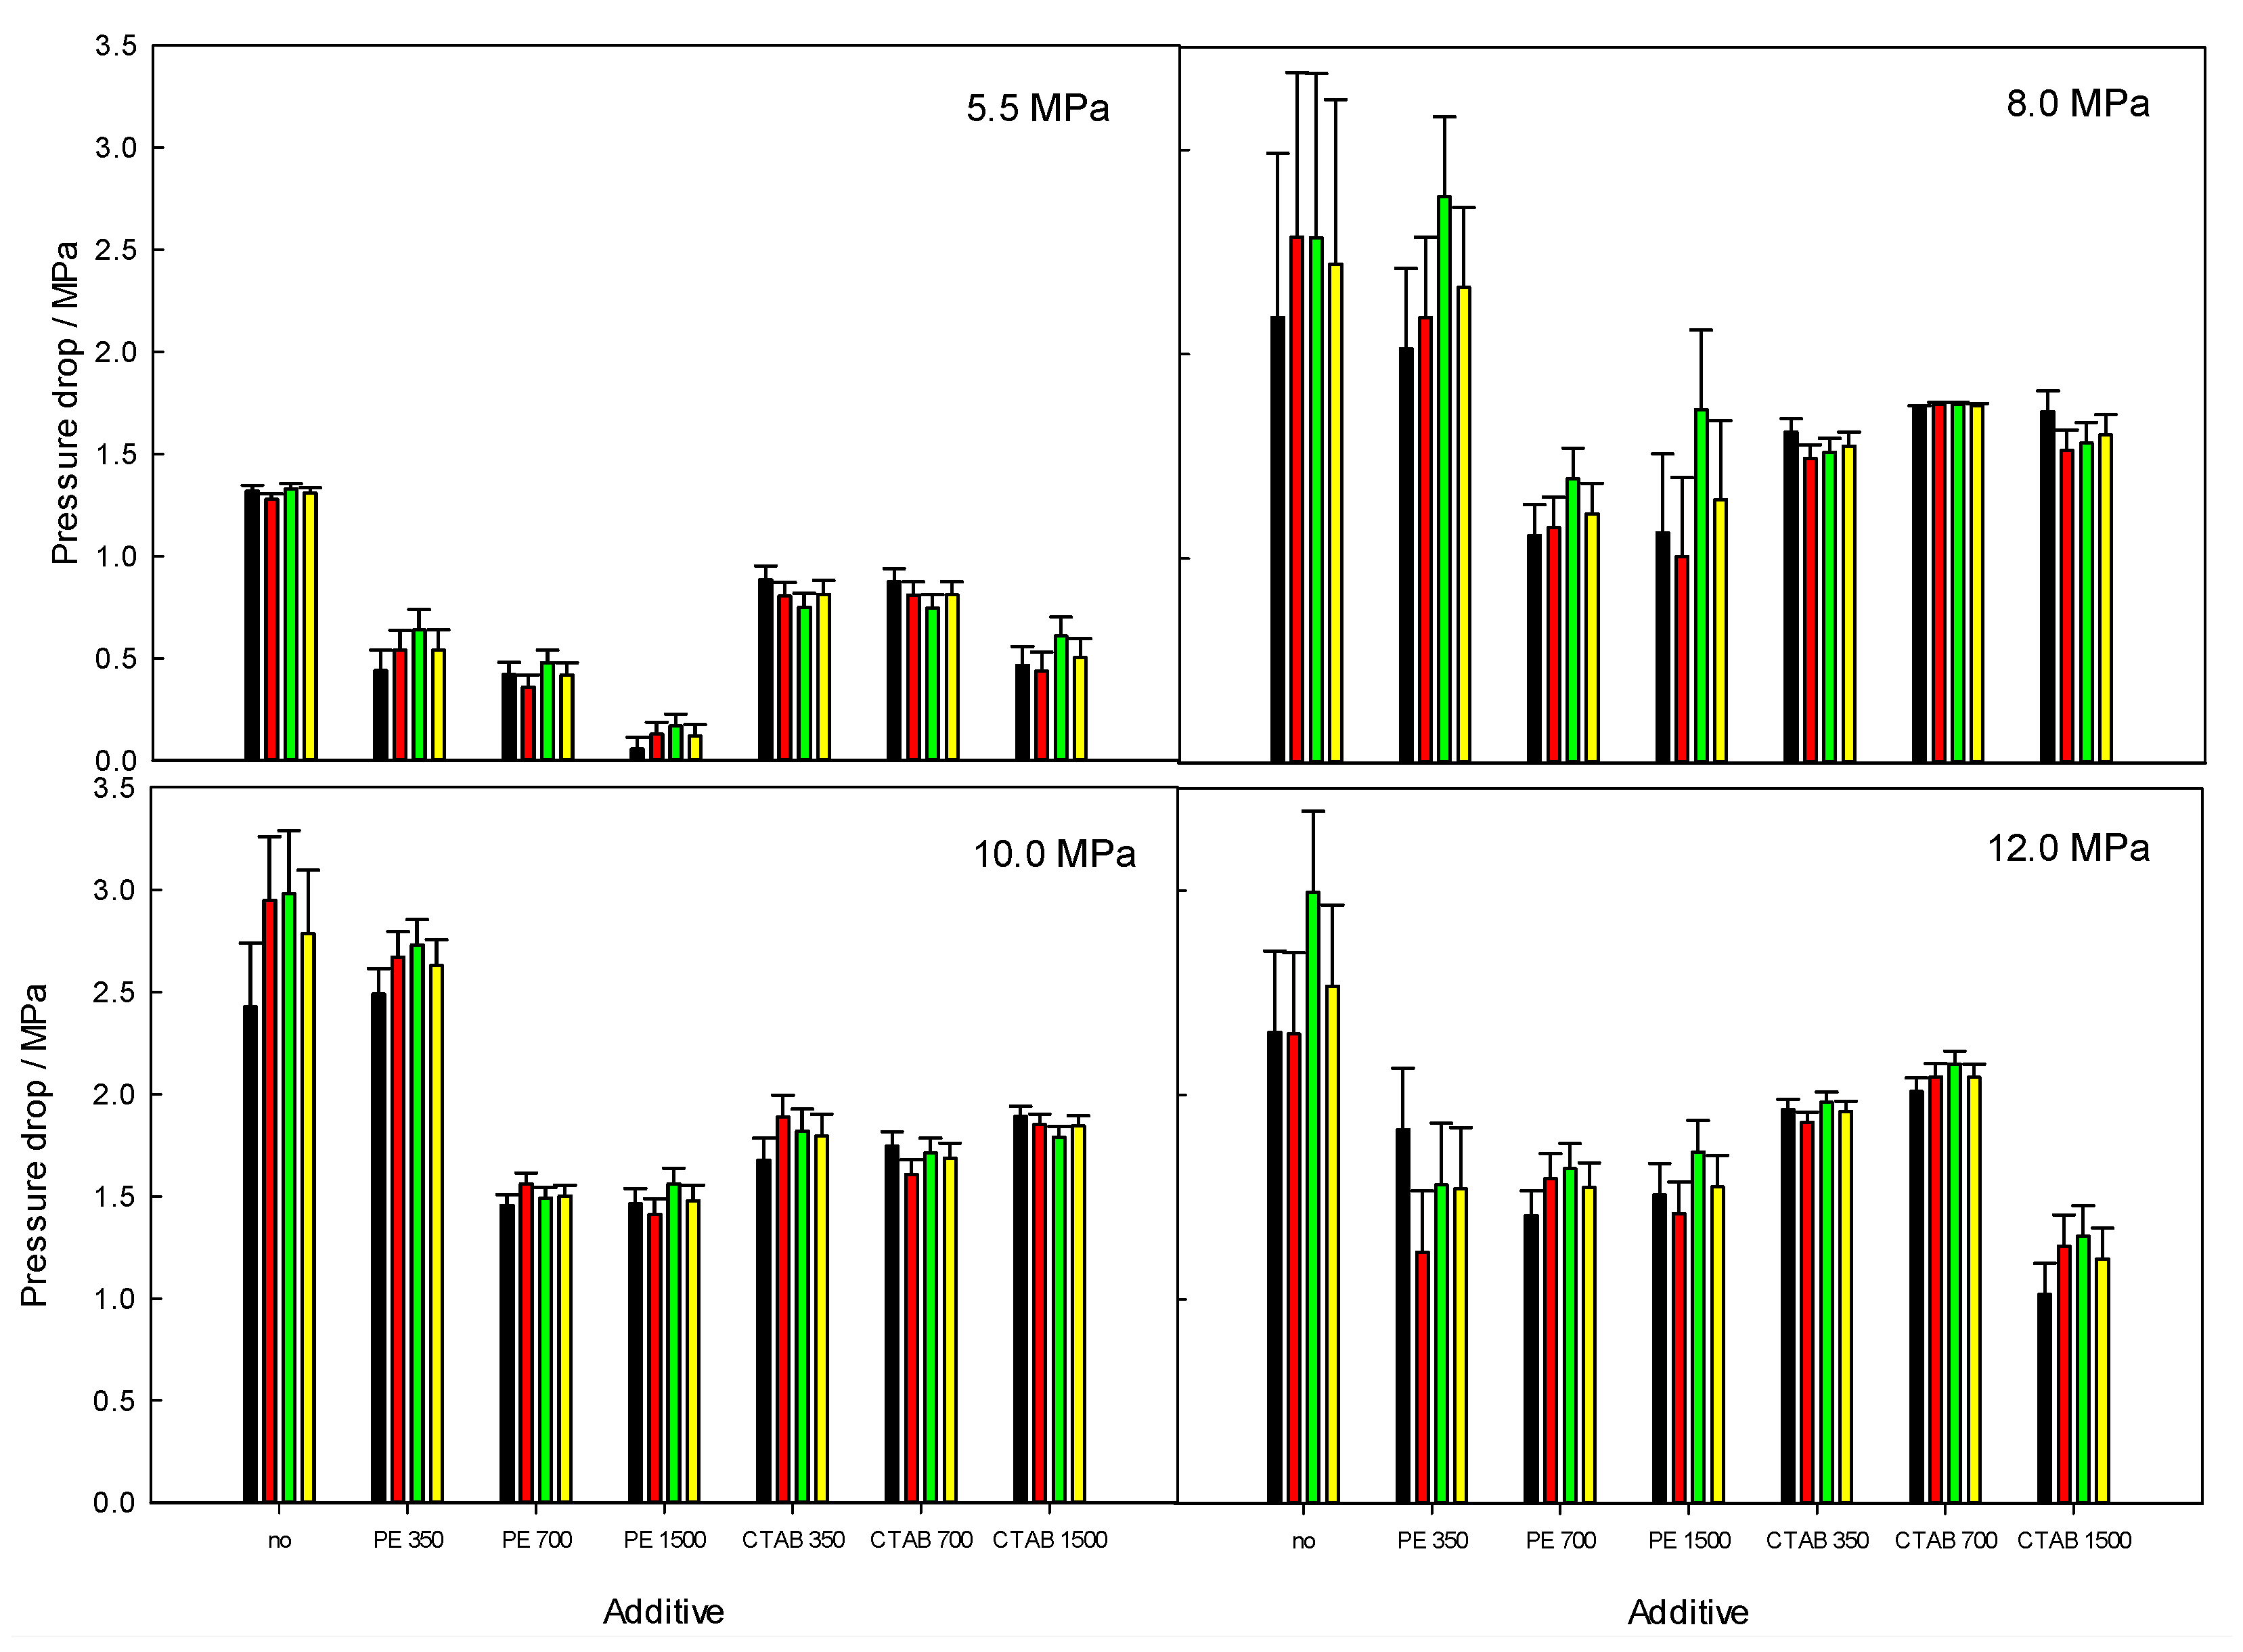
This parameter can be defined as the elapsed time to observe the beginning of a massive methane–hydrate formation at macroscopical level; hence, it was calculated within the cooling path between the dissociation (phase equilibrium) condition and the beginning of the crystal formation, known as temperature and pressure onset. The latter was detected by monitoring a sudden pressure reduction and a remarkable temperature rise due to the exothermicity of the crystallization. Each period is shown in Figure 7 as a function of initial pressure with its related standard deviation. The addition of synperonic PE/F127 at 1500 ppm (5.5 MPa) altered the nucleation period but with the most fragile performance since it looked to be almost the same (tind = 7.46 min run 1, and 7.67 min on average) as the systems in the absence of the surfactant (tind = 6.81 min run 1, and 6.08 min on average). The same effect could be observed at 700 ppm of the surfactant at any initial pressure, except for the experiments performed at 5.5 MPa where the induction time was retarded (19.89 min) for the fresh sample. An unusual inhibition activity was noted at 350 ppm. The parameter evolved as tind = 13.44, 21.73, 11.15 and 12.0 min for run 1 as the initial pressure was rising. There was a strong delay from 5.5 to 8.0 MPa, but the inhibiting effectiveness was diminished at higher pressures (10.0, 12.0 MPa).
Regarding the activity of CTAB during the nucleation process, this surfactant delayed the induction time at any composition or initial pressure; hence, the surfactant worked out as an inhibitor, avoiding an early methane–hydrate formation. Based on the composition effect, CTAB did not exhibit systematic behavior due to the stochastic nature of the nucleation process. This surfactant achieved an outstanding delayed effect at the highest composition with tind = 28.10 min at 8.0 MPa; thus, the additive might be applied for inhibition purposes. These findings could be associated with the excess of additive and its cationic nature, whose hydrophilic–lipophilic balance number (HLB = 10 or 21.4) indicated that the hydrophilic group is dominant on CTAB, and thus, the mass transfer of methane within the water-in-oil emulsion suffered an alteration, since a feasible barrier built by the additive around the water drops prevented the beginning of crystal growth [46,47,48,49,50].
In general, a considerable number of fresh samples (16 events of run 1) showed a higher induction time compared with the repeatable runs (run 2 and run 3). Regarding the stochastic phenomena within the 28 total experiments, contrasting run 2 and run 3, 21 repeatable events for run 2 were observed to have a high induction time against run 3. The influence of surfactant concentration and repeatable runs on the induction time behavior was unusual and confirmed the high sensitivity of the nucleation processes to small changes associated with the heat and mass transfer among the methane–water-in-oil emulsions.
The additive effectiveness could also be estimated by the relative inhibition power (RIP), it was related with the induction time measured with and without the additive (RIP = (tind, additivetind, water)/tind, additive). Therefore, the most powerful inhibition additive was CTAB. The higher the concentration, the greater the restraint at 5.5 and 8.0 MPa; at these pressures, RIP = 1.87 for run 1 and 2.20 on average, and RIP = 2.59 for run 1 and 2.14 on average, respectively. Moreover, the activity of some components in oil such as asphaltenes, resins, paraffins and aromatics played an important role in the water-in-oil emulsions as reported earlier, since asphaltenes interfered with the water–oil interface as well as other chemicals. Nevertheless, the function of a specific individual chemical group on the nucleation and formation processes cannot be directly attributed since there are different mechanisms that could be contrary to a specific behavior. For instance, n-heptane (paraffin) formed an extra layer between the gas and aqueous solution, suggesting that the hydrates were formed in the aqueous solution and liquid hydrocarbon interface and hence prolonged the induction time [8,18,51].
Concerning the induction time at a fixed composition, the theoretical assumption was confirmed for almost all cases following the changes at 5.5, 10 and 12 MPa. Nucleation time tended to be slightly reduced as initial pressure increased because the increment of the driving force was promoted by the pressure rising. Nevertheless, the other sets of induction time reported at 8 MPa did not exhibit a systematic behavior, which could be ascribed to the random mechanism involved on the nucleation process. Consequently, our findings must be validated throughout sufficient measurements to check for the memory effect on the nucleation process.

3.4. Pressure Drop

Pressure drop was calculated as the difference between the beginning of hydrate formation indicated by an abrupt pressure depletion and the complete hydrate growth noted as the minimum pressure during the cooling path in a pressure versus temperature plot. Furthermore, this crystal growth phenomenon can be simultaneously confirmed by the increasing temperature related to the exothermic reaction. The effect of each composition and initial pressure on the pressure drop in the presence of the surfactant in the water-in-oil emulsions is depicted in Figure 8. Contrasting both repeatable and fresh sample events, the pressure drop was observed to be higher for runs 2 and 3 in 21 experiments in detriment of the results observed in run 1; hence, the memory effect probably promoted an increase on pressure depletion. Moreover, asphaltenes, resins and waxes have been reported as natural surfactants in petroleum. These provided a certain stability for the water-in-oil emulsions and created a hindering effect on methane–hydrate cohesion; thus, the formed methane hydrate was reduced [8,14,52,53]. However, the effect of each fraction of each chemical group was not meant to be deeply discussed in this work.
The presence of synperonic PE/F127 and CTAB exhibited an avoiding formation. The pressure change was remarkable in some cases such as 1.32 MPa for run 1 (1.30 MPa on average for zero composition at 5.5 MPa), whereas the values were restricted to 0.05 MPa for run 1 (0.12 MPa on average for 1500 ppm of synperonic PE/F127 at 5.5. MPa). As for the results at 12 MPa, the pressure reduced from 2 MPa for run 1 (2.05 MPa on average without surfactant) to 0.99 MPa for run 1 (1.06 MPa on average at 1500 ppm CTAB). Conversely, the surfactants also restricted pressure depletion with fewer effects for the case of synperonic PE/F127 in some conditions. Values for this parameter in the first run were similar (2.47 and 2.48 MPa) contrasting zero and 350 ppm at 10 MPa, as well as 2.18 and 2.02 MPa in the same order. Pressure drop behavior was proportional to the initial pressure conditions whose values were more noticeable by contrasting 5.5 and 8.0 MPa. This performance was supported based on the assumption that the supersaturation degree increased with the initial pressure increments at a fixed composition. Furthermore, intrinsic phenomena were taking part, such as mass and heat transfer, as well as kinetic mechanisms.
None of the additives promoted methane–hydrate gas consumption in contrast with the absence of an additive. The detriment on pressure drop caused by CTAB was associated with the following stepwise mechanism: the affinity of the hydrophobic tail with the oil-continuous phase allowed for a better solubilization of methane into the oil, and the formed hydrate crystals absorbed the surfactant by the hydrophilic head throughout hydrogen bonds, building a barrier to reduce the contact area between the gas and water [49]. The triblock copolymer functioning obeyed the abovementioned mechanism, but the low inhibition effect on pressure drop observed for the polymeric surfactant could be hypothesized to a lesser barrier (oxygen from PPO- and PEO-built hydrogen bonds with water) and a high contact area contrasting with CTAB [54]. Therefore, a restriction of both surfactants on the mass and heat transfer processes would be deduced since both were entailed on the reduction of hydrate formation after the water drops were covered by the methane–hydrate shells for water in the crude oil systems with a high content of resins and asphaltenes.

4. Conclusions

Two surfactants, synperonic PE/F127 and cetyltrimethylammonium bromide, were evaluated regarding methane–hydrate formation and dissociation processes within water-in-heavy-oil emulsions at low surfactant concentrations. These were 350, 700 and 1500 ppm in a 40/60 (W/O) volume ratio emulsion. Both surfactants did not alter the Lw-H-G phase equilibrium conditions for the W/O system, and it was in agreement with the dissociation curve for the methane–water system. Synperonic PE/F127 seemed to reduce the gas–liquid interphase to boost hydrate formation onset at high temperatures; however, the induction time during the nucleation process was not affected by contrasting with systems without surfactant, apart from some experimental runs where the period was retarded. Conversely, it was assumed that a barrier formed around the water drops limited mass transfer, causing the onset temperature in the presence of CTAB to be perturbated and formed at lower conditions, and which delayed the induction time compared to the methane–water system. The memory effect must be verified in nucleation. During the formation process, CTAB and synperonic PE/F127 induced a low pressure drop associated with a perturbation in the hydrate growth rate. The cationic surfactant inhibited a pressure drop due to a better arrangement for reducing the contact area.

Author Contributions

Conceptualization, A.Z.-M. and O.E.-S.; methodology, A.P.-G. and R.G.-M.; software, R.G.-M.; validation, H.I.P.-L. and A.P.-G.; formal analysis, R.G.-M.; investigation, A.P.-G. and H.I.P.-L.; resources, A.Z.-M. and O.E.-S.; data curation, H.I.P.-L.; writing—original draft preparation, A.Z.-M. and O.E.-S.; writing—review and editing, O.E.-S.; visualization, A.P.-G.; supervision, A.Z.-M. and O.E.-S.; project administration, O.E.-S.; funding acquisition, A.Z.-M. and O.E.-S. All authors have read and agreed to the published version of the manuscript.

Funding

Instituto Politécnico Nacional and CONACyT under the project number A1-S-27000.

Data Availability Statement

Data is contained within the article. The data presented in this study are available in article.

Acknowledgments

This research was supported by the Mexican institutions, Instituto Politécnico Nacional and CONACyT, under the project number A1-S-27000. Special thanks are given to Laboratorio de Reología y Física de la Materia Blanda from Escuela Superior de Física y Matemáticas—Instituto Politécnico Nacional for the valuable assistance with the microscopy images of the emulsions.

Conflicts of Interest

The authors declare no conflict of interest.

References

  1. Sloan, E.D.; Koh, C.A. Clathrate Hydrates of Natural Gases, 3rd ed.; CRC Press Taylor and Francis Group: Boca Raton, FL, USA, 2008. [Google Scholar]
  2. Makogon, T.Y. Handbook of Multiphase Flow Assurance; Elsevier Science & Technology: Cambridge, MA, USA, 2019. [Google Scholar] [CrossRef]
  3. Carroll, J.J. Natural Gas Hydrates, A Guide for Engineers, 2nd ed.; Elsevier Gulf Professional Publishing: Amsterdam, The Netherlands, 2009. [Google Scholar] [CrossRef]
  4. Elechi, V.U.; Ikiensikimama, S.S.; Ajienka, J.A.; Akaranta, O.; Okon, O.E. Mitigation capacity of an eco-friendly locally sourced surfactant for gas hydrate inhibition in an offshore environment. J. Pet. Explor. Prod. Technol. 2021, 11, 1797–1808. [Google Scholar] [CrossRef]
  5. Qin, H.-B.; Zhang, Z.-Y.; Sun, C.-Y.; Chen, G.-J.; Ma, Q.-L.; Ning, Z.-F. Interfacial Tension between Methane and Water Containing Kinetic Hydrate Inhibitor PVP Ramification and Its Emulsification Property. J. Chem. Eng. Data 2017, 62, 2770–2775. [Google Scholar] [CrossRef]
  6. Lv, Y.-N.; Jia, M.-L.; Chen, J.; Sun, C.-Y.; Gong, J.; Chen, G.-J.; Liu, B.; Ren, N.; Guo, S.-D.; Li, Q.-P. Self-Preservation Effect for Hydrate Dissociation in Water + Diesel Oil Dispersion Systems. Energy Fuels 2015, 29, 5563–5572. [Google Scholar] [CrossRef]
  7. Chen, J.; Yan, K.-L.; Jia, M.-L.; Sun, C.-Y.; Zhang, Y.-Q.; Si, S.; Ma, Q.-L.; Yang, L.-Y.; Wang, X.-Q.; Chen, G.-J. Memory Effect Test of Methane Hydrate in Water + Diesel Oil + Sorbitan Monolaurate Dispersed Systems. Energy Fuels 2013, 27, 7259–7266. [Google Scholar] [CrossRef]
  8. Zhang, D.; Huang, Q.; Li, R.; Wang, W.; Zhu, X.; Li, H.; Wang, Y. Effects of waxes on hydrate behaviors in water-in-oil emulsions containing asphaltenes. Chem. Eng. Sci. 2021, 244, 116831. [Google Scholar] [CrossRef]
  9. Wang, Y.; Yao, K.; Lang, X.; Fan, S. Investigation on hydrate-based methane storage properties in water-in-oil emulsion with high water content. CIESC J. 2021, 72, 4872. [Google Scholar] [CrossRef]
  10. Lv, X.; Shi, B.; Zhou, S.; Peng, H.; Lei, Y.; Yu, P. Study on the growth rate of natural gas hydrate in water-in-oil emulsion system using a high-pressure flow loop. RSC Adv. 2018, 8, 36484–36492. [Google Scholar] [CrossRef] [Green Version]
  11. Talatori, S.; Barth, T. Rate of hydrate formation in crude oil/gas/water emulsions with different water cuts. J. Pet. Sci. Eng. 2011, 80, 32–40. [Google Scholar] [CrossRef]
  12. Akhfash, M.; Aman, Z.; Ahn, S.Y.; Johns, M.L.; May, E.F. Gas hydrate plug formation in partially-dispersed water–oil systems. Chem. Eng. Sci. 2016, 140, 337–347. [Google Scholar] [CrossRef]
  13. Stoporev, A.S.; Ogienko, A.G.; Sizikov, A.A.; Semenov, A.P.; Kopitsyn, D.; Vinokurov, V.; Svarovskaya, L.I.; Altunina, L.K.; Manakov, A.Y. Unexpected formation of sII methane hydrate in some water-in-oil emulsions: Different reasons for the same phenomenon. J. Nat. Gas Sci. Eng. 2018, 60, 284–293. [Google Scholar] [CrossRef]
  14. Wang, W.; Huang, Q.; Zheng, H.; Wang, Q.; Zhang, D.; Cheng, X.; Li, R. Effect of wax on hydrate formation in water-in-oil emulsions. J. Dispers. Sci. Technol. 2019, 41, 1821–1830. [Google Scholar] [CrossRef]
  15. Turner, D.; Miller, K.; Sloan, E. Direct conversion of water droplets to methane hydrate in crude oil. Chem. Eng. Sci. 2009, 64, 5066–5072. [Google Scholar] [CrossRef]
  16. Shestakov, V.; Sagidullin, A.; Stoporev, A.; Grachev, E.; Manakov, A. Analysis of methane hydrate nucleation in water-in-oil emulsions: Isothermal vs constant cooling ramp method and new method for data treatment. J. Mol. Liq. 2020, 318, 114018. [Google Scholar] [CrossRef]
  17. Tong, S.; Wang, Z.; Xie, K.; Liu, J.; Zhang, J.; Fu, W.; Sun, B. Experimental Study on the Methane Hydrate Formation in Water-In-Oil Emulsions with Dissolved Wax. In Proceedings of the Abu Dhabi International Petroleum Exhibition & Conference, Abu Dhabi, United Arab Emirates, 9–12 November 2020. [Google Scholar] [CrossRef]
  18. Daraboina, N.; Pachitsas, S.; von Solms, N. Natural gas hydrate formation and inhibition in gas/crude oil/aqueous systems. Fuel 2015, 148, 186–190. [Google Scholar] [CrossRef]
  19. Stoporev, A.; Manakov, A.Y.; Altunina, L.; Strelets, L.A.; Kosyakov, V.I. Nucleation rates of methane hydrate from water in oil emulsions. Can. J. Chem. 2015, 93, 882–887. [Google Scholar] [CrossRef]
  20. Zi, M.; Chen, D.; Wang, J.; Hu, P.; Wu, G. Kinetic and rheological study of methane hydrate formation in water-in-oil emulsion: Effects of emulsion composition and silica sands. Fuel 2019, 255, 115708. [Google Scholar] [CrossRef]
  21. Mu, L.; Li, S.; Ma, Q.-L.; Zhang, K.; Sun, C.-Y.; Chen, G.-J.; Liu, B.; Yang, L.-Y. Experimental and modeling investigation of kinetics of methane gas hydrate formation in water-in-oil emulsion. Fluid Phase Equilibria 2014, 362, 28–34. [Google Scholar] [CrossRef]
  22. Informe de Labores de la CNH, Gobierno de México. Available online: https://www.gob.mx/cms/uploads/attachment/file/65479/informe_labores_14_15.pdf (accessed on 13 May 2022).
  23. Kaiser, M.J.; Siddhartha, N. Gulf of Mexico Decommissioning Trends and Operating Cost Estimation; OCS Study BOEM 2019-023; US Department of the Interior, Bureau of Ocean Energy Management (BOEM): Washington, DC, USA, 2018. [Google Scholar]
  24. ASTM D2007; Standard Test Method for Characteristic Groups in Rubber Extender and Processing Oils and Other Petrole-Um-derived Oils by the Clay-Gel Absorption Chromatographic Metho. ASTM International: Conshohocken, PA, USA, 2016.
  25. ASTM D1298-12b; Standard Test Method for Density, Relative Density, or API Gravity of Crude Petroleum and Liquid Petroleum Products by Hydrometer Method. ASTM International: Conshohocken, PA, USA, 2017.
  26. ASTM D3230; Standard Test Method for Salts in Crude Oil (Electrometric Method). ASTM International: Conshohocken, PA, USA, 2019.
  27. Elizalde-Solis, O.; Díaz-Ibarra, J.A.; Mendo-Sánchez, R.D.; Vega-Díaz, Y.B.; Pérez-López, H.I.; Zúñiga-Moreno, A. Phase Equilibria for Gas Hydrates Formed with Methane or Ethane + Tetra-n-Butylphosphonium Bromide + Water. J. Chem. Eng. Data 2020, 65, 5428–5436. [Google Scholar] [CrossRef]
  28. Sangwai, J.; Oellrich, L. Phase equilibrium of semiclathrate hydrates of methane in aqueous solutions of tetra-n-butyl ammonium bromide (TBAB) and TBAB–NaCl. Fluid Phase Equilibria 2014, 367, 95–102. [Google Scholar] [CrossRef]
  29. Mohammadi, A.; Manteghian, M.; Mohammadi, A.H. Phase equilibria of semiclathrate hydrates for methane+tetra n-butylammonium chloride (TBAC), carbon dioxide+TBAC, and nitrogen+TBAC aqueous solution systems. Fluid Phase Equilibria 2014, 381, 102–107. [Google Scholar] [CrossRef]
  30. Cha, M.; Hu, Y.; Sum, A. Methane hydrate phase equilibria for systems containing NaCl, KCl, and NH 4 Cl. Fluid Phase Equilibria 2016, 413, 2–9. [Google Scholar] [CrossRef]
  31. Turner, D.J.; Miller, K.T.; Sloan, E.D. Methane hydrate formation and an inward growing shell model in water-in-oil dispersions. Chem. Eng. Sci. 2009, 64, 3996–4004. [Google Scholar] [CrossRef]
  32. Lv, X.; Shi, B.; Wang, Y.; Gong, J. Study on Gas Hydrate Formation and Hydrate Slurry Flow in a Multiphase Transportation System. Energy Fuels 2013, 27, 7294–7302. [Google Scholar] [CrossRef]
  33. Lafarge, T.; Possolo, A. The NIST Uncertainty Machine. NCSLI Meas. 2015, 10, 20–27. [Google Scholar] [CrossRef]
  34. Mohammadi, A.H.; Anderson, R.; Tohidi, B. Carbon monoxide clathrate hydrates: Equilibrium data and thermodynamic modeling. AIChE J. 2005, 51, 2825–2833. [Google Scholar] [CrossRef]
  35. Nakamura, T.; Makino, T.; Sugahara, T.; Ohgaki, K. Stability boundaries of gas hydrates helped by methane—structure-H hydrates of methylcyclohexane and cis-1,2-dimethylcyclohexane. Chem. Eng. Sci. 2003, 58, 269–273. [Google Scholar] [CrossRef]
  36. Kharrat, M.; Dalmazzone, D. Experimental determination of stability conditions of methane hydrate in aqueous calcium chloride solutions using high pressure differential scanning calorimetry. J. Chem. Thermodyn. 2003, 35, 1489–1505. [Google Scholar] [CrossRef]
  37. Yang, S.; Cho, S.; Lee, H.; Lee, C. Measurement and prediction of phase equilibria for water + methane in hydrate forming conditions. Fluid Phase Equilibria 2001, 185, 53–63. [Google Scholar] [CrossRef]
  38. Clarke, M.; Bishnoi, P.R. Determination of the activation energy and intrinsic rate constant of methane gas hydrate decomposition. Can. J. Chem. Eng. 2001, 79, 143–147. [Google Scholar] [CrossRef]
  39. Smelik, E.A.; King, H.E. Crystal-growth studies of natural gas clathrate hydrates using a pressurized optical cell. Am. Miner. 1997, 82, 88–98. [Google Scholar] [CrossRef]
  40. Nixdorf, J.; Oellrich, L.R. Experimental determination of hydrate equilibrium conditions for pure gases, binary and ternary mixtures and natural gases. Fluid Phase Equilibria 1997, 139, 325–333. [Google Scholar] [CrossRef]
  41. Mei, D.-H.; Liao, J.; Yang, J.-T.; Guo, T.-M. Experimental and Modeling Studies on the Hydrate Formation of a Methane + Nitrogen Gas Mixture in the Presence of Aqueous Electrolyte Solutions. Ind. Eng. Chem. Res. 1996, 35, 4342–4347. [Google Scholar] [CrossRef]
  42. Hütz, U.; Englezos, P. Measurement of structure H hydrate phase equilibrium and the effect of electrolytes. Fluid Phase Equilibria 1996, 117, 178–185. [Google Scholar] [CrossRef]
  43. Dickens, G.R.; Quinby-Hunt, M.S. Methane hydrate stability in seawater. Geophys. Res. Lett. 1994, 21, 2115–2118. [Google Scholar] [CrossRef]
  44. Adisasmito, S.; Frank, R.J.; Sloan, E.D., Jr. Hydrates of carbon dioxide and methane mixtures. J. Chem. Eng. Data 1991, 36, 68–71. [Google Scholar] [CrossRef]
  45. Kroenlein, K.; Muzny, C.D.; Kazakov, A.; Diky, V.V.; Chirico, R.D.; Sloan, E.D.; Frenkel, M. Clathrate Hydrate Physical Property Database, NIST Standard Reference Database. Available online: http://gashydrates.nist.gov (accessed on 22 March 2022).
  46. Chaturvedi, E.; Laik, S.; Mandal, A. A comprehensive review of the effect of different kinetic promoters on methane hydrate formation. Chin. J. Chem. Eng. 2020, 32, 1–16. [Google Scholar] [CrossRef]
  47. Kumar, A.; Bhattacharjee, G.; Kulkarni, B.D.; Kumar, R. Role of Surfactants in Promoting Gas Hydrate Formation. Ind. Eng. Chem. Res. 2015, 54, 12217–12232. [Google Scholar] [CrossRef]
  48. Miraglia, D.B.; Rodríguez, J.L.; Minardi, R.M.; Schulz, P.C. Critical Micelle Concentration and HLB of the Sodium Oleate–Hexadecyltrimethylammonium Bromide Mixed System. J. Surfactants Deterg. 2011, 14, 401–408. [Google Scholar] [CrossRef]
  49. Saikia, T.; Mahto, V. Evaluation of Soy Lecithin as Eco-Friendly Biosurfactant Clathrate Hydrate Antiagglomerant Additive. J. Surfactants Deterg. 2018, 21, 101–111. [Google Scholar] [CrossRef]
  50. Doolaanea, A.A.; Ismail, A.F.H.; Mansor, N.; Nor, N.H.M.; Mohamed, F. Effect of Surfactants on Plasmid DNA Stability and Release from Poly (d,l-lactide-co-glycolide) Microspheres. Trop. J. Pharm. Res. 2015, 14, 1769. [Google Scholar] [CrossRef] [Green Version]
  51. Sharifi, H.; Ripmeester, J.; Walker, V.K.; Englezos, P. Kinetic inhibition of natural gas hydrates in saline solutions and heptane. Fuel 2014, 117, 109–117. [Google Scholar] [CrossRef]
  52. Kar, S.; Kakati, H.; Mandal, A.; Laik, S. Experimental and modeling study of kinetics for methane hydrate formation in a crude oil-in-water emulsion. Pet. Sci. 2016, 13, 489–495. [Google Scholar] [CrossRef] [Green Version]
  53. Song, G.; Ning, Y.; Guo, P.; Li, Y.; Wang, W. Investigation on Hydrate Growth at the Oil–Water Interface: In the Presence of Wax and Surfactant. Langmuir 2021, 37, 6838–6845. [Google Scholar] [CrossRef] [PubMed]
  54. Hezaveh, S.; Samanta, S.; Milano, G.; Roccatano, D. Molecular dynamics simulation study of solvent effects on conformation and dynamics of polyethylene oxide and polypropylene oxide chains in water and in common organic solvents. J. Chem. Phys. 2012, 136, 124901. [Google Scholar] [CrossRef] [PubMed]
Figure 1. Chemical structure for (a) CTAB and (b) synperonic PE/F127.
Energies 15 05213 g001
Figure 2. Experimental equipment.
Energies 15 05213 g002
Figure 3. Microscope images for water-in-oil emulsions at 1500 ppm CTAB.
Energies 15 05213 g003
Figure 4. p, T vs. t during methane hydrate formation and dissociation for water-in-oil emulsions.
Energies 15 05213 g004
Figure 5. Dissociation for methane hydrates [34,35,36,37,38,39,40,41,42,43,44] in water-in-oil emulsions (W/O) with additive.
Energies 15 05213 g005
Figure 6. Temperature onset at different initial pressures: (black) run 1-fresh, (red) run 2, (green) run 3, (yellow) average.
Energies 15 05213 g006
Figure 7. Induction time at different initial pressures: (black) run 1-fresh, (red) run 2, (green) run 3, (yellow) average.
Energies 15 05213 g007
Figure 8. Pressure drop during the formation process at different initial pressures: (black) run 1-fresh, (red) run 2, (green) run 3, (yellow) average.
Energies 15 05213 g008
Table 1. Characteristics of crude oil.
SARAwt%
Saturates13.53
Aromatics15.86
Resins42.83
Asphaltenes27.78
ρ 15 15.56 (g·cm−3)0.9863
°API14.63
MW (g·mol−1)485.25
Salt content (ppm)86
Publisher’s Note: MDPI stays neutral with regard to jurisdictional claims in published maps and institutional affiliations.

