Article

Car Engines Comparative Analysis: Sustainable Approach

Department of Advanced Research in Management, Faculty of Management, Wroclaw University of Economics and Business, Komandorska Str. 118/120, 53-345 Wroclaw, Poland
*
Author to whom correspondence should be addressed.
Energies 2022, 15(14), 5170; https://doi.org/10.3390/en15145170
Submission received: 29 June 2022 / Revised: 13 July 2022 / Accepted: 14 July 2022 / Published: 16 July 2022
(This article belongs to the Special Issue Smart Energy Management for Electric and Hybrid Electric Vehicles)

Abstract

:
The European Union takes significant steps to support the development of the electric sector of the automotive market. This is confirmed by the signed declaration in Glasgow, which leads to a ban on the sale of cars with combustion engines from 2035. This document changes the car industry and makes it dependent on electricity production. The problem identified in this article is the actual impact of implemented solutions concerning the type of engine in cars offered for sale in Czechia, Germany, and Poland. Therefore, the aim of this scientific paper is car engines’ multilevel comparative analysis. The aim of the article is accompanied by a research question: are electric vehicles less harmful to the natural environment? The paper compares cars of the same producer, class, and type with petrol, diesel, hybrid (petrol-electric), and electric engines in terms of the environmental impact. The research method is a comparative SUV analysis supported by the comparison of selected countries’ conditions for electromobility development. The results of this study indicate that vehicles with electric engines emit the least amount of carbon dioxide and are the most environmentally friendly solution in the given comparison criteria.

1. Introduction

One of the widely researched concepts in modern economics [1] and management sciences is sustainable development (SD) and decision-making processes related to this idea [2,3]. These are accompanied by growing expectations coming from the automotive industry, which is looking for solutions to support and simplify the process of achieving sustainability [4,5]. On the other hand, car purchasers’ choices and decisions include performance evaluation and then selection of vehicles based on engine type [6,7]. The choice of a particular car model may be determined not only by economic reasons regarding the consumption of energy carriers but also by considerations of the vehicle’s environmental performance [4,8] in terms of upcoming regulation trends. In numerous reports, electric vehicles (EVs) lead the rankings [2] when environmental performance is the main assessment factor [9]. Although in the early days of vehicle electrification the term “ecological car” was used [10], it has been replaced over time by “zero-emission car” [11] or “green car” [12]. Therefore, the term “green transport” has become very popular because of its association with the reduction in the negative impact of this economic sector on the environment, through the use of the latest technologies [13]. The transition from emission-based to zero-emission, electric-propulsion-type vehicles, is not only a challenge for car manufacturers [14] but also an opportunity for a step towards SD for whole countries [2,15]. It is also a search for new business models and development strategies for organizations [16]. Such changes are accompanied by the development of car-charging infrastructure, which ensures the success of electromobility ventures [4,17].
In research publications, power units are rarely perfectly replicated for the vehicle types being compared. This is especially true for comprehensive comparisons of petrol, diesel, hybrid, and electric engines [4,18]. Therefore, the identified research gap covers not only the theoretical aspect but also the method area in terms of the compared variables or conditions for such comparisons [19]. Not only the engine versions but also the vehicles’ production process, their operation, the sources of energy, and methods of obtaining energy factors to power the cars should be comprehensively evaluated [20]. Consequently, the sustainability aspects that provide the theoretical background for comparisons of automotive power units (engines) and their utilitarian implications to support decision-making become relevant.
The aim of this scientific paper is a multilevel car engine comparative analysis. The main objective of this article is accompanied by the verification of the statement that the environmental performance of a vehicle is dependent on the type of engine. The hypothesis verification is based on checking whether this vehicle emits different pollutant values due to the engine and country of use (and its energy mix implications). A tabular analysis consists of a comparison of powertrains of SUVs (abbreviation for Sport Utility Vehicles): petrol engine, diesel engine, hybrid engine, and electric engine. In addition, the most environmentally friendly engine type was compared by country of vehicle use—in Czechia, Germany, and Poland. These are neighboring countries, but the specifics of the automotive market point to significant differences [21].
The primary method assumed in this article is a comparative analysis [19] involving a comparison of urban SUVs in different engine versions from the same manufacturer. The compared vehicles are their equivalents, which differ in the type of propulsion. The adopted method allows the comparison of similar vehicles under the same car-operating conditions, subject to minor technical variations affecting the environmental performance of the cars [6]. The comparative analysis [22] was carried out by calculating the total CO2 emissions of SUVs assuming 270,000 km is driven, and considering additional pollutants. As a result of such a comparison, the environmental efficiency of each solution was determined, based on the type of propulsion available from the manufacturer, and the highest CO2 emissions in the country’s energy mix. Based on the energy mixes of the individual countries, the results of the harmfulness of using an electric power unit in each country were presented. Based on the secondary data [23,24] and own calculations, the vehicle and battery production processes, operations, conditions for obtaining fuel and/or electricity, and subsequent consumption of these energy carriers [20] were also assessed. The comparisons were supplemented with calculations, the detailed content of which is provided in the Supplementary Materials.
The article is organized as follows. In the presented introduction the goal of the article is defined and the research method is indicated. Then, the literature review is conducted. Materials and methods are discussed. A presentation of the passenger cars of the SUV type compared is made. A summary of the emission of pollutants accompanying the production of cars and their exploitation is presented. Finally, a comparative analysis with the previously calculated values and summary is contained. The article includes a discussion of the results with recommendations and indicates directions for future research.

2. Theoretical Background

The automotive sector is constantly looking for innovative solutions adapted to the changing needs of customers and the business environment. One of the contemporary innovations under consideration is electromobility [25]. Electromobility means all activities concerning both theory and practice in the mechanics as well as the construction of electric vehicles and management decisions [26]. Electromobility encompasses all issues concerning the adoption and use of electrically powered vehicles. Therefore, the term refers to both technical and operational aspects of electric vehicles, technology, and charging infrastructure. New opportunities for using green, renewable electricity pose challenges to countries, vehicle manufacturers, infrastructure architects, and customers [8,27].
The actions of most countries in the European Union are aiming to shift from a “brown” economy based on fossil fuels to a green economy, of which electric vehicles are a part [2]. The energy sector in each country is its economic backbone [21,28]. The Czech market is driven by clean nuclear energy. Germany is dominated by low-carbon energy sources, and Poland’s economy is based mainly on coal combustion. Therefore, in each compared country there are different challenges to overcome [21]. An expression of these changes is the COP26 declaration [29] signed at the United Nations Climate Change Conference in Glasgow in 2021. This document envisages a ban on the sale of cars with internal combustion engines by 2035. The main direction of such radical action is the implementation of the assumptions of the idea of SD. In the signed declaration, the ban includes all cars that emit exhaust fumes, i.e., cars with diesel, petrol, and hybrid engines. The assumptions of this document were also adopted by organizations operating in the field of electromobility in Europe, i.e.: PSPA (Polish Alternative Fuels Association, Pol.: Polskie Stowarzyszenie Paliw Alternatywnych) and CEE GTI (Central and Eastern Europe Green Transport Initiative). The Glasgow Declaration sets out green economy objectives for transport and operationalizes actions in practical terms [30]. The green economy goals are also supported by increasing public awareness of low-carbon transport in Europe [13]. Such growing public pressure translates not only into further legislative documents but also the implementation of technical solutions by car manufacturers [31]. One such regulation is the European EURO emissions standard [32,33]. This standard is considered by many automotive manufacturers to be very restrictive, compared with other developed guidelines [31,34]. EURO standards serve to minimize external transport costs, such as environmental pollution and negative climate impacts, through modern technologies [35]. The adaptation of engines to the latest requirements is done through technological solutions [36], such as DOC (oxidation catalyst) and DPF (diesel particulate filter), among others. The requirements described in the European standard are revised systematically, which means regular work on new filters or additionally equipping the vehicle with a small supporting electric motor [35,37]. The introduction of further regulations also results in the reduction (downsizing) of engine capacities (reduction in the number of cylinders in internal combustion engines which are contemporary trends in downsizing) and in meeting national and European environmental standards [38,39]. A particular way to meet direct emissions standards described in Glasgow Declaration is an all-electric unit.
Car manufacturers are currently facing the dilemma of adapting their production strategies to the ever-evolving vehicle market [3,40]. A major challenge is to diversify the portfolio of cars offered or to specialize in a chosen powertrain [38]. Although internal combustion engines are well established in the market, new regulations, requirements, and public awareness are driving the automotive industry towards sustainability [41,42]. The latest technologies represent a major challenge in terms of human resources and much higher costs [35]. There is also uncertainty regarding the final effects of implementing environmentally friendly solutions in the automotive industry [43,44]. On the one hand, this results in costs and, on the other, in exclusions in increasingly restricted green transport zones. Therefore, the vehicle purchaser is faced with an important decision regarding the choice of not only the vehicle model but above all the type of drive. A deep analysis of the available industry information sources [45,46] shows, first of all, the cheaper maintenance cost-TCO (abbreviation for Total Cost of Ownership) of an electric car compared with its combustion counterpart [47,48]. In contrast, an electric car purchase itself is more expensive and represents a long-term investment [49]. In addition to economic considerations, other factors such as vehicle durability, consumer tastes, and the car’s environmental impact may influence the choice of a particular solution. Car owners may be sentimental about their cars, which is why it is possible to still find technically efficient 25-year-old combustion cars with a mileage of about one million kilometers on roads. However, the electric car is still a novelty in the automotive market, and therefore it is not yet possible to verify its actual durability [42,49].
Significant additional power consumption is indicated by insufficient connection capacities of buildings and the impossibility of charging electric vehicles without prior adjustment of the electrical infrastructure [50]. Increasing demand also results in additional emissions when more and more energy is generated from non-renewable energy sources [51]. Direct pollution from fossil-fuel-based power stations is a problem for local society. Nevertheless, in Poland, fossil fuels are a source of the majority of energy production. Czechia and Germany have introduced low-emission nuclear energy sources, which is still not the case in Poland [52]. Furthermore, thanks to EU action, the share of renewable energy sources (RESs) in Poland’s energy mix is increasing [53]. In all selected countries there is a progressive increase in the share of RESs [5,52]. The possibility to produce fuel (energy) oneself is an independence that is not possible with conventional fuels.
So far, it has also not been established which propulsion solution is more beneficial, “greener”, or less carbon-intensive [49]. This is a debatable issue because most countries in the world are dominated by the production of energy from fossil fuels, which are used to obtain car fuels, or electricity, which is used to charge cars [50]. The exact environmental cost depends on where the vehicle is used. In the Czech, German, and Polish energy markets, the share of “green energy” [52], i.e., electricity obtained from renewable sources, especially solar and wind energy, is growing year by year [54]. However, fossil energy still accounts for a share of energy production at 43.34%, 24.20%, and 69.09%, for Czechia, Germany, and Poland, respectively [52]. Furthermore, 1 KWh used to charge an electric vehicle, for example, emits 436.60, 311.00, and 708.80 g of CO2 in these countries, respectively [55]. Another problem is the growing demand for fuels, accompanied by decreasing extraction (and therefore supply) of crude oil. The whole process of obtaining fuels consists of many operations, each of which carries additional costs and environmental pollution. The Europe average CO2 emission (Figure 1) accompanying the extraction and processing of 1 tonne of oil is about 88 kg CO2 [56]. Therefore, it is possible to calculate the average emission per 1 L of fuel for internal combustion engines (petrol and diesel), which is 74.79 g of CO2. Fossil fuels are not the only source of CO2; their processing or combustion is accompanied by other pollutants. The average CO2 emission for Europe when generating 1 kWh of electricity in grams is 230.70 [55].
The RESs account for the largest percentage of electricity generation in the whole EU. There is also a regular increase in the share of RESs in the region. Renewable energy, combined with low-carbon energy generation such as nuclear power, accounts for 71.81% of the production share. The market trend is to move away from highly emitting sources and to invest in less-polluting energy sources.
As a coal-mining country, the Czech Republic also has the geological advantage of obtaining energy from this source. The transformation is being steered towards nuclear energy. Czechia has the technology to produce nuclear energy and operates on an international energy market. In Czechia, nuclear energy accounts for 31.93%, which is close to the EU average (Figure 2). The share of RESs remains low at 22.08%.
Renewable or green energy is dominant in Germany (Figure 3). As a country with significant coal deposits, this source of energy is also used. Germany is the greenest, most renewable energy country on the list. It exceeds the European Union average.
In Poland, the economy is based on obtaining energy from coal (Figure 4). Poland has a significant share of solid fossil fuels as energy sources: as much as 69.09%. This highly emission-intensive way of obtaining energy can also be seen in the emission values for obtaining 1 kWh. Renewable energy remains low, at 21.60%, and nuclear energy is not present.
In reports and publications as well as in the expert literature, there are numerous juxtapositions of cars with environmentally friendly solutions, but without a detailed indication of the superiority of one type of propulsion over the other [3,31,57]. Most often, single-vehicle features are described in detail and the positive environmental impact of specific technological solutions is indicated [10]. Also, in most cases, comparisons of electric vehicles refer to different classes and types of cars [18]. In scientific publications, authors shift the focus of their analyses from environmental impact to comparisons of fuel or energy consumption [8,58,59].
The car manufacturing process is still a patent-protected corporate secret, which includes the issue of environmental harm [60]. Currently, it is difficult to assess the life cycle of the materials used in modern driving vehicles [30]. Available data only indicate fuel and/or electricity consumption. Recycling and recovery of rare materials are becoming increasingly important aspects of passenger car manufacturing processes [21,61]. In the case of lithium-ion batteries, the recovery of all used raw materials is not yet possible, and the possible extraction of some materials results in high CO2 emissions [62]. Work on the recycling of lithium-ion batteries is still ongoing [62]. This is due to the need to meet the latest market trends in car manufacturing. Material recovery applies to both batteries in electric cars and components in modern combustion cars [63]. Most often, the recovery of specific raw materials and their reuse is financially beneficial [61]. Despite the large pool of recovered raw materials, there is a group of components that must be treated not as waste but as potential objects for future recycling [64]. Therefore, the literature postulates the creation of deposits for which processing technologies have not been developed yet [65].

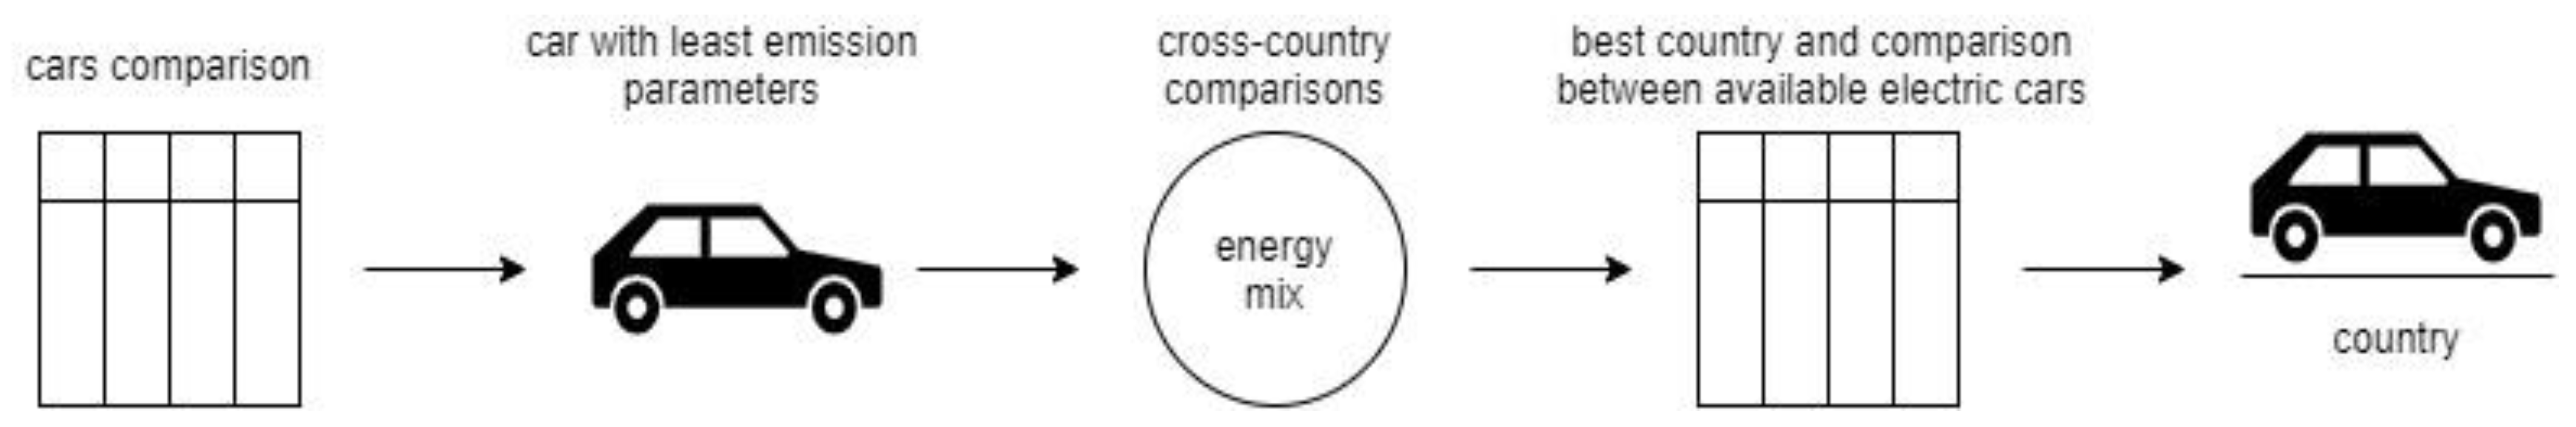
3. Materials and Methods

The goal of the research is to analyze powertrains in urban SUVs, taking petrol, diesel, hybrid, and electric engines into consideration, and to identify the most suitable option with comparison by country of use. The SUV type of car was chosen because of its growing popularity among European customers. These cars are favored because of the comfort offered [66]. A new car registration report published in the first quarter of 2021 indicates that SUVs represent as much as 44% of the automotive market in European countries [40]. Additionally, in Czechia, Germany, and Poland SUVs accounted for the largest percentage of vehicle registrations in 2021 [67]. Figure 5 comprehensively illustrates the research procedure.
First, the comparative analysis includes four vehicles of a single well-known SUV brand, of urban type, with different propulsion types. The models compared have electric, petrol, petrol-electric, and diesel engines. The engines to be compared were chosen for their similar parameters, as shown in Table 1. The vehicles (except for the hybrid version) have four-wheel drive. The information presented is based on the latest data from the manufacturer and applies to cars available in 2021. As a result of the comparison of different car engines from the same car producer, there is a car with the least emissions (Figure 5). Then, this best-performing car was used to perform the cross-country comparisons. Another step was crucial to understanding the dependency between compared countries’ energy mixes and a comparison between available electric cars in the compared countries. The final result is to present a car with the lowest CO2 emission parameters in the country with the best energy mix (Figure 5).
The research method made it possible to compare several parameters among the corresponding types of vehicles. A comparative analysis was chosen for reasons of transparency and to make possible an exact comparison of data sets with each other. Detailed information was taken from scientific publications [68,69], reports [67,70], and manufacturer catalogs [71,72]. Based on these sources, variables describing the environmental impact of vehicle use were highlighted. Secondary data including emission tables, energy consumption, and vehicle technical data were obtained from the car manufacturer. Industry reports were used in the presentation of the results and their discussion [23,46,73,74].
Table 1. Selected technical data for the compared similar passenger car models.
VehicleElectric—EV 1Petrol-ElectricPetrolDiesel
Year of availability/
of production
2021202120212021
Propelled wheels4 wheels2 wheels4 wheels4 wheels
Power (hp)228218224190
Torque (Nm)390350350400
Average fuel consumption (l/100 km)01.6/7.68.46.1
Average electricity consumption (KWh/100 km)17.517.500
Average CO2 emissions (g/km)037/173191161
Acceleration to 100 km/h (s)7.77.16.77.3
Weight (kg)2105177516001670
Source: Data provided by the car producer [71,72].
The following equations were used in this study. First, the volume (in liters) of fuel obtained from the crude oil processing was cellulated according to Equation (1):
O F C = f × c b × b
where:
  • O F C —Obtaining the Fuel from Crude oil processing (liters),
  • f —a percentage of obtaining a particular fuel (% as decimal fraction),
  • c b —capacity per barrel of oil (liters),
  • b —barrels (quantity).
Then CO2 emissions from fuel in kilograms were calculated according to Equation (2):
C E F = f × a
where:
  • C E F —CO2 emissions from the fuel (kg),
  • a —coefficient of global average CO2 emissions from extracting and processing 1 tonne of crude oil (kg)
  • f —a percentage of obtaining a particular fuel (% as decimal fraction)
Calculations of CO2 emissions generated in 1 L of fuel production (g/L) were based on Equation (3):
T E = C E F ÷ O F C × 1000
where:
  • T E —CO2 emissions generated in 1 L of fuel production (g/L)
Calculations of CO2 emissions generated by Internal Combustion Engine (ICE) (g/km) were based on Equation (4):
I C E = ( T E × f c ) ÷ 100
where:
  • I C E —CO2 emissions per 1 km by ICE (g/km)
  • f c —fuel combustion of the vehicle for 100 km
Calculations of CO2 emissions by EV (g/km) were performed according to Equation (5):
E V = ( e e × e c ) ÷ 100
where:
  • E V —CO2 emissions per 1 km by EV (g/km)
  • e e —CO2 emissions generated from the extraction of 1 KWh (g)
  • e c —energy consumption of the vehicle for 100 km
Calculations of CO2 emissions by PHEV (g/km) were calculated according to Equation (6):
P H E V = E V × r e + I C E × r f
where:
  • P H E V —CO2 emissions per 1 km by PHEV (g/km)
  • r e —a minimum range of the vehicle on electricity for 100 km (%)
  • r f —distance traveled on the internal combustion engine when the battery is exhausted [%].
  • Detailed calculations and their results are available in Supplementary Materials.

4. Results

4.1. Specifications of the Compared Car Models

The analyzed SUVs have different engine versions, which is in line with the methodology. A hybrid car has a combination of a petrol engine and an electric motor. Additionally, it is the only one that does not have a four-wheel drive version. All research cars have a power of approximately 215 hp, and their torque is approximately 373 Nm. The upper limits for fuel consumption and CO2 emissions according to the WLTP (Worldwide Harmonised Light Vehicle Test Procedure) test are included in Table 1. This is a test carried out on light vehicles, measuring fuel consumption and emissions. This test is used within the European Union to determine compliance with the European emissions standard, which is used for vehicle type-approval certificates. The values were measured under laboratory conditions and come directly from the manufacturer. Acceleration to 100 km/h is 7.2 s on average. Another important difference, shown in Table 1, is the weight of the compared vehicles. The electric vehicle is significantly heavier than the other cars analyzed.
When analyzing different engine versions of vehicles, it is important to consider the area beyond average energy/fuel consumption, which means that there are additional, hidden non-exhaust emissions other than those shown in Table 1. A separate category of emissions is related to the vehicle and the battery production [62]. Table 2 compares four engine versions of an SUV passenger car. The values presented are for an 18-year lifetime of the vehicle, with an annual mileage of 15,000 km, or approximately 270,000 km over the lifetime [23]. The values for manufacturing, vehicle maintenance, and battery manufacturing parameters are from 2021 and have been averaged across the European Union and the UK [23]. In addition, the parameters of cars from the same manufacturer as well as energy generation and fuel acquisition were taken into account. The data used to calculate emissions at fuel/energy generation were based on manufacturer parameters [71,72] and values from reports [52,73]. Detailed calculations can be found in Supplementary Materials.

4.2. CO2 Emissions Comparison

Cars with four different engine versions regarding CO2 emissions were compared in terms of fuel combustion, vehicle generation, vehicle maintenance, battery generation, fuel production, and/or energy production. In the case of the hybrid version, the data are based on a distance of 100 km traveled with the maximum electric motor.
The production of the vehicle and the associated emissions are similar at around 30 g of CO2 per kilometer traveled in each of the cases analyzed, when the European average is the background of comparison. However, the electric version of the passenger car has the least complicated engine. Its operation does not require as much effort as in the combustion versions. Additionally, there are no operating fluids such as engine oil. The diesel unit is the most complex engine and has filters such as DPF. The requirement to fill up with AdBlue also increases CO2 emissions.
Over the 18-year lifetime of a car (not including energy or fuel consumption), the electric vehicle emits the least CO2 when emissions from electricity generation are taken into account. A hybrid car has average values in this comparison. The internal combustion engines have similar parameters, but the diesel unit has the lowest value, which corresponds to a total of 43.74 g of CO2 emissions for every single kilometer driven. The petrol engine has the highest value of direct CO2 emissions for every kilometer traveled. It also has the highest fuel consumption. In the case of internal combustion engines, most of the CO2 emissions occur directly while driving.
Although in Poland most of the energy is obtained from fossil fuels, with the total emissions assuming that the vehicle is used for 18 years and covers a distance of 270,000 km, the electric vehicle remains the winner of this comparison.
The electric vehicle was recognized as the lowest-emission vehicle as a result of performing this paper’s calculation and comparisons. The lack of direct emissions during operation gives it a decisive advantage over other engines. Even the “brown” energy from fossil fuels does not affect the final result. The hybrid version of the car comes in second place with a score that is 68% worse than the electric version. The diesel version ranks third in the comparison, and the petrol engine achieves the worst score, with 132% more emissions than the electric version. These findings are independent of the specific country scenario because they are based on the car characteristics provided by the producers.

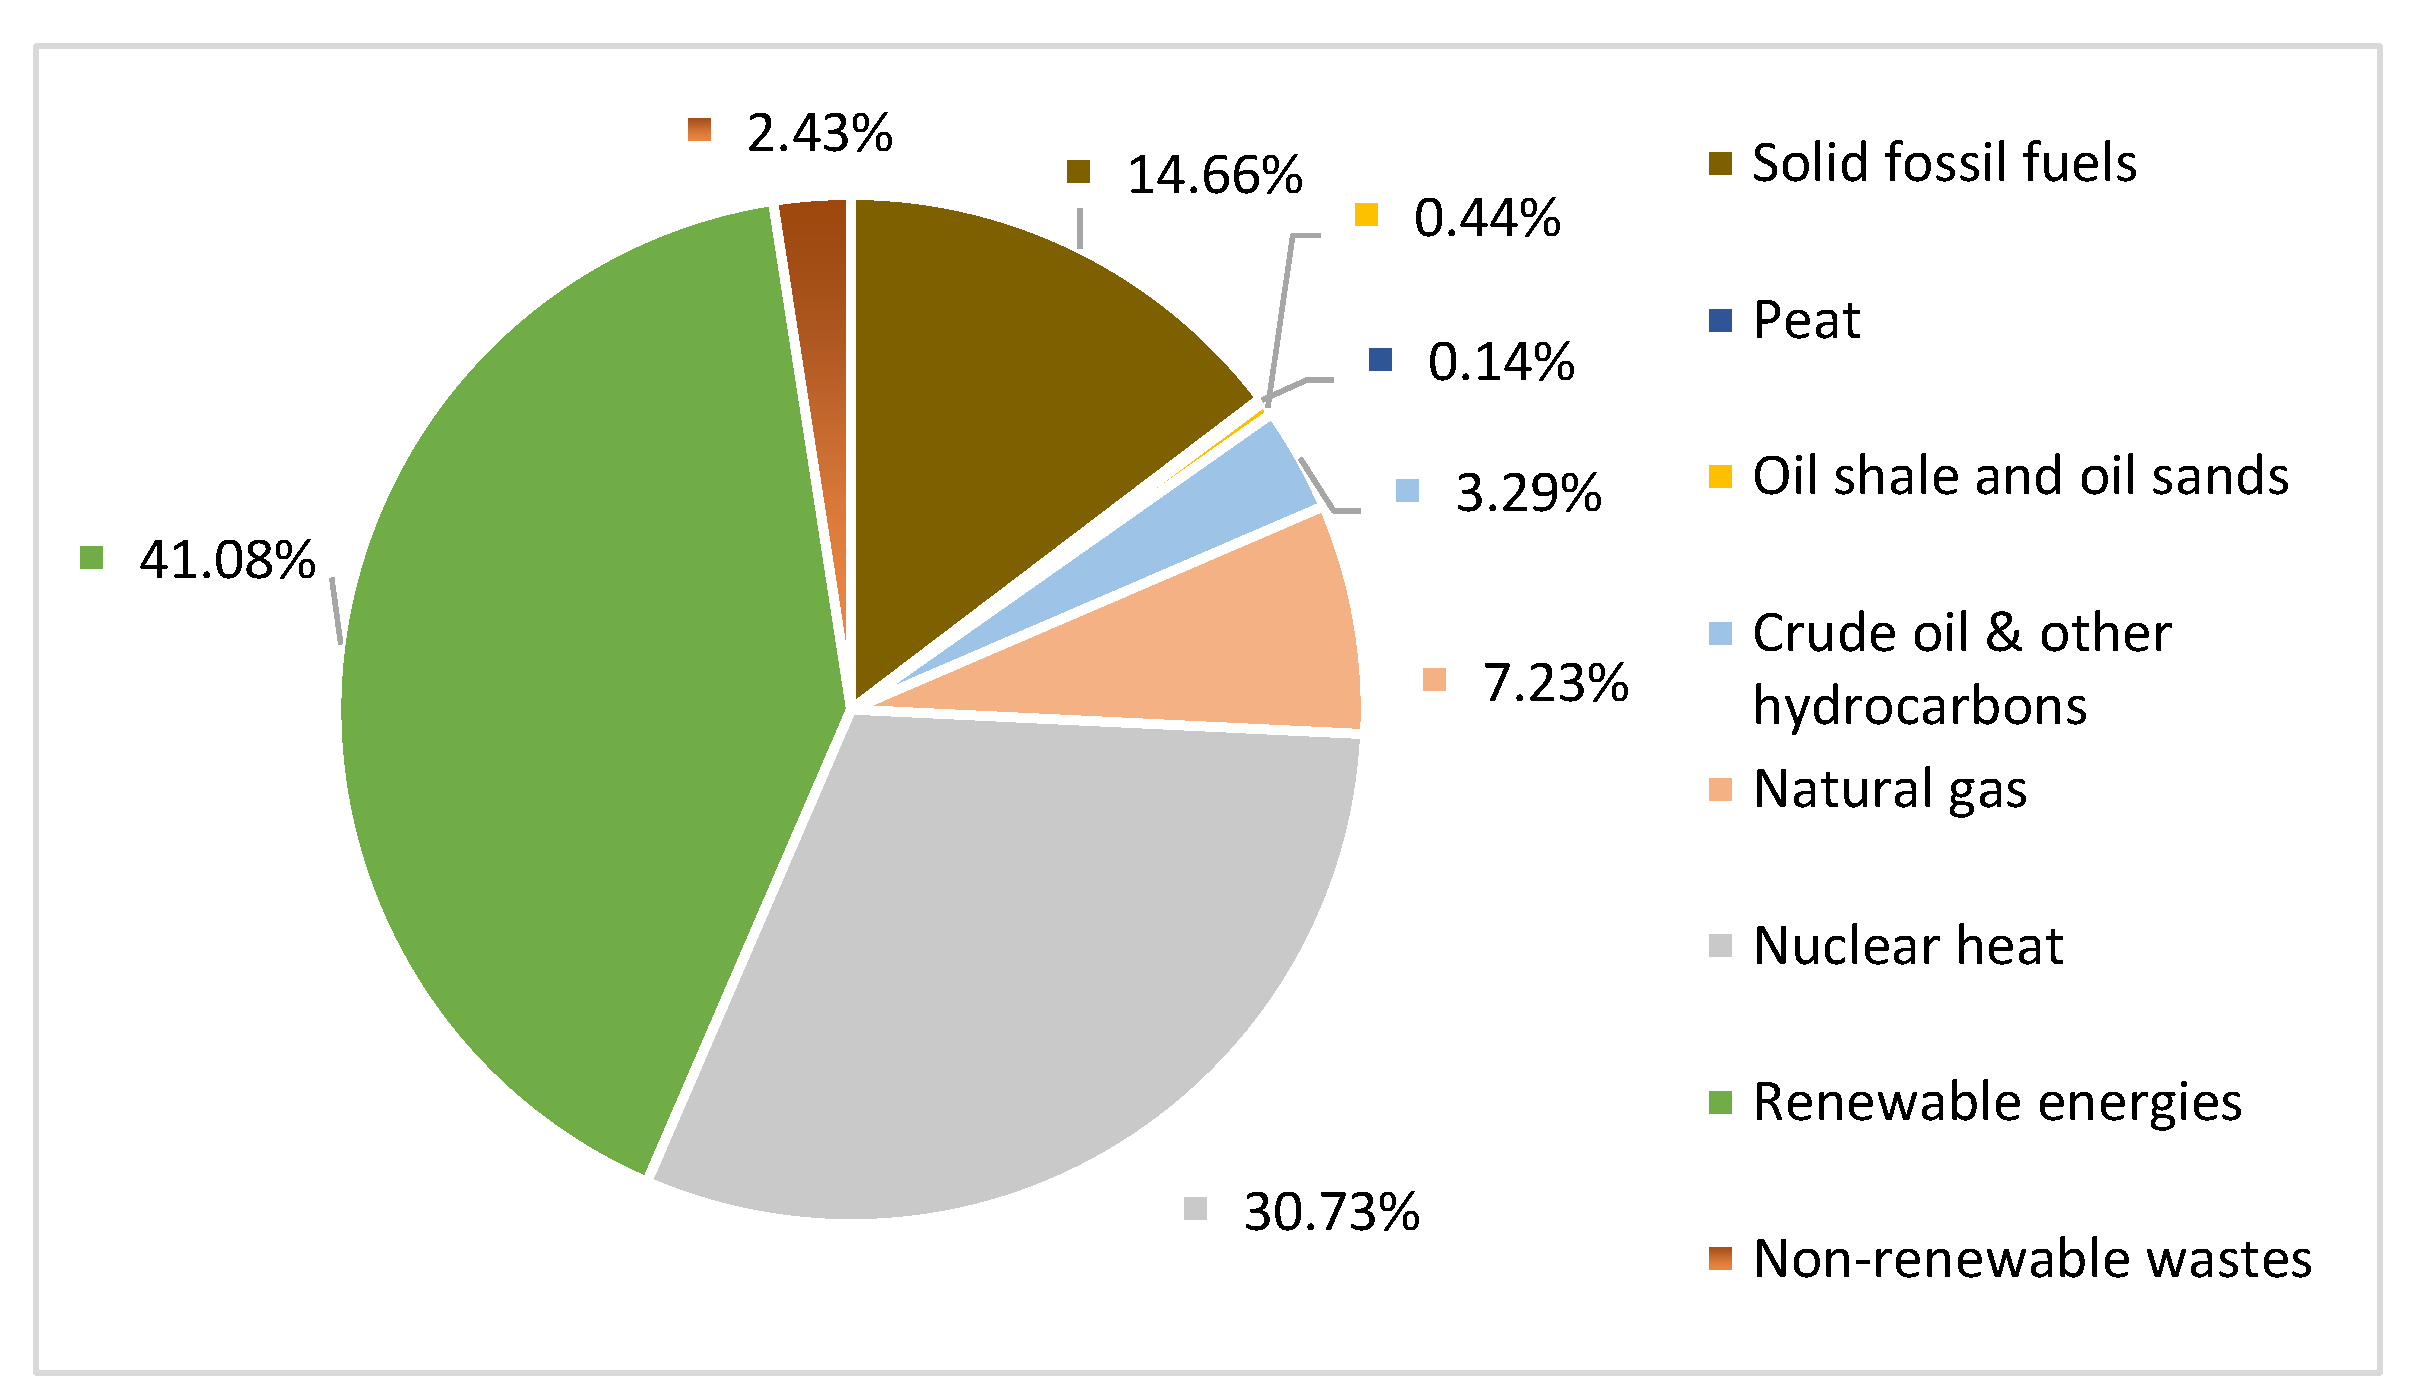
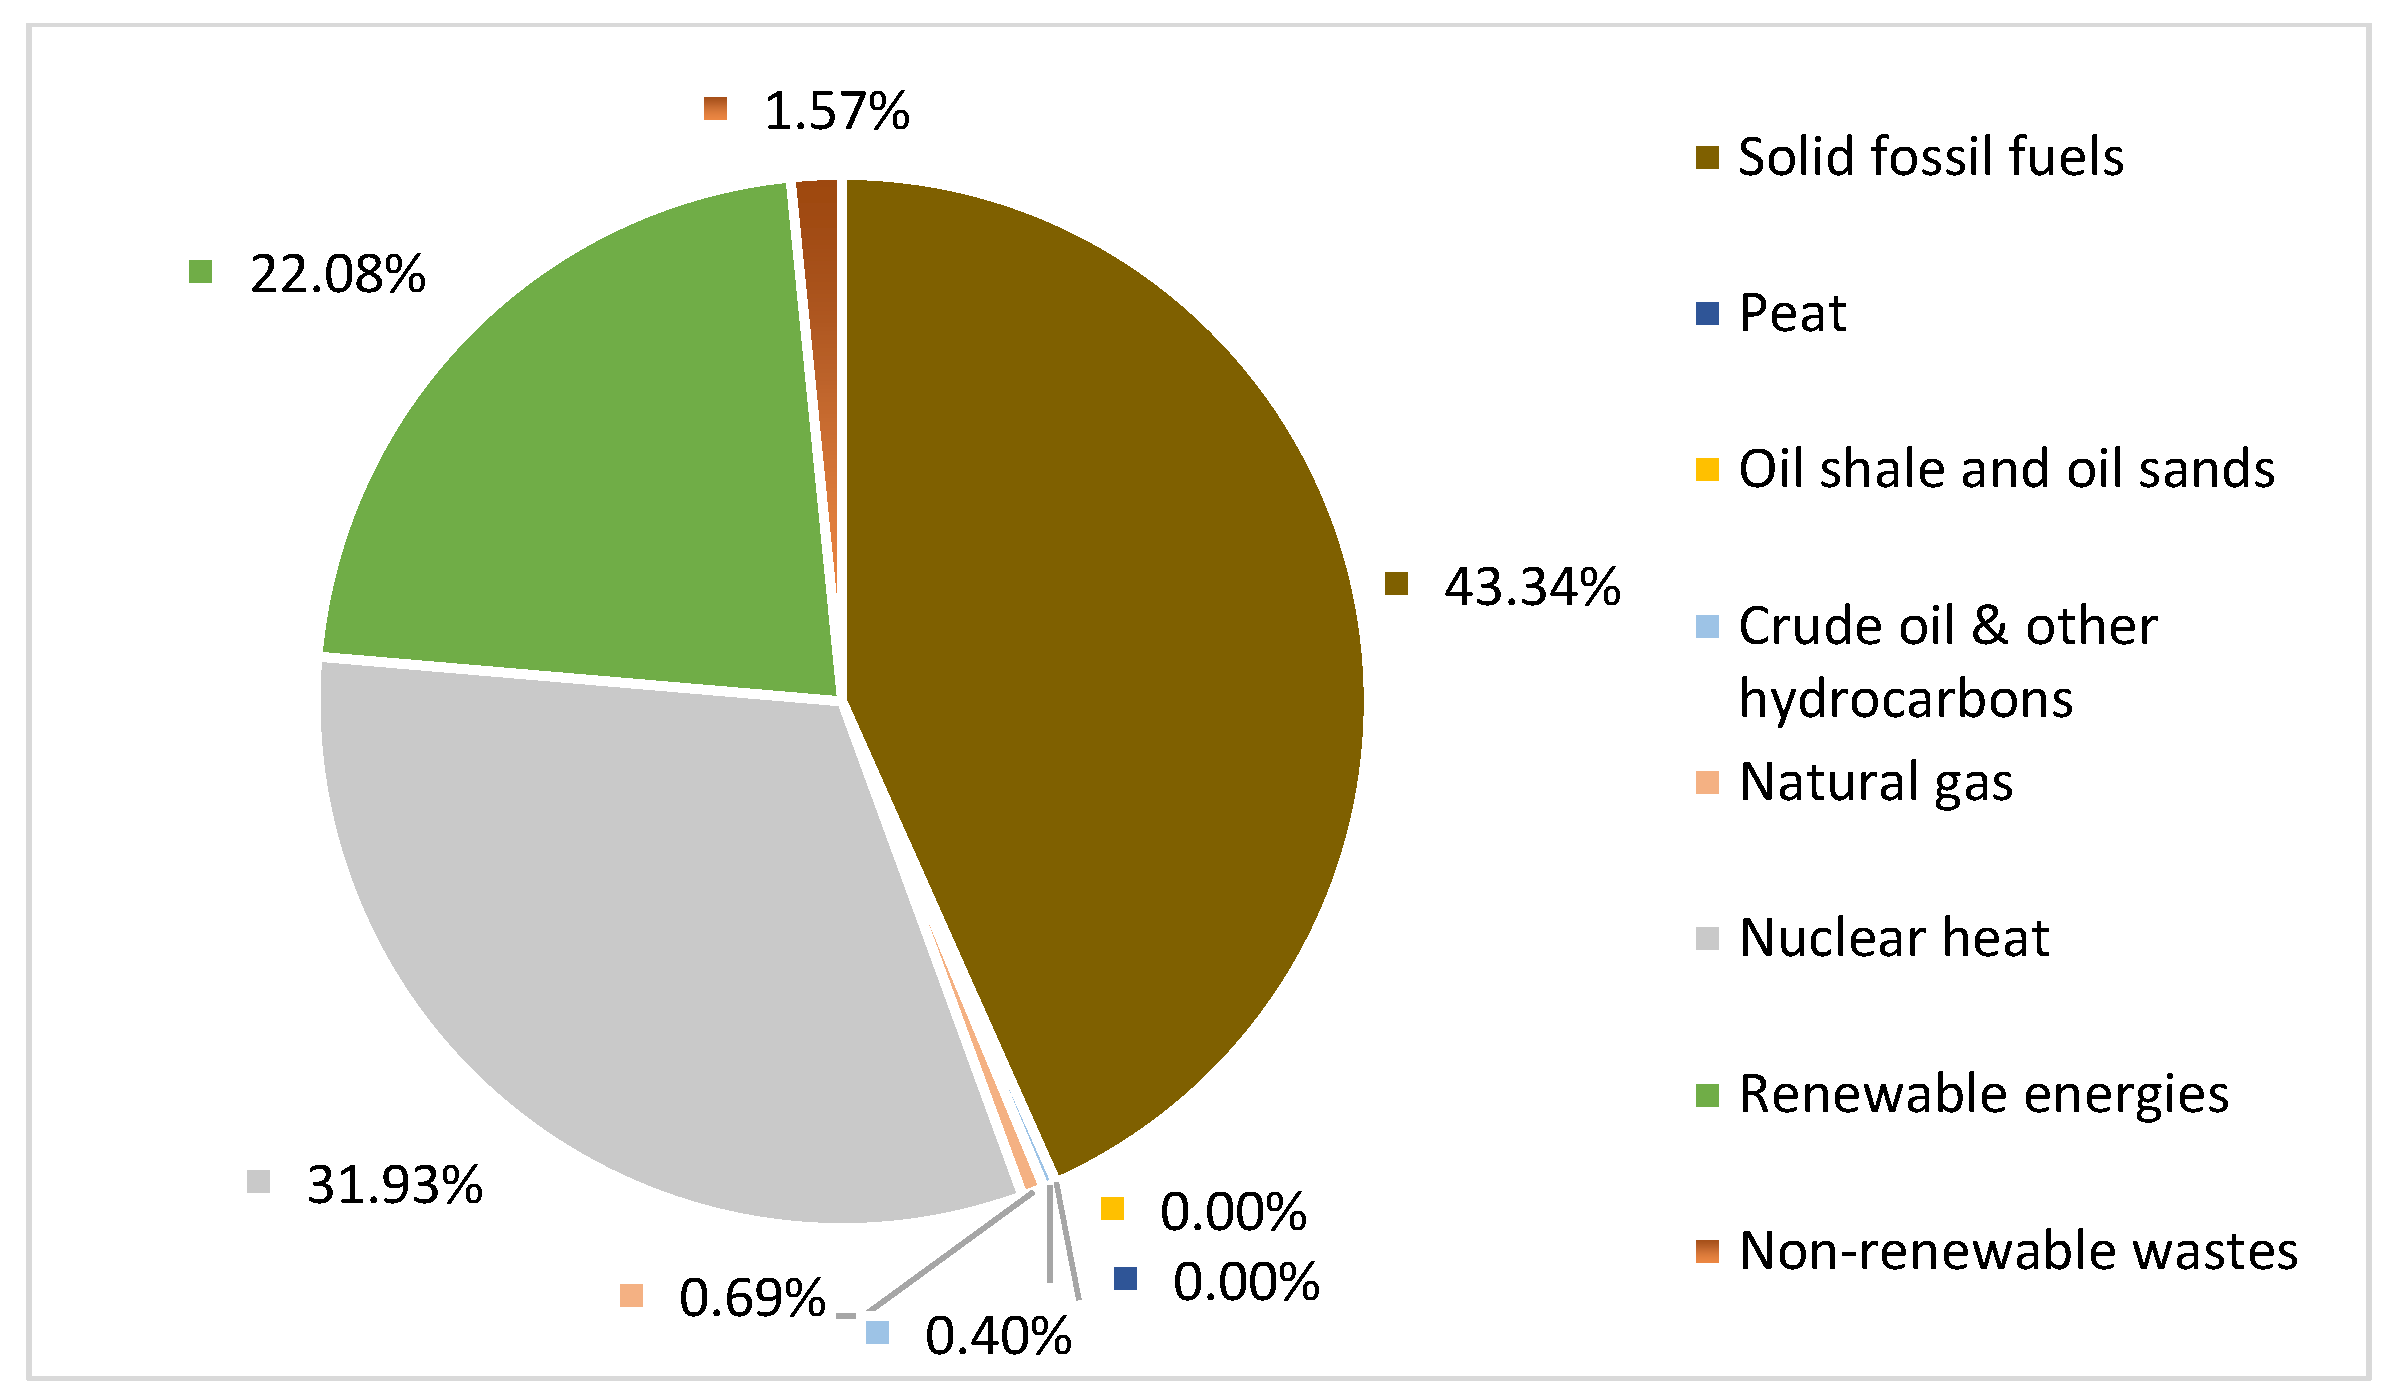
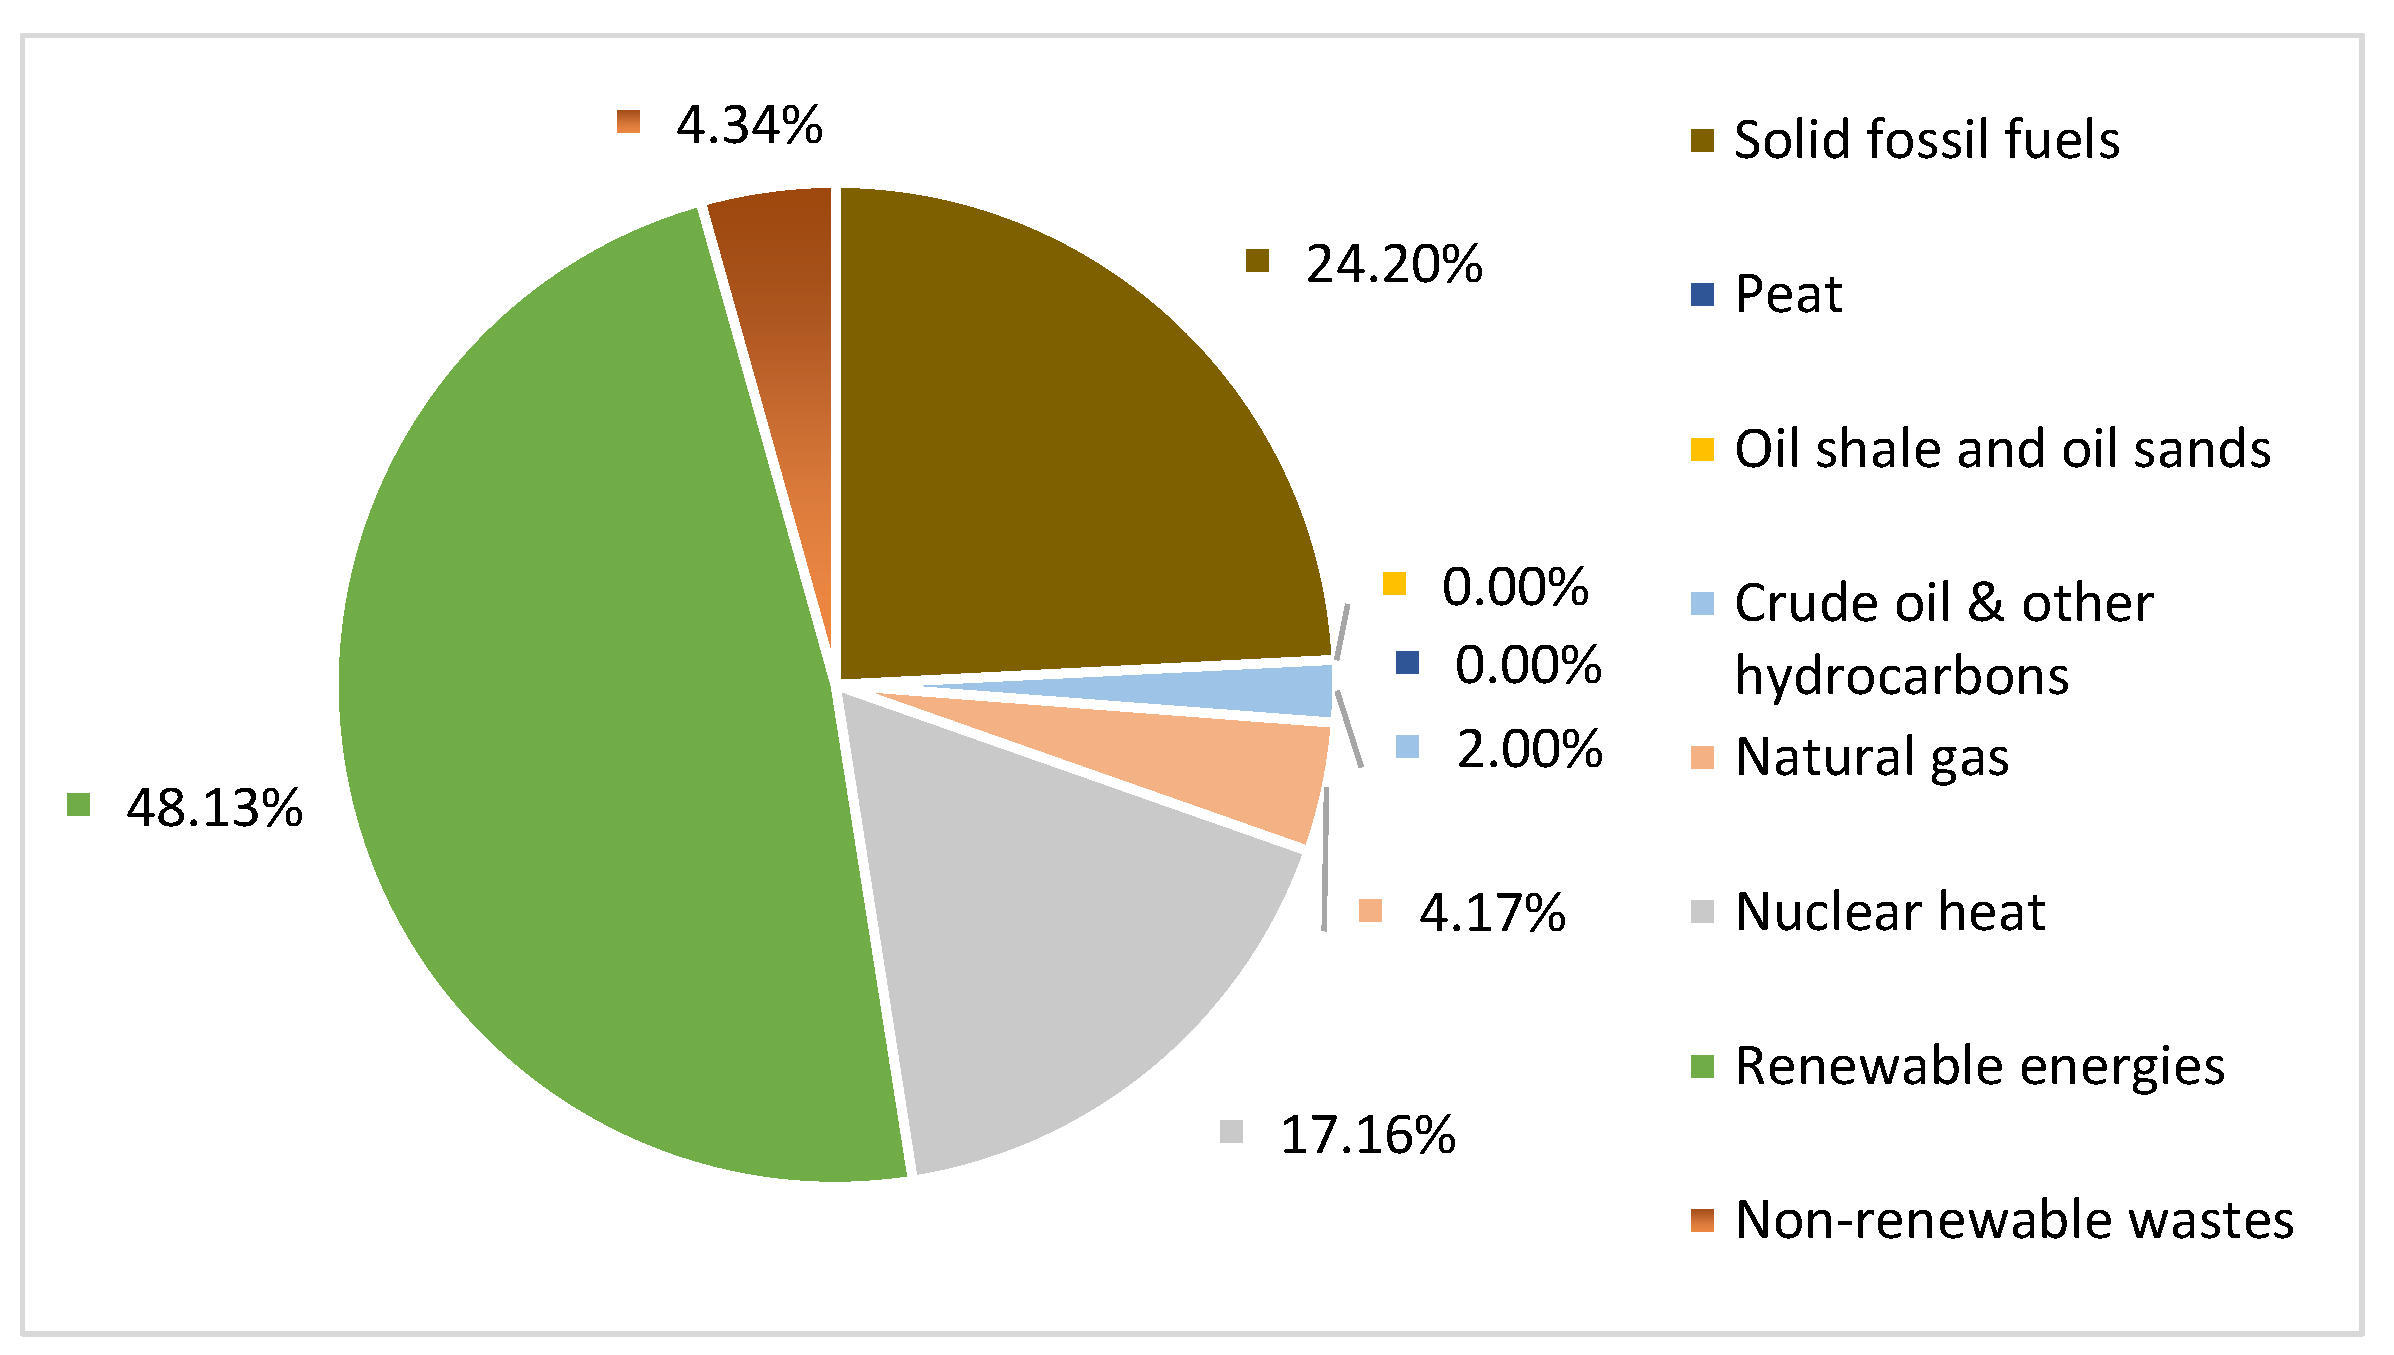
4.3. Electric Car Models and Cross-Country Comparisons

The electric vehicle, as the least emitting, was selected for further comparison. Electric vehicles (EVs) 1, 2, 3, 4, and 5 differ due to the manufacturer. The compared cars are in the SUV class. The tested vehicles show significant differences in technical specifications (Table 3). There are similar values for energy consumption, but there are also large fluctuations in weight. Acceleration and weight do not directly affect energy consumption, and this depends on the vehicle manufacturer only (Table 3).
The compared EVs (Table 3) were the subject of the next cross-country comparison research procedure, as presented in Figure 5. The EVs were compared due to their CO2 emissions in selected EU countries (Table 4).
When comparing electric car use in Czechia, Germany, and Poland, results indicate that Germany has the lowest CO2 emissions when driving an EV. This is due to Germany obtaining energy in the greenest way among the compared countries. Comparatively, traveling the same distance in the same electric vehicle in Poland causes more than double the emissions of the same in Germany. Nevertheless, even driving an electric vehicle on Polish roads is a more environmentally friendly solution than using a vehicle with an internal combustion engine. In Table 2, the hybrid vehicle proved to be the least emitting option, with the combustion engine obtaining a result of 146.38 g of CO2. Comparing this with the worst result for dirty energy, the result is 22.34 g of CO2 less for an all-electric car when driven 1 km.

5. Discussion and Conclusions

The mobility of society brings with it a continuous development of means of transport. Vehicles that look almost identical on the outside have different solutions on the inside due to the type of engine used.
This paper compares the different engines of SUVs. Factors including the harmfulness of the vehicle production processes, their exploitation, and the sources and ways of obtaining energy for powering the cars in Czechia, Germany, and Poland were analyzed in the paper. The aim of the paper was met by a comparative analysis of SUV engines: petrol, diesel, hybrid, and electric. The results of the research were obtained, indicating the electric motor as the least emissive solution. Electric cars can be the starting point of the energy sector transformation. This began with the signed declaration in Glasgow, which leads to a ban on the sale of cars with combustion engines from 2035. Before the proposed changes come into force, many consumers may base their decision to buy a car on its environmental performance based on the engine type. EVs are often considered as most ecological, due to their operational low emissions.
The approach to sustainability in the cases of Czech, German, and Polish electromobility also applies to methods of obtaining energy for engines. Electricity generation is the most emission-intensive part of moving a vehicle. Although the share of green energy is increasing, highly emissive ways of generating electricity have still not been ruled out. As a result of the comparison, it can be seen that Germany is the most environmentally friendly country for electric cars. This is due to Germany generating energy in the least emission-intensive way compared with Czechia and Poland.
The novelty and scientific contribution of this paper lie in the multilevel comparison of compared cars and countries. The novelty of the calculations consists of sophisticated comparisons of the different engine versions offered by the same producer and then the comparison of similar vehicles. The main goal of the paper is to compare the impact of different urban SUVs from the same manufacturer, equipped with different powertrain solutions (i.e., petrol, diesel, petrol-hybrid, and full-electric) in terms of lifetime CO2 emissions, including the contributions due to vehicle manufacturing, vehicle maintenance, battery production, fuel/energy production, and fuel consumption.
The multilevel analytical approach was conducted by taking into account three different countries, i.e., Germany, Czechia, and Poland, which strongly differ in terms of energy production mix. It was found that full EVs show the least impact in terms of lifetime CO2 emissions. Moreover, five EVs from different manufacturers were also compared in terms of lifetime CO2 emissions, considering the three different energy mix scenarios of Germany, Czechia, and Poland, and it was found that the worst case (i.e., EV 3 tested with the energy mix of Poland) leads to a lifetime CO2 emission level which is smaller than that of the vehicles which are equipped with petrol, diesel, and petrol-hybrid powertrains.
The requirements of the European Union in terms of pro-environmental solutions and industry standards observed, thanks to the growing awareness of consumers, provide guidelines for the directions of conduct in terms of reducing exhaust gas emissions. In the case of individual engine versions, the standards allow for small differences in exhaust gas values depending on the engine, but the idea of lower emissions applies to all vehicles. Differences in power output, weight, axle drive, and vehicle performance in laboratory values represent a challenge and a direction for future interdisciplinary research. The limitation of this study is related to the focus on the compared cars’ parameters in terms of lifetime CO2 emissions, including the contributions due to vehicle manufacturing, vehicle maintenance, battery production, fuel/energy production, and fuel consumption. In this analysis, the CO2 savings due to the battery recycling procedures were not considered. Therefore, the analysis of the influence of vehicle weight on the consumption of energy factors, the analysis of the life cycles of cars with different engines, the analysis of the recycling processes of their components, and the development of EV charging infrastructure are possible research directions.

Supplementary Materials

The detailed calculations are presented in a file available online: https://uewrc-my.sharepoint.com/:x:/g/personal/adam_sulich_ue_wroc_pl/EeVVnzr6UTNNsqmvS5gKFg0BFbYYZZO-5PIwX3BCuYkuAA?e=q41VOQ (accessed on 13 July 2022).

Author Contributions

Conceptualization A.S. and S.G.; methodology A.S. and S.G.; formal analysis A.S. and S.G.; investigation A.S. and S.G.; writing—original draft preparation A.S. and S.G.; writing—review and editing A.S. and S.G.; visualization A.S. and S.G.; supervision A.S.; project administration A.S. and S.G.; funding acquisition A.S. All authors have read and agreed to the published version of the manuscript.

Funding

(A.S.) The project is financed by the National Science Centre in Poland under the program “Business Ecosystem of the Environmental Goods and Services Sector in Poland”, implemented in 2020–2022; project number 2019/33/N/HS4/02957; total funding amount PLN 120,900.00. (A.S. and S.G.) The project is financed by the Ministry of Science and Higher Education in Poland under the program “Regional Initiative of Excellence” 2019–2022; project number 015/RID/2018/19; total funding amount PLN 10,721,040.00.

Institutional Review Board Statement

Not applicable.

Informed Consent Statement

Not applicable.

Data Availability Statement

Not applicable.

Acknowledgments

The authors would like to thank Kinga Zmigrodzka-Ryszczyk (Wroclaw University of Economics and Business) for the Orbis database exploration and secondary data acquisition.

Conflicts of Interest

The authors declare no conflict of interest. The funders had no role in the design of the study; in the collection, analyses, or interpretation of data; in the writing of the manuscript; or in the decision to publish the results.

References

  1. Graczyk, A.M.; Graczyk, A.; Żołyniak, T. System for financing investments in renewable energy sources in Poland. In Springer Proceedings in Business and Economics; Jones, N., Ed.; Springer: Cham, Switzerland, 2020; pp. 153–166. [Google Scholar]
  2. Filho, W.L.; Rath, K.; Mannke, F.; Vogt, J.; Kotter, R.; Borgqvist, M.; Myklebust, B.; Van Deventer, P. Fostering Sustainable Mobility in Europe: The Contributionsof the Project “E-Mobility North Sea Region”. Green Energy Technol. 2015, 203, 3–25. [Google Scholar] [CrossRef]
  3. Łuszczyk, M.; Sulich, A.; Siuta-Tokarska, B.; Zema, T.; Thier, A. The development of electromobility in the european union: Evidence from Poland and cross-country comparisons. Energies 2021, 14, 8247. [Google Scholar] [CrossRef]
  4. Gontarz, M.; Sulich, A. The sustainable transportation solutions: Smart shuttle example. In Vision 2025: Education Excellence and Management of Innovations through Sustainable Economic Competitive Advantage, Proceedings of the 34th International Business Information Management Association Conference (IBIMA), Madrid, Spain, 13–14 November 2019; Soliman, K.S., Ed.; International Business Information Management Association: Madrid, Spain, 2019; pp. 10833–10840. [Google Scholar]
  5. Franek, J.; Svoboda, O. Productivity and efficiency of automotive companies in the Czech Republic: A DEA approach. In Proceedings of the 13th International Conference on Strategic Management and Its Support by Information Systems, Ostrava, Czech Republic, 21–22 May 2019; pp. 87–98. [Google Scholar]
  6. Buberger, J.; Kersten, A.; Kuder, M.; Eckerle, R.; Weyh, T.; Thiringer, T. Total CO2-equivalent life-cycle emissions from commercially available passenger cars. Renew. Sustain. Energy Rev. 2022, 159, 112158. [Google Scholar] [CrossRef]
  7. Quijano, A.; Hernández, J.L.; Nouaille, P.; Virtanen, M.; Sánchez-Sarachu, B.; Pardo-Bosch, F.; Knieilng, J. Towards Sustainable and Smart Cities: Replicable and KPI-Driven Evaluation Framework. Buildings 2022, 12, 233. [Google Scholar] [CrossRef]
  8. Albatayneh, A.; Assaf, M.N.; Alterman, D.; Jaradat, M. Comparison of the Overall Energy Efficiency for Internal Combustion Engine Vehicles and Electric Vehicles. Rigas Teh. Univ. Zinat. Raksti 2020, 24, 669–680. [Google Scholar] [CrossRef]
  9. Pszczółkowski, J. Description of Acid Battery Operating Parameters. Energies 2021, 14, 7212. [Google Scholar] [CrossRef]
  10. Gulzari, A.; Wang, Y.; Prybutok, V. A green experience with eco-friendly cars: A young consumer electric vehicle rental behavioral model. J. Retail. Consum. Serv. 2022, 65, 102877. [Google Scholar] [CrossRef]
  11. Cieslik, W.; Szwajca, F.; Golimowski, W.; Berger, A. Experimental Analysis of Residential Photovoltaic (PV) and Electric Vehicle (EV) Systems in Terms of Annual Energy Utilization. Energies 2021, 14, 1085. [Google Scholar] [CrossRef]
  12. Attwood, J.; Attwood, D.; Williams, L.; Collier, A.; Boyd, M.; Gott, M. It all started with a green car... Exploring the meaning of happiness. Dementia 2020, 19, 31–40. [Google Scholar] [CrossRef]
  13. Klimecka-Tatar, D.; Ingaldi, M.; Obrecht, M. Sustainable Developement in Logistic-A Strategy for Management in Terms of Green Transport. Manag. Syst. Prod. Eng. 2021, 29, 91–96. [Google Scholar] [CrossRef]
  14. Tucki, K.; Orynycz, O.; Wasiak, A.; Świć, A.; Mieszkalski, L.; Mruk, R.; Gola, A.; Słoma, J.; Botwińska, K.; Gawron, J. A Computer Tool Using Open Modelica for Modelling CO2 Emissions in Driving Tests. Energies 2022, 15, 995. [Google Scholar] [CrossRef]
  15. Cvancarova, Z.; Franek, J. Corporate governance development in Central and Eastern Europe. Actual Probl. Econ. 2016, 179, 122–133. [Google Scholar]
  16. Erdelić, T.; Carić, T. Goods Delivery with Electric Vehicles: Electric Vehicle Routing Optimization with Time Windows and Partial or Full Recharge. Energies 2022, 15, 285. [Google Scholar] [CrossRef]
  17. Pielecha, I.; Cieślik, W.; Borowski, P.; Czajka, J.; Bueschke, W. Reduction of the number of cylinders in internal combustion engines-contemporary trends in downsizing. Combust. Engines 2014, 53, 12–25. [Google Scholar] [CrossRef]
  18. Verma, S.; Dwivedi, G.; Verma, P. Life cycle assessment of electric vehicles in comparison to combustion engine vehicles: A review. Mater. Today Proc. 2021, 49, 217–222. [Google Scholar] [CrossRef]
  19. Bryman, A.; Bell, E. Business Research Methods, 2nd ed.; Oxford University Press: Oxford, UK, 2007; ISBN 978-0-19-928498-6. [Google Scholar]
  20. Matuszewska-Janica, A.; Żebrowska-Suchodolska, D.; Ala-Karvia, U.; Hozer-Koćmiel, M. Changes in electricity production from renewable energy sources in the european union countries in 2005–2019. Energies 2021, 14, 6276. [Google Scholar] [CrossRef]
  21. Sulich, A.; Sołoducho-Pelc, L. Renewable energy producers’ strategies in the Visegrád Group countries. Energies 2021, 14, 3048. [Google Scholar] [CrossRef]
  22. Cargill, M.; O’Connor, P. Writing Scientific Research Articles, 2nd ed.; Wiley-Blackwell: Oxford, UK, 2013; ISBN 978-1-118-57069-2. [Google Scholar]
  23. Bieker, G. A Global Comparison of the Life-Cycle Greenhouse Gas Emissions of Combustion Engine and Electric Passenger Cars; ICCT: The Hague, The Netherlands, 2021. [Google Scholar]
  24. Campestrini, M.; Mock, P. European Vehicle Market Statistics; ICCT: The Hague, The Netherlands, 2021; pp. 1–50. [Google Scholar]
  25. Brdulak, J.; Pawlak, P. Electromobility as a factor of quality changes in Polish road transport [Elektromobilność czynnikiem zmian jakościowych polskiego transportu samochodowego]. Kwart. Nauk Przedsiębiorstwie 2021, 58, 31–42. [Google Scholar] [CrossRef]
  26. Malewska, K. Improving decision-making processes in organisations [Doskonalenie procesów decyzyjnych w organizacjach]. Manag. Sci. [Nauki o Zarządzaniu] 2013, 1, 33–45. [Google Scholar]
  27. Sulich, A.; Grudziński, A. The analysis of strategy types of the renewable energy sector. Acta Univ. Agric. Silvic. Mendel. Brun. 2019, 67, 1643–1651. [Google Scholar] [CrossRef] [Green Version]
  28. Borowski, P.F.; Kupczyk, A.; Biernat, K.; Mączyńska-Sęczek, J.; Detka, T.; Golisz, E.; Gawłowska, A.; Di Nardo, M. Problems of Selected Sectors of Biofuels for Transport in Poland. Processes 2021, 9, 1573. [Google Scholar] [CrossRef]
  29. Oxford Analytica. COP26 coal deal will fall short of needs. Emerald Expert Brief. 2021. [Google Scholar] [CrossRef]
  30. Kotak, Y.; Marchante Fernández, C.; Canals Casals, L.; Kotak, B.S.; Koch, D.; Geisbauer, C.; Trilla, L.; Gómez-Núñez, A.; Schweiger, H.-G. End of Electric Vehicle Batteries: Reuse vs. Recycle. Energies 2021, 14, 2217. [Google Scholar] [CrossRef]
  31. Denis, A.; Kuczyński, W. Comparative analysis of the environmental impact of electric cars powered by coal-fired power plants and combustion engine-powered cars [Analiza porównawcza wpływu na środowisko aut elektrycznych zasilanych z elektrowni węglowych oraz aut spalinowych]. Autobusy Tech. Eksploat. Syst. Transp. 2017, 18, 61–64. [Google Scholar]
  32. Clairotte, M.; Suarez-Bertoa, R.; Zardini, A.A.; Giechaskiel, B.; Pavlovic, J.; Valverde, V.; Ciuffo, B.; Astorga, C. Exhaust emission factors of greenhouse gases (GHGs) from European road vehicles. Environ. Sci. Eur. 2020, 32, 125. [Google Scholar] [CrossRef]
  33. Skupniewicz, T. Origin and development of vehicle emission standards in the European Union [Geneza i rozwój standardów emisji spalin pojazdów w Unii Europejskiej]. Przegląd Prawno-Ekonomiczny 2019, 47, 319–331. [Google Scholar]
  34. Jacyna, M.; Zochowska, R.; Sobota, A.; Wasiak, M.; Lee, K.M. Scenario Analyses of Exhaust Emissions Reduction through the Introduction of Electric Vehicles into the City. Energies 2021, 14, 2030. [Google Scholar] [CrossRef]
  35. Trzensik, E.; Światłoń, M. Impact of the implementation of Euro 5 and Euro 6 emission standards on the automotive industry in terms of introducing new technologies and increasing operating costs [Wpływ implementacji norm emisji spalin Euro 5 i Euro 6 na przemysł motoryzacyjny, w aspekcie wdrażania nowych technologii i wzrostu kosztów]. Zesz. Nauk. Politech. Śląskiej 2011, 72, 83–98. [Google Scholar]
  36. Merkisz, J.; Siedlecki, M.; Ziólkowski, A.; Fuć, P.; Lijewski, P. Methods for limiting engine emissions from HDVs meeting Euro VI standard [Metody ograniczenia emisji zanieczyszczeń z silników pojazdów HDV spełniających normę Euro VI]. Combust. Engines 2015, 54, 480–486. [Google Scholar]
  37. Torres, P.; Arents, J.; Marques, H.; Marques, P. Bin-Picking Solution for Randomly Placed Automotive Connectors Based on Machine Learning Techniques. Electronics 2022, 11, 476. [Google Scholar] [CrossRef]
  38. Brach, J.; Pawłowska, M.; Wojtowski, B. Selected Aspects of Improving Delivery in Last Mile Logistics. Challenges for Modern Cities [Wybrane Aspekty Usprawniania Dostaw w Logistyce Ostatniej Mili. Wyzwania dla Współczesnych Miast]; Wydawnictwo Uniwersytetu Ekonomicznego we Wrocławiu: Wrocław, Poland, 2021. [Google Scholar]
  39. Brzeżański, M.; Śliwiński, K. Downsizing—A new direction for car engines [Downsizing—nowy kierunek rozwoju silników samochodowych]. Siln. Spalinowe 2004, 43, 3–11. [Google Scholar]
  40. Jato Dynamics. European New Car Market Starts 2021 with Record Market Share for SUVs. 2021. Available online: https://www.jato.com/european-new-car-market-starts-2021-with-record-market-share-for-suvs/ (accessed on 29 April 2022).
  41. Wyszomirski, O. Sustainable urban transport and quality of life [Zrównoważony rozwój transportu w miastach a jakość życia]. Transp. Miej. Reg. 2017, 12, 27–32. [Google Scholar]
  42. Brach, J. Current Developments in the European Market for Road Cargo Vehicles—An Analysis from the Supply Side Perspective [Obecne Zmiany na Europejskim Rynku Pojazdów Samochodowych do Przewozu Ładunków—Analiza z Perspektywy Strony Podażowej]; Wydawnictwo Uniwersytetu Ekonomicznego we Wrocławiu: Wrocław, Poland, 2019. [Google Scholar]
  43. Trzaska, R.; Sulich, A.; Organa, M.; Niemczyk, J.; Jasiński, B. Digitalization Business Strategies in Energy Sector: Solving Problems with Uncertainty under Industry 4.0 Conditions. Energies 2021, 14, 7997. [Google Scholar] [CrossRef]
  44. Niemczyk, J.; Sus, A.; Bielińska-Dusza, E.; Trzaska, R.; Organa, M. Strategies of European Energy Producers. Directions of Evolution. Energies 2022, 15, 609. [Google Scholar] [CrossRef]
  45. Haddadian, G.; Khodayar, M.; Shahidehpour, M. Accelerating the global adoption of electric vehicles: Barriers and drivers. Electr. J. 2015, 28, 53–68. [Google Scholar] [CrossRef]
  46. Polskie Stowarzyszenie Paliw Alternatywnych [Polish Alternative Fuels Association]. New Mobility Barometer 2020/21; [Barometr Nowej Mobilności 2020/21]; Polskie Stowarzyszenie Paliw Alternatywnych: Warszawa, Poland, 2021. [Google Scholar]
  47. Żebrowski, K.; Detka, T.; Małek, K. Comparative analysis of report data on CO2 emissions and total cost of ownership (TCO) of an electric vehicle versus a conventionally fuelled vehicle [Analiza porównawcza danych z raportów dotyczących emisji CO2 oraz całkowitych kosztów posiadania (TCO)]. Masz. Elektr. Zesz. Probl. 2018, 3, 161–170. [Google Scholar]
  48. Neugebauer, M.; Żebrowski, A.; Esmer, O. Cumulative Emissions of CO2 for Electric and Combustion Cars: A Case Study on Specific Models. Energies 2022, 15, 2703. [Google Scholar] [CrossRef]
  49. Gawron, S.; Bernatt, J. Business experience in electric cars [Doświadczenia z eksploatacji samochodów elektrycznych w działalności gospodarczej]. Masz. Elektr. Zesz. Probl. 2017, 2, 231–238. [Google Scholar]
  50. Kaznowski, R.; Sztafrowski, D.; Grudek, M.; Gumiela, J. Infrastructure problems related to the transition from internal combustion to electric drive in motor vehicles. Prz. Elektrotechniczny 2021, 97, 113–116. [Google Scholar] [CrossRef]
  51. Kan, X.; Reichenberg, L.; Hedenus, F. The impacts of the electricity demand pattern on electricity system cost and the electricity supply mix: A comprehensive modeling analysis for Europe. Energy 2021, 235, 121329. [Google Scholar] [CrossRef]
  52. Eurostat Energy Balances in the MS Excel File Format (2022 Edition). Available online: https://ec.europa.eu/eurostat/web/energy/data/energy-balances (accessed on 28 June 2022).
  53. Miller, I.; Gençer, E.; O’sullivan, F.M. A General Model for Estimating Emissions from Integrated Power Generation and Energy Storage. Case Study: Integration of Solar Photovoltaic Power and Wind Power with Batteries. Processes 2018, 6, 267. [Google Scholar] [CrossRef] [Green Version]
  54. Gabryś, H.L. Power generation in Poland 2020 [Elektroenergetyka w Polsce 2020]. Available online: https://elektroenergetyka.pl/upload/file/2020/08/Gabryś_8.pdf (accessed on 27 February 2022).
  55. European Environment Agency (EEA). Greenhouse gas emission intensity of electricity generation by country. Available online: https://www.eea.europa.eu/data-and-maps/daviz/co2-emission-intensity-9#tab-googlechartid_googlechartid_googlechartid_googlechartid_chart_11111 (accessed on 8 May 2022).
  56. The International Association of Oil and Gas Producers (IOGP). IOGP Environmental Performance Indicators—2019 Data; International Association of Oil and Gas Producers: London, UK, 2020. [Google Scholar]
  57. Brandão, P.; Infante, V.; Deus, A.M.; Del Pero, F.; Delogu, M.; Pierini, M. Life Cycle Assessment in the automotive sector: A comparative case study of Internal Combustion Engine (ICE) and electric car. Procedia Struct. Integr. 2018, 12, 521–537. [Google Scholar] [CrossRef]
  58. Braun, A.; Rid, W. Energy consumption of an electric and an internal combustion passenger car. A comparative case study from real world data on the Erfurt circuit in Germany. Transp. Res. Procedia 2017, 27, 468–475. [Google Scholar] [CrossRef]
  59. Pielecha, J.; Skobiej, K.; Kurtyka, K. Exhaust Emissions and Energy Consumption Analysis of Conventional, Hybrid, and Electric Vehicles in Real Driving Cycles. Energies 2020, 13, 6423. [Google Scholar] [CrossRef]
  60. Pilichowska, P. Polish electromobility development programme—Implementation and impact on the development of electromobility in Poland [Polski program rozwoju elektromobilności—Realizacja i wpływ na rozwój elektromobilności w Polsce]. In Regionalne i Lokalne Uwarunkowania Rozwoju Gospodarki Polski; Sobczak, E., Ed.; Uniwersytet Ekonomiczny we Wrocławiu: Wrocław, Poland, 2020; pp. 111–119. [Google Scholar]
  61. Pietrzyk-Sokulska, E. Recycling as a potential source of mineral resources from selected waste groups [Recykling jako potencjalne źródło pozyskiwania surowców mineralnych z wybranych grup odpadów]. Zesz. Nauk. Inst. Gospod. Surowcami Miner. Energią PAN 2016, 92, 141–161. [Google Scholar]
  62. Wójcik, M.; Pawłowska, B.; Stachowicz, F. Overview of waste lithium-ion battery recycling technologies [Przegląd technologii recyklingu zużytych akumulatorów litowo-jonowych]. Zesz. Nauk. Politech. Rzesz. Mech. 2017, 89, 107–120. [Google Scholar] [CrossRef]
  63. Kamińska, E.S.; Pawlak, P. Ecobalance analysis of recycling of waste lithium-ion automotive batteries [Analiza ekobilansowa recyklingu zużytych litowo-jonowych akumulatorów samochodowych w technologii]. Gospod. Mater. Logistyka 2020, 2020, 35–44. [Google Scholar] [CrossRef]
  64. Hałasik, K.; Kulczycka, J. CSR, environment-friendly investments and innovations-the three elements necessary to build a modern and strong coal mining company? In Proceedings of the E3S Web of Conferences, Kraków, Poland, 17–19 May 2016; Volume 10. [Google Scholar]
  65. Tatarewicz, I.; Lewarski, M.; Skwierz, S.; Krupin, V.; Jeszke, R.; Pyrka, M.; Szczepański, K.; Sekuła, M. The Role of BECCS in Achieving Climate Neutrality in the European Union. Energies 2021, 14, 7842. [Google Scholar] [CrossRef]
  66. Haughton, T. An SUV on a Road to Nowhere? Solidarity, Unanimity and Vulnerability in the European Union. Johns Hopkins Univ. SAIS Cent. Transatl. Relat. 2012, 2012, 13–30. [Google Scholar]
  67. Polski Związek Przemysłu Motoryzacyjnego [Polish Automotive Industry Association]. Automotive Industry Report 2021/2022. Available online: https://www.pzpm.org.pl/en/Automotive-market/Reports/PZPM-Automotive-Industry-Report-2021-2022 (accessed on 28 June 2022).
  68. Skobiej, K.; Pielecha, J. Plug-in Hybrid Ecological Category in Real Driving Emissions. Energies 2021, 14, 2340. [Google Scholar] [CrossRef]
  69. Balsalobre-Lorente, D.; Leitão, N.C.; Bekun, F.V. Fresh validation of the low carbon development hypothesis under the ekc scheme in portugal, italy, greece and spain. Energies 2021, 14, 250. [Google Scholar] [CrossRef]
  70. Polskie Stowarzyszenie Paliw Alternatywnych [Polish Alternative Fuels Association]. Electric Vehicle Catalogue 2021/22 [Katalog Pojazdów Elektrycznych 2021/22]; Polskie Stowarzyszenie Paliw Alternatywnych: Warszawa, Poland, 2021. [Google Scholar]
  71. Benz, M. EQA Performance Levels and Technical Data. [Stopnie Wydajności i Dane Techniczne EQA]. Available online: https://www.mercedes-benz.pl/passengercars/mercedes-benz-cars/models/eqa/specifications/eqa-h243.module.html (accessed on 28 June 2022).
  72. Benz, M. Technical Data for GLA Engines [Dane Techniczne Silników GLA]. Available online: https://www.mercedes-benz.pl/passengercars/mercedes-benz-cars/models/gla/gla-h247/specifications/pluginhybrid.module.html (accessed on 28 June 2022).
  73. Canadian Association of Petroleum Producers. The Petroleum Value Chain: From Crude Oil to Useful Products. Available online: https://context.capp.ca/infographics/2017/ig_petrochemical-value-chain (accessed on 27 February 2022).
  74. Tauron Polska Energia, S.A. Structure of Fuels and Other Primary Energy Carriers Used to Generate Electricity Sold to Tauron Polska Energia S.A. in 2020 [Struktura Paliw i Innych Nośników Energii Pierwotnej Zużywanych do Wytwarzania Energii Elektrycznej Sprzedanej do Tauron Polska Energia S.A. w Roku 2021. Available online: https://www.tauron.pl/tauron/o-tauronie/struktura-paliw (accessed on 27 February 2022).
  75. Opel Polska. Price List—New Electric Opel Mokka-e Production Year 2021, Model Year 2021D [Cennik—Nowy Elektryczny Opel Mokka-e Rok Produkcji 2021, Rok Modelowy 2021D]. 2021. Available online: https://www.opel.pl/content/dam/opel/poland/tools/pdf/cenniki/mokka/rp22-rm22/cennik-MokkaE-rp22-22_4.pdf (accessed on 27 February 2022).
Figure 1. The energy mix for the European Union’s 27 countries in 2020. Source: Authors’ elaboration based on [52].
Energies 15 05170 g001
Figure 2. Energy mix in Czechia in 2020. Source: Authors’ elaboration based on [52].
Energies 15 05170 g002
Figure 3. Energy mix in Germany in 2020. Source: Authors’ elaboration based on [52].
Energies 15 05170 g003
Figure 4. Energy mix in Poland in 2020. Source: Authors’ elaboration based on [52].
Energies 15 05170 g004
Figure 5. Research procedure scheme. Source: Authors’ elaboration.
Energies 15 05170 g005
Table 2. CO2 in g/1 km emissions during selected processes.
VehicleElectric—EV 1Petrol and ElectricPetrolDiesel
Average CO2 emissions0.0081.31191.00161.00
Vehicle manufacturing27.0033.0030.0030.00
Vehicle maintenance4.005.005.007.00
Production of batteries16.004.000.000.00
Production of fuel/energy40.3724.076.284.56
Total87.37146.38232.28202.56
Source: Authors’ calculation based on [23,52,56].
Table 3. Selected technical data for EV car models.
VehicleEV 1EV 2EV 3EV 4EV 5
MotorElectricElectricElectricElectricElectric
Year of availability/
of production
20212021202120212021
Wheel drive4 wheelsfrontfrontrearfront
Power (HP)228136145170204
Torque (Nm)390300270310310
Average electricity consumption (KWh/100 km)17.517.819.017.017.1
Acceleration to 100 km/h (s)7.79.09.79.08.5
Weight (kg)21051598164519672109
Source: Authors’ elaboration based on [70,71,75].
Table 4. EV model comparison in Czechia, Germany, and Poland.
CzechiaGermanyPoland
CO2 average emissions [g/1 kWh]436.60311.00708.80
Electricity consumption—EV 1 [kWh/100 km]17.5017.5017.50
CO2 emissions per 1 km—EV 1 [g/1 km]76.4154.43124.04
Electricity consumption—EV 2 [kWh/100 km]17.8017.8017.80
CO2 Emissions per 1 km—EV 2 [g/1 km]77.7155.36126.17
Electricity consumption—EV 3 [kWh/100 km]19.0019.0019.00
CO2 Emissions per 1 km—EV 3 [g/1 km]82.9559.09134.67
Electricity consumption—EV 4 [kWh/100 km]17.0017.0017.00
CO2 Emissions per 1 km—EV 4 [g/1 km]74.2252.87120.50
Electricity consumption—EV 5 [kWh/100 km]17.1017.1017.10
CO2 Emissions per 1 km—EV 5 [g/1 km]74.6653.18121.20
Source: Authors’ calculations and details are presented in the Supplementary Materials.
Publisher’s Note: MDPI stays neutral with regard to jurisdictional claims in published maps and institutional affiliations.

