Article

Criticalities of the Outdoor Infrared Inspection of Photovoltaic Modules by Means of Drones †

DEI—Department of Electrical and Information Engineering, Polytechnic University of Bari, 70126 Bari, Italy
This paper is an extended version of the paper published in 2021 IEEE-EEEIC International Conference on Environment and Electrical Engineering, Bari, Italy, 7–10 September 2021; pp. 1–5. https://doi.org/10.1109/EEEIC/ICPSEurope51590.2021.9584799.
Energies 2022, 15(14), 5086; https://doi.org/10.3390/en15145086
Submission received: 31 May 2022 / Revised: 27 June 2022 / Accepted: 11 July 2022 / Published: 12 July 2022
(This article belongs to the Section A2: Solar Energy and Photovoltaic Systems)

Abstract

:
Photovoltaic plants are helping to reduce CO2 emissions, but the energy performance of photovoltaic systems must remain high throughout their operational life. Supervision and monitoring are mandatory for large photovoltaic plants because failures can cause high power losses due to the large number of photovoltaic modules. Infrared analysis is effective and reliable in detecting anomalies or failures in photovoltaic modules, but it is time-consuming and expensive when the infrared inspection of large photovoltaic plants is manual. Nowadays, the diffusion of unmanned aerial vehicles equipped with infrared cameras can support the fast supervision of photovoltaic plants. Nevertheless, the use of drones is regulated by international and national rules; consequently, it is not always possible to use a drone, or its utilization is limited based on geographic areas and/or authorizations. Moreover, infrared analysis requires additional requirements when done by drone, because the mutual position between the photovoltaic modules and the infrared camera affects the goodness of the infrared acquisition. This article discusses these critical issues, directs the reader to official, national, and geographic maps for drones, and suggests technical solutions for some specific issues not considered in the technical specification for the outdoor infrared thermography of photovoltaic modules. In particular, the paper proposes a systematic procedure for the legal and effective infrared inspection of photovoltaic modules by means of a drone and proposes improvements for some issues not discussed in the international rules: the correction of infrared images with respect to the view angle, the impact of a mid-wave and long-wave infrared sensor on the acquired image, and the impact of air transmittance.

1. Introduction

Nowadays, Unmanned Aerial Vehicle (UAV)-based inspections allow for the monitoring of the state of health of photovoltaic (PV) modules by means of infrared (IR) analysis, thanks to an IR camera mounted on the UAV. In fact, when power loss is due to internal problems of the cells [1,2], they usually produce a temperature increase, as described in Table 3 of [3] and quantitatively verified by researchers [4]. Nevertheless, radiometric maps are not sufficient for a final decision about the substitution of a defected PV module; thus, image processing is necessary. Some authors propose a defect detection strategy based on both cell-by-cell analysis and cluster analysis that groups the cells with similar temperatures [5,6]. It is worth noting that IR analysis is not the unique or the main methodology used to monitor a PV plant; in fact, when the focus is the global behavior of the PV system and not only the PV modules, statistics-based methodologies are used. In [7], exponential weighted moving average is used to monitor the DC side of PV systems and detect partial shadings. In [8], the authors suggest a strategy to detect defects without using environmental data but rather by exploiting the comparison between the energy datasets of similar arrays. In [9], the authors propose a real-time residential energy management method for a PV-storage hybrid system based on the energy forecast, as previously defined by an offline procedure. Other authors use statistics to optimize the energy performance of a PV plant connected with other renewable energy sources [10,11].
Consequently, there is not a unique approach to monitor the integrity of a PV plant, because each strategy focuses attention on a specified target: to change the target implies the change of the supervision methodology. The physical extension of the PV plant under investigation is a further parameter to consider before planning the supervision activity. For example, a UAV equipped with an IR camera can be very useful in monitoring a large PV plant [12], but it is too expensive to monitor a small PV plant. A large PV plant usually occupies more than one hectare and contains several thousands of PV modules.
In fact, nowadays, the peak power can reach 500 W for a single face mono-silicon PV module and 600 W for a bi-facial PV module, but the peak power of a single module of older PV plants was 150–200 W. This means that, with the same peak power, a PV plant with new modules can occupy about 30% of the surface occupied by a PV plant constituted by older modules. Therefore, several years ago, a large PV plant occupied one hectare, it was constituted by about 5000 modules, and its power was about 1 MWp; instead, nowadays, a large PV plant occupies one hectare, it is constituted by about 5000 modules, and its power is about 2.5 MWp. With new modules, a 1 MWp PV plant occupies only 2000 m2 and is not considered large. So, with respect to the UAV-based IR inspection, the definition of a large PV plant refers to the occupied surface and not to the peak power. Moreover, the parameters’ settings are not trivial for an IR camera when it is mounted on a UAV, because each parameter depends on the variable distance between the target and the IR camera due to the UAV movement. International Standard rule IEC 62446-3 [13] defines the procedure for an outdoor IR inspection of operating PV plants in order to check the quality of the constituting parts: modules, inverters, contact, fuses, and switches. The rule also defines the requirements for the measurement devices, ambient conditions, and so on. This rule represents a good reference for a general inspection, but it is not exhaustive for a deep analysis, because some criticalities are not discussed: the impact of air transmittance, the difference between mid-wave and long-wave IR cameras, and the reference temperature of the PV module in the environmental conditions during the IR acquisition. These issues are not discussed in [4,12,13]. In addition to these issues, mandatory international and national rules to pilot a UAV must be considered: the certified expertise of the pilot, the technical specifications of the UAV, the limitations of the geographic area, where the flight is planned, and so on. These last issues are not specific for the inspection of a PV plant but affect any typology of activity by a UAV and thus the IR inspection of PV modules. The use of drones for the inspection of PV modules is well known [14], but there are many differences among the national rules of European countries and those of the USA with regard to utilizing UAVs. These differences imply criticalities to the use of UAVs for the IR inspection of PV modules for diagnostic purposes. The main actors of a UAV-based flight (operator, pilot, authority, competent authority) are introduced before classifying the UAV operations and the constraints. This paper introduces the modifications approved by the European Aviation Safety Agency (EASA) in February 2022 and the limitations near civil airports, military airports, and heliports. Most of the European and USA geographical maps and tools are discussed. The EASA defines most of the procedures and constraints for the UAV flight in Europe, but it delegates some important decisions to each one of the 27 member states of EU (Figure 1). Consequently, each member state defines these parts of the European rule in its own way, and the results are inhomogeneous. For example, one of the critical points under the national application is the definition of the geographical areas, i.e., the spaces where UAVs can fly and the associated limitations. The constraints that are valid in a member state are usually different from those that are valid in another state; thus, the UAV-based inspection—under the same requirements—could be possible in one member state of the EU but not in another state, or it may require specific authorization. These criticalities are not discussed in [4,12,13]. The paper discusses both categories of criticalities: different national rules to using UAVs and open issues affecting the correct acquisition of IR images by means of UAVs.
The paper is structured as follows. Section 2 shows the context of an inspection system based on UAVs equipped with an IR camera. Section 3 proposes a methodology for the effective and reliable IR inspection of PV modules by means of UAVs. It also describes the general rules for the correct and legal use of a UAV (highlighting the differences among the national rules) and discusses the IEC rules for the UAV-based IR inspection of a PV plant. Section 4 highlights some criticalities not addressed by the international rules for outdoor IR inspection and proposes solutions. The conclusions are addressed in Section 5.

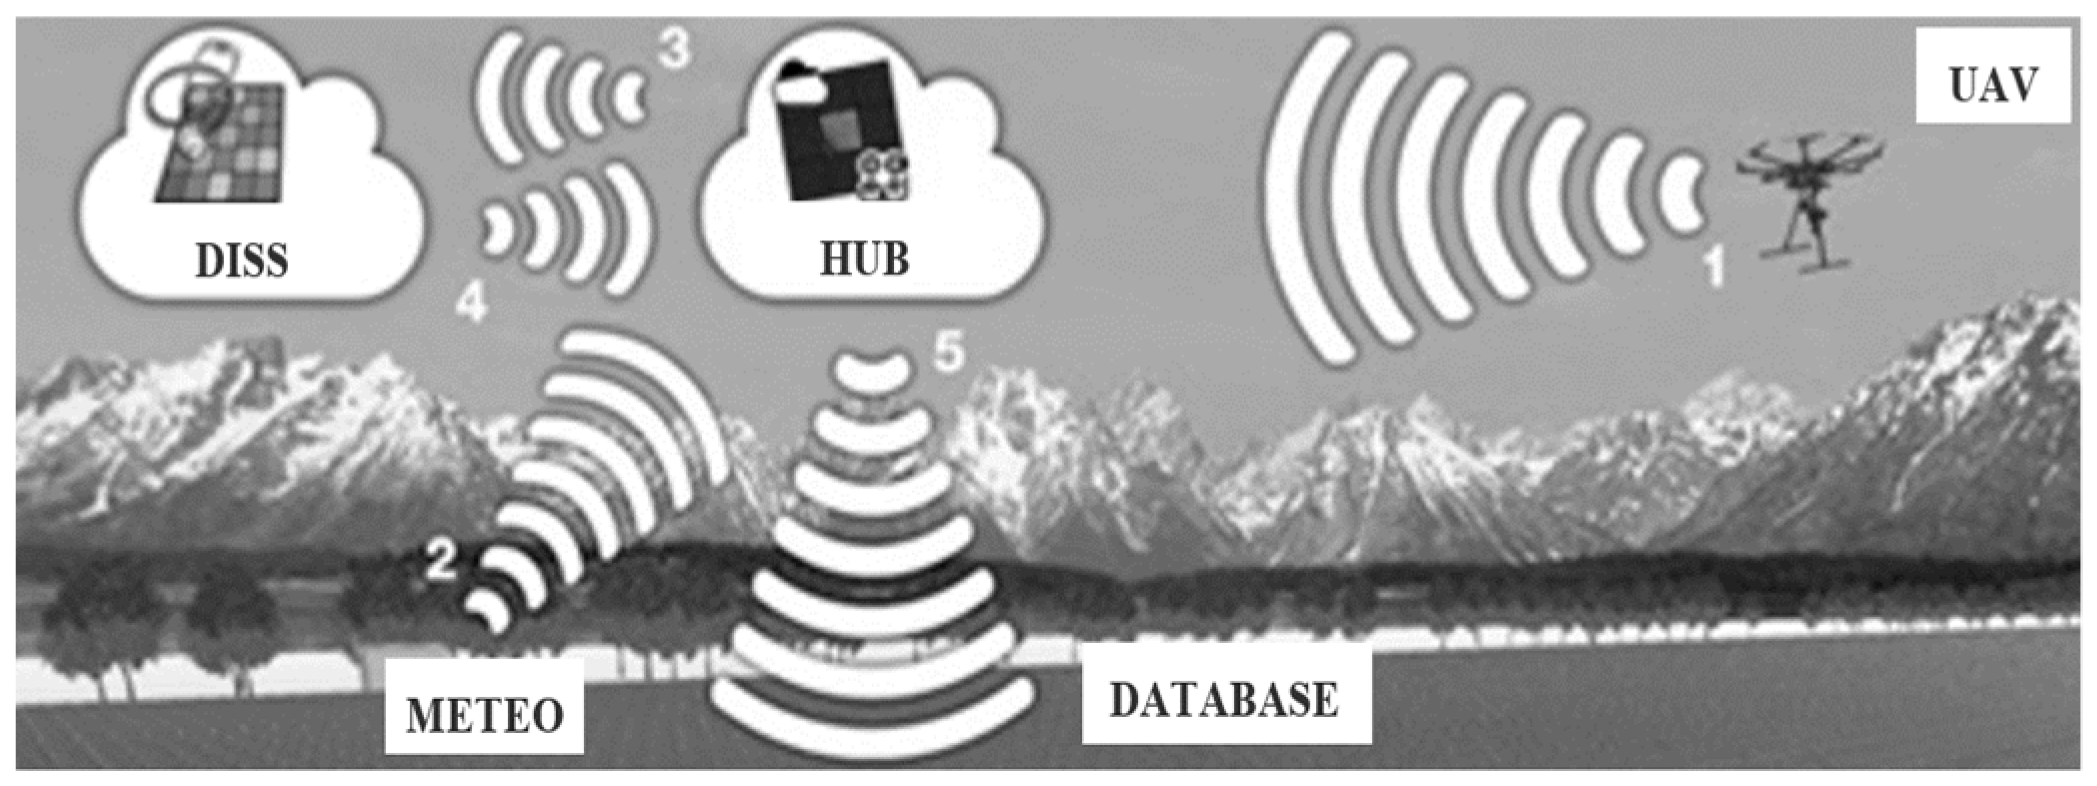
2. Cloud-Based Platform for IR Analysis of Photovoltaic Modules

When a photovoltaic module is producing the expected energy, its temperature is equal to a value specified in the manufacturer datasheet. This value is the Nominal Operating Cell Temperature (NOCT) and is dependent on the environmental conditions, as better detailed in Section 3.2. The NOCT parameter is characteristic of older PV modules, whereas the datasheet of new modules contains the parameter known as NMOT, which is short for Nominal Module Operating Temperature. This replacement—introduced by the international standard rule IEC 61215-2016 [15]—seems nominalistic. Instead, it affirms that a well-functioning photovoltaic module must have a uniform temperature over the entire surface of the PV module, which, therefore, must coincide with the temperature of each photovoltaic cell making up the module. Therefore, an over-temperature is usually an indicator of an anomaly or failure. This is the main reason for the large diffusion of the infrared technology used to monitor the correct operation of PV modules. A further motivation is the possibility of checking the PV modules without the service of the entire system or part of it. Instead, for example, diagnostics based on electroluminescence require the inverse polarization of the photovoltaic module under investigation, opening two criticalities: the need to open the string to which the PV module under investigation belongs (then, out of service and the lack of energy production), and the need to analyze one PV module at a time. Moreover, diagnostics based on electroluminescence are more expensive than IR analysis. For all these reasons, electroluminescence is preferred to detect specific defects not detectable with IR analysis (e.g., snail trails, EVA degradation) [16]. For a large PV plant, the main difficulty is the time needed to check all the PV modules, considering that an old 1 MWp PV plant is usually constituted by about 5000 PV modules, even if the new modules have a higher power peak than the old ones, as already said. Nowadays, PV plants with peak powers higher than 50 MWp are constituted by over 100,000 PV modules. This implies that the manual IR inspection is a time-consuming and very expensive activity. To overcome this drawback, the IR camera can be mounted on a UAV [17], and more than one UAV is used to patrol the whole PV plant. A meteorological station to record the environmental parameters, such as irradiance, air temperature, and wind, is also necessary. Finally, all evaluations should be uploaded on a database for current and future needs. The values of environmental parameters and a radiometric map are used to calculate the absolute temperature of the PV module and to compare it with the temperature that the PV module should show in the environmental conditions of the IR acquisition.
Figure 2 represents a scheme of a combined system for the IR inspection of large PV plants. The core is represented by the hub that allows for the sharing of data among all the devices. The hub collects images from the UAV (1) and environmental parameters from the meteorological station (2). It needs a cloud-based application—for example, DISS or another equivalent application—that is useful in automatizing some calculations of specific areas of the radiometric map. DISS downloads an IR image from the hub (3), processes the image, extracts detailed information, and uploads the results (4) on the hub. All the data are stored in a database (5) to track the thermal history of each PV module. Even if DISS allows for the classification of the general behavior of a PV module, the final decision requires the expertise of a certified technician for IR images [18]. It is also useful to recognize some typical patterns of defects, as reported in Table 5.3.1 of [19].

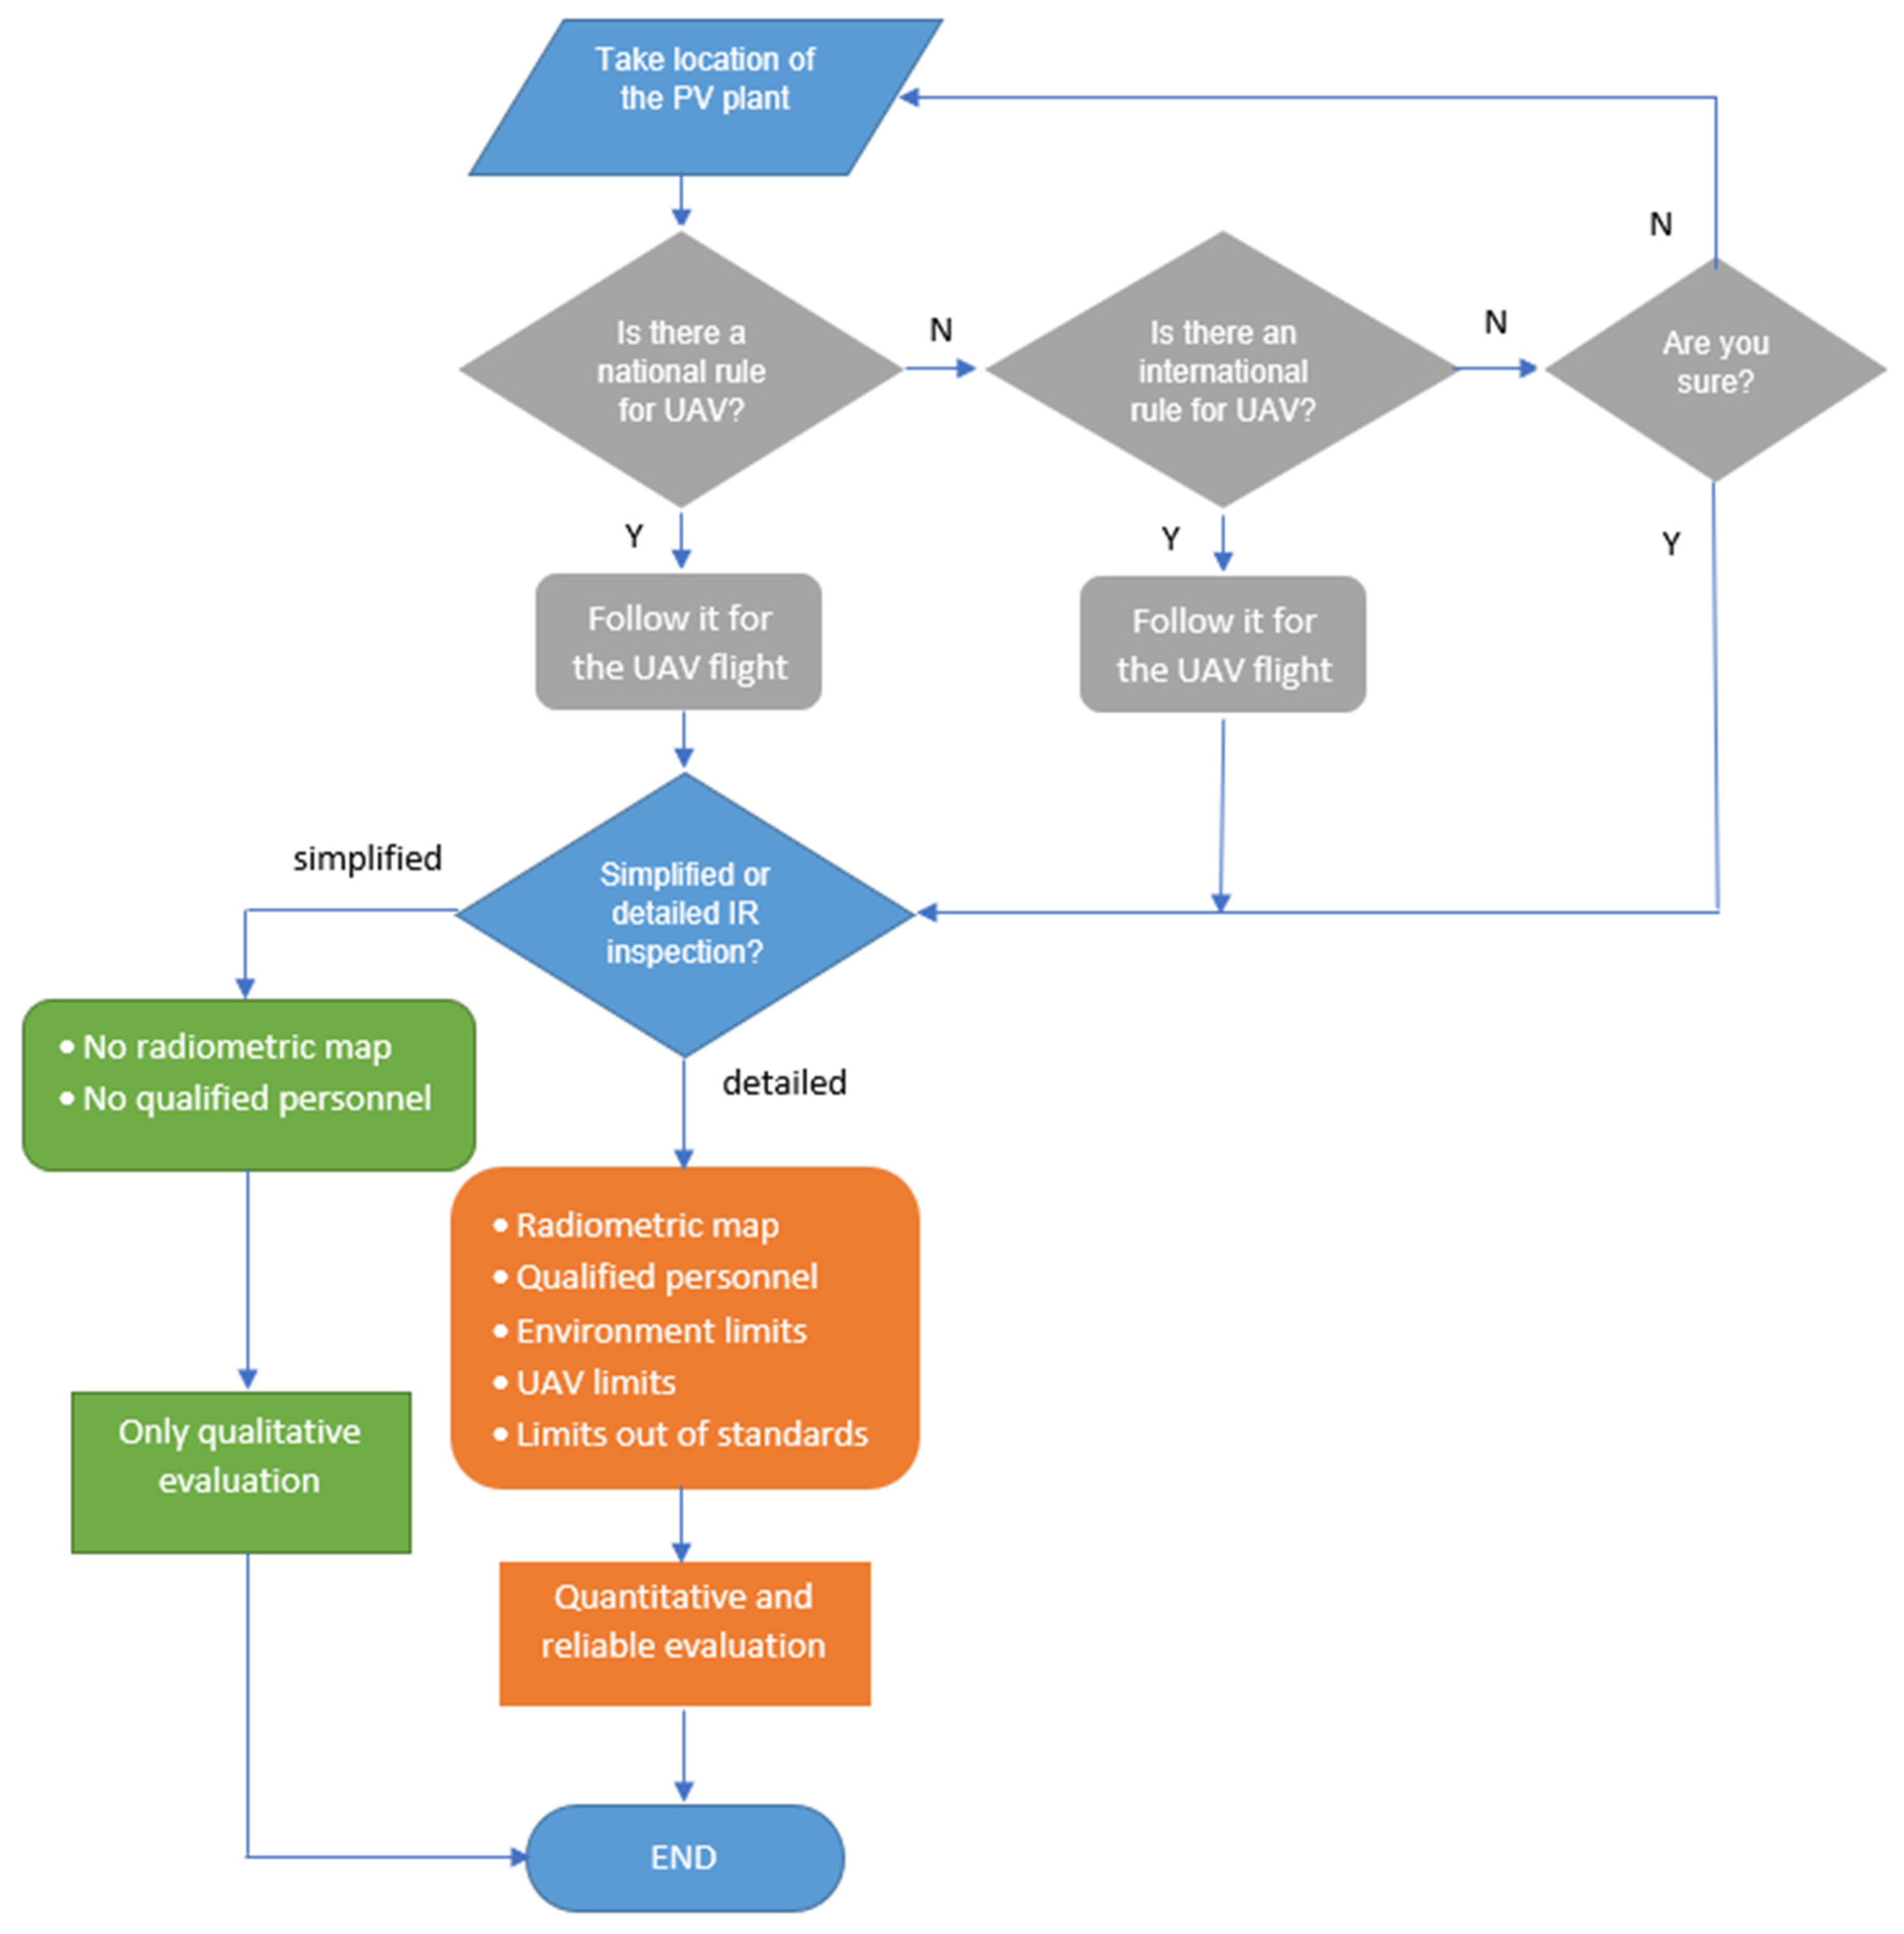
3. Methodology for the Reliable IR Inspection of a PV Module with a UAV

Figure 2 described the main components and the operation of a joined UAV-IR camera system for a cloud-based inspection of PV modules. However, an effective and reliable UAV-based IR inspection requires that the operation of the UAV satisfies several constraints (and this is not always possible) and that the settings of the IR camera are appropriate for the mutual position between the drone and the PV modules. As many requirements are needed, Figure 3 reports a methodology for evaluating the main concerns about an IR inspection based on drones. The gray boxes deal with issues related to the safe operation of a UAV, and they will be discussed in Section 3.1. The green boxes deal with qualitative IR inspection that is not based on the radiometric maps of the PV modules, and they will be discussed in Section 3.2. The orange boxes deal with quantitative IR inspection that is based on radiometric maps, and they will also be discussed in Section 3.2, excluding the last item, i.e., Limits out of standards in the orange block of Figure 3. In fact, some requirements contained in this item are not defined in the international standards, and neglecting them will lead to unreliable results. The issues of this item will be discussed in Section 4. The detailed analysis returns more reliable results, but stringent requirements must be satisfied.

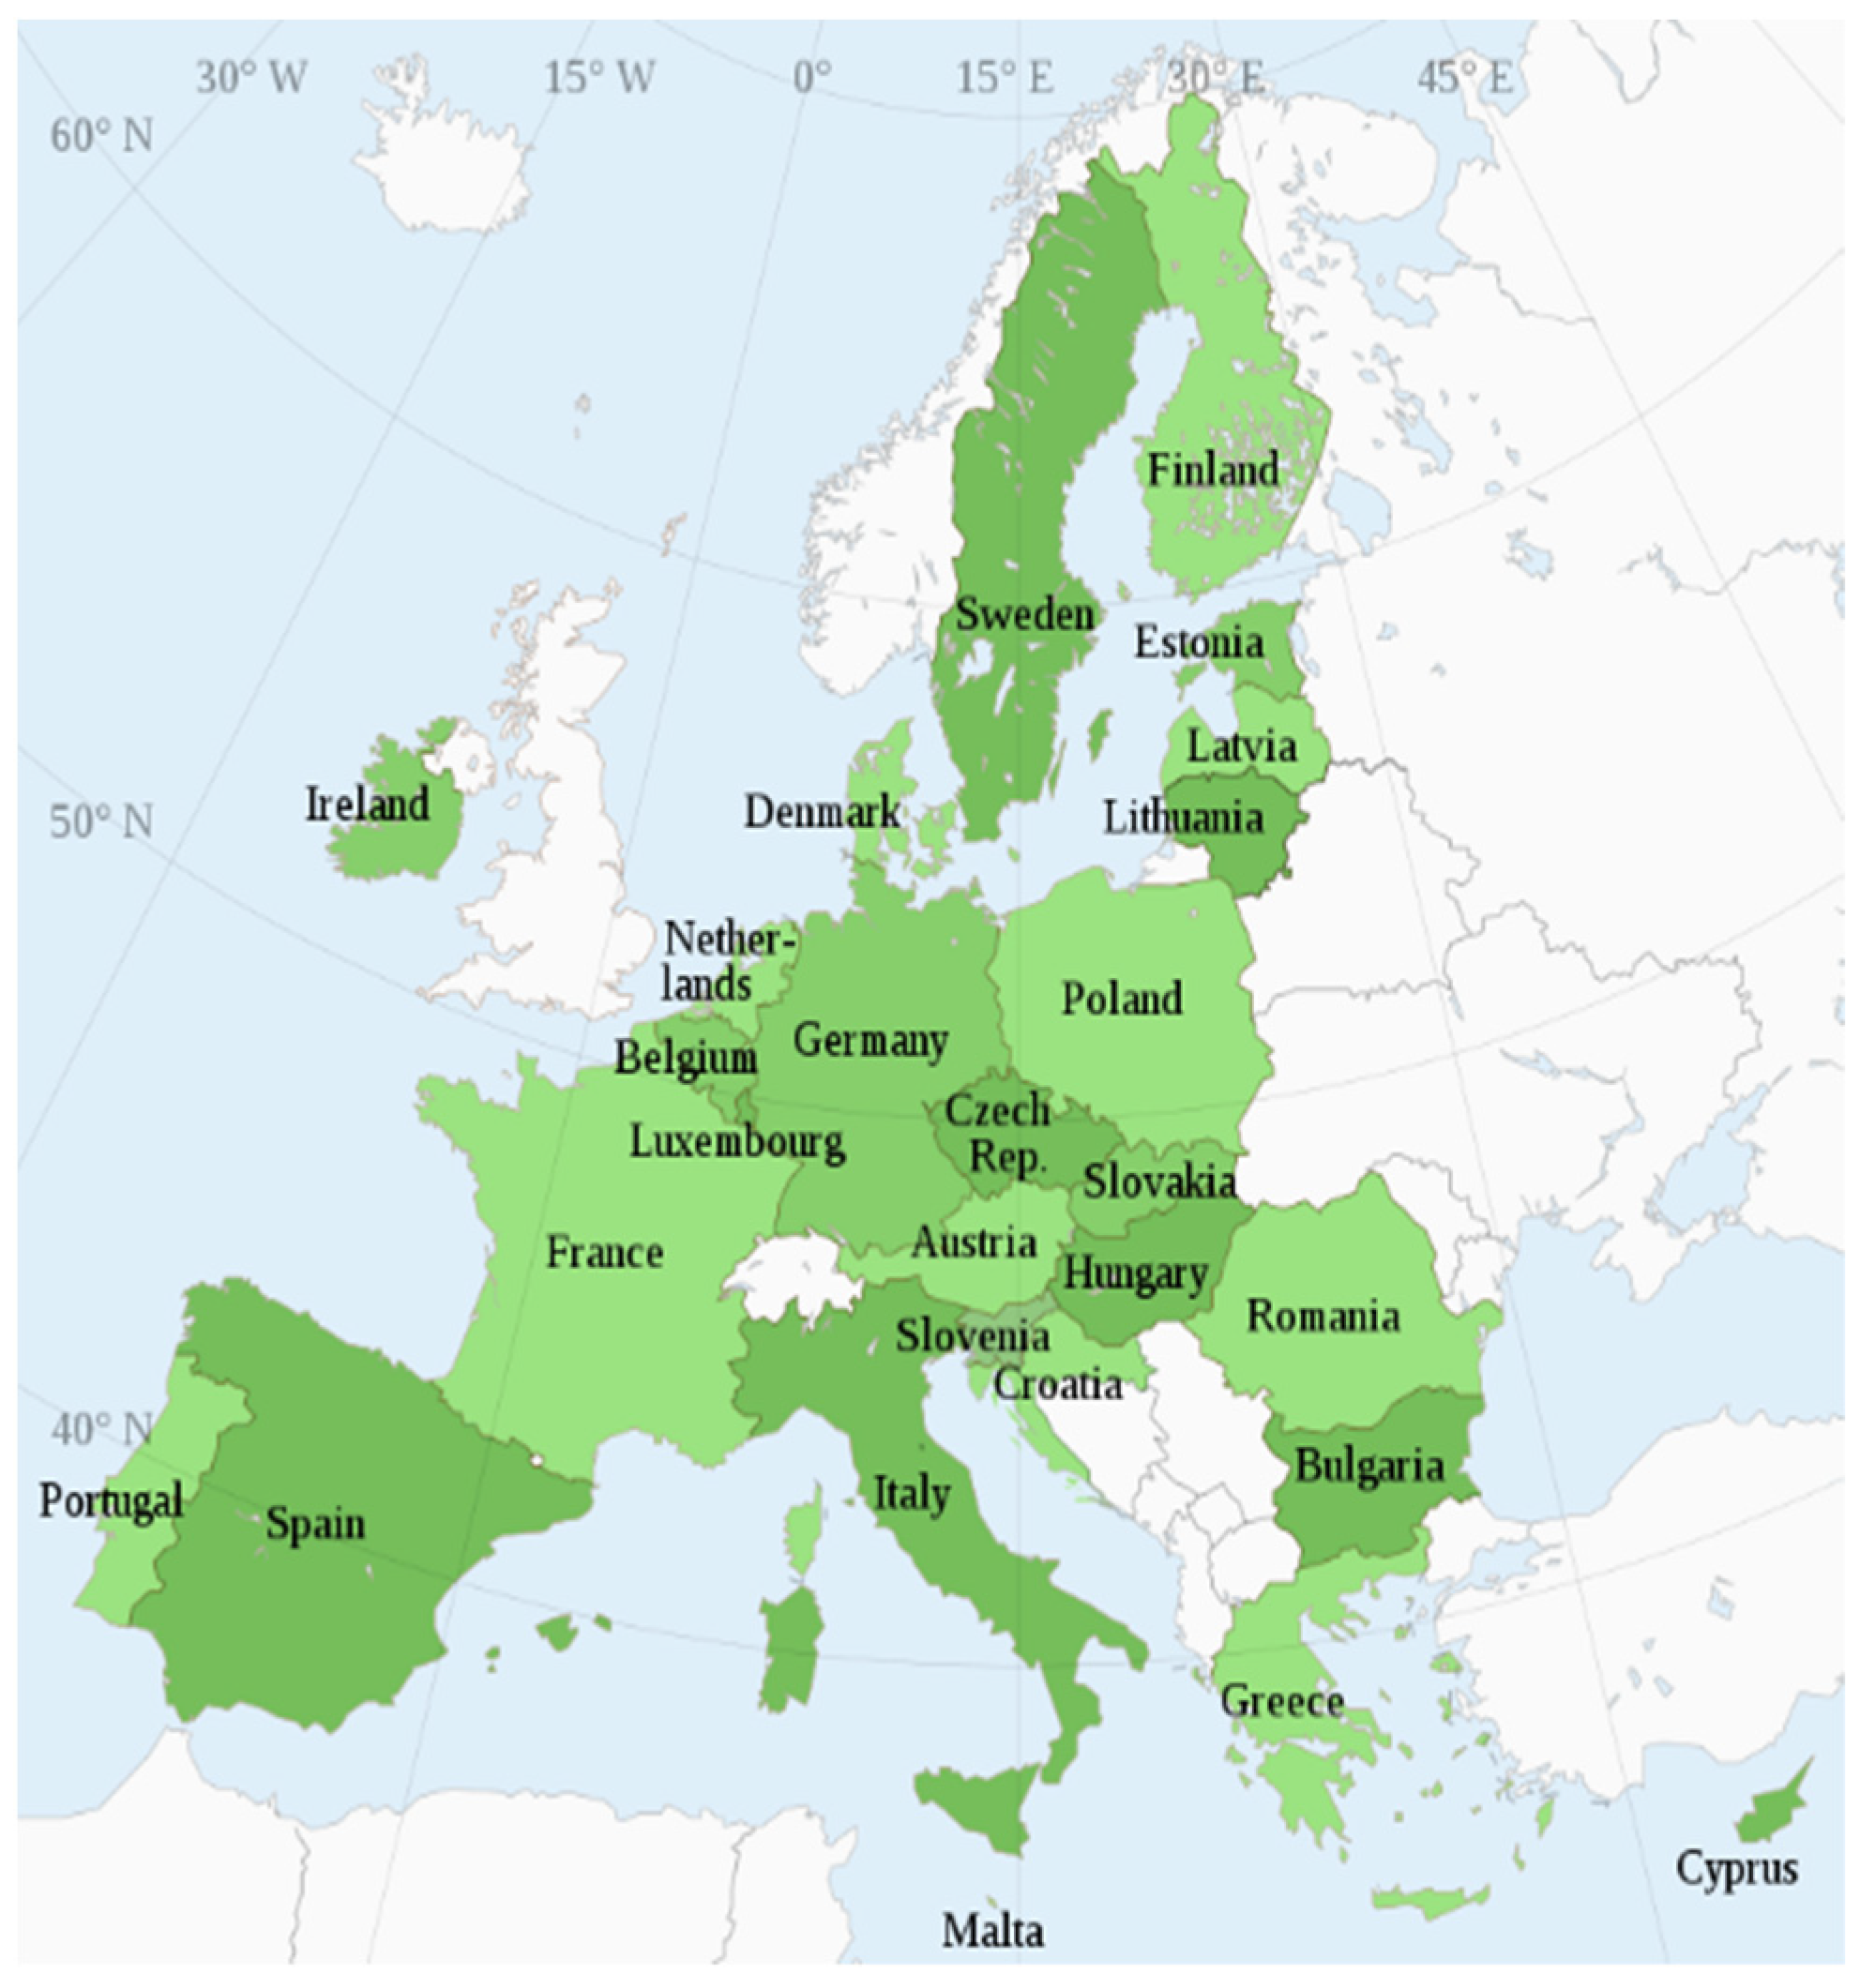
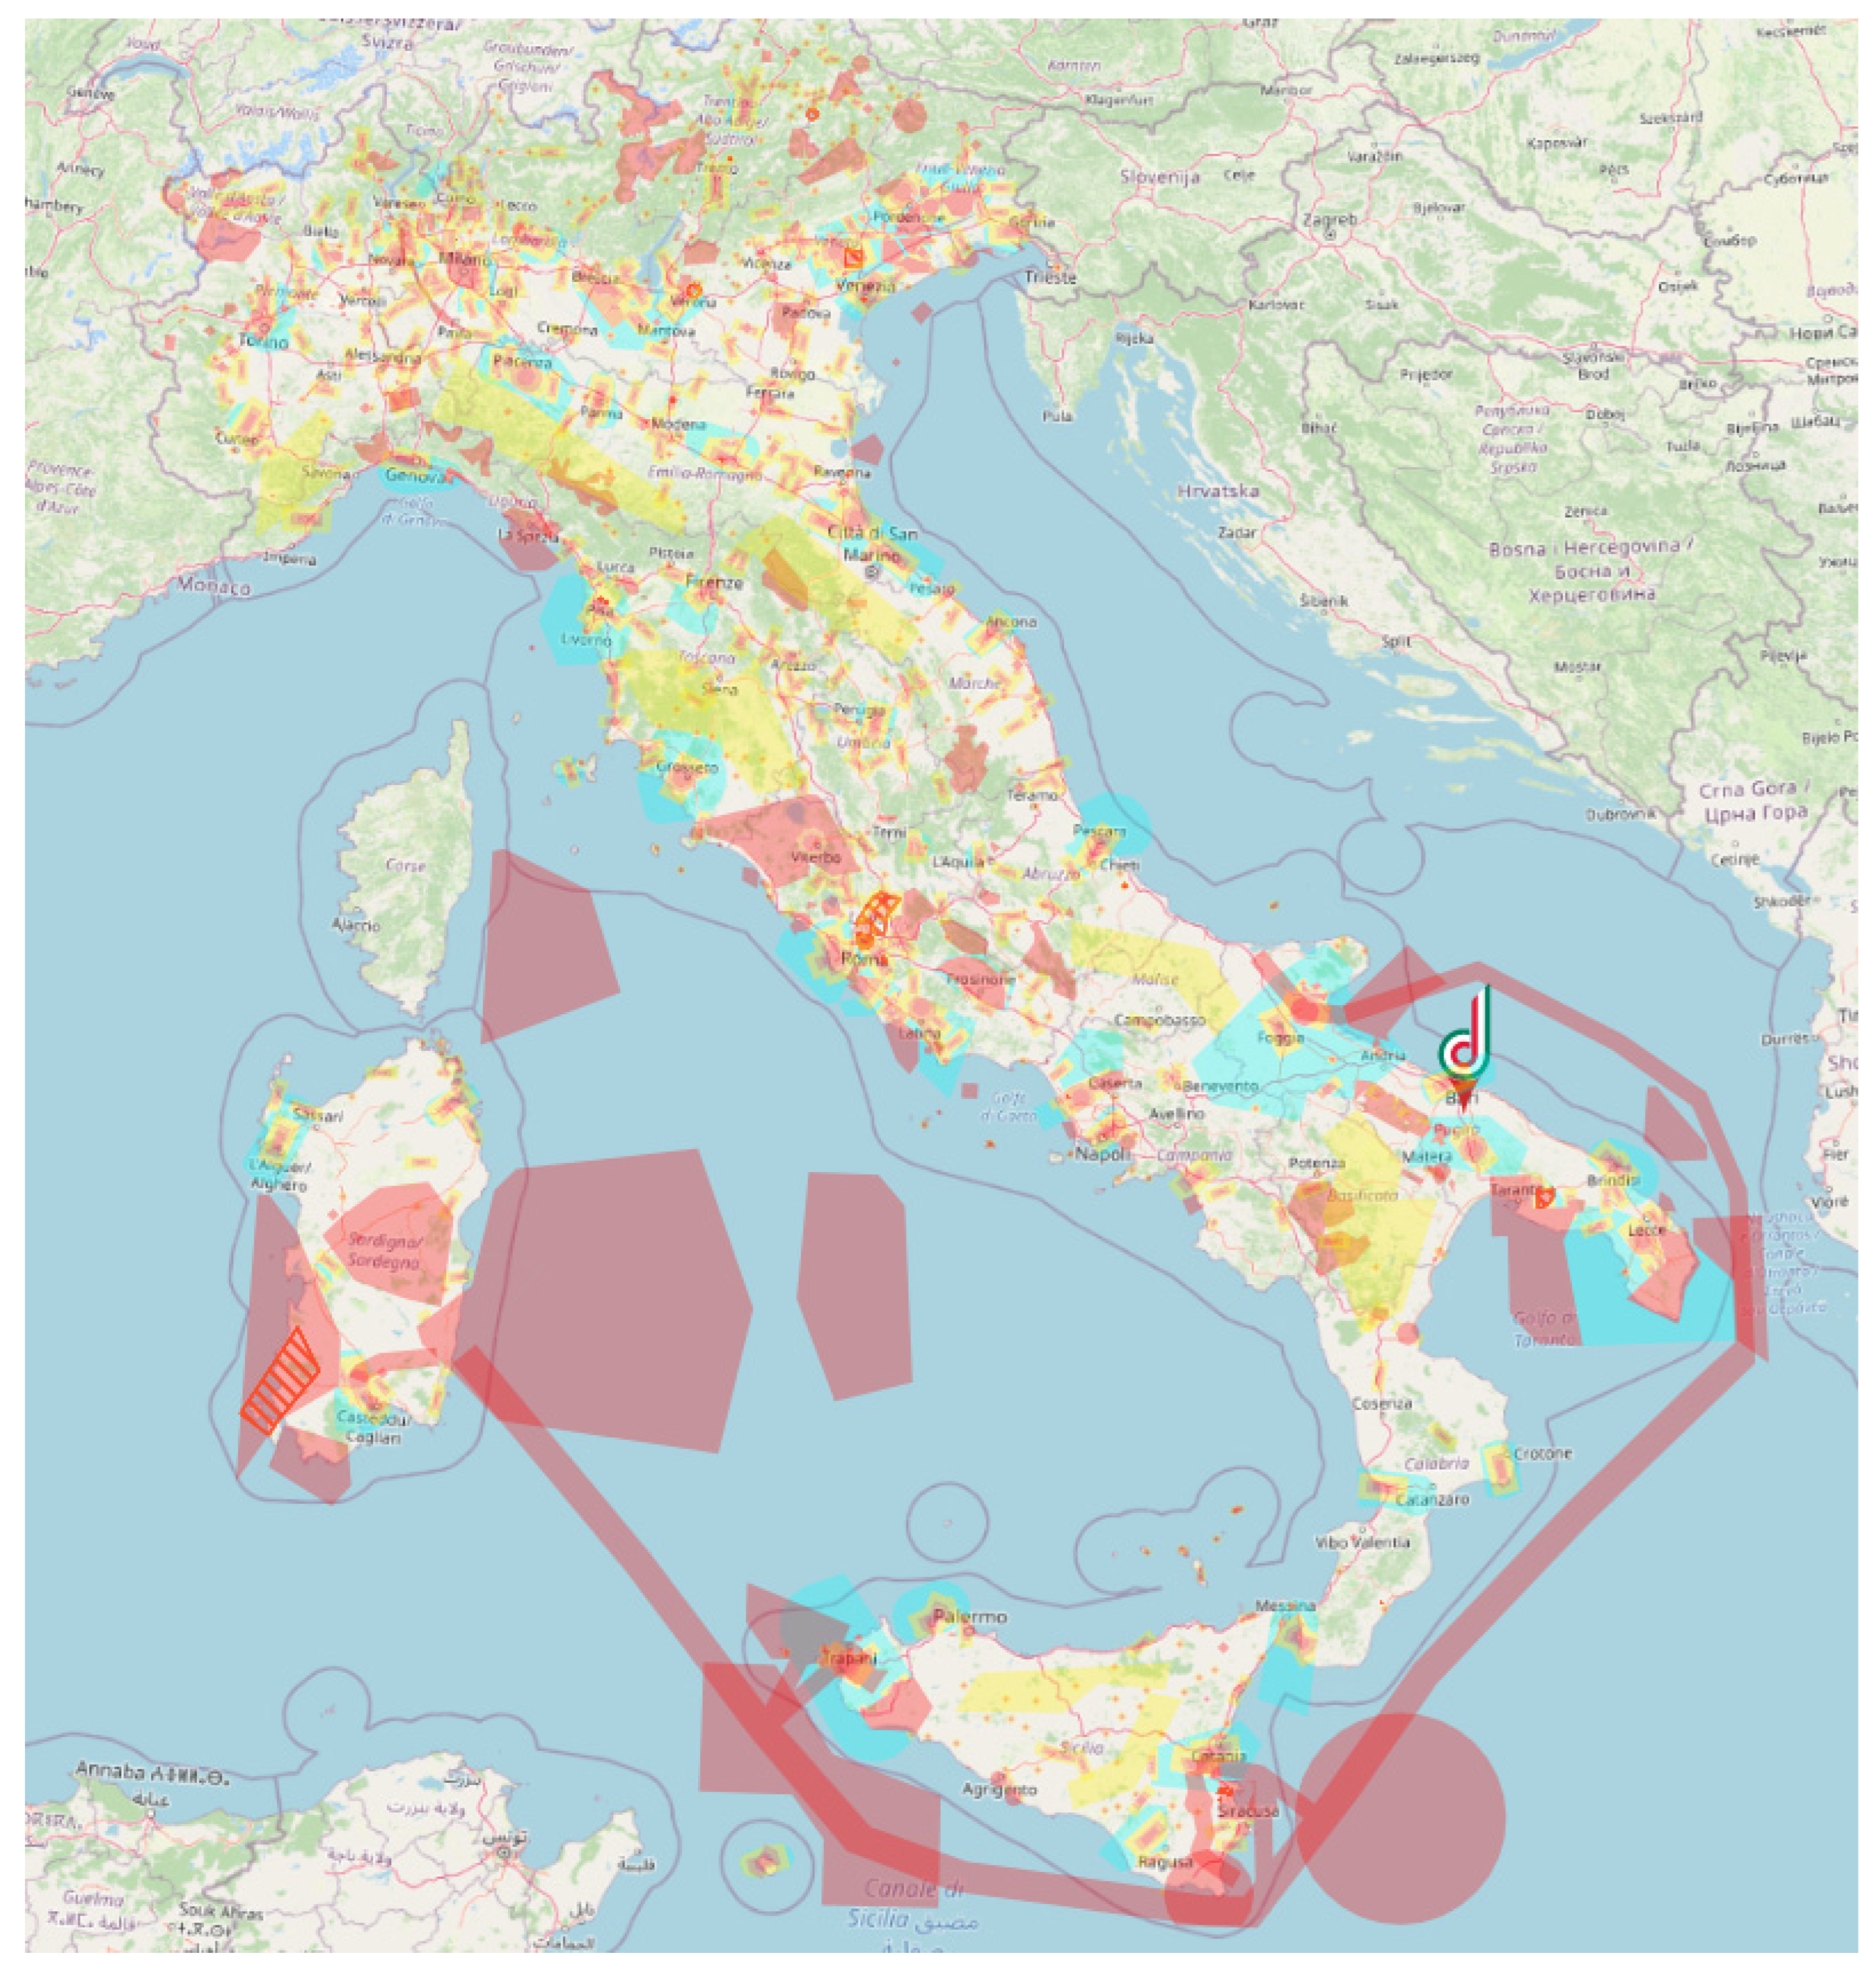
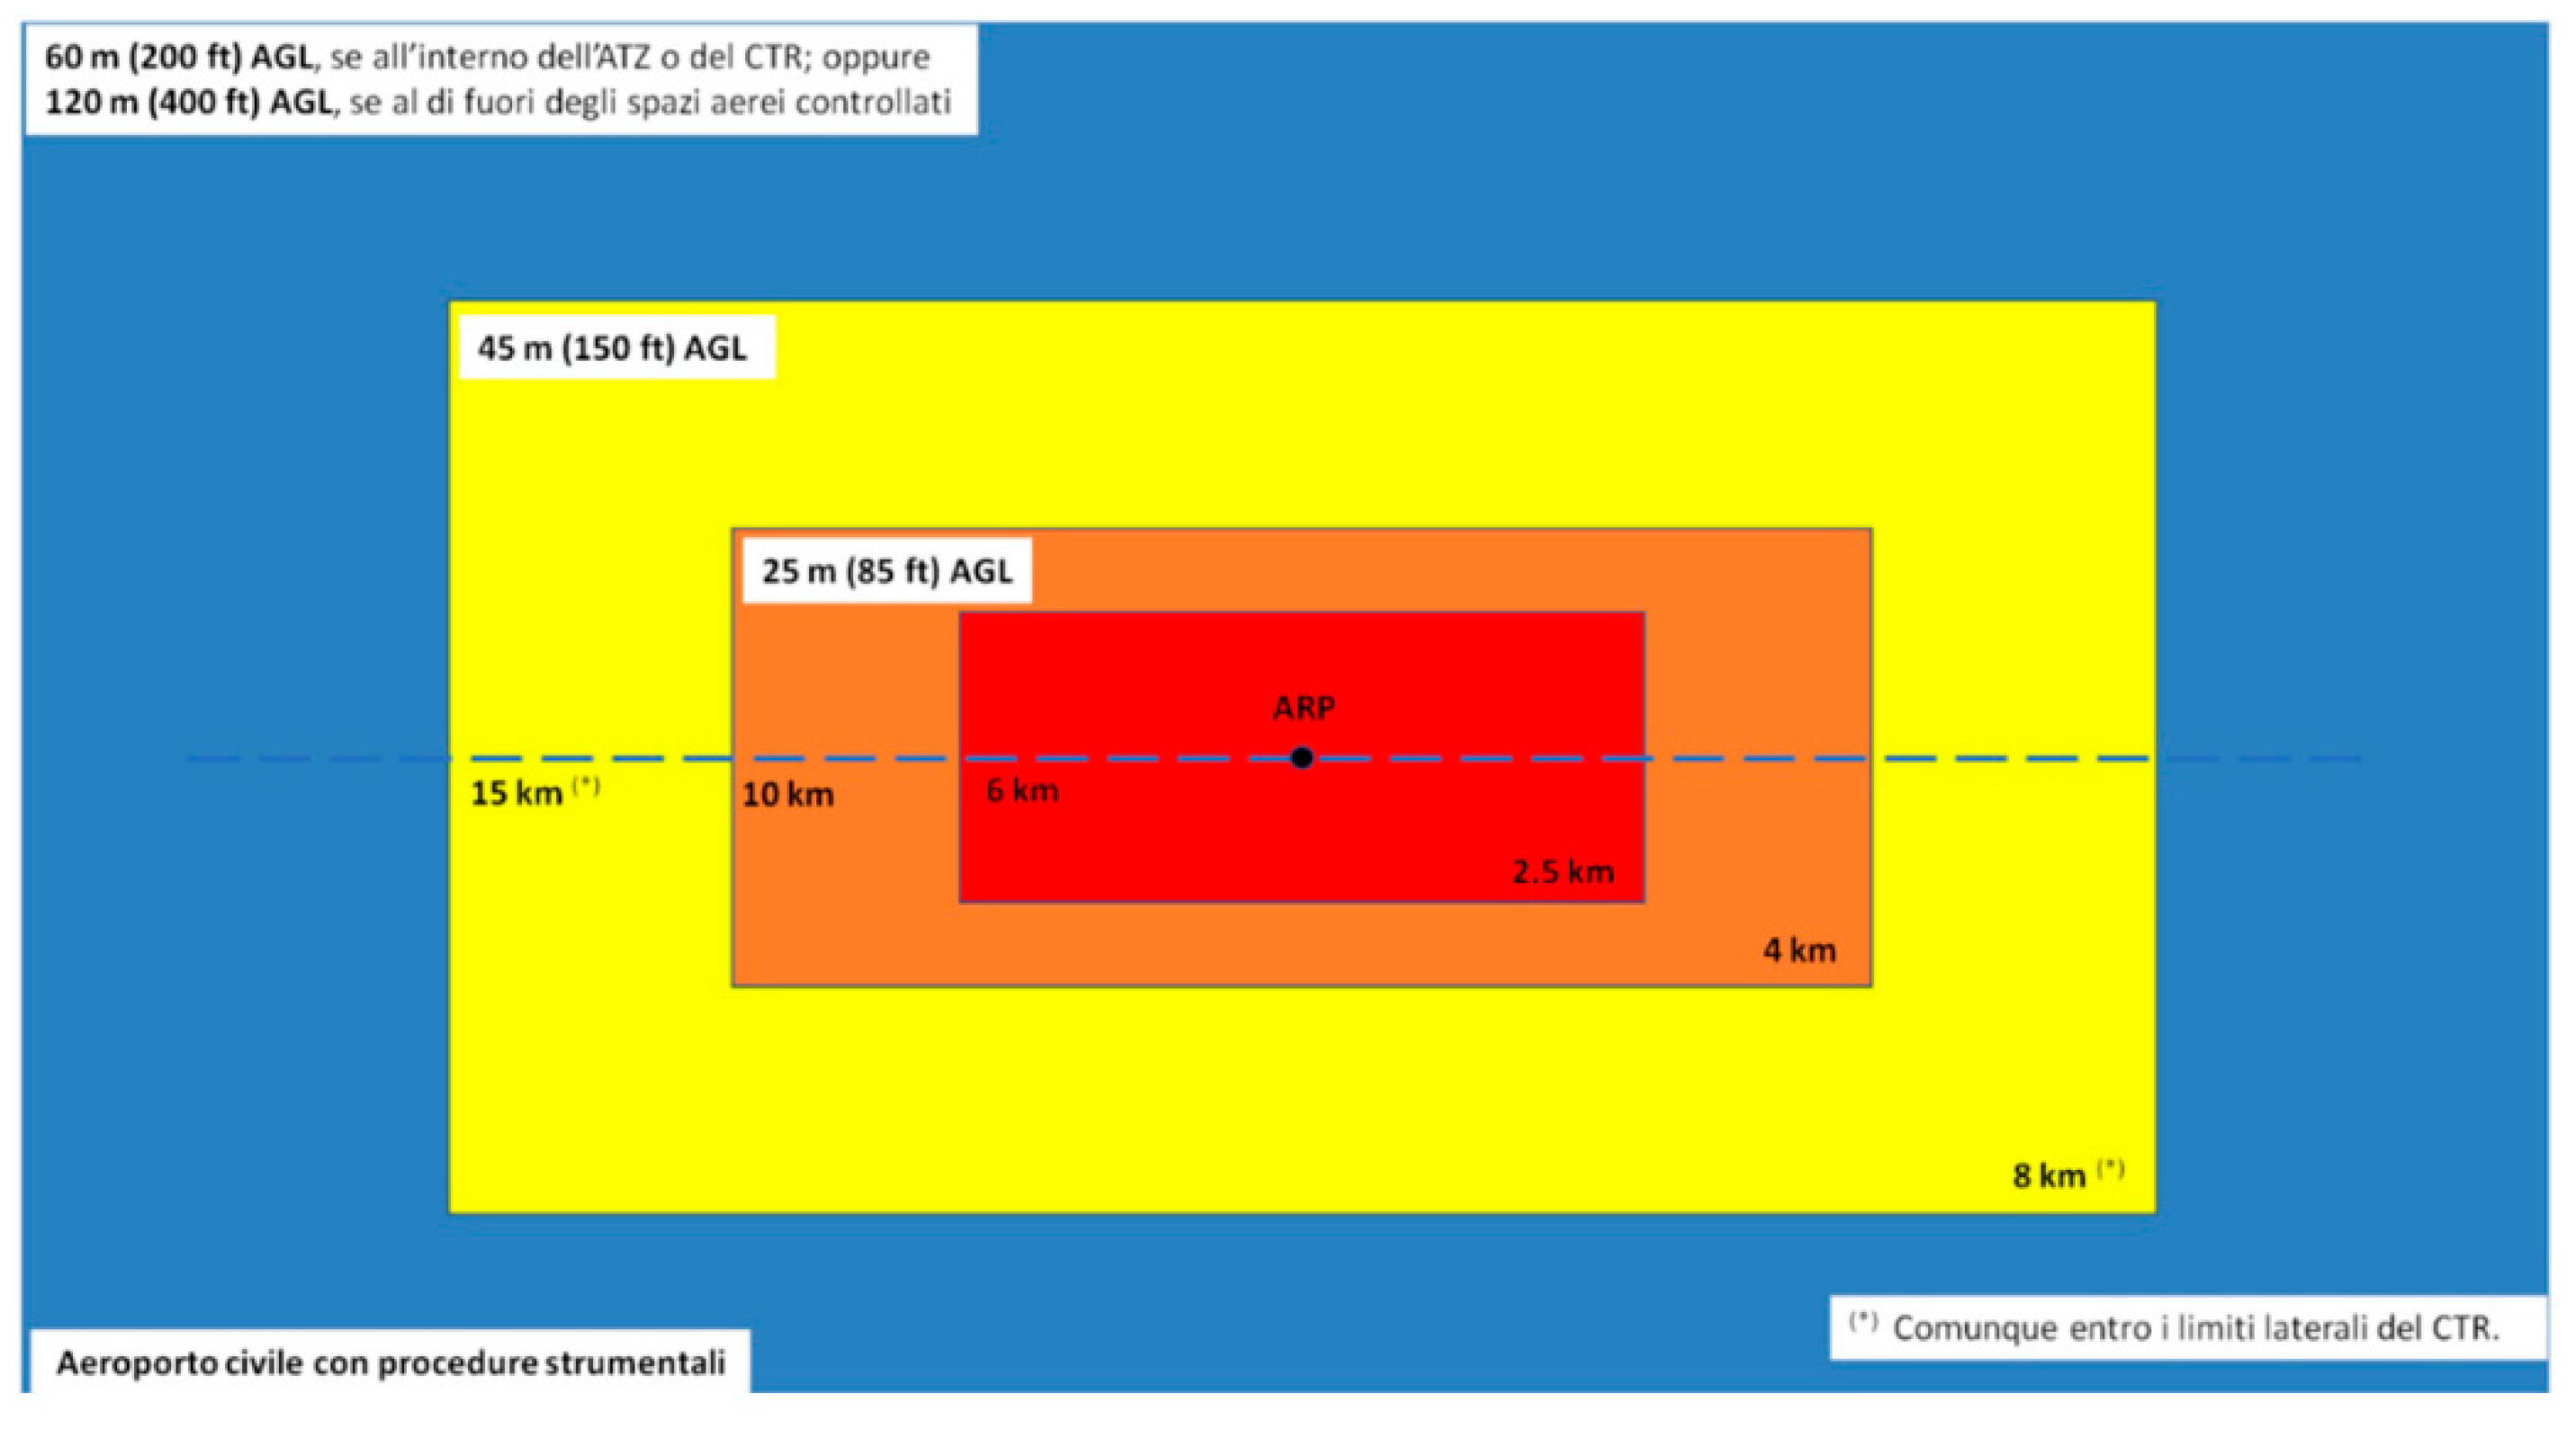
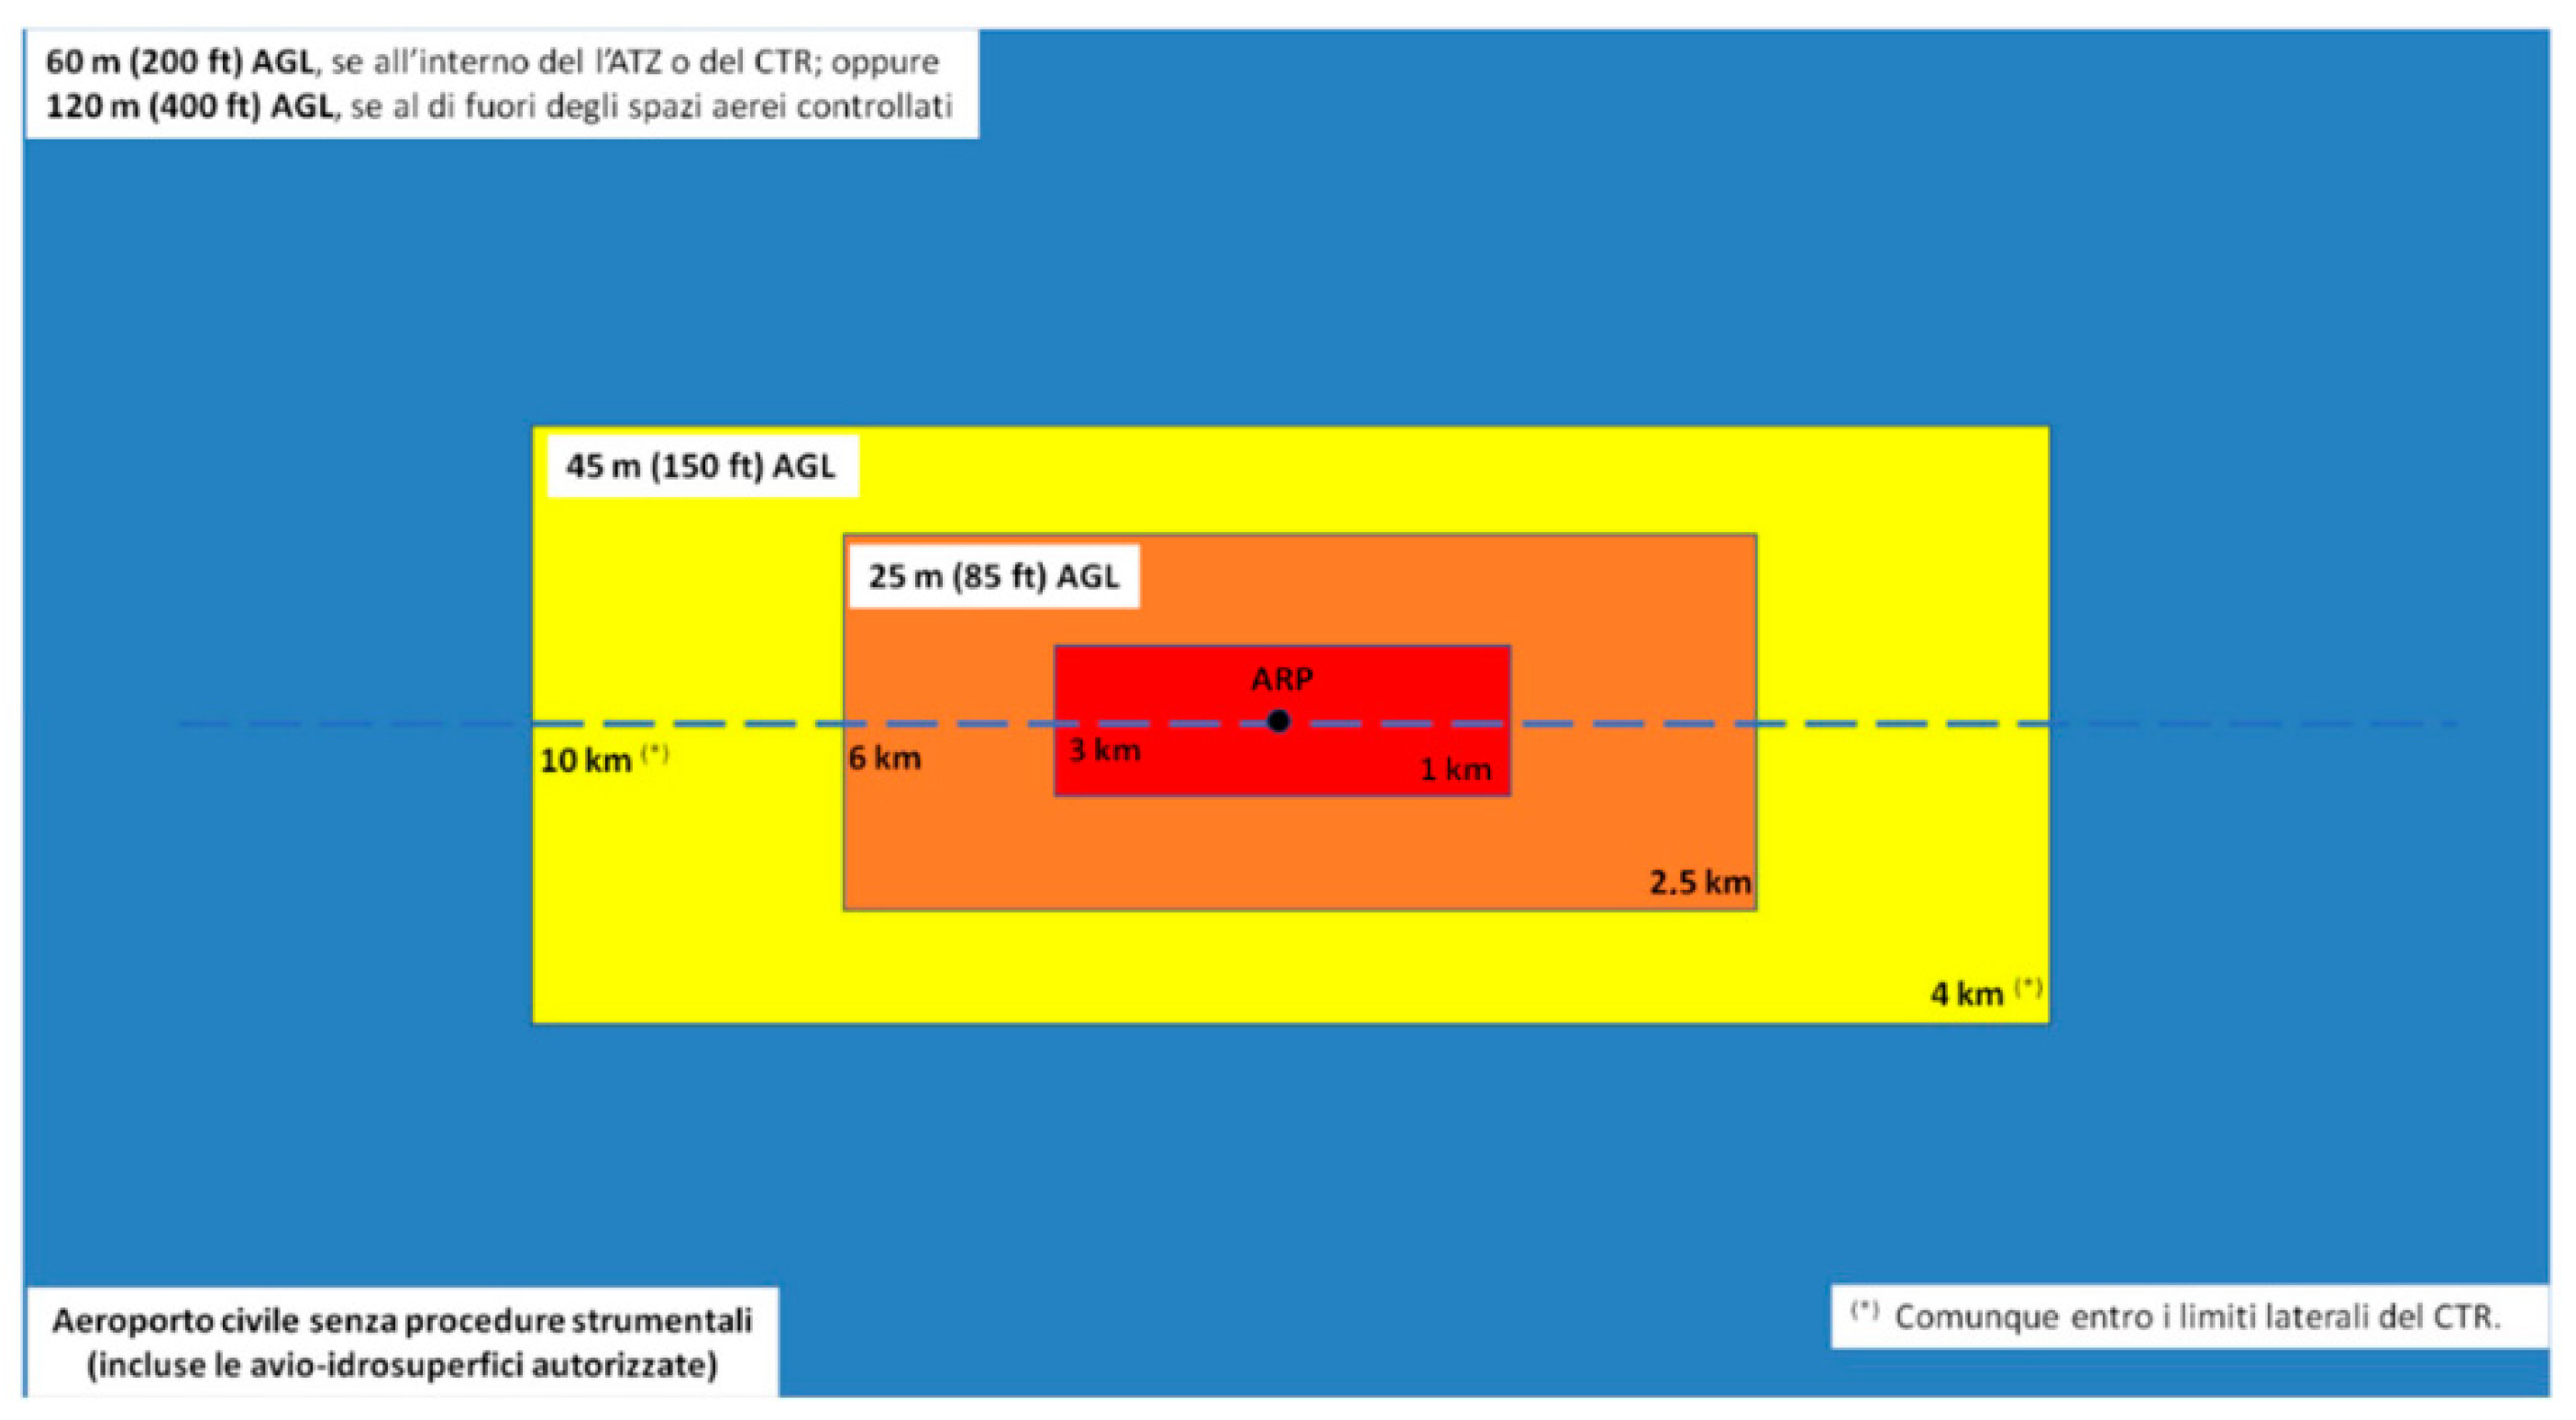
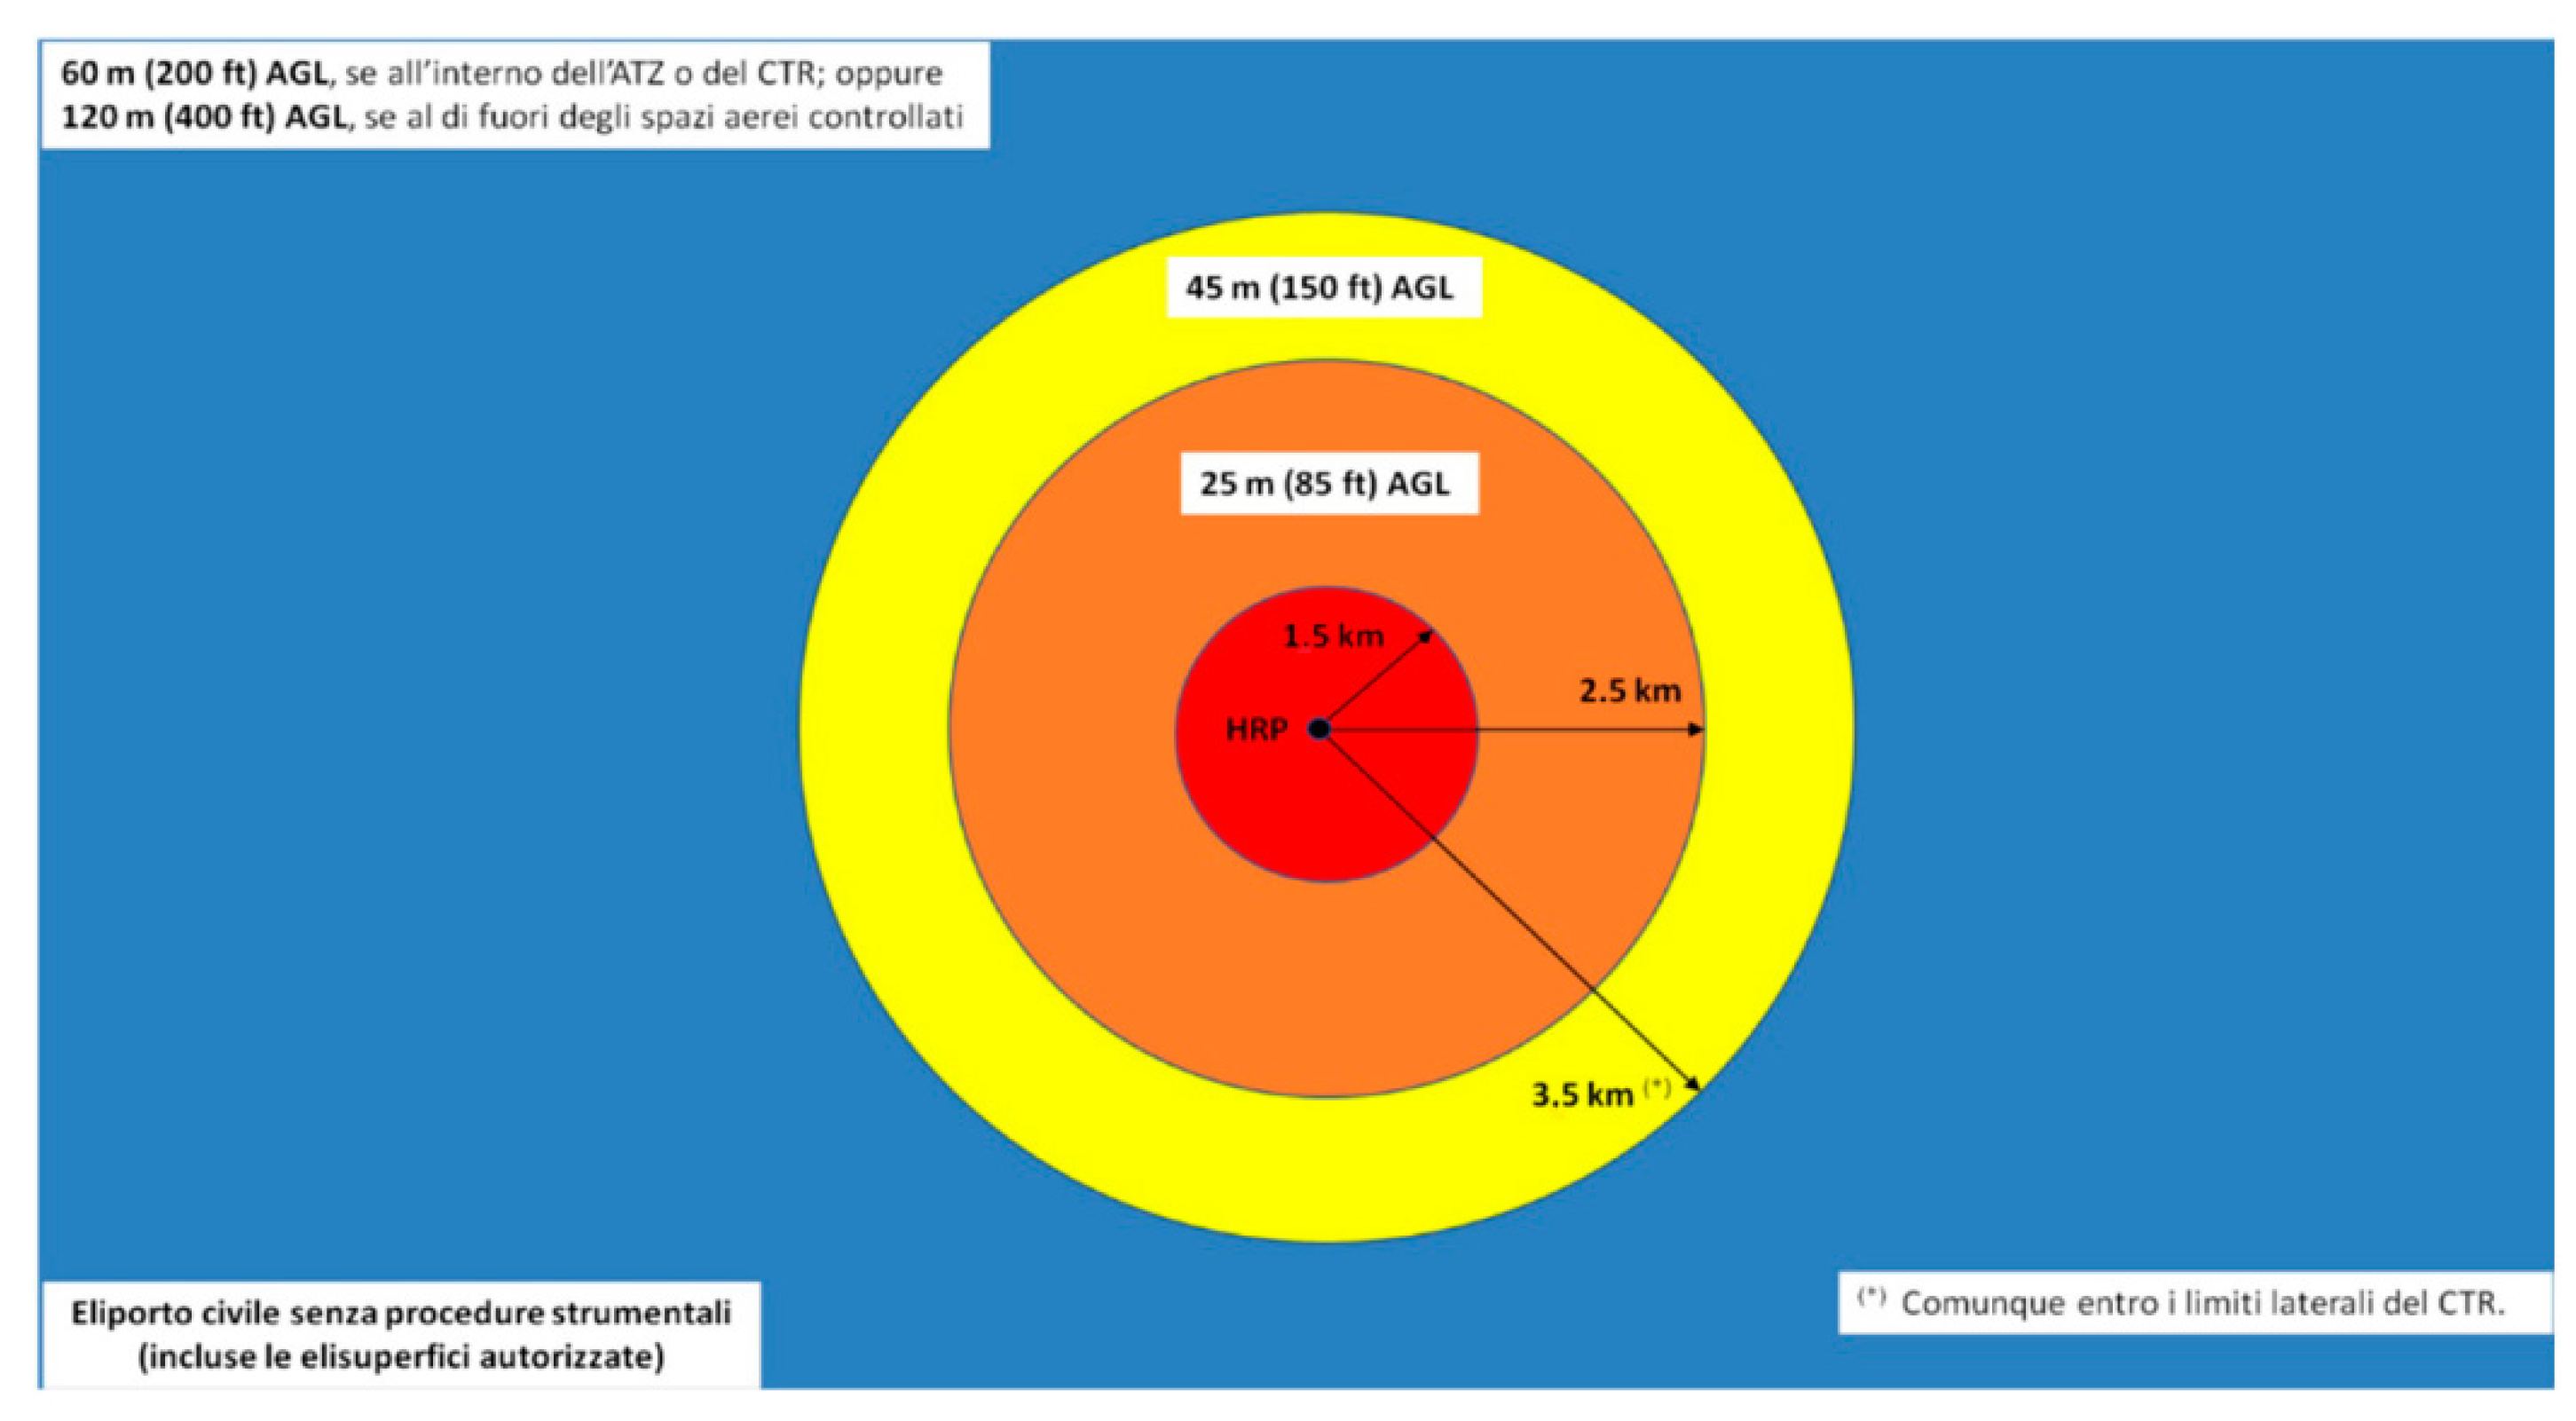
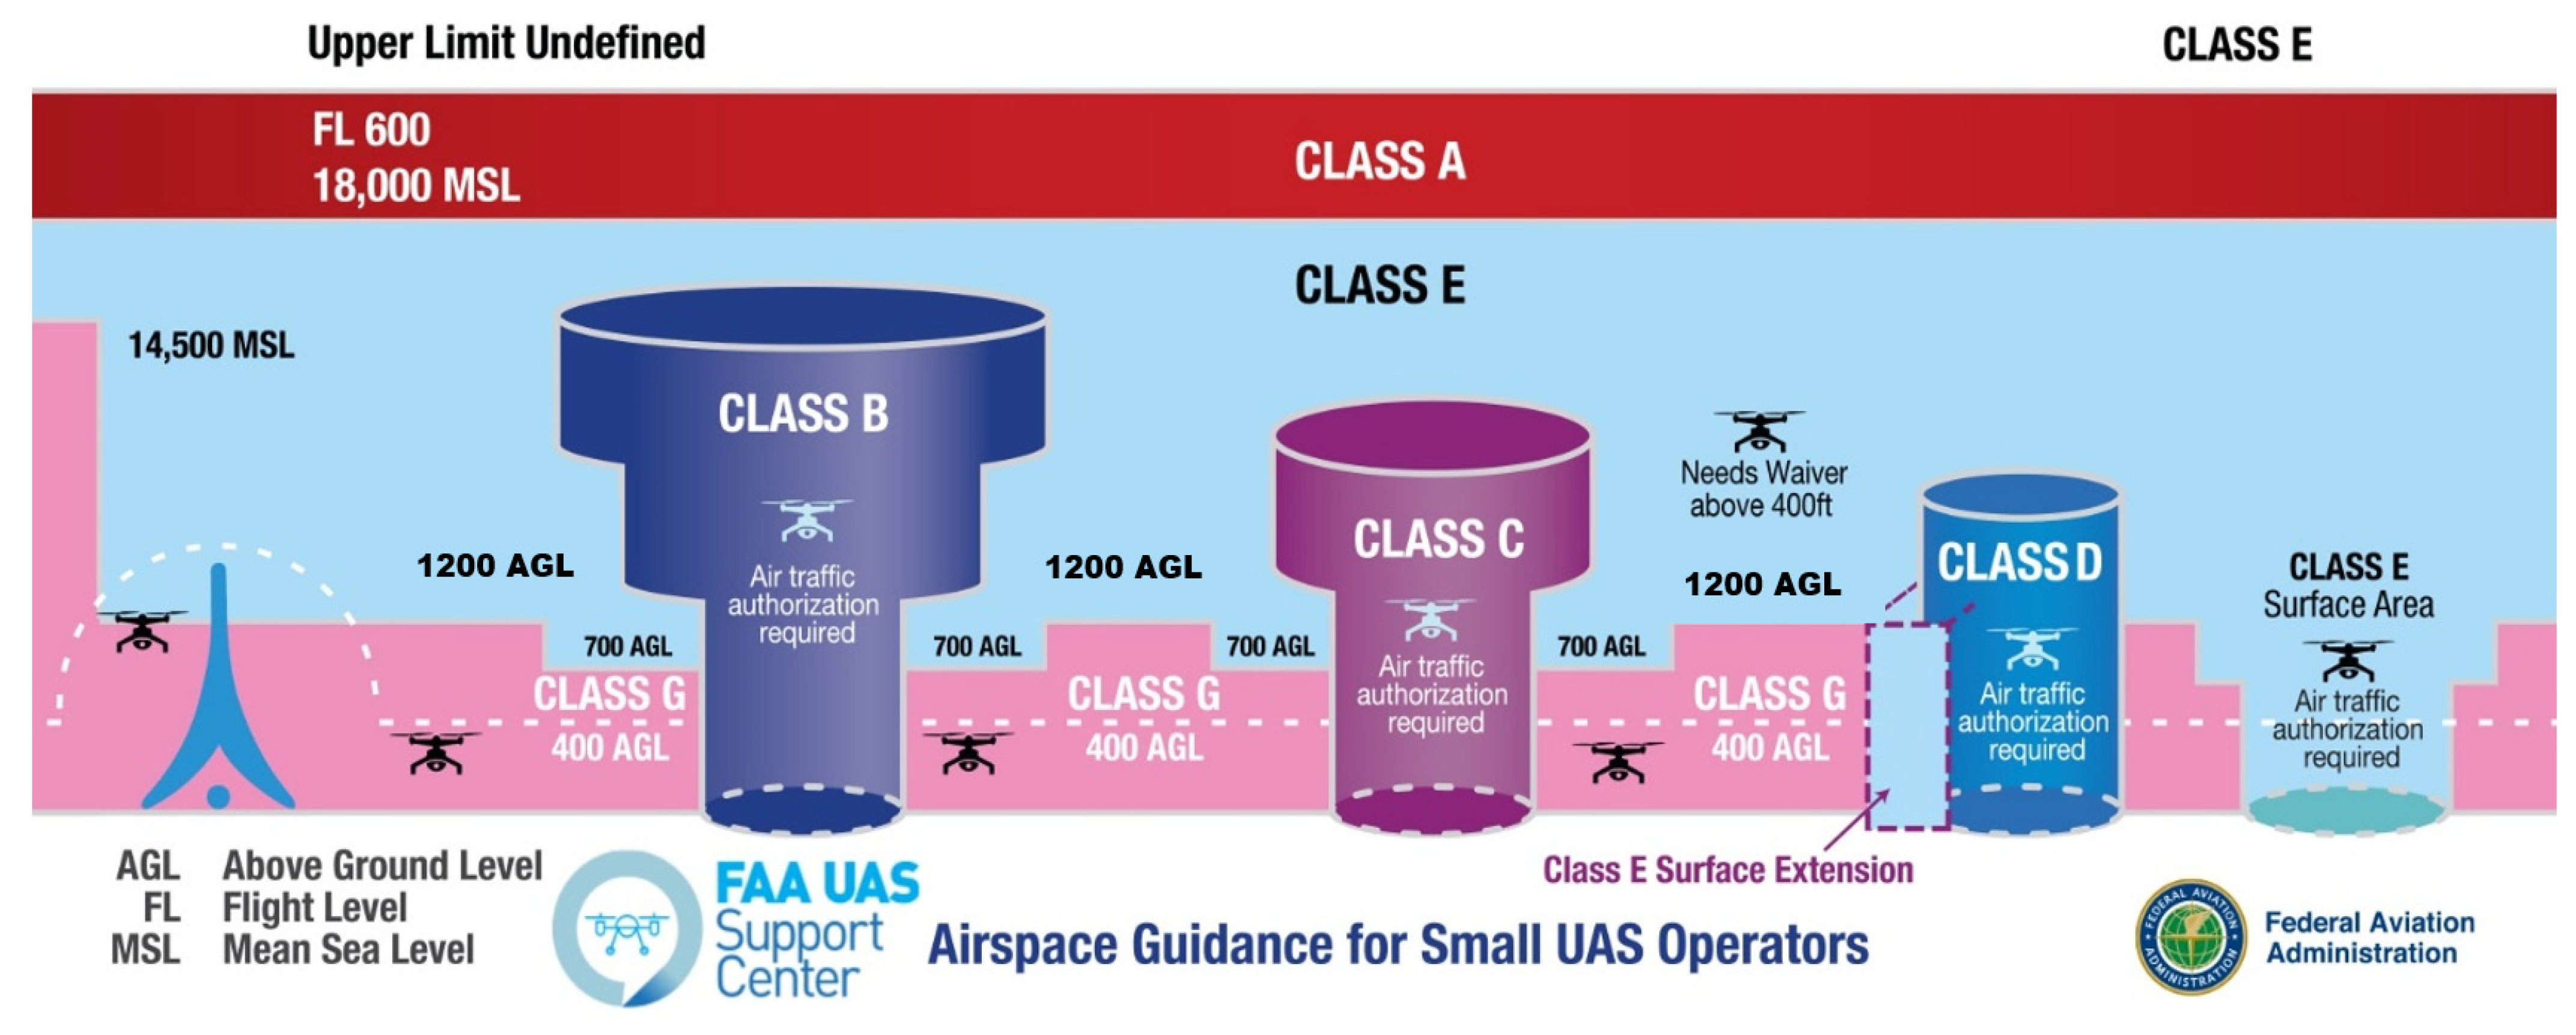
3.1. Different Countries, Different Rules for UAVs

This subsection details the issues of the gray blocks in Figure 3. EASA is the European agency for the strategy of aviation safety. It promotes the highest common standards of safety and environmental protection in civil aviation and develops common safety and environmental rules at the European level. It supervises through inspections that the member states implement and supports them with technical expertise, training, and research [20]. The main EASA rule for UAVs is the Regulation EU 2019/947 [21], and the activities by UAVs are classified as open, specific, and certified, as based on several factors affecting human safety. Before introducing them, it is important to define the several actors involved in a flight mission and their roles. The operator is responsible for the whole operation: planning, organization, checking of the UAV and accessories, and maintenance of the UAV before and after the mission. The operator is usually the owner of the UAV or UAVs, and the operator can be a person or a company.
The operator, therefore, may not be the mission pilot. Instead, the pilot is the person who operates the UAV during the flight. He/she is the person in charge of the flight activities, and he/she must have a competence certificate depending on the mission risk, but he/she is not responsible for the UAV maintenance, the administrative affairs, and so on, unless the operator and the pilot are the same person. The authority that certifies the pilot’s competence is unique in a state, but the authority for any flight mission, if requested, could be in charge of a different national, regional, or local body. With this in mind, the classification of a UAV mission is the following:
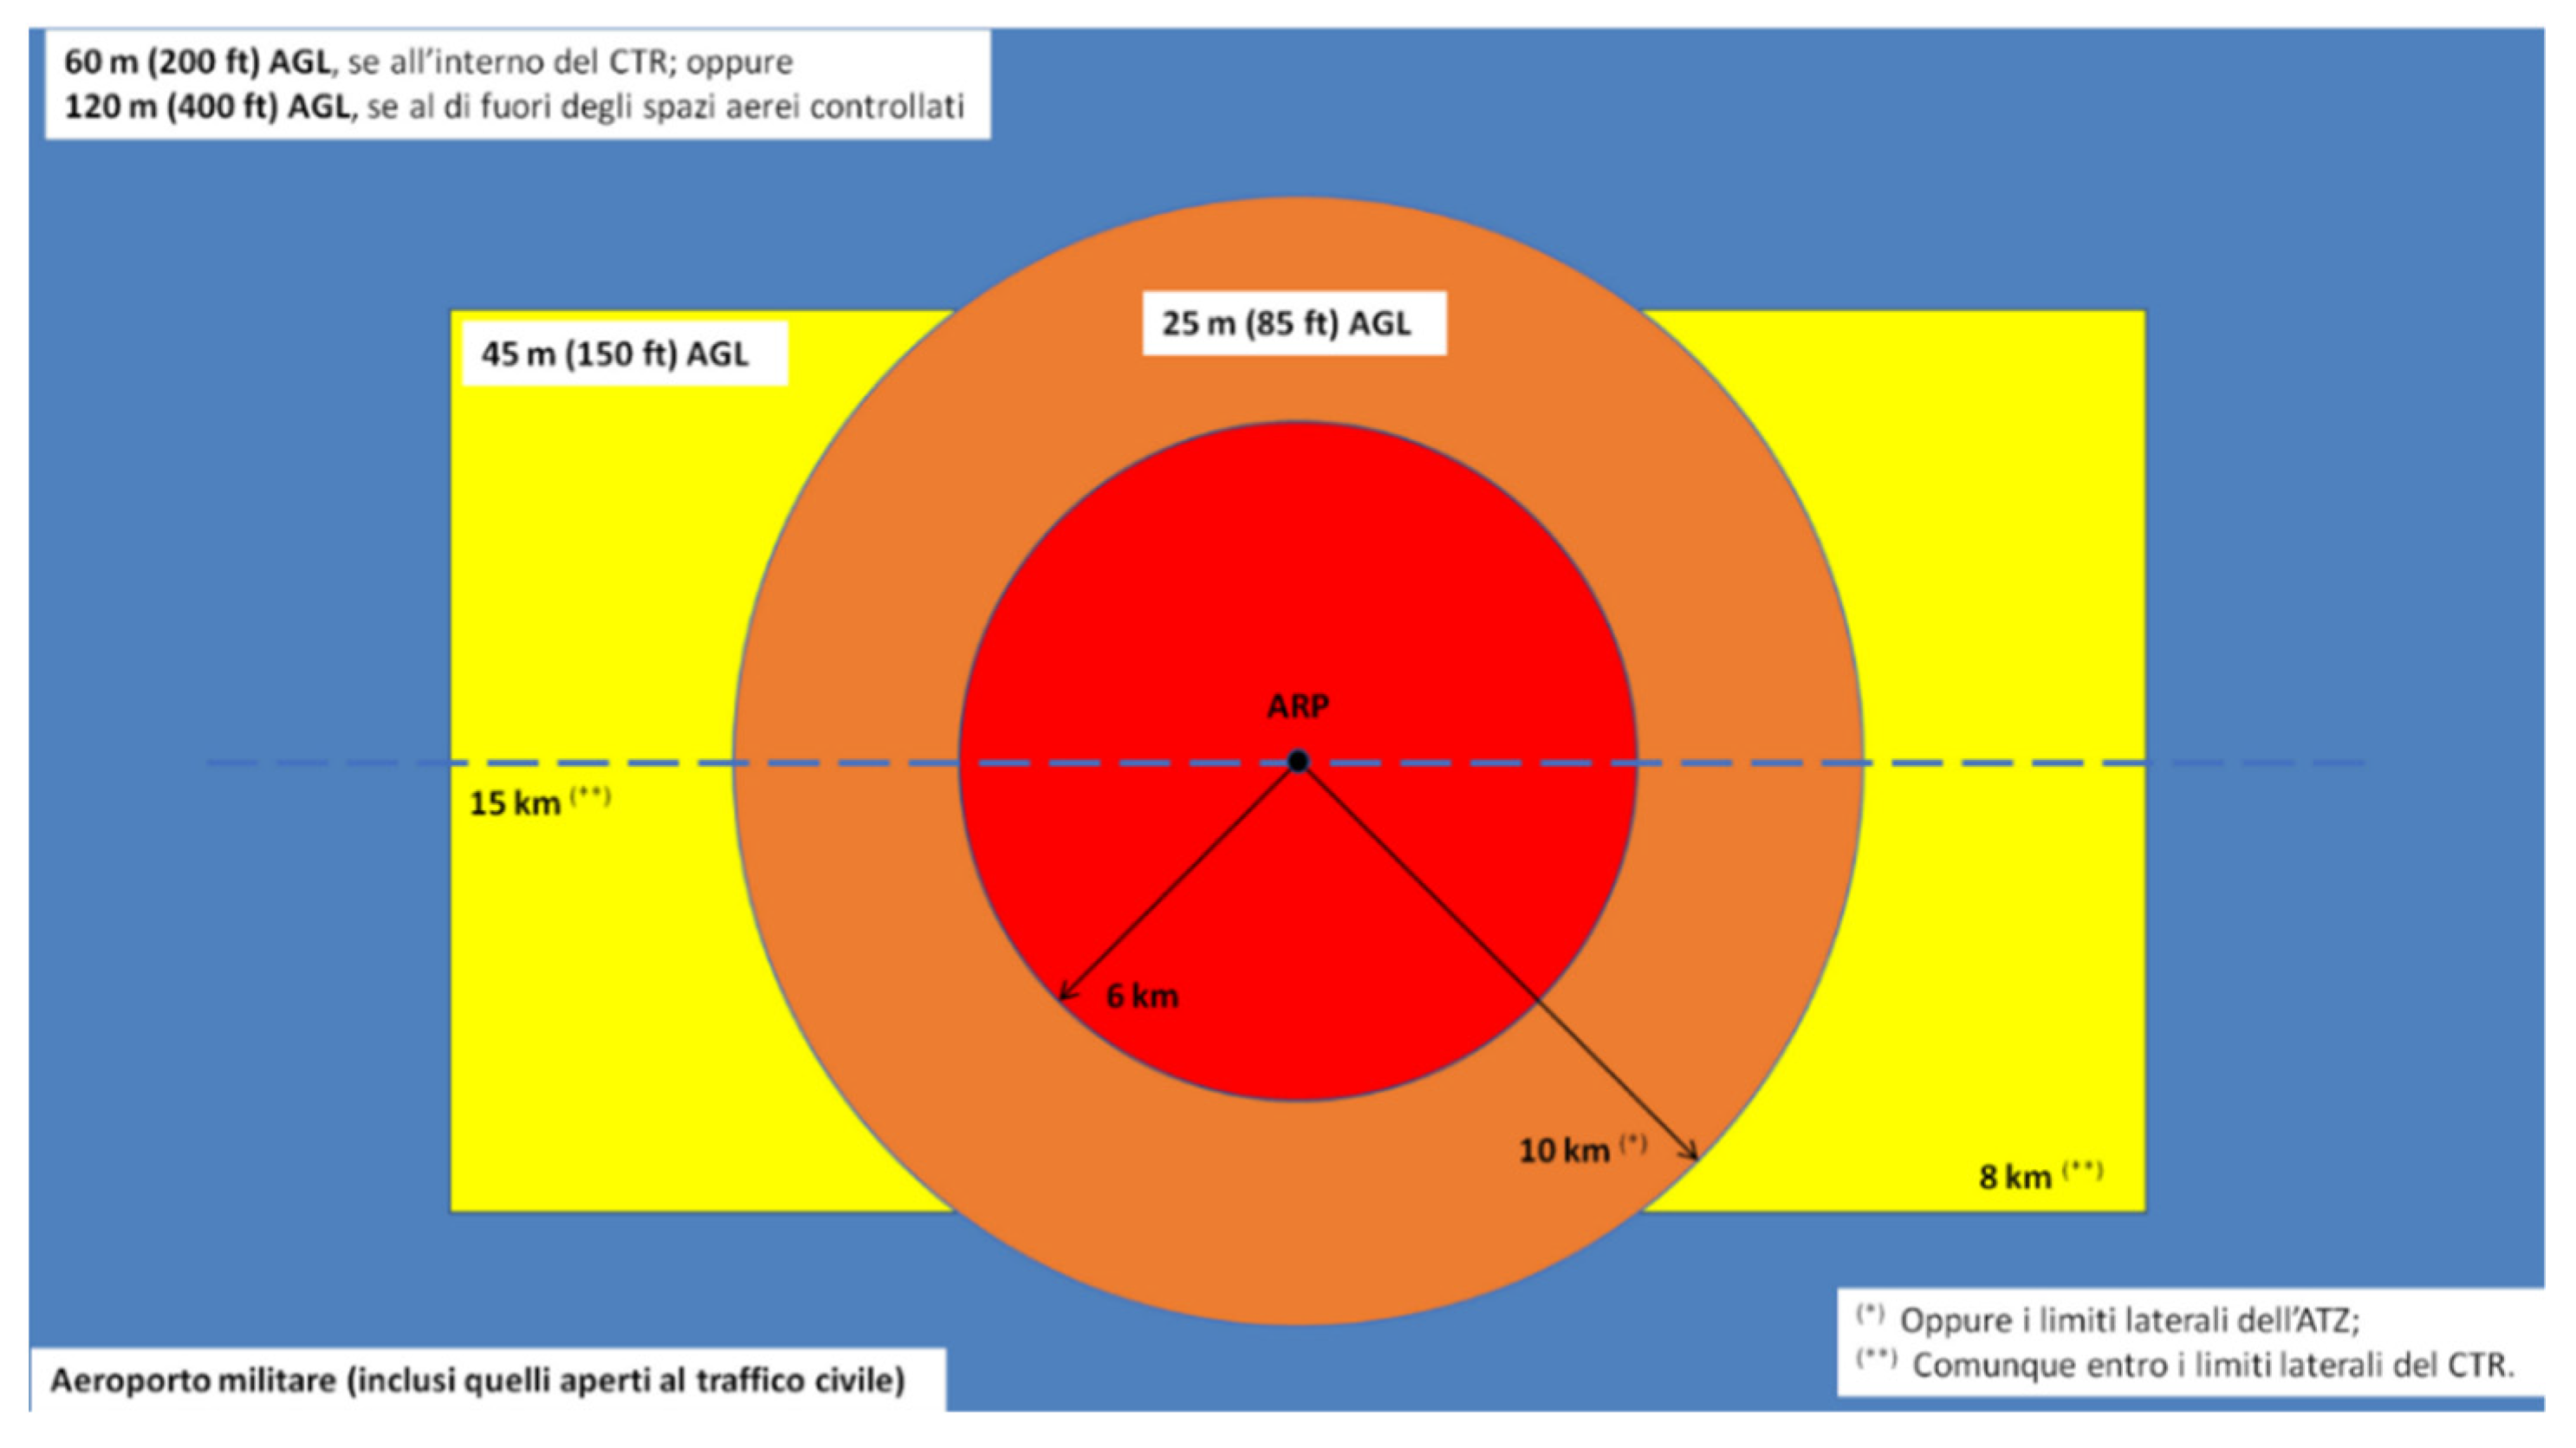
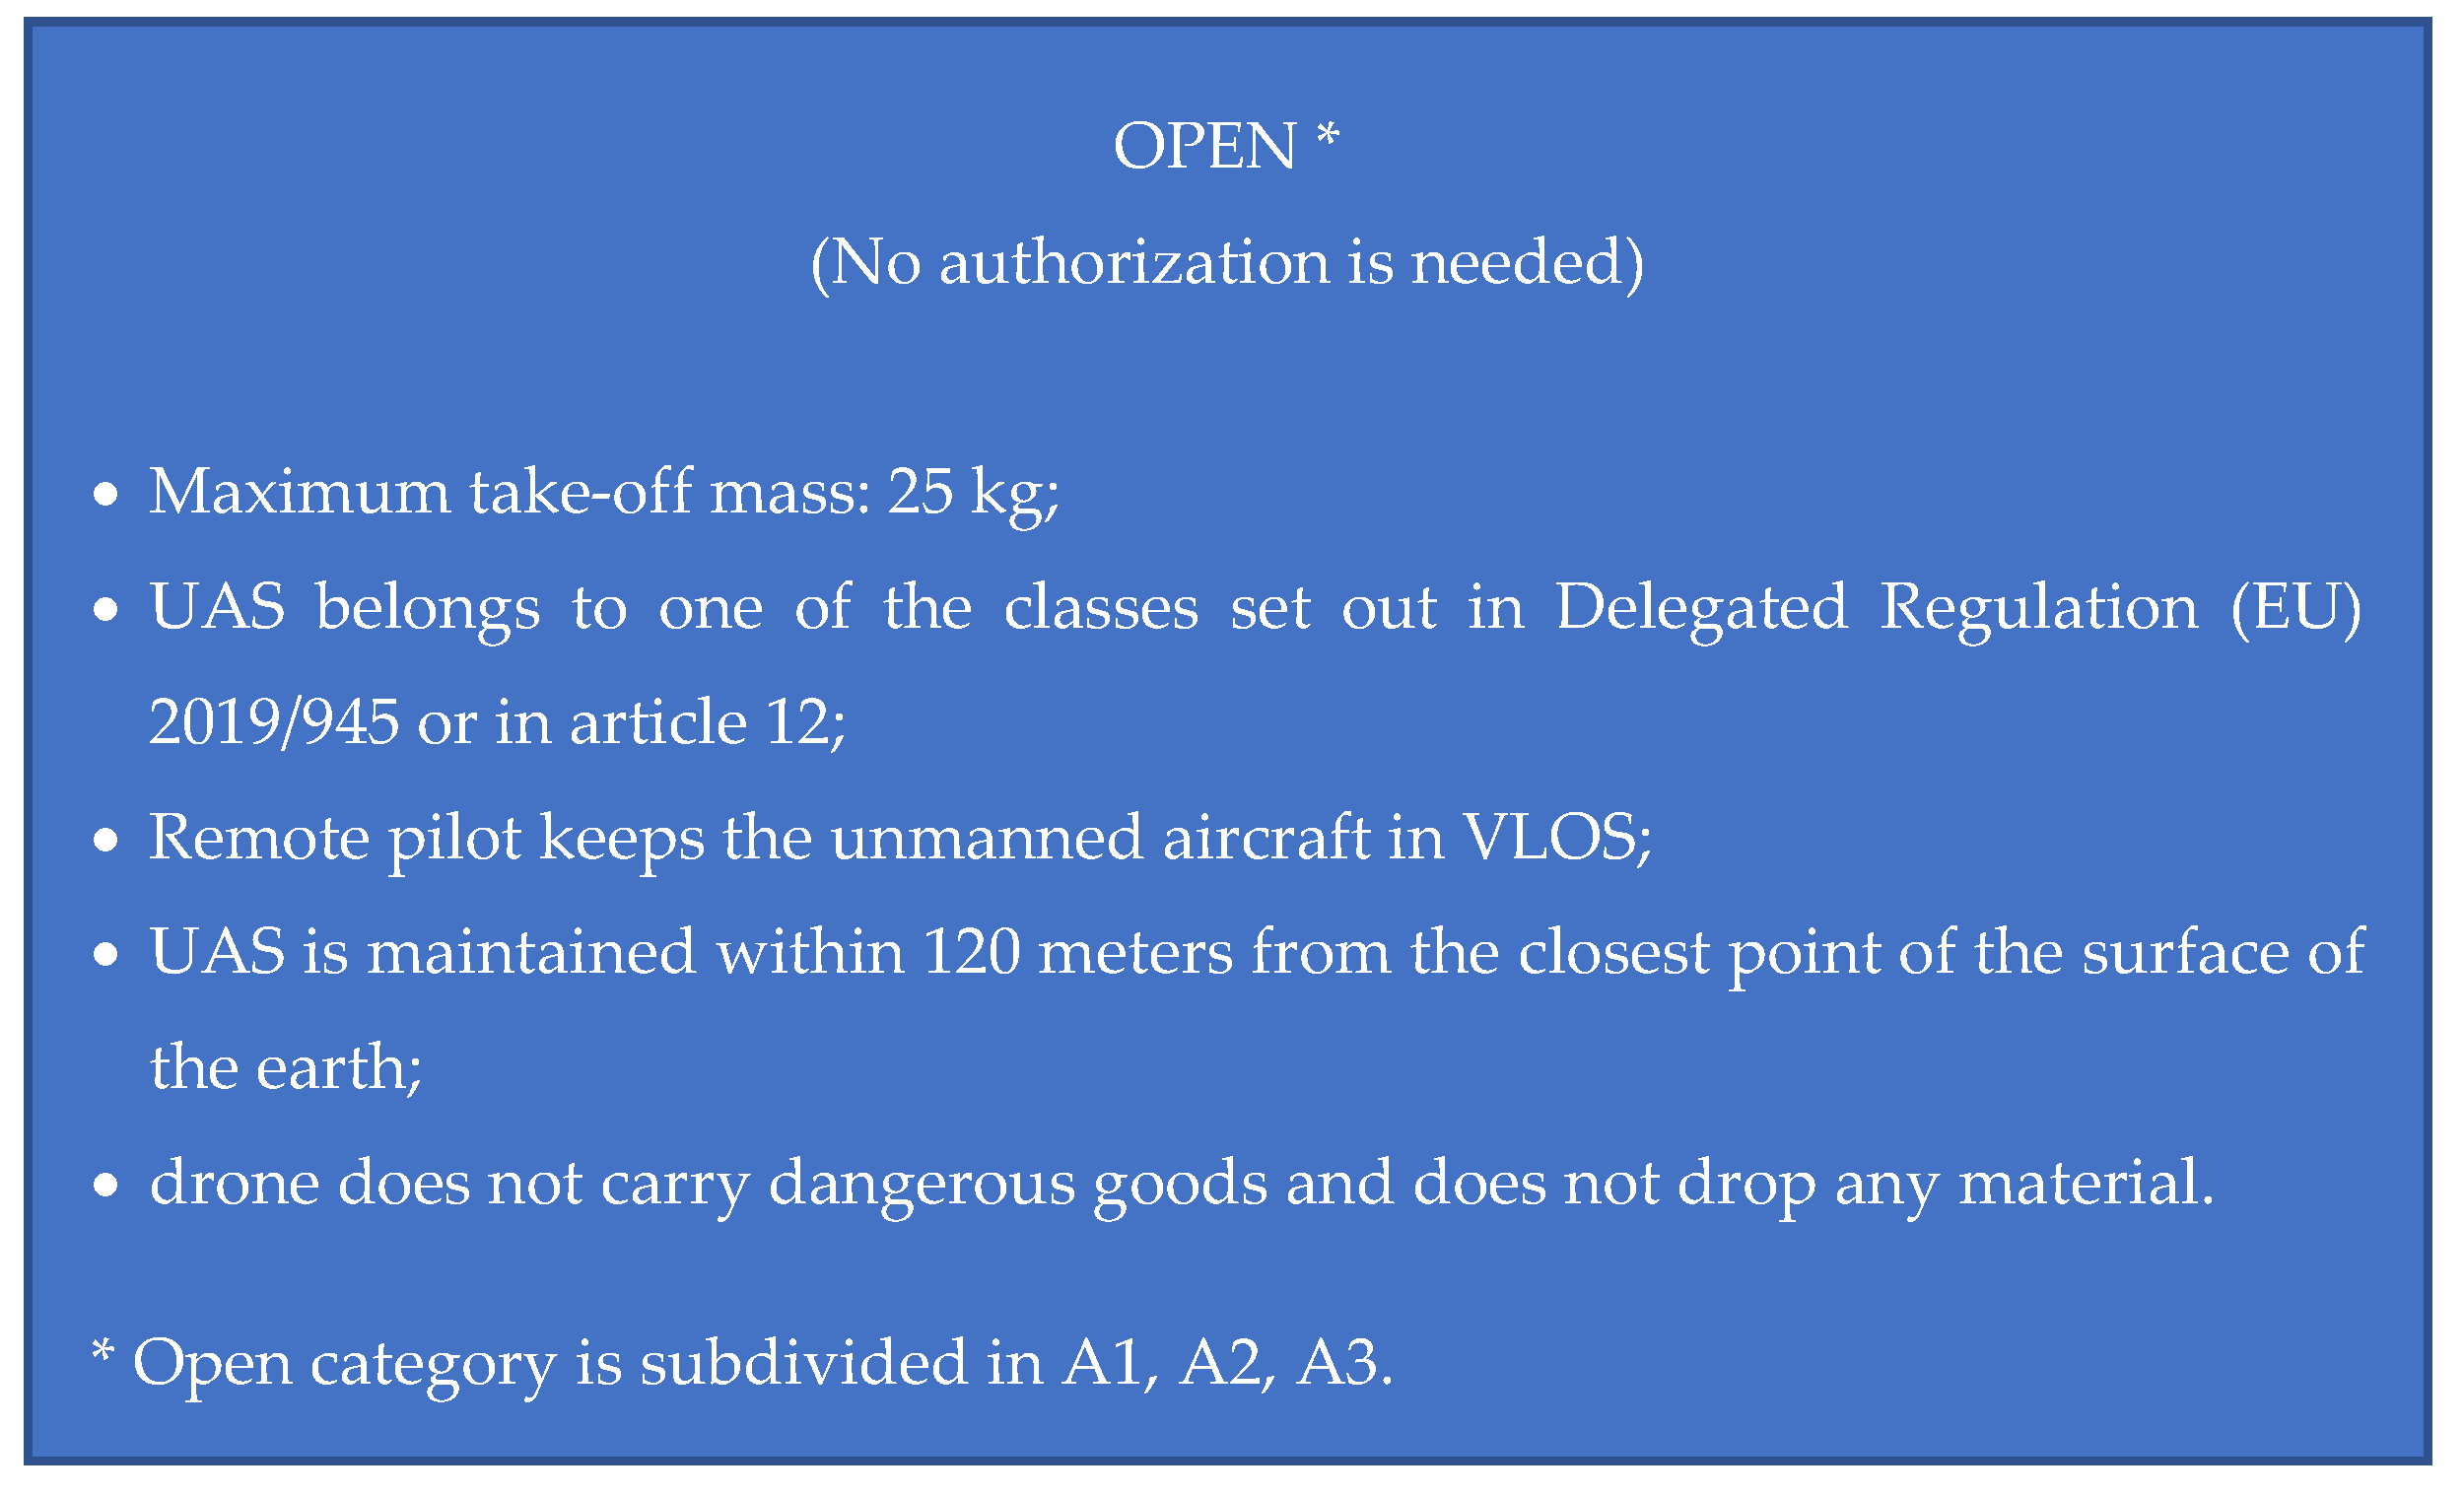
  • The open category addresses the operations in the lower risk bracket because the drone operator complies with the relevant requirements for its intended operation. No authorization is required for the open category because the risks in the ‘open’ category are considered low (Figure 4). The open category is divided into subcategories called A1, A2, and A3 based on the Maximum Take Off Mass (MTOM) of the UAV:
    A1 for an MTOM < 250 g with no pilot competence or an MTOM < 900 g with pilot competence.
    A2 for an MTOM < 4 kg with pilot competence of a higher level than that requested for the A1 category.
    A3 for an MTOM < 25 kg with pilot competence equal to that of the A1 category but requesting a safe distance from people, buildings, and infrastructure.
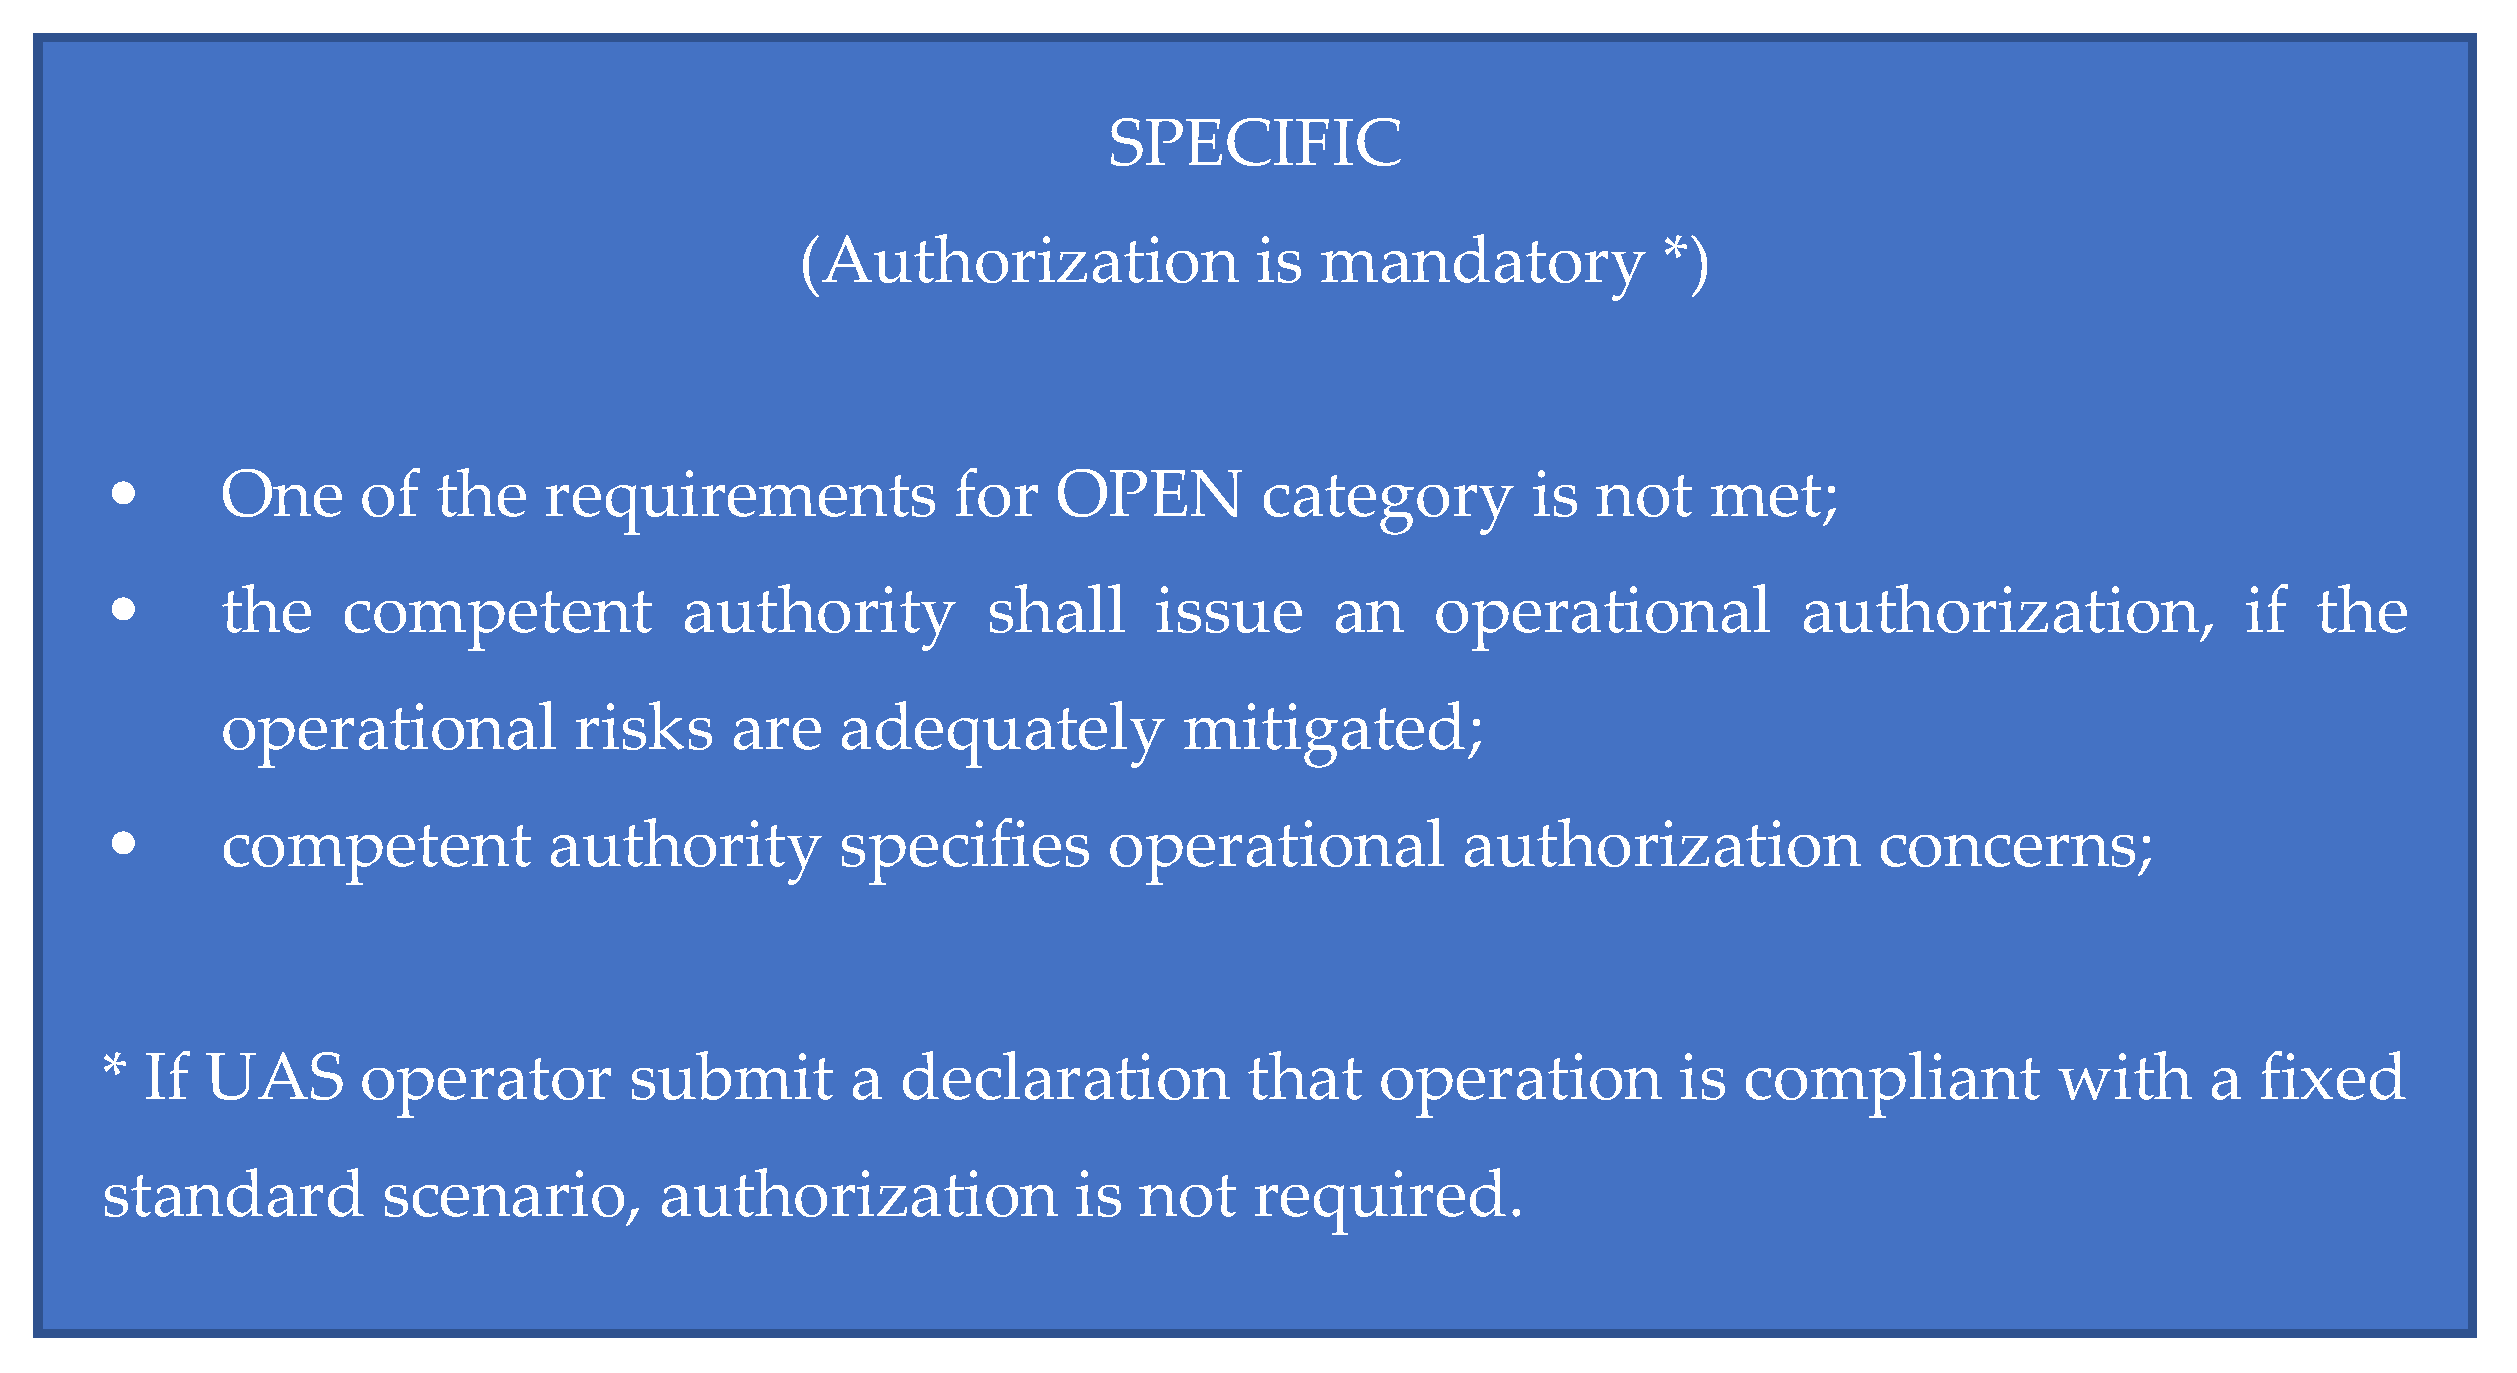
  • The specific category covers riskier operations where safety is ensured by the drone operator, who must obtain an authorization from the national/local competent authority after conducting a safety risk assessment necessary for the safe operation of the UAV (Figure 5). The EASA specifies some standard risk scenarios, one for the urban context operations and another one for the extra-urban context operations. Therefore, if the operation is within the limits of a standard scenario, the operator can declare it, and no authorization is requested; obviously, this requires that the pilot has competence for that scenario.
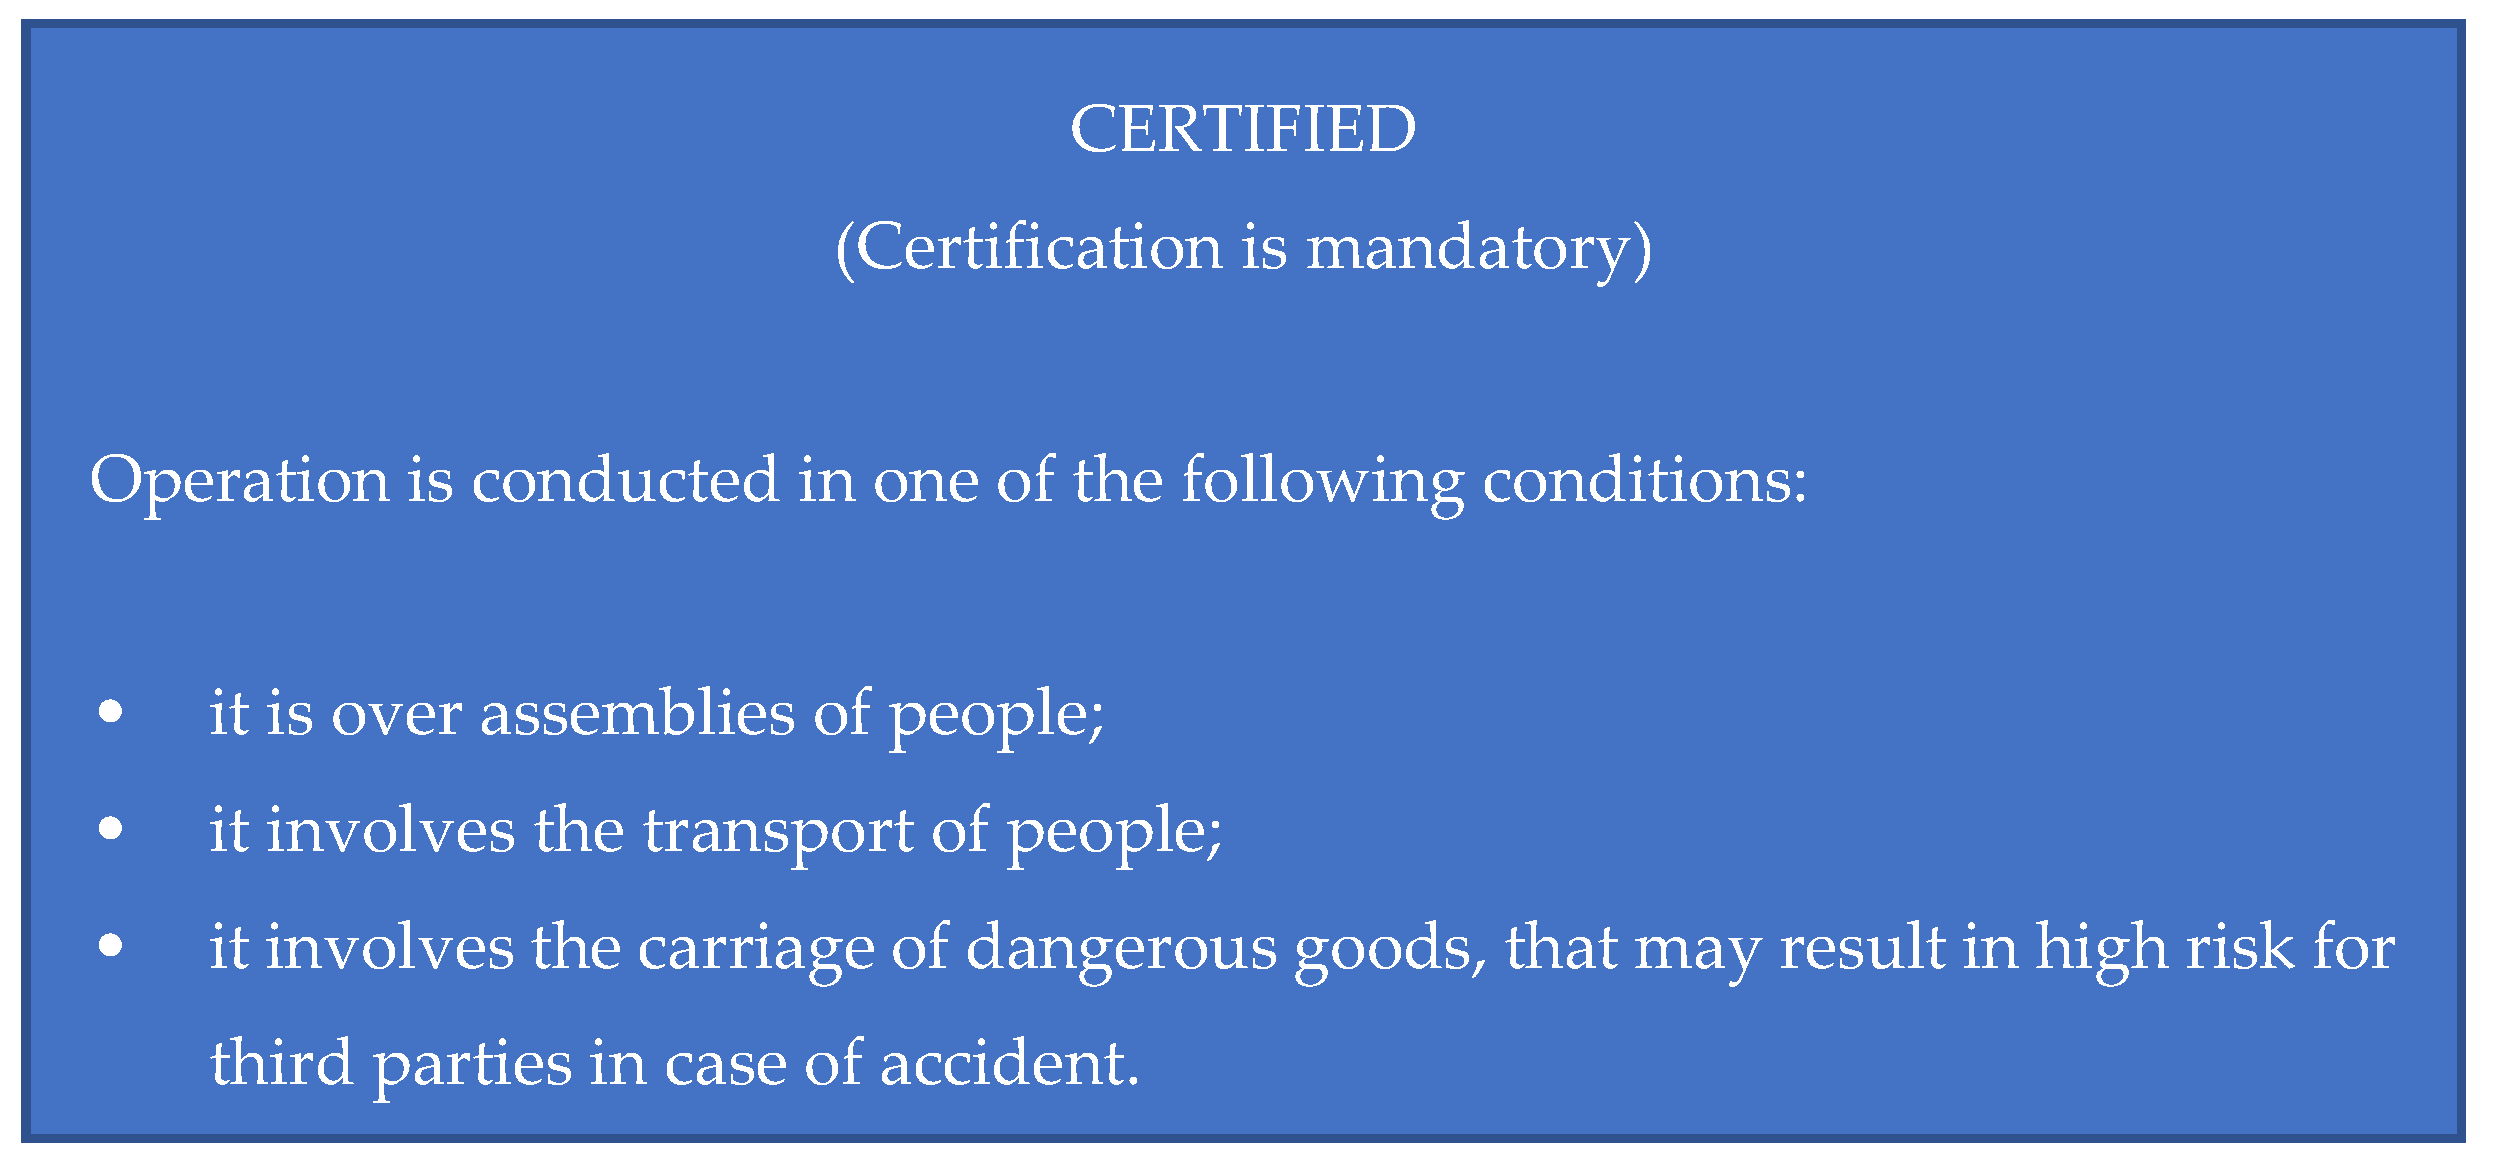
  • The certified category covers the high-risk operations; therefore, the certification of the drone operator and aircraft is mandatory to ensure safety, beyond the licensing of the remote pilot (Figure 6). It is useful to underline that the certification requested for a UAV operation in a certified category is different form the authorization requested for a UAV operation in a specific category. Certification represents a higher level of security than authorization because it must satisfy more constraints.
This means that the safety is influenced by the UAV pilot (the person who manages the UAV during the flight), the UAV operator (the person or company responsible for the UAV maintenance other than the planning, the organization, and the authorization of the mission), the UAV, the meteorological conditions, and the scenario of the flight mission (the presence or absence of people, sensible infrastructures, and so on). Furthermore, the operation in the open category and in the standard scenario must be performed in the Visual Line of Sight (VLOS), i.e., the pilot must always see the drone. An exception is only possible if there is a pilot assistant who observes the drone and connects with the pilot to exchange information in real time. In the regulation EU 2019/947, the UAS stands for the Unmanned Aerial System, which contains both the UAV and the remote control.
Regulation EU 2019/947 defines the main aspects for the flight of a UAV, whereas each EU country defines other specific constraints in its own national regulations, e.g., the geographical areas and the tool to disseminate them. Thus, the rules for UAV-based operations can be different for different member states. For example, the UAV-based inspection of large PV plants, which are located outside the urban center, often falls into the open-A2 category. Nevertheless, the national regulation can provide a different operation scenario. For analogy, the drone-based inspection of PV plants on the roofs of buildings could provide a different risk category when it is in an urban context. For this reason, the location of the PV plant is very important. In fact, the territories are classified with respect to the UAV flights, and limitations are usually available in web-based tools or apps. In Italy, for example, a web-based application is available [22], which reports the critical infrastructure (airport, military zone, helicopter rescue runway), protected landscapes such as natural parks, and so on, where the flight is prohibited or restricted. Figure 7 reports a screenshot of the Italy map from the d-flight website, which maps the free and restricted flight areas. Red zones are prohibited, whereas other colored zones have the limitations of the height of the UAV flight. Some restrictions are permanent (e.g., airports, natural parks, military areas, and so on), whereas other restrictions are temporary or valid only in fixed time windows (e.g., military exercitations).
A drone-based inspection of a PV plant is never possible in a permanent red zone under open category operation, but it may be authorized from the competent authority as a specific category operation. When the authority returns positive feedback, it usually states the constraints for the flight (date and time, height, and so on). A positive response is not so obvious because, for example, the military zones are very critical areas for national security. Moreover, in February 2022, the EASA issued Decision 2022/002/R, its annexes, and its explanatory note [23,24], integrating the bodies that can request limitations to the flight for several reasons, such as the safety of people, the protection of biodiversity, military needs, the management of great events, and so on. Bodies that can be requested are public institutions, law enforcement agencies, managers of natural parks, military authorities, and so on. If the national authority accepts the proposed restrictions, they become mandatory. If an operator needs to fly in that geographic area (for example, for a UAV inspection of a PV plant), the UAV operator can apply for authorization, as that operation has become specific. The decision also contains a new evaluation about the VLOS that now depends on the size of the drone: the smaller the drone, the shorter the VLOS range. Figure 8 and Figure 9, extracted from the Italian national regulation (ATM09 Note) highlight the maximum flight height of a UAV in the vicinity of an airport, depending on the distance from the Aerodrome Reference Point (ARP), which is not always the control tower. The result is that, near the civil airport with instrumental procedures (Figure 8), the UAV can fly at 30 m only in the yellow and blue regions, i.e., at a minimum distance of 10 km (in air line) from the ARP. Instead, this distance is fixed at 6 km near civil airports without instrumental procedures, as reported in Figure 9. This difference depends on the possibility that, in an airport with instrumental procedures, the takeoff and landing may happen in low visibility conditions thanks to the instrument support; therefore, it requires that the safety area is larger than that of an airport without instrumental procedures. Figure 10 reports the constraints for the UAV flight height near a civil heliport, and you can observe the circle form, which is different from those of the civil airports. The circle form is useful for quickly detecting it on the map of Italy, which is available on d-flight, distinguishing it from a civil airport. Finally, Figure 11 reports the maximum UAV flight height near a military airport, whose restrictions are the largest ones. This implies that the possibility of using a UAV for the inspection of PV plants depends strongly on its location. If the distance between the PV plant and the ARP of a civil airport is less than 6 km, it is complicated to use a UAV for inspection. So, these aspects must be accurately evaluated before planning an O&M service that requires the use of a UAV. The higher the flight height of the UAV, the less the drone patrols, the lower the image resolution, and the lower the defect detection capability. Thus, the flight height must be decided based on the IR sensor resolution and the flight limitations.
These limitations are valid for Italy, while other EU member states defined different constraints and tools. Nevertheless, the basic approach is analogous because all the national regulations must satisfy the general EU rules. Therefore, the rationale shown for Italy is also applied in the other EU countries. Table 1 reports the links to the websites of the geographical maps, defined by the national regulations, where you can observe analogies and differences among them. It is important to highlight that the maximum heights, in similar situations, can be different for different countries; therefore, the planning of a UAV-based inspection must always start from with the height constraints that are valid in the country where the PV plant is located. Similar discrepancies can occur for the minimum distance from critical infrastructure, such as an aerodrome or heliport, as reported in the last column of Table 1. Height limits are not given because they are set by international standards and are sometimes reduced by national authorities for specific cases.
Moreover, the classification based on four zones (red, orange, yellow, and blue), which is valid in Italy, is different from the classifications of other states, which define only one, two, or three typologies of zones, with different distances. For this reason, it is not possible to compare the sizes of the geographical zones between different states. Different countries use different rules to define the geographical zones. The last row of Table 1 reports the website link for the geographical areas of the USA, as defined by the Federal Aviation Administration (FAA), which has a specific regulation for the UAS (Part 107) [25]. The USA rules of the sky, as for all the countries, are subdivided into different zones (Figure 12), and the fly zone for UAVs is the Class G under 400 ft (about 120 m), unless there are specific restrictions. No person may operate a small, unmanned aircraft in a Class B, Class C, or Class D airspace or within the lateral boundaries of the surface area of a Class E airspace designated for an airport unless that person has prior authorization from Air Traffic Control (ATC). The USA regulation defines the UAV operation for fun and the commercial UAV operation (Part 107). This classification is different from the EU classification, which is subdivided into open, specific, and classified categories; nevertheless, it denotes a similar approach. Even in the USA, a UAV operator can fly in restricted zones after an authorization by the FAA. In February 2022, the FAA reported that one million permits had been granted in the past four years, i.e., since the establishment of the procedure for restricted areas. As you can observe, even if the general approach is similar, nevertheless, the application is different. Therefore, it is confirmed that the first step for a UAV inspection is the planning of the flight in order to evaluate the presence or absence of fly limitations where the PV plant is located.

3.2. Simplified and Detailed Outdoor Infrared Inspection of PV Plants

A well-structured guide for the outdoor IR inspection of PV plants is the international rule IEC TS 62446-3 [13]. It contains procedures to check modules, cables, fuses, inverters, and equipment in order to record the environmental conditions during the measurements. A specific focus on the use of UAVs for the defect detection of large PV plants is also available. There are two different inspection levels: simplified inspection (green blocks in Figure 3) and detailed inspection (orange blocks in Figure 3, excluding the last item). The first one tests the basic operation of the PV modules, but it is not based on the absolute temperatures. It is usually used during the commissioning of the PV plant in order to check the presence of critical defects. Qualified personnel are not requested, and authoritative conclusions about the quality of the PV modules are not possible. The second one, instead, is based on the absolute temperature measurements, and qualified personnel of the IR analysis are requested. This inspection is usually applied for a periodic check according to IEC 62446-1 (Grid connected systems—Documentation, commissioning tests and inspection) and IEC 62446-2 (Grid connected systems—Maintenance of PV systems). Regardless of the inspection typology and approach (by a UAV or manual), the IR analysis requires that some environmental constraints be satisfied such that the thermal behavior of a PV module is reliable during the image acquisition. In particular:
(a)
irradiance, G 600   W / m 2 ;
(b)
wind speed, w 28   km / h ;
(c)
cloud coverage, c 2   oktas ;
(d)
soil, none or very low.
Condition (a) guarantees that the PV module is operating at an irradiance that is almost equal to 60% of the irradiance in the Standard Test Conditions (STC), which define the electrical parameters in a manufacturer datasheet. Condition (b) guarantees that the actual module temperature during the acquisition is not falsified by an excessive heat exchange. Condition (c) avoids misleading reflections on PV modules. Condition (d) is obvious. Moreover, it requires that the PV module is in a thermal regime during the image acquisition; therefore, the image acquisition should be conducted at least 15 min from the last significant change in irradiance.
The international rule defines other constraints concerning the distance between the PV module and the IR camera, depending on the resolution of the IR camera. In fact, an IR image suitable for the defect detection and post-processing analysis requires at least 5 × 5 pixels for each cell. This constraint depends on the resolution of the IR sensor and limits the maximum distance, especially for UAV-based inspections. The constraint 5 × 5 pixel is the minimum threshold required to classify the IR inspection as a detailed inspection; otherwise, no evaluation based on absolute temperature should be done, and the inspection should be re-classified as a simplified inspection.
Apart from the distance, the angle between the plane of the PV module and the mutual camera-module position (Figure 13) should also be considered. This angle is known as the view angle. This constraint should be fixed at the range of 50° ÷ 80° to avoid extreme phenomena; the maximum value avoids reflection, while the minimum value avoids falsified emissivity values. In Figure 13a, the blue line represents the lateral view of a PV array, while P# is the general position of the UAV equipped with an IR camera. Figure 13b diagrams the temperature profiles along the PV array (from A to B) for different positions of the drone. The dashed black line is the real temperature that is constant along the PV array. The result is that the temperature profile of each position is different from the real temperature, but the mismatches can be neglectable or too large. In Figure 13, P1 is a good position, P2 is an acceptable but not good position, P3 is a bad position, and P4 is the worst position.
A further constraint is physical, i.e., the UAV velocity during the IR inspection. It is limited to 3 m/s, i.e., 10.8 km/h, with the aim of avoiding smearing effects. This depends on the thermal dynamics of the IR sensor, which are generally slow compared to those of a standard camera; this limit could be increased in the coming years thanks to the hardware improvements and to the post-processing software, as already done with older IR cameras. Nevertheless, the current speed of UAVs that are usually employed for IR inspection (also over 80 km/h) is not a useful parameter to estimate the time needed to patrol a large PV plant. The maximum UAV speed for a good IR inspection (about 10.8 km/h) is independent from the nominal maximum UAV speed (about 80 km/h), which is not a crucial parameter to consider when choosing between different UAVs. Instead, the physical connection between the IR-camera and the UAV is much more important: the direct connection, two-axes gimbal, and three-axes gimbal. The direct connection transforms all the UAV movements (vibrations, wind, too-fast direction changes, etc.) into IR images that will yield unstable results. The two-axes gimbal strongly reduces the negative effect of the UAV movements, but the three-axes gimbal is the best solution for acquisitions during windy days. Finally, some IR-sensors are also equipped by post-processing software that automatically improves the quality of the IR image just after its acquisition. Even if the international rule [13] covers many aspects of the UAV-based monitoring of PV systems, other important issues are nevertheless open and are not solved by [13]. These issues are grouped in the item Limits out of standards in the orange block of Figure 3. The next section introduces these criticalities and proposes some solutions.

4. Improvements for Drone-Based IR Inspections Based on Several Case Studies

The constraints discussed in the previous section have the aim of guaranteeing an effective procedure in monitoring the operation of PV modules, in detecting anomalies before they become failures, and in rapidly highlighting premature ageing. Nevertheless, some issues that affect UAV-based IR inspection are not addressed in the international standard rules, but these Limits out of standards (Figure 3) must be considered for reliable IR inspections. In fact, several hundreds of infrared images acquired by the combined system presented in Section 2 were compared with the same images acquired manually. Mismatches between the temperatures of the same points of the PV modules were detected, depending on several factors that are not taken into consideration in the international rules.
The following subsections are based on the supervision of a utility-scale PV plant in operation since September 2015. Its power peak is about 1.7 MW, and it is constituted by approximately six thousand PV modules with a nominal power of 280 Wp. During the campaign, the solar irradiation was 748 W/m2, the air temperature was about 16.5 °C, the relative humidity was about 56%, and the wind was equal to 2.8 m/s.
A comparison between the IR image of the PV modules acquired by a UAV equipped with an IR camera and the IR image of the same PV modules acquired by a manual IR camera is proposed in Figure 14. Figure 14a reports three samples of IR images of PV modules of the PV plant under investigation, which were acquired by the IR-camera on board the UAV, whereas Figure 14b reports the thermograms of the same PV modules carried out by means of a manual IR camera. The upper part of Figure 14a evidences the position of the three PV modules (in a blue line) in its own array. The middle part reports their thermograms. The lower part classifies the well-operating PV cells (in a green color) and the critical PV cells (in a yellow color) due to a mismatch between the correct operating temperature and the measured one. This elaboration is carried out by DISS software. The maximum temperature values for the three IR images are 37.35 °C, 35.00 °C, and 36.66 °C. Moreover, only the second IR image shows a uniform temperature for the whole module, which is totally green. Instead, the temperature of the other two PV modules is not uniform, as highlighted by the yellow areas, meaning that yellow cells have different temperatures from green cells.
By analyzing the thermograms of manual IR images (Figure 14b, upper part), the results are that the maximum temperature values for the three modules are 39.20 °C, 37.77 °C, and 38.24 °C, which are always higher than those measured by the IR camera on board the UAV. This agrees with Figure 13, i.e., the temperature detected by the IR camera on board the UAV is lower than the actual one, even if the UAV is in the best position (P1). Moreover, the no yellow area (the lower part of Figure 14b) is detected with manual IR acquisition, meaning that the temperature of the PV module is uniform. The black areas evidence zones with anomalous temperature differences among closer pixels, typically due to dust. For these three PV modules, the IR images acquired by the UAV suggest that only the second module is well operating, whereas the first and third modules show light criticalities. On the contrary, the manually acquired IR images suggest that all three modules are operating well. This example demonstrates that the IR images of PV modules acquired by a UAV can be very different from those acquired manually and can lead to erroneous reports. Therefore, additional precautions are needed.
This section introduces the factors that impact the infrared images and suggests effective solutions. The acquired images can often be corrected in the post-processing stage to compensate some acquisition errors, but sometimes this is not possible. For example, if the height of the UAV is too excessive to guarantee the minimal resolution of 5 × 5 pixels for a cell, no post-processing can improve the image quality; thus, that image is not useful. Instead, a wrong emissivity value set before the acquisition can be corrected in the post-processing step.
The critical points not addressed in [13] are the following:
  • impact of the view angle on the emissivity value;
  • emissivity value to set in an IR camera, because it is different for a mid-wave and for a long-wave IR camera;
  • correct reference temperature with which to compare the module temperature;
  • impact of the air transmittance during the IR acquisition.

4.1. Emissivity and View Angle

Figure 13 shows that the view angle can largely differ for two different positions. Even if the correct emissivity value is set (the glass emissivity for the long-wave IR camera and the substrate emissivity for the mid-wave IR camera), it is valid for an angle in the range of 50° ÷ 80°. If this emissivity value is fixed for a drone in position P2, the radiometric map will be wrong, because the angle is not in the range. Nowadays, no IR camera allows for the setting of a variable emissivity during the acquisition. Consequently, IR images must not be acquired in these positions. For example, Figure 15 reports a wrong IR acquisition, because it seems that all the PV modules on the right have higher temperatures than all the PV modules on the left, but this depends on the mutual position drone-PV panels. By moving the drone to the right, the colors switch. Alternatively, it is necessary to provide a postprocessing of the IR image to update the acquired radiometric map with a correct emissivity value. In [26], a semi-empirical relationship between the emissivity and angle ϑ is proposed:
ε ( ϑ ) = ε ( 90 ° ) a e ϑ b
where ε ( 90 ° ) is the nominal value at the perpendicular direction, whereas the parameters a and b depend on the material.

4.2. Emissivity in Long-Wave and Mid-Wave IR Cameras

The Stefan–Boltzmann equation for a gray body (i.e., a physical body that does not absorb all incident radiation and emits less than a black body; thus, ε = α < 1 ) is [27]:
E g = ε σ T g 4
where E g is the power radiated from the gray body for a unit of surface area, σ = 5.67 ,   10 8 W m 2 · K 4 is the Stefan–Boltzmann constant, and T g is the temperature of the gray body. Therefore, the temperature map of a gray body depends on the radiant emittance; in particular, neglecting the negative solution, it results in:
T g = E g ε σ 4
The emitting body, along with the correct emissivity value to set in an IR camera, depend on the typology of the IR sensor; in fact, the glass on the PV module is transparent to the radiation in 3–5 µm, but it is opaque to the radiation in 8–14 µm [28]. Since the long-wave IR sensor operates in 8–14 µm, it captures the radiant emittance of the glass; instead, a mid-wave IR sensor operates in 3–5 µm and captures the radiant emittance of the layer below the glass. This difference must be considered when setting the emissivity value in the thermo-camera, because the emissivity of the glass is different from that of its substrate. To set the glass emissivity in a mid-wave IR sensor would be wrong, and the radiometric map will be affected by an offset error, which can cause a wrong classification. This error can be corrected in post-processing, as done in our inspection campaigns. Table 2 reports a classification of the hot spot severity based on the over-temperature with respect to the reference one and on the associated power loss. A wrong emissivity causes an error on the estimation of the over-temperature and then a wrong classification of the hot area of the PV module, as confirmed by our inspection campaigns.

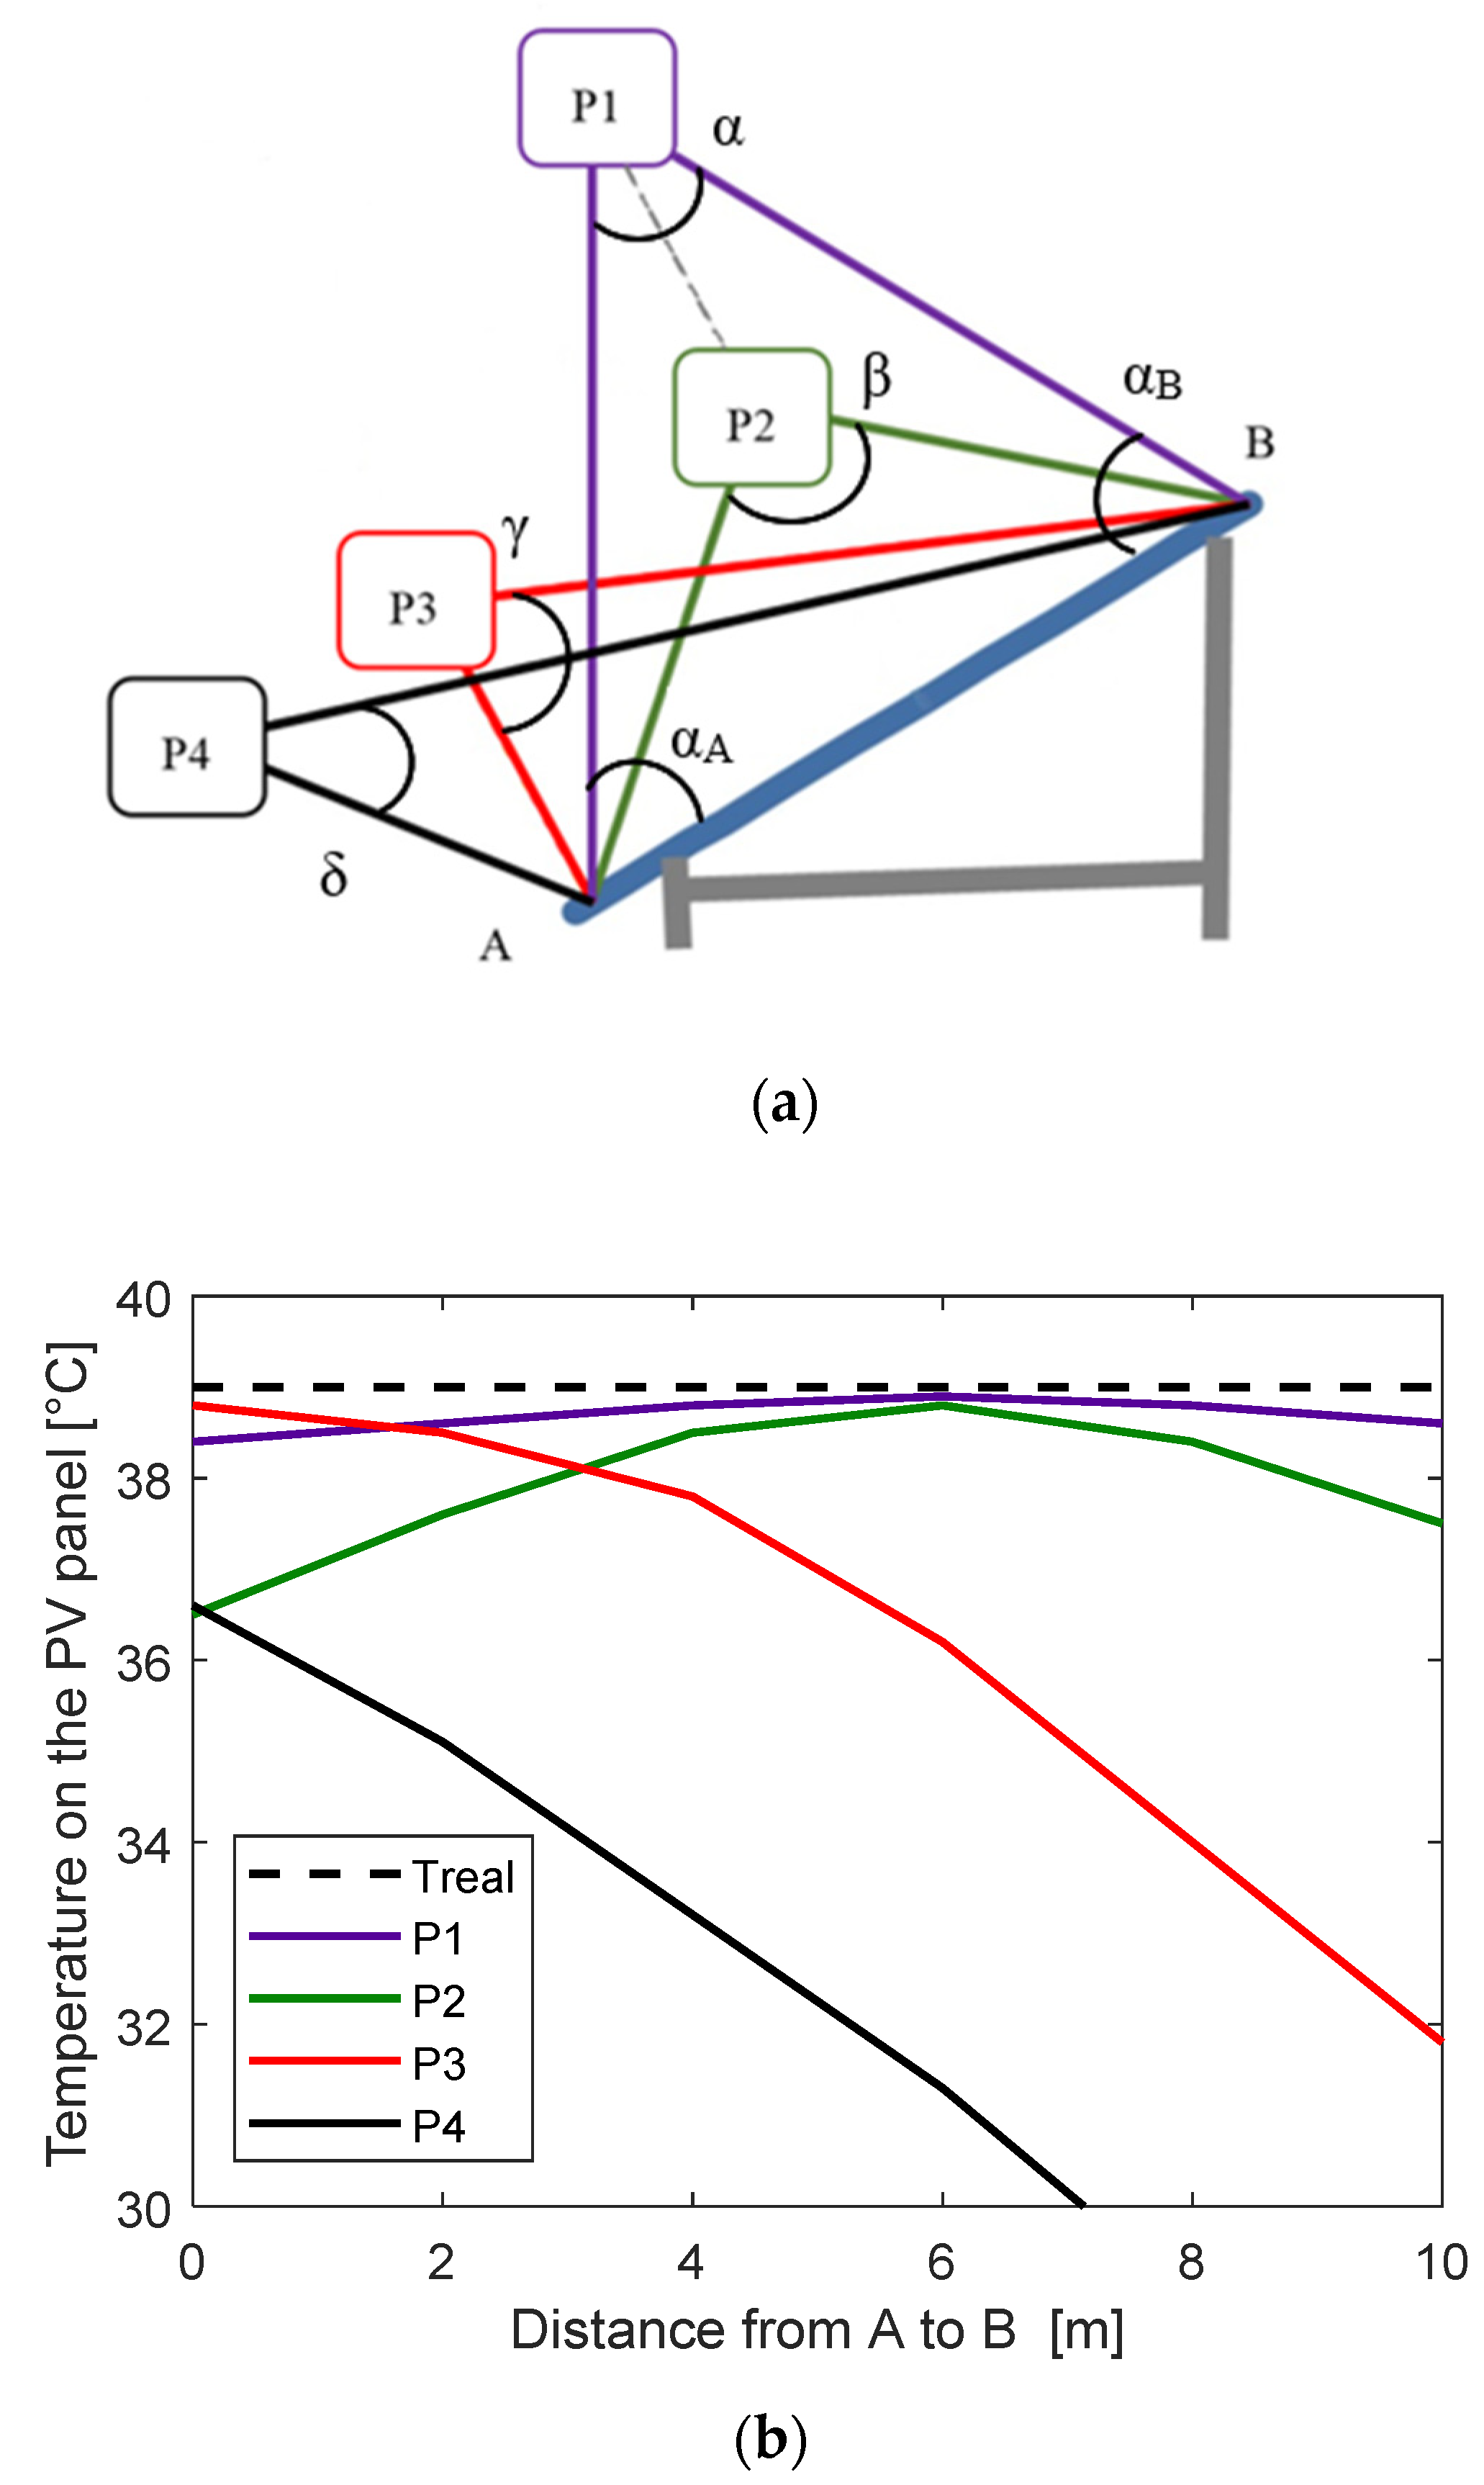
4.3. Normalized Reference Temperature

Another criticality is the correct setting of the reference temperature in the environmental conditions during the IR acquisition. The well-operating cell temperature is almost always different from the NOCT (NMOT for new PV modules) available in the manufacturer datasheet, because the NOCT is defined in precise conditions (irradiance G = 800   W / m 2 and air temperature T a 20   ° C ) which are rarely coincident with the environmental conditions during the IR acquisition. Therefore, the NOCT must be normalized to a new reference value, T r e f , which is valid in the environmental conditions during the IR acquisition:
T r e f = T a + N O C T 20 G   ·   800
Consequently, the over-temperature must be evaluated with respect to T r e f and not with respect to NOCT when the environmental conditions differ from the NOCT conditions.

4.4. Air Transmittance

During the acquisition of IR images, by means of a drone, a large distance between the onboard IR camera and the PV modules exists. It is usually over 10 m, and this volume is occupied by air [29]. Researchers analyzed the air spectral transmittance [26], highlighting that it is constant and equal to 1 in in the long-wave range, i.e., in 8–14 µm. Thus, no impact of the air transmittance must be considered when a long-wave IR sensor is used. Instead, in 3–5 µm (where a mid-wave IR sensor operates), its value shows a dip, whose amplitude depends on the distance between the drone and the PV modules. The impact of the air transmittance reduction only affects the IR acquisition made with mid-wave cameras. For a distance up to 10 m, the air transmittance is never lower than 0.85 [26]; therefore, its impact exists but is limited. For a distance greater than 10 m, a correction must be considered for the reliable evaluation of the radiometric maps. Moreover, the air humidity should be low enough to avoid condensation in the air, on the measuring object, on the glass, or on the lens of the IR camera.
The IR inspection campaign discussed in this section was carried out as proposed in Figure 3 by adding improvements to the international rule, as explained in Section 4. Proper planning of the use of a UAV for IR inspection, as proposed in this paper, is a novelty in this field both in terms of the preliminary verification of flight constraints and the critical issues not addressed in international standards: the correction of the infrared images with respect to the view angle, the impact of a mid-wave and long wave infrared sensor on the acquired image, and the impact of the air transmittance. In particular, the IR image can be corrected in the post-processing step by updating the emissivity value as a function of the real view angle and of the sensor type (mid-wave or long-wave); instead, a compensation of the air transmittance in the post-processing step is not yet possible, because there is not a known relation between the air transmittance and the distance drone-PV module. This last point is an open issue for future works.

5. Conclusions

An effective approach to monitoring the operation of PV modules is to use the IR inspection, which allows for the highlighting of small or large anomalies. IR analysis is based on the over-temperature with respect to the reference temperature during the acquisition. The diffusion of a UAV equipped with an IR camera can help to quicken the IR inspection of large PV plants, even if the maximum UAV velocity is limited by the thermal dynamics of the IR sensor. Other criticalities depend on the limitations of the use of UAVs in some areas, based on the national and international rules or on safety needs. Therefore, before starting the planning of a UAV-based IR inspection, several precautions are needed. Some are related to UAV use and authorization/certification, while others are related to the correct operation during the IR acquisition. Finally, some criticalities can be solved in the post-processing step of the IR images if the new conditions are known. This paper highlights the usefulness of UAVs for IR inspection but also the criticalities that, if not adequately considered, can produce wrong IR acquisitions. This paper showed a comparison between the IR images of the same PV modules acquired by a UAV and by hand. It demonstrates that the results are different and that erroneous evaluations are possible. This paper suggests solutions for the issues not addressed in international rules, and future work will be focused on the definition of a quality index of the acquired IR image.

Funding

This research received no external funding.

Institutional Review Board Statement

Not applicable.

Informed Consent Statement

Not applicable.

Data Availability Statement

Not applicable.

Conflicts of Interest

The author declares no conflict of interest.

Nomenclature:

ARPAerodrome Reference Point
ATCAir Traffic Control
DISSDiagnostics for Solar Systems
EASAEuropean Aviation Safety Agency
FAAFederal Aviation Administration
IECInternational Electrotechnical Commission
IRInfrared
MTOMMaximum Take Off Mass
NOCTNominal Operating Cell Temperature
NMOTNominal Module Operating Temperature
O&MOperation and Maintenance
PVPhotovoltaics
STCStandard Test Conditions
TrefReference Temperature
UASUnmanned Aerial System
UAVUnmanned Aerial Vehicle
VLOSVisual Line of Sight

References

  1. Breitenstein, O.; Rakotoniaina, J.P.; Al Rifai, M.H.; Werner, M. Shunt type in crystalline solar cells. Prog. Photovolt. Res. Appl. 2004, 12, 529–538. [Google Scholar] [CrossRef] [Green Version]
  2. Rakotoniaina, J.P.; Neve, S.; Werner, M.; Breitenstein, O. Material induced shunts in multicrystalline silicon solar cells. In Proceedings of the Conference Photovoltaics Europe, Rome, Italy, 7–11 October 2002; pp. 24–27. [Google Scholar]
  3. Skoplaki, E.; Palyvos, J.A. On the temperature dependence of photovoltaic module electrical performance: A review of efficiency/power correlations. Sol. Energy 2009, 83, 614–624. [Google Scholar] [CrossRef]
  4. Breitenstein, O.; Rakotoniaina, J.P.; Al Rifai, M.H. Quantitative evaluation of shunts in solar cells by lock-in thermography. Prog. Photovolt. Res. Appl. 2003, 11, 515–526. [Google Scholar] [CrossRef]
  5. Vergura, S.; Marino, F. Quantitative and computer aided thermography-based diagnostics for PV devices: Part I–framework. IEEE J. Photovolt. 2017, 7, 822–827. [Google Scholar] [CrossRef]
  6. Vergura, S.; Colaprico, M.; de Ruvo, M.F.; Marino, F. A quantitative and computer aided thermography-based diagnostics for PV devices: Part II–platform and results. IEEE J. Photovolt. 2017, 7, 237–243. [Google Scholar] [CrossRef]
  7. Harrou, F.; Sun, Y.; Kara, K.; Chouder, A.; Silvestre, S.; Garoudja, E. Statistical fault detection in photovoltaic systems. Sol. Energy 2017, 150, 485–499. [Google Scholar]
  8. Vergura, S. Hypothesis Tests-Based Analysis for Anomaly Detection in Photovoltaic Systems in the Absence of Environmental Parameters. Energies 2018, 11, 485. [Google Scholar] [CrossRef] [Green Version]
  9. Hafiz, F.; Awal, M.A.; Queiroz, A.R.d.; Husain, I. Real-Time Stochastic Optimization of Energy Storage Management Using Deep Learning-Based Forecasts for Residential PV Applications. IEEE Trans. Ind. Appl. 2020, 56, 2216–2226. [Google Scholar] [CrossRef]
  10. Gupta, N. Probabilistic Optimal Reactive Power Planning with Onshore and Offshore Wind Generation, EV, and PV Uncertainties. IEEE Trans. Ind. Appl. 2020, 56, 4200–4213. [Google Scholar] [CrossRef]
  11. Gupta, N. Gauss-Quadrature-Based Probabilistic Load Flow Method with Voltage-Dependent Loads Including WTGS, PV, and EV Charging Uncertainties. IEEE Trans. Ind. Appl. 2018, 54, 6485–6497. [Google Scholar] [CrossRef]
  12. Li, X.; Li, W.; Yang, Q.; Yan, W.; Zomaya, A.Y. An Unmanned Inspection System for Multiple Defects Detection in Photovoltaic Plants. IEEE J. Photovolt. 2020, 10, 568–576. [Google Scholar] [CrossRef]
  13. IEC TS 62446-3:2017; Photovoltaic (PV) Systems—Requirements for Testing, Documentation and Maintenance—Part 3: Photovoltaic Modules and Plants—Outdoor Infrared Thermography. IEC: Geneva, Switzerland, 2017.
  14. Vergura, S. Rules and Issues of Outdoor Infrared Inspection of Photovoltaic Modules by Unmanned Aerial Vehicle. In Proceedings of the IEEE-EEEIC International Conference on Environment and Electrical Engineering, Bari, Italy, 7–10 September 2021. [Google Scholar]
  15. IEC 61215; Terrestrial Photovoltaic (PV) Modules—Design Qualification and Type Approval. IEC: Geneva, Switzerland, 2016.
  16. Doll, B.; Hepp, J.; Hoffmann, M.; Schüler, R.; Buerhop-Lutz, C.; Peters, I.M.; Hauch, J.A.; Maier, A.; Brabec, C.J. Photoluminescence for Defect Detection on Full-Sized Photovoltaic Modules. IEEE J. Photovolt. 2021, 11, 1419–1429. [Google Scholar] [CrossRef]
  17. Kong, X.; Xi, Z.; Wei, S.; Ding, S.; Chen, L.; Yang, Q.; Yan, W. Infrared Vision Based Automatic Navigation and Inspection Strategy for Photovoltaic Power Plant Using UAVs. In Proceedings of the 2019 Chinese Control and Decision Conference (CCDC), Nanchang, China, 3–5 June 2019; pp. 347–352. [Google Scholar]
  18. EN-ISO 9712:2012; Non-Destructive Testing-Qualification and Certification of NDT Personnel. UNI: Rome, Italy, 2012.
  19. Review of Failures of Photovoltaic Modules, Photovoltaic Power Systems Programme; Report IEA-PVPS T13-01:2014; IEA: Paris, France, 2014.
  20. European Aviation Safety Agency. Available online: https://www.easa.europa.eu (accessed on 9 February 2022).
  21. Easy Access Rules for Unmanned Aircraft Systems (Regulation (EU) 2019/947 and Regulation (EU) 2019/945). Available online: https://www.easa.europa.eu/document-library/easy-access-rules/easy-access-rules-unmanned-aircraft-systems-regulation-eu (accessed on 9 February 2022).
  22. Available online: https://www.d-flight.it/new_portal/ (accessed on 9 February 2022).
  23. Available online: https://www.easa.europa.eu/downloads/135909/en (accessed on 18 February 2022).
  24. Available online: https://www.easa.europa.eu/downloads/135912/en (accessed on 18 February 2022).
  25. Available online: https://www.faa.gov/uas/ (accessed on 18 February 2022).
  26. Vergura, S. Correct Settings of a Joint Unmanned Aerial Vehicle and Thermocamera System for the Detection of Faulty Photovoltaic Modules. IEEE J. Photovolt. 2021, 11, 124–130. [Google Scholar] [CrossRef]
  27. Bergman, T.L.; Lavine, A.S.; Incropera, F.P. Fundamentals of Heat and Mass Transfer, 7th ed.; John Wiley & Sons Incorporated: Hoboken, NJ, USA, 2011; ISBN 9781118137253. [Google Scholar]
  28. Kitamura, R.; Pilon, L.; Jonasz, M. Optical constants of silica glass from extreme ultraviolet to far infrared at near room temperature. Appl. Opt. 2007, 46, 8118–8133. [Google Scholar] [CrossRef] [PubMed]
  29. Krenzinger, A.; de Andrade, A.C. Accurate outdoor glass thermographic thermometry applied to solar energy devices. Sol. Energy 2007, 81, 1025–1034. [Google Scholar] [CrossRef]
Figure 1. EU member states. Picture from https://commons.wikimedia.org/ under the Creative Commons Attribution-Share Alike 4.0 International license. The color difference is only to distinguish one country from the confining ones.
Energies 15 05086 g001
Figure 2. Cloud-based system: UAV equipped with an IR camera (1), a meteorological station (2), a cloud-based software (DISS) that exchanges data from/to the hub (3,4), and a collecting database (5).
Energies 15 05086 g002
Figure 3. Methodology for the reliable IR inspection of a PV module with a UAV.
Energies 15 05086 g003
Figure 4. Constraints for the open category.
Energies 15 05086 g004
Figure 5. Constraints for the specific category.
Energies 15 05086 g005
Figure 6. Constraints for the certified category.
Energies 15 05086 g006
Figure 7. Italy map from the d-flight website. Red zones are prohibited. Icon “d” is the user position, when connected.
Energies 15 05086 g007
Figure 8. Maximum UAV flight height for a civil airport with instrumental procedures (ATM09 Note).
Energies 15 05086 g008
Figure 9. Maximum UAV flight height for a civil airport without instrumental procedures (ATM09 Note).
Energies 15 05086 g009
Figure 10. Maximum UAV flight height for a civil heliport without instrumental procedures (ATM09 Note).
Energies 15 05086 g010
Figure 11. Maximum UAV flight height for a military airport (ATM09 Note).
Energies 15 05086 g011
Figure 12. Controlled (Class A, B, C, D, E) and uncontrolled (Class G) airspace in the USA.
Energies 15 05086 g012
Figure 13. (a) View angle between the PV array (blue line) and the IR camera position. (b) Detected temperatures along the array, based on the UAV position.
Energies 15 05086 g013
Figure 14. (a) Three IR images acquired by the IR-camera on board the UAV and the temperature distribution. (b) Temperature distribution of the same PV modules by means of a manual IR camera.
Energies 15 05086 g014
Figure 15. Wrong IR acquisition.
Energies 15 05086 g015
Table 1. Constraints and limitations for geographical areas in most of the EU member states and the USA (accessed on 26 June 2022).
CountryWebsiteLimits
Austriahttps://map.dronespace.at/5.5 km from ARP
Belgiumhttps://apps.geocortex.com/webviewer/?app=1062438763fd493699b4857b9872c6c43 km from ARP and 1 km from heliport
Czechiahttps://dronview.rlp.cz/5.5 km from ARP
Denmarkhttps://www.droneluftrum.dk/app/map5 km from ARP and 8 km from military
Francehttps://www.geoportail.gouv.fr/carteVariable until 10 km from ARP
Germanyhttps://maptool-dpul-prod.dfs.de/1.5 km from airport
Greecehttps://dagr.hcaa.gr/#map_page8 km from ARP
Irelandhttps://www.iaa.ie/general-aviation/drones/drone-regulations-guidance8 km from ARP and 3 km from heliport
Italyhttps://www.d-flight.it/portal/Figure 8, Figure 9, Figure 10 and Figure 11
Latviahttps://www.airspace.lv/drones10 km from ARP
Luxembourghttps://map.geoportail.lu/theme/main?lang=fr&version=3&zoom=13&X=681505&Y=6382671&rotation=0&layers=1928-1927&opacities=0.5-0.5&bgLayer=topo_bw_jpeg5 km from international airport and 2 km from any ARP
The Netherlandshttps://kaart.pdok.nl/api/api.html?mapdiv=map%5Fvialink&zoom=3&geocoder=%7B%7D&loc=162379%2E23990482%2C%20459428%2E68528338&wmsurl=https%3A%2F%2Fgeodata%2Enationaalgeoregister%2Enl%2Fdronenoflyzones%2Fwms%3F&wmslayers=luchtvaartgebieden&markersdef=https%3A%2F%2Fkaart%2Epdok%2Enl%2Fapi%2Fjs%2Fpdok%2Dmarkers%2Ejs&layersdef=https%3A%2F%2Fkaart%2Epdok%2Enl%2Fapi%2Fjs%2Fpdok%2Dlayers%2Ejs&pdoklayers=BRTPASTEL8 km from ARP and 3 km from heliport
Portugalhttps://uas.anac.pt/explore (under maintenance)2.5 km from ARP and 1 km from heliport
Romaniahttps://rpas.caa.ro/ (access requires registration)5 km from ARP
Sloveniahttps://gis.lps.sk/vfrm/index.html1.5 km from airport
Spainhttps://drones.enaire.es/8 km from ARP
Swedenhttps://daim.lfv.se/echarts/dronechart/5 km from ARP
USAhttps://faa.maps.arcgis.com/apps/webappviewer/index.html?id=9c2e4406710048e19806ebf6a06754ad8 km from ARP
Table 2. Power loss versus over-temperature and classification.
Over-TemperaturePower LossHot Spot
10 °C4%Light
10–20 °C4–10%Medium
>20 °C>10%Strong
Publisher’s Note: MDPI stays neutral with regard to jurisdictional claims in published maps and institutional affiliations.

