Article

Physics-Based Method for Generating Fully Synthetic IV Curve Training Datasets for Machine Learning Classification of PV Failures

by
Michael W. Hopwood
1,2,
Joshua S. Stein
2,*,
Jennifer L. Braid
2 and
Hubert P. Seigneur
3
1
Department of Statistics and Data Science, University of Central Florida, Orlando, FL 32816, USA
2
Sandia National Laboratories, Albuquerque, NM 87123, USA
3
Florida Solar Energy Center, University of Central Florida, Cocoa, FL 32922, USA
*
Author to whom correspondence should be addressed.
Energies 2022, 15(14), 5085; https://doi.org/10.3390/en15145085
Submission received: 14 June 2022 / Revised: 5 July 2022 / Accepted: 11 July 2022 / Published: 12 July 2022

Abstract

:
Classification machine learning models require high-quality labeled datasets for training. Among the most useful datasets for photovoltaic array fault detection and diagnosis are module or string current-voltage (IV) curves. Unfortunately, such datasets are rarely collected due to the cost of high fidelity monitoring, and the data that is available is generally not ideal, often consisting of unbalanced classes, noisy data due to environmental conditions, and few samples. In this paper, we propose an alternate approach that utilizes physics-based simulations of string-level IV curves as a fully synthetic training corpus that is independent of the test dataset. In our example, the training corpus consists of baseline (no fault), partial soiling, and cell crack system modes. The training corpus is used to train a 1D convolutional neural network (CNN) for failure classification. The approach is validated by comparing the model’s ability to classify failures detected on a real, measured IV curve testing corpus obtained from laboratory and field experiments. Results obtained using a fully synthetic training dataset achieve identical accuracy to those obtained with use of a measured training dataset. When evaluating the measured data’s test split, a 100% accuracy was found both when using simulations or measured data as the training corpus. When evaluating all of the measured data, a 96% accuracy was found when using a fully synthetic training dataset. The use of physics-based modeling results as a training corpus for failure detection and classification has many advantages for implementation as each PV system is configured differently, and it would be nearly impossible to train using labeled measured data.

1. Introduction

Photovoltaic (PV) plants usually consist of hundreds of thousands of mass-produced parts, each with many possible ways they can fail or degrade, leading to power loss. A typical utility-scale plant comprises several hundred thousand modules connected in series to form strings, which are themselves connected in parallel to an inverter by means of combiners and recombiners. Each part of the PV system can fail (Figure 1). Researchers have identified dozens of power loss mode effects (i.e., failure modes) in photovoltaic systems, especially modules, throughout the manufacturing process and operational lifetime [1,2,3]. On average, 25.49 failures occur in a PV plant per year; additionally, device inefficiencies (e.g., module degradation, mismatching effect, soiling losses) reduce energy yield by 25% [4]. Rapid and accurate detection and diagnosis of these PV operations and maintenance (O&M) issues would save money and lower the cost of PV electricity [5,6].
Failures can generally be broken up into direct current (DC) and alternating current (AC) failures. DC failures largely refer to issues with the PV array, namely cell-level faults, such as cell cracks, delamination, and hot spots, or module-level faults, such as diode failures, glass breakage, abnormal resistances, and short/open circuiting, but can also refer to issues with the maximum power point tracker [7,8,9]. These failures consist of around 25% of the total failures in the PV system, and they only contribute to around 4% of the energy losses associated with failures [4]. Extensive research has been performed in characterizing these failures [2,10]. AC failures are usually located inside the inverter, often caused by damage to its internal components or overheating, but can also be found on the utility grid side due to a high- or low-voltage demand. Inverter failures alone consist of 28% of the total reported failures and contribute to about 27% of the total energy losses [4]. Therefore, failure detection and diagnosis methods are an important contribution to the reliability of a production PV system.
Fundamental, physics-based failure detection methods are already used on the inverter, ensuring the safety of the system [11]. However, more complicated methods are required to detect and diagnose less obvious failures that can occur. Statistics-based methods can require manually-defined thresholds that are hard to define; machine learning-based methods are easy to abstract and scale [12,13]. Machine learning-based fault detection and classification algorithms make up a third of failure diagnosis methods reported in the literature [14]. Such machine learning techniques have shown great potential as diagnostic tools for PV systems, boasting high detection and diagnostic accuracy for a wide range of failure modes [8]. Typical input features for the machine learning models include 1-dimensional (1D) data such as environmental time-series data (irradiance, ambient temperature, module temperature, wind speed), electrical parameter data (voltage, current, power, energy) [3,15,16], and IV characteristics [17,18,19,20] or 2-dimensional (2D) data such as visual (Vis) images [21], electroluminescence (EL) images [22,23,24,25,26], infrared (IR) images [3,27,28], and full IV curves [29,30].
IV curves are measured by sweeping the voltage of a PV cell, module, or string of modules, measuring the resulting current while illuminated. IV curves are typically described by a set of cardinal points or parameters that include short-circuit current ( I s c ) or current when V = 0 , open-circuit voltage ( V o c ) or voltage when I = 0 , maximum power point ( V m p , I m p ), and fill factor ( I m p × V m p ) / ( I s c × V o c ) . Many module failures and degradation modes result in distinct changes to the IV curve shape, and while they can affect the summary parameters, much more information is available if the whole IV curve is available [31,32,33,34]. Standard practice, however, is to monitor either DC or AC power from each inverter and not collect IV curves automatically. This results in the inability to distinguish between many failures [3,15]. IV curves are typically measured after a problem has been identified in order to classify and identify its root cause. Monitoring hardware companies are starting to develop automated IV tracers that can be installed permanently in the field and automatically measure curves [35], and some newer inverters have the ability to trace IV curves [36,37]. This development could significantly help to reduce the effects of component failures by allowing real-time analysis of system health, facilitating rapid repairs or even prognostic O&M.
In this publication, we focus on string-level IV curves as the input feature for our machine learning models. String-level IV curves offer a rich data source for classifying failures, as they characterize the electrical behavior of modules (often) in series at all possible operating points [33]. In order to extract the valuable device health information contained within IV curves using machine learning techniques, a diverse IV curve dataset labeled by failure(s) is required. Assimilating a labeled training IV corpus from real or experimental data requires either meticulous logging through O&M tickets in production sites or the careful engineering of failed samples in the lab so that the feature space for each failure class closely follows the field failures [38,39]. However, most production sites do not continuously monitor IV data and wish to keep the performance of their systems proprietary. Additionally, it is difficult to generate failures in the lab that are representative of the wide range of problems that might be encountered in the field while including variations in performance characteristics of different modules and system designs. As a result, a comprehensive PV fault IV dataset does not currently exist.
A solution to this problem is simulation. In this paper, we apply a physics-based simulation methodology from Bishop [40] to generate a training corpus of failures in string-level IV curves. With this training corpus, a neural network architecture is trained to diagnose the failures. The trained model is then leveraged to diagnose failures in real, measured IV curves from laboratory and field experiments (see Figure 2). This pipeline, one which builds a machine learning model with simulations and is deployed on real-world data, is not new. Examples include: robotic hand dexterity [41], computer animation [42], and fluid dynamics [43]. However, it has rarely been demonstrated in the PV failure diagnosis literature [8,44,45], likely due to the inherent noise and high variability of measured data compared to the unperturbed output of simulations. These existing methods utilize simulations as a case study for demonstrating the performance of a proposed failure classification algorithm.
In contrast, the aim of this paper is to emphasize a simulation-backed training corpus as a promising, scalable failure diagnosis solution path. Advantages of a fully synthetic training dataset are that it can be made arbitrarily large, always balanced, instantly available, and independent from the test dataset. Section 2 describes our methodology for simulating and processing baseline and faulted IV curves and for constructing and evaluating the ML model. Section 3.1 qualitatively evaluates and verifies the simulation framework’s flexibility. Section 3.2 utilizes three case studies to evaluate the simulated training data and effectiveness of IV fault classification. A generalized version of the software written for this paper is available as an open-source python package at https://github.com/sandialabs/pvOps [46], (accessed on 10 July 2022).

2. Methodology

2.1. Simulation Using the Diode Model

IV curves have been generated synthetically for decades. The avalanche breakdown model, established by Bishop [40] and implemented in pvlib-python [47], was used to generate our training corpus due to its explicit consideration of electrical mismatches and their interactions in the negative voltage domain. The voltage array in the IV curve is established using a similar procedure to PVMismatch [48]. Points are sampled between the breakdown voltage V b r and the open-circuit voltage with non-linear point spacing. Closer point spacing is required to capture resistance information at the ends of the IV curve (regions close to I s c and V o c ). The current array is derived by the avalanche-model diode equation [40]:
I d i o d e ( F c e l l ) = I L I a I b I c
where
I a = I 0 [ exp ( V + I R s n N s V t h ) 1 ] I b = V + I R s R s h I c = a V + I R s R s h ( 1 V + I R s V b r ) m
The I a segment removes loss due to recombination (commonly ( 0 , 10 ) A ), and the I b segment term represents the losses due to shunt resistances (commonly ( 10 , 0 ) A ). The I c segment implements the “avalanche” effect by adding a non-linear impact on the shunt resistance to account for losses due to the reverse bias breakdown.
Built-in voltage V b i , breakdown voltage V b r , the fraction of ohmic current involved in avalanche breakdown a, and the avalanche breakdown exponential component m are constants that can be found for commercially-available PV modules in the CEC database [49]. The parameters, photocurrent I L , saturation current I o , series resistance R s , shunt resistance R s h , and n N s V t h , the product of diode factor n, number of series cells N s , and thermal voltage V t h can be manipulated to change the state of the cell and can be utilized to define failures, as described in the next section. Additionally, a cell’s performance is affected by environmental conditions: irradiance E, and cell temperature T c . In summary, the diode equation is used to simulate each unique definition of a cell:
F c e l l = ( R s h , R s , I o , I L , n N s V t h ) I V c e l l = I d i o d e ( F c e l l | E , T c ) .
The cell-level IV curves serve as the basic building blocks for simulating PV modules and strings. Failures are defined at the cell level and combined into substrings (series of cells), modules (series of substrings in parallel with bypass diodes), and strings (series of modules) to develop any number of combinations of failures.
The process of deriving the string-level IV curves from the cell-level definitions is provided in Algorithm 1, as established in [40]. First, the cell-level IV curves are derived using Equation (1). These cell-level IV curves are combined to derive the substring-level IV curves. The process of combining cell-level IV curves in series involves multiple steps. In its first iteration, the I V s u b s t r is set equal to the first cell-level IV curve. Then, the short-circuit current I s c of the I V s u b s t r is compared with the I s c of the cell-level IV curve. The curve with the larger I s c is notated as I V l a r g e ; conversely, the curve with the smaller I s c is notated as I V s m a l l . At the intersection of the I V l a r g e 1 × V (flipped about the current axis) and I V s m a l l in the negative voltage domain is notated as I V e q u i v . The current value at this intersection is then used to translate the I V l a r g e curve downwards by ( I V l a r g e s c I e q u i v ) Amps. The I V s u b s t r is then updated to reflect an addition in series (i.e., summation of the voltages) of the translated I V l a r g e and I V s m a l l curves. Once all cells within the substring are added in series, a voltage bypass limitation [ V b y p a s s , ) is established by setting values below V b y p a s s equal to V b y p a s s . To calculate the string-level IV curves, the substring-level IV curves are simply added in series. At any stage, whether it be at the substring level or string level, the final current array after adding in series is post-processed to contain the sorted union of the current of the two inputted IV curves.
Algorithm 1: String-level IV simulation pipeline [40]
Energies 15 05085 i001

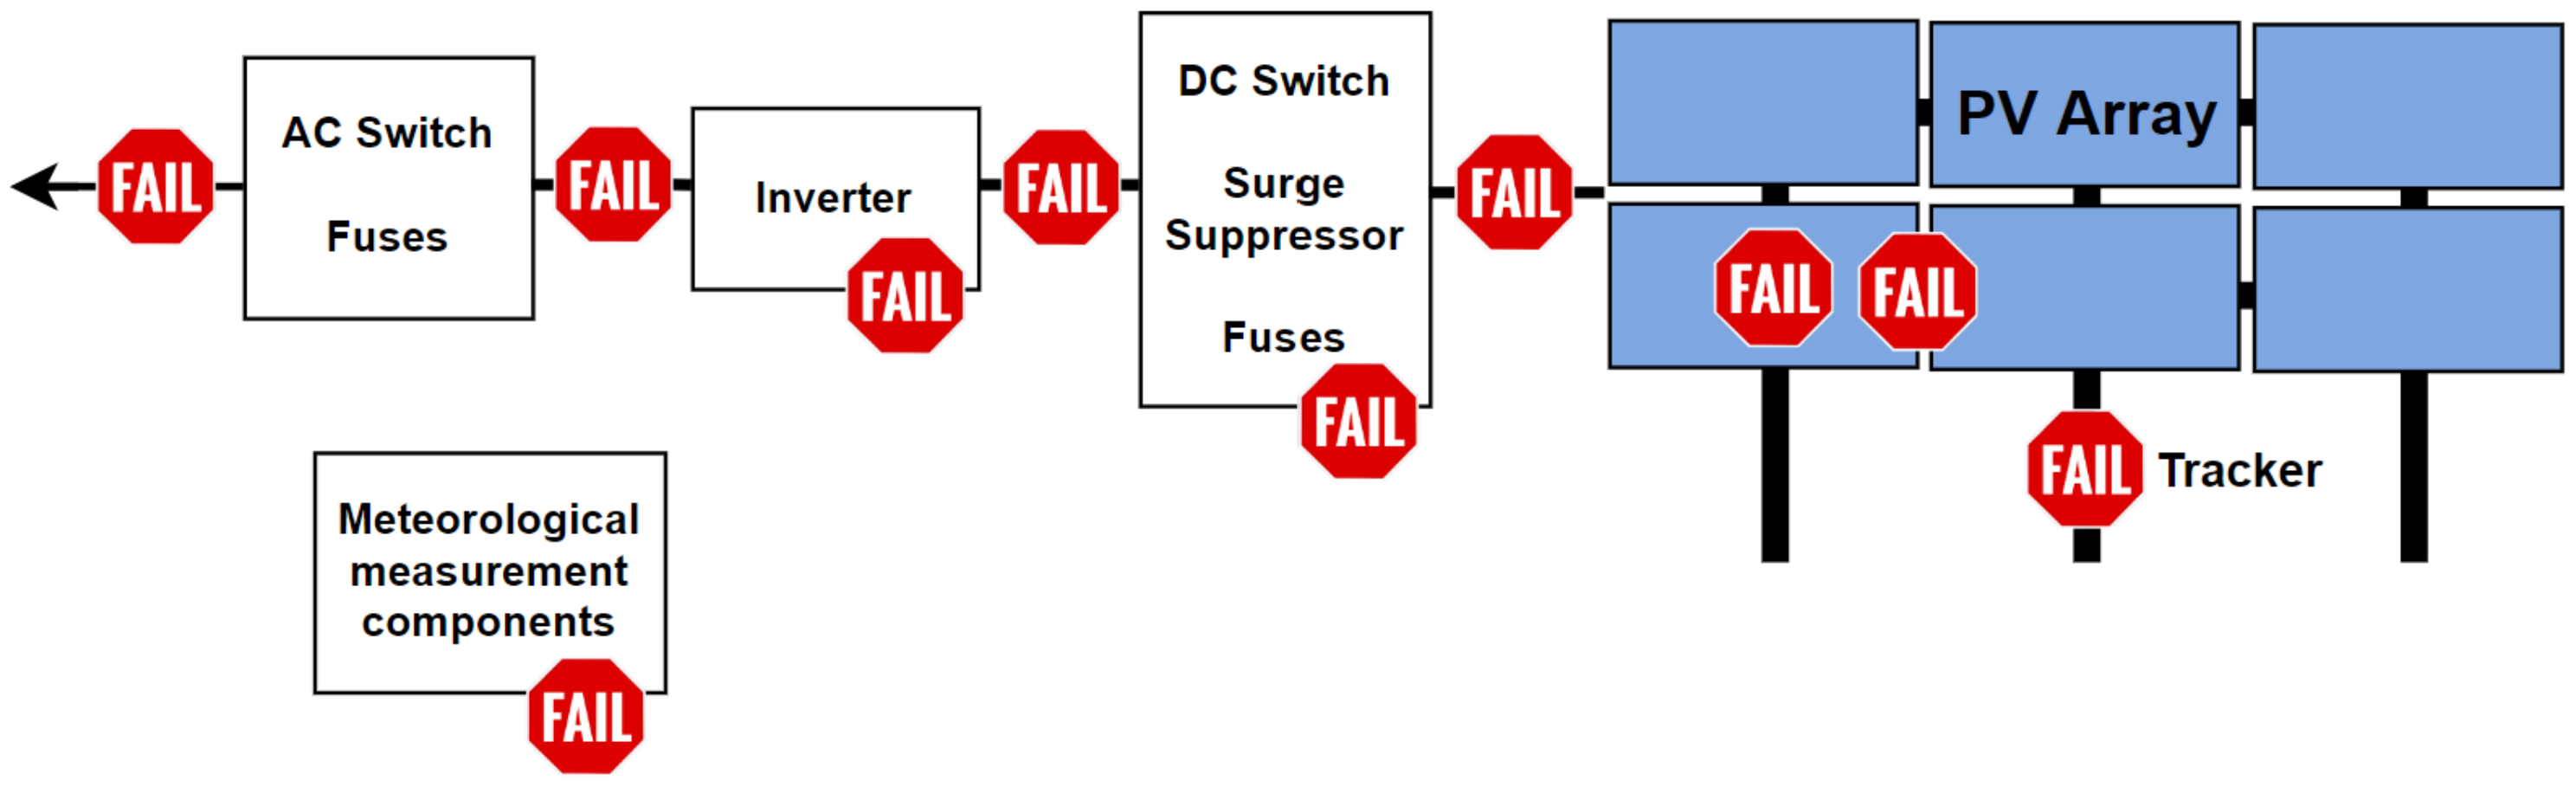
2.2. Failure Definitions

Failures are simulated by modifying five parameters of the cell-level IV curve (Equation (3)). Multipliers ( R s h _ mult , R s _ mult , I o _ mult , I L _ mult , n N s V t h _ mult ) are established to scale the original parameters. Failures such as glass corrosion, delamination, soiling, shading, and encapsulation discoloration will cause a reduction of I s c (0 < I L _ mult < 1). Passivation degradation failures will result in a reduction in the V o c (0 < I o _ mult < 1 and/or 0 < n N s V t h _ mult < 1). Corrosion/delamination of interconnects/contacts and cell breakage will likely impact the R s ( R s _ mult > 1). Potential induced degradation, and poor edge isolation will generate issues in R s h (0 < R s h _ mult < 1).
Many failures in PV systems, especially when related to modules, are inhomogeneous; the failure can exist at different intensities with diverse geometries across the array. Additionally, multiple failures can impact the system simultaneously. To help capture the range of possible representations of failures in IV curves, upsampling techniques were introduced. Instead of passing single numeric values for the multipliers (summarizing one failure), a statistical distribution (i.e., truncated Gaussian) can be passed and sampled (using Latin hypercube sampling [50]) to generate a large number of definitions quickly. This technique can be utilized to build a large corpus for machine learning applications.

2.3. Data

One method of evaluating the success of the simulator is to compare simulated IV curves with measured IV curves for the same physical scenario. Here, two measured datasets are used, one indoor IV curve dataset (in Section 2.3.1) and another outdoor dataset with known failures (in Section 2.3.2).

2.3.1. Indoor Data

A Spire 4600 SP solar simulator was utilized to measure 1-sun IV curves of a 6-year-old SolarWorld 260 W module permanently kept in the dark storage. Partial shading/soiling was physically simulated by applying a neutral density film allowing 67.3% transmission (at I s c ) over a variable number of cells. Five measurements were taken: unshaded, 1-cell shaded, 2-cells shaded, 5-cells shaded, and 10-cells shaded. The four shaded implementations were conducted on the same substring in the module.

2.3.2. Outdoor Data

Data from the Florida Solar Energy Center (FSEC) were used to test the IV simulation’s ability to model and classify outdoor IV curve data. These data contained a string of 12 multicrystalline modules facing south and tilted at 30° (Table 1). String-level IV curves were collected every 30 min using a capacitive load. Module temperature readings were collected every 5 s while plane-of-array (POA) irradiance data were measured every second and averaged to 1-minute intervals. As a note, the benefit to using string-level IV curves is it is more resolute than inverter-level (e.g., often multi-string) measurements but less costly than module-level measurements.
To induce a partial shading/soiling failure, a semi-transparent polymer film was placed over six of the 12 modules within the string (6M). As expected, a visible mismatch in the IV curve was present (Figure 3). The cell cracking failure mode was induced by applying cyclic mechanical loading on pristine modules until cell cracks were achieved and validated by EL imaging. Four cracked modules (4M) were placed in the string. The other eight modules were not damaged. The current loss seen in Figure 3, apparent in the blue graph displaying the current_diff (i.e., the difference in current between a pristine simulated curve and the measured faulted curve), is due to either electrical isolation of some cell areas, a slight mismatch caused by minor soiling (i.e., uncleaned modules) of the otherwise unstressed modules, or both.

2.4. Data Filtering, Processing and Feature Generation

Prior to training ML models, preprocessing steps remove signals that are unrelated to the classification task at hand. To correct the outdoor experimentally obtained IV curves according to environmental conditions, the curves are standardized to a reference condition via
V r e f = V × log E r e f log E a c t β × ( T a c t T r e f ) I r e f = I × E r e f E a c t α × ( T a c t T r e f )
where β is the V o c temperature coefficient, and α is the I s c temperature coefficient (Table 1). The G a c t is the measured POA, which is reported from a reference cell; T r e f is 25 ° C and G r e f is 1000 W m 2 (i.e., under standard test conditions [51]). Without correction, the ML model would have to contain information about recognizing faults at each environmental condition separately, causing the theoretical model storage to be R E × T times larger.
From here, the IV data are resampled so that all curves share the same voltage points. The resampling frequency was set at 1% intervals. This step allows the voltage array to be ignored as an ML input, which is beneficial because the voltage array is commonly determined by the IV trace measurement system, so it may vary between unprocessed datasets. Additionally, we removed the first 3% of each IV curve near I s c , both simulation and measured, due to perturbations in the curves commonly found in this region (Figure 4). These deviations are likely a product of the measurement system rather than a failure condition. Afterward, the current of the IV curve is normalized ι = I / I s c by its detected I s c to remove system-specific information from the data. This is an important step toward generating an ML model that is agnostic of the system specifications.
The resampling process described above is conducted on both simulated and measured curves. However, for measured curves, it can be beneficial to apply additional filtering, which removes curves that have dramatically irregular profiles. Firstly, the well-known correlation between I s c and irradiance (E) was utilized to remove samples outside 3-sigma of the I s c E distribution. This step removes many variable-sky conditions where the irradiance is changing during the IV curve measurement. Further, a filter E > 400 W m 2 was used to remove irregular IV curve profiles at relatively low irradiance values.
The IV curve alone can be utilized to detect observable failures, but the inclusion of additional variables that emphasize phenomena in the IV curve helps the ML classifier discriminate between failures with fewer data. Four features are used in the failure classification process: normalized current, power ( V × I ), current differential Δ I , and finite difference δ I δ V (Figure 3). The current differential Δ I = I sim . unstressed I sample captures the element-wise difference in current between each IV curve and the unstressed (simulated) IV curve for that module or string. This feature is important because it should help capture failures that have uniform translations at the I s c and/or V o c , which otherwise would be invisible if only observing the processed current array (which is normalized). Additionally, the finite difference δ I δ V = I i I i 1 is utilized as a feature due to the importance of the IV curve’s slope in recognizing resistance changes.

2.5. Machine Learning

A 1-dimensional (1D) convolutional neural network (CNN) is utilized to investigate the relationship between the features (i.e., IV, power, finite difference, and current difference curve geometries, as visualized in Figure 3) and their corresponding failure modes. The 1D kernels restrict the feature generation within the neural network to traverse solely down the voltage dimension. Each convolution kernel (kernel size of 12) moves down the voltage dimension, generating filtered matrices (64 filters). Through the training epochs, the kernels become optimal features for mapping the input data to the solution. The convolutional layer is followed by a dropout layer (dropout percentage of 50%), a flatten layer, and two dense layers, which map the sequence to a shape ready for probability vectors (i.e., softmax activation). Backpropagation is conducted using the adaptive movement estimation optimizer [52]. This neural network architecture can be expanded to identify a larger number of failures, which will require the retention of more information about (potentially) more complicated failures.
The machine learning classifier can be inherently biased if the failure mode distribution is nonuniform. Therefore, we incur a balance by mandating an equal number of samples per failure mode. Then, the data was split with a 90–10% train-test split. Stratified 5-fold cross-validation was utilized during the model training stage to reduce overfitting. A small batch size of 8 rows was established to reduce memory requirements. The model was evaluated using the classification accuracy. Using the preprocessing steps described in the last section, the neural network model has around 560,000 trainable parameters, which, depending on the complexity of the task, may be grown or shrunk by adjusting the network architecture. All steps of the methodology, including the simulations and machine learning model development, were computed using a personal laptop with an Intel i7-8665U CPU and 16 GB available RAM.

3. Results

The simulation framework is evaluated through a verification and validation process. In the verification step, a series of failures are implemented to observe the flexibility of the framework. In the validation step, the simulation process is compared to curves with known failures to evaluate its accuracy. Finally, the simulation framework is applied to IV curve classification via machine learning.

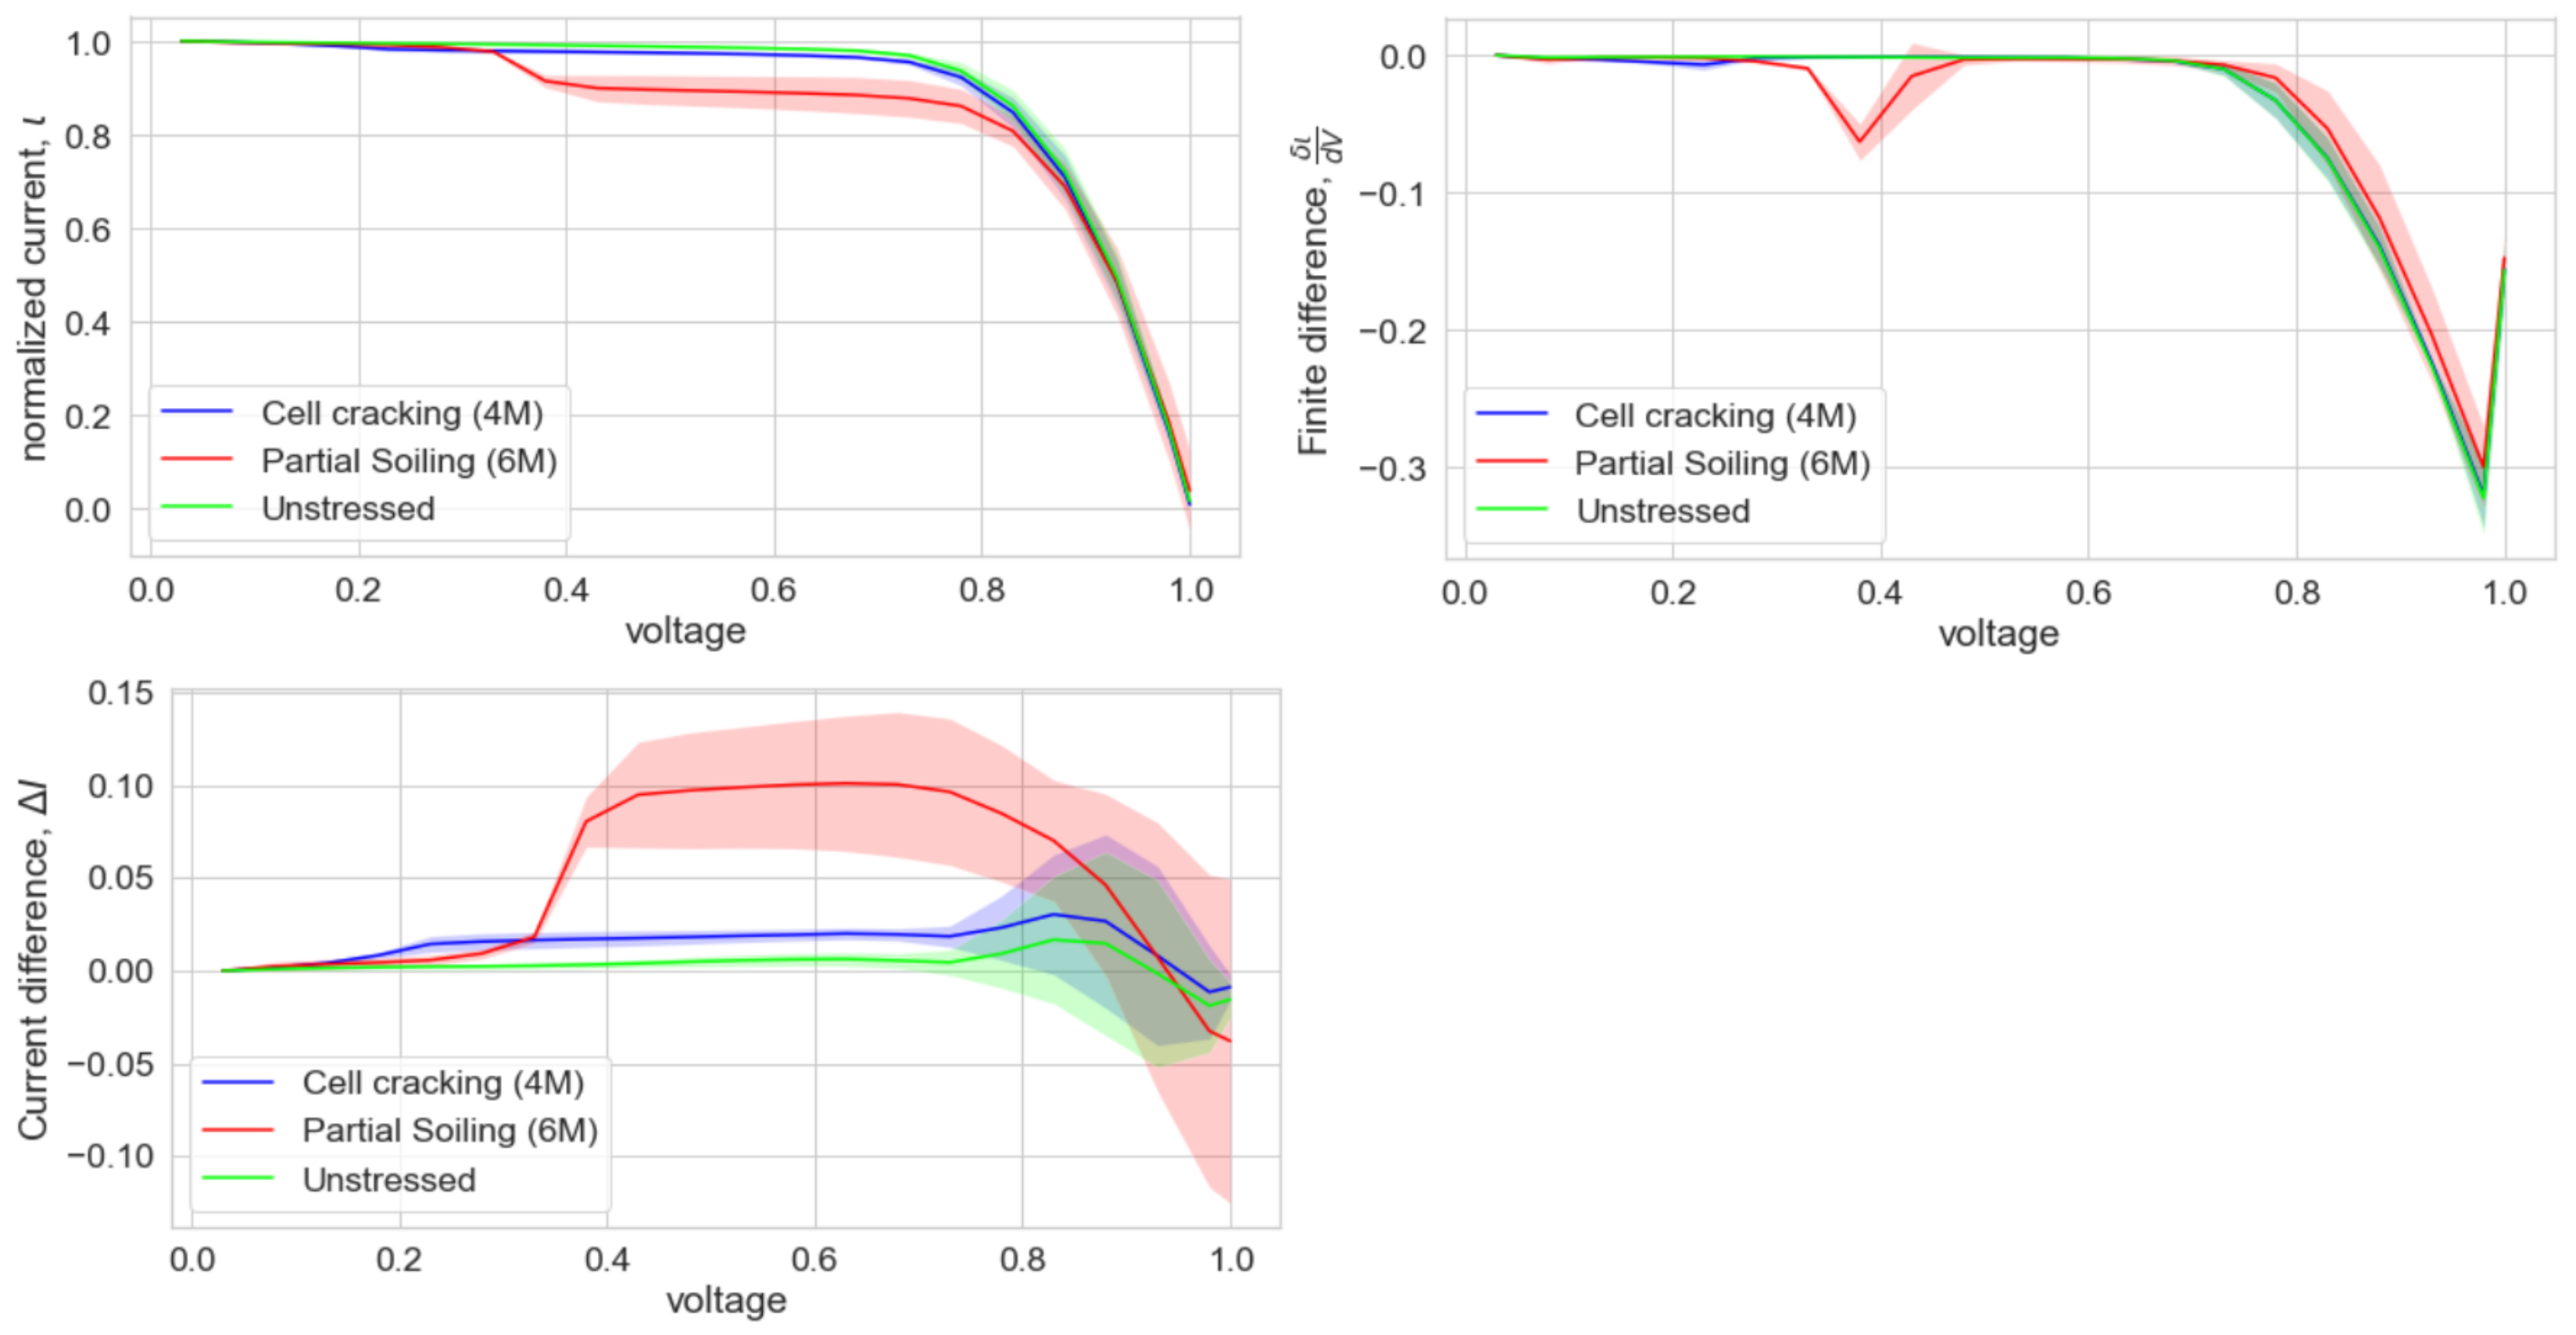
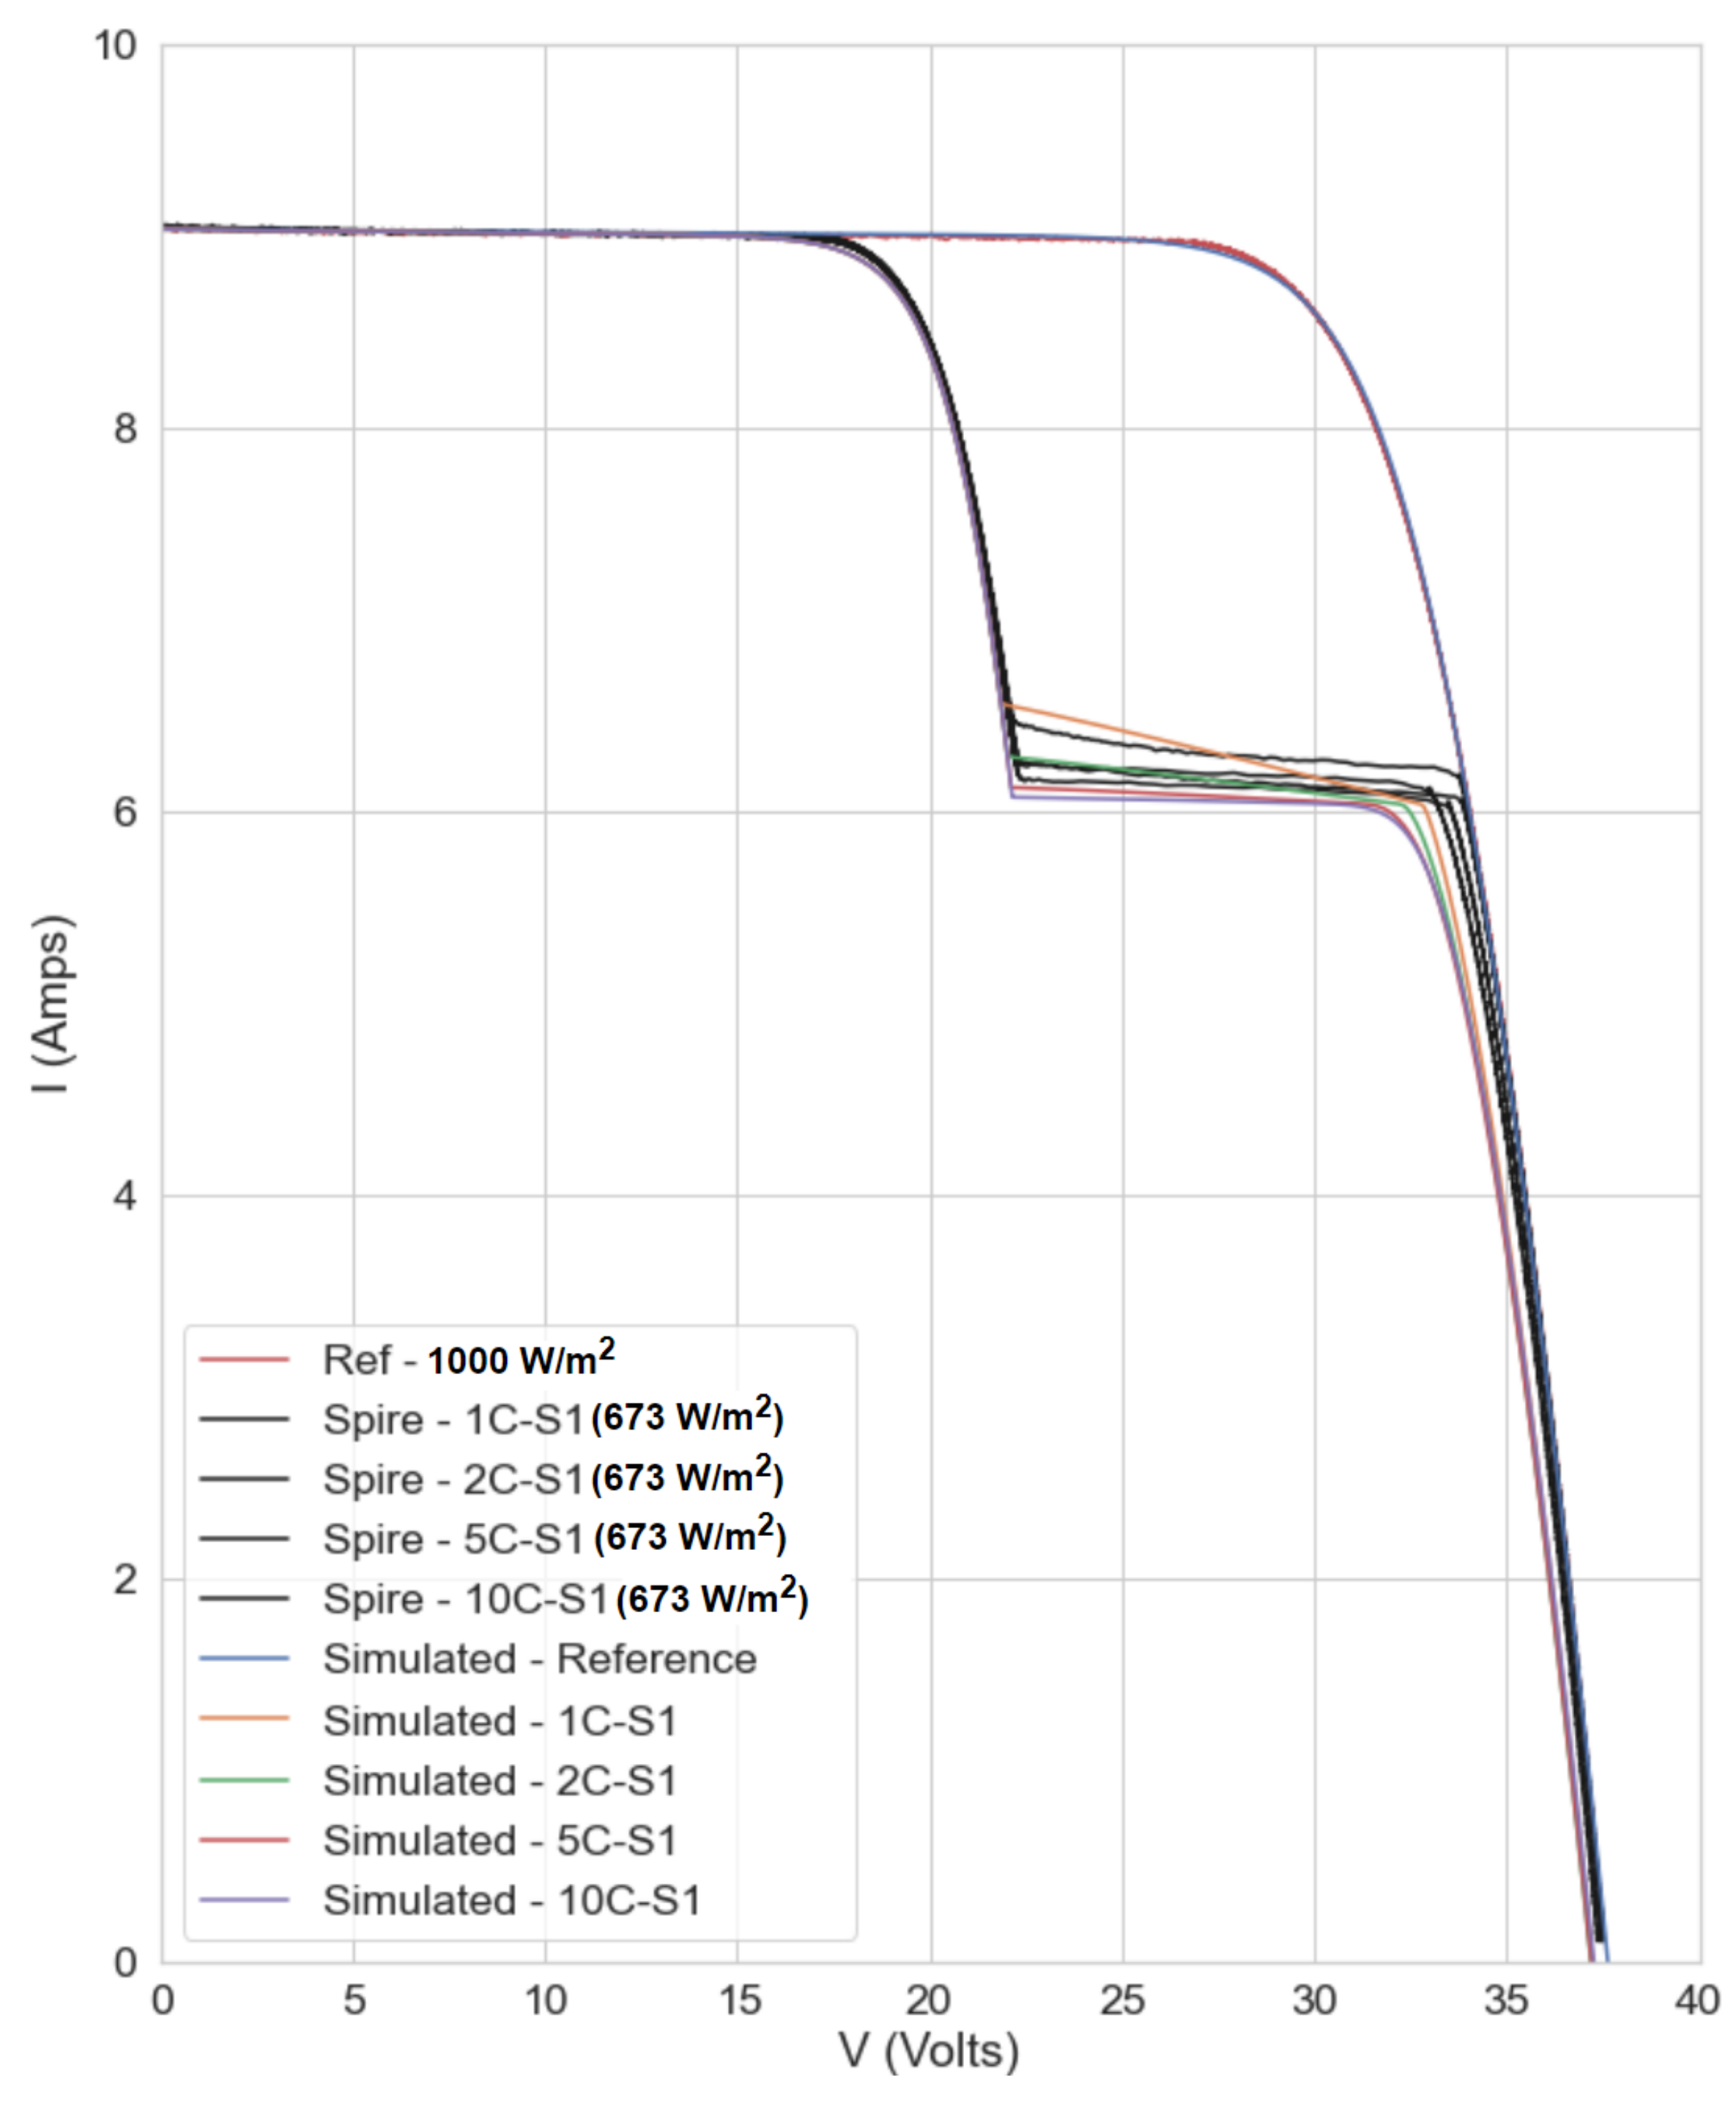
3.1. Simulation Verification

In order to verify the simulation framework’s abilities, qualitative tests are conducted to evaluate its flexibility. One test builds a set of discrete, simple failures (Figure 5); another test constructs a random failure (Figure 6).
In the first test, a univariate (i.e., impacting only one parameter), uniform (i.e., impacting all cells in substring and all substrings in a string equally) failure definition is applied to 12 modules, each containing three substrings of 20 cells. Each of the five diode model parameters is impacted four times, generating 20 different failures. Figure 5 shows a heat map of these failures, displaying the normalized voltage domain of the IV curve on the x-axis, an experiment name on the y-axis, and the current difference between a pristine simulated and the faulted measured curve as the color. In this plot, darker colors represent locations where a larger difference in current is found. Overall, the results follow expectations; the negative slope of the IV curve near I s c caused by a low R s h is seen in the top three rows. Here, an increasing effect on current is found when decreasing the R s h _ mult . Similarly, an effect on the slope near the V o c (right side of the graph) is seen on the graphs impacting the R s _ mult . As the R s _ mult increases, the effect on the IV curve profile gets larger. Thirdly, the I l _ mult translates the I s c of the curve, as shown in the graph. While below 1, a decreasing I l _ mult causes a larger translation downwards. The I o _ mult correctly shows a minor effect on the V o c where an increasing value causes an increasing effect. Lastly, the n N s V t h _ mult captures the current loss due to recombination (from diode ideality factor) and energy manifested by heat (caused by thermal voltage). An increasing effect on the current is caused by a decreasing n N s V t h _ mult .
The simulation framework can also be verified by generating a random failure and observing its response. A faulted string of 12,270 W modules is developed by randomly impacting 20% of the cells with a random selection of fault parameters (Figure 6). Many modules show steps in the IV curve caused by the activation of one or multiple bypass diodes. The magnitude of the step downwards (in Amps) is determined by the severity of the substring’s cells’ shifts in I s c caused by the random failures. These modules are combined into a string-level IV curve, generating a highly irregular profile from all of the mismatches.

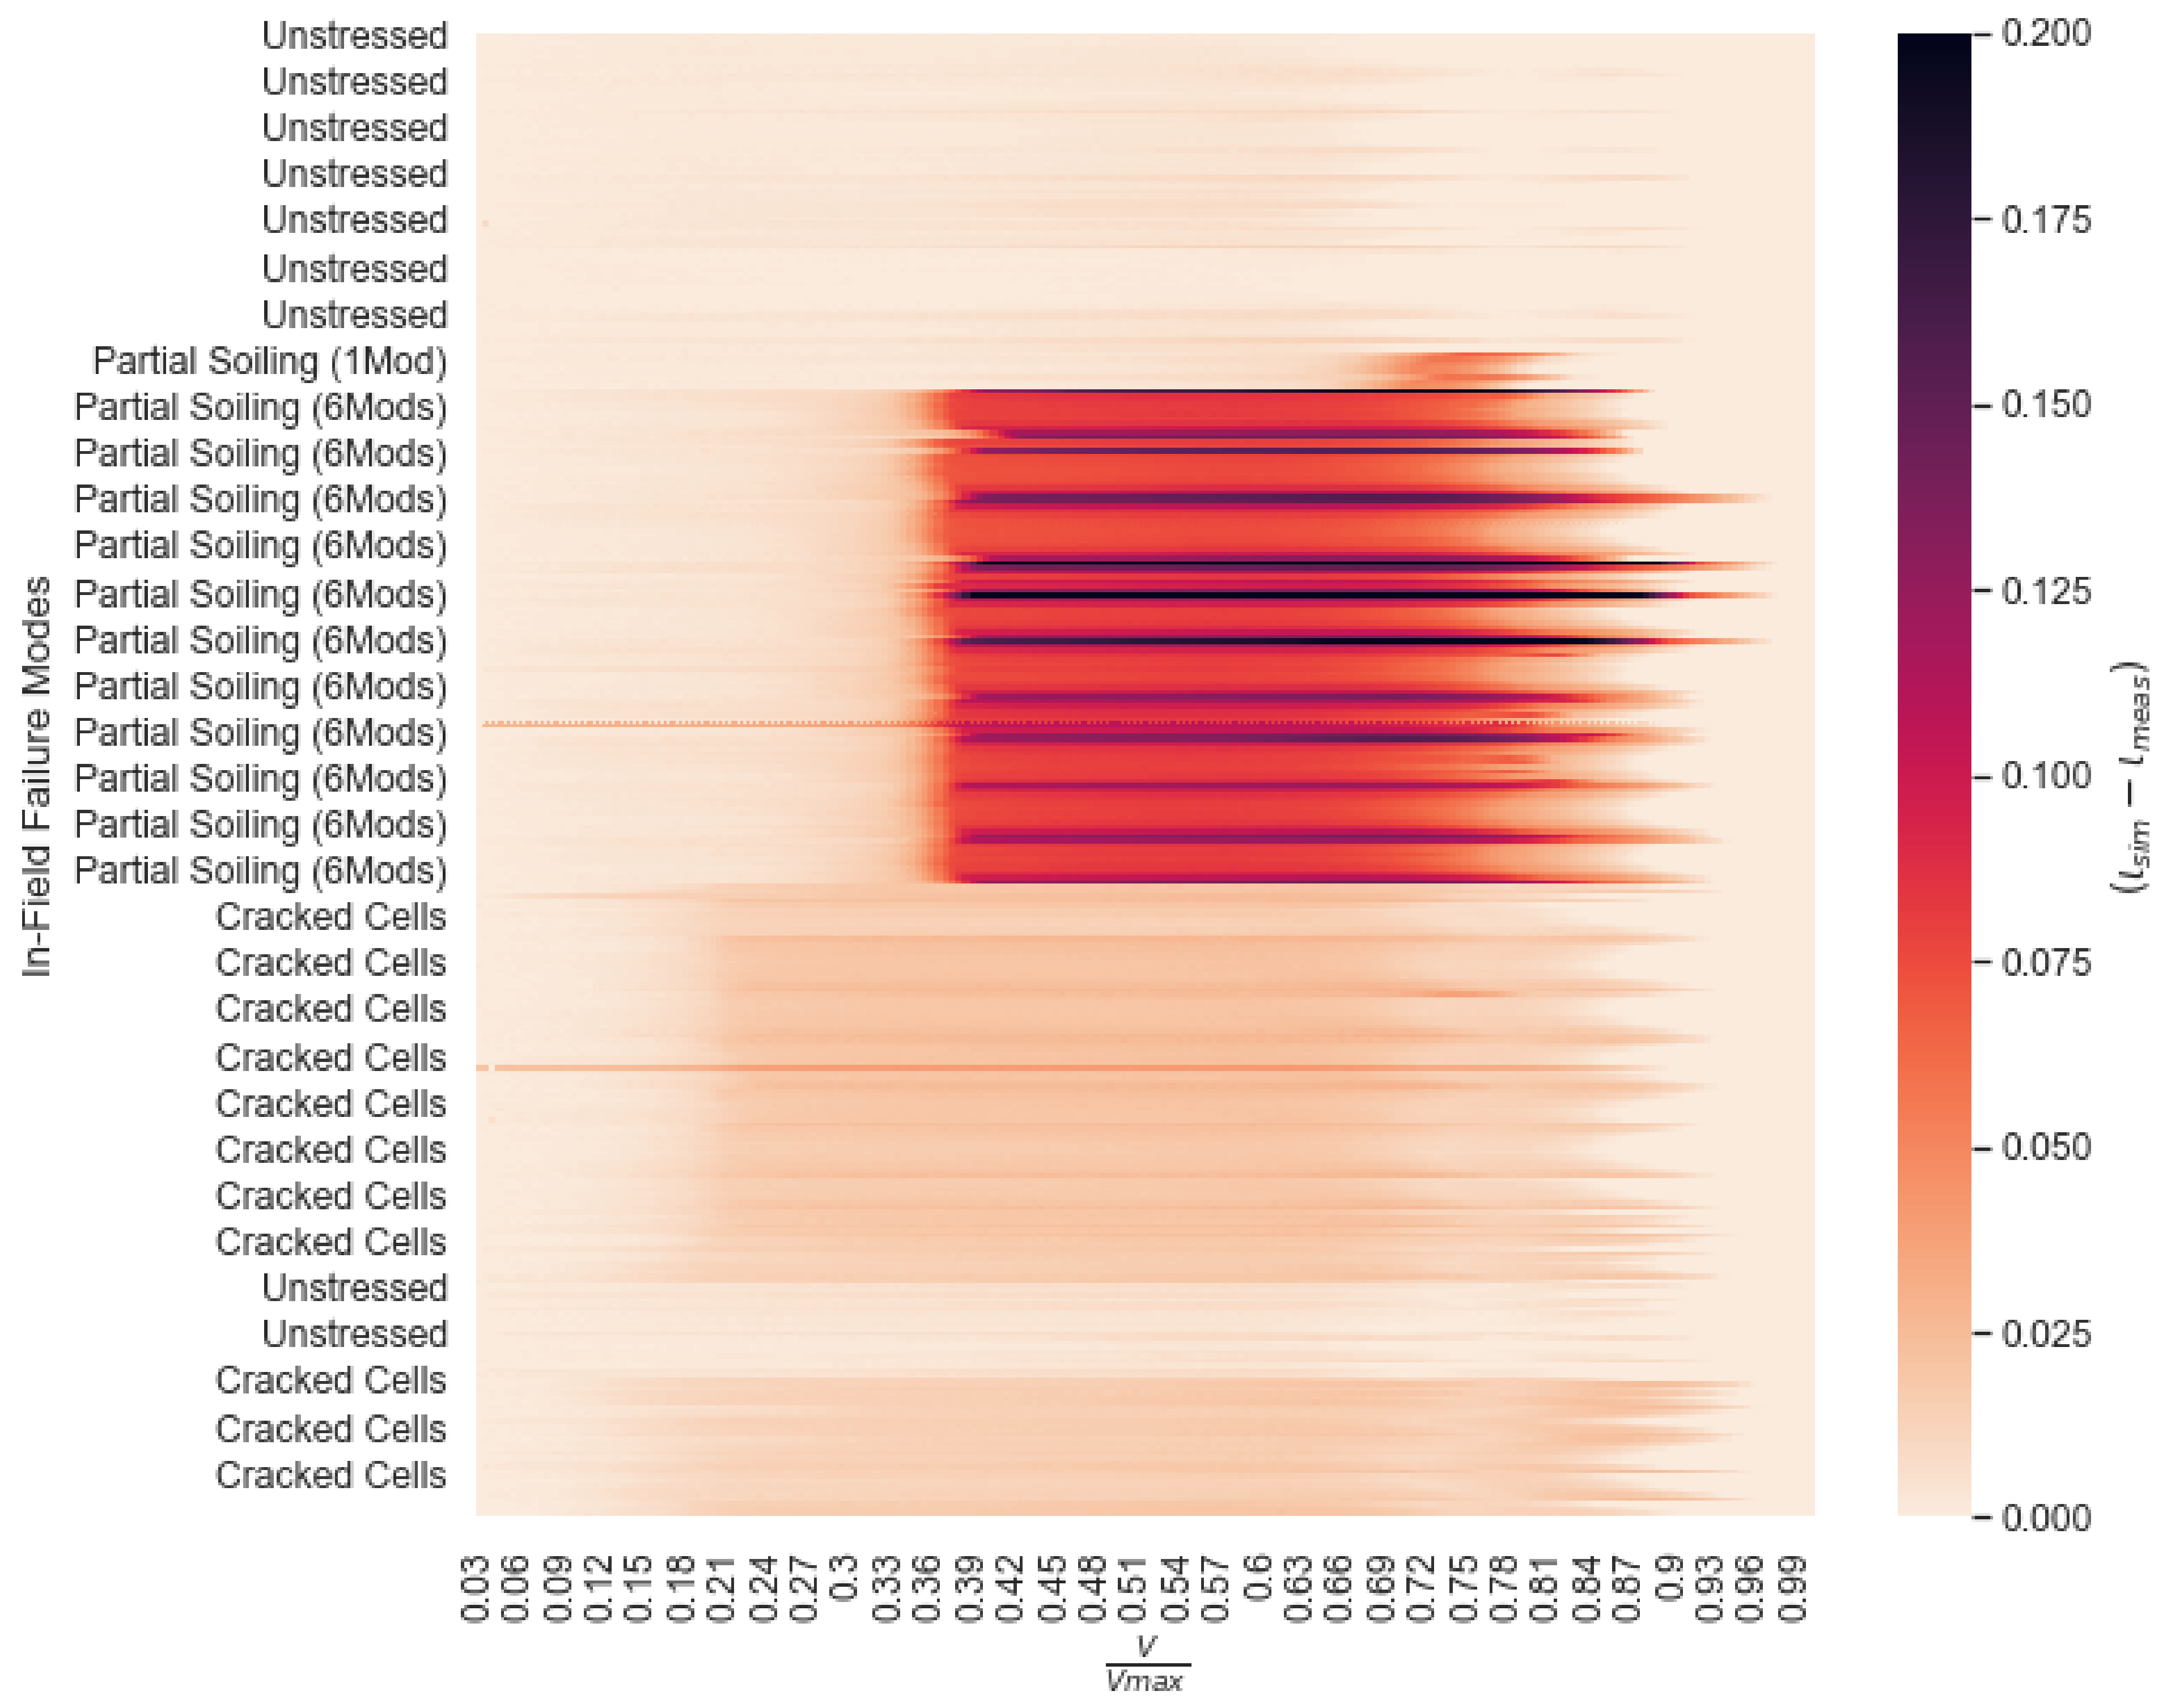
3.2. Simulation Validation

The validity of the simulations is tested by comparing them to both indoor-collected measured data and outdoor-collected measured data to observe the simulation’s closeness of fit.
The test using indoor data (see details in Section 2.3.1) compares the measured and simulated partial shading/soiling of a module (Figure 7). The measured baseline (in pink) and simulated baseline (in yellow) match closely. The faulted measured curves (in black) and simulations (colored) also appear to match closely; however, in the second knee, the simulations display a curved transition while the measured curves experience a sharp transition. Additionally, the simulated faulted curves have linear slopes in the mismatched section, while the measured curves appear to have a non-linear slope, likely caused by an inhomogeneous resistance value across cells.
The test using outdoor data (see details in Section 2.3.2) compares the normalized current of a simulated unstressed string and the measured faulted string, visualized in a heatmap (Figure 4). A row on the heatmap signifies a single IV curve measurement; the y-axis label provides the fault condition. The x-axis comprises the normalized voltage. Each IV curve (both measured and simulated) is interpolated to a common voltage domain. The heatmap’s color bar is the difference between the normalized current of the simulations and the measurements. At the top of the figure, baseline curves show little effect on the IV curve’s profile, as expected. Partial soiling shows a significant loss in current in the middle sections of the curve due to the current mismatch caused by artificially soiling 6 of the 12 modules in the string. The cracked cells render apparent losses in current and minor changes near the knee of the curve (∼0.75 V/ V o c ). Minor losses in P m p p are measured for cell-cracking, noting the importance of IV curve collection for failure detection and classification tasks.

3.3. IV Curve Classification

A final form of validation was conducted to evaluate an application of the simulation framework on IV curve failure classification. Here, an IV curve classifier is compared when using measured and simulated data. We define a generalized classifier as one that is robust to the wide spectrum of definitions that exist for a single failure. Simulations were generated to establish a training corpus for a classifier that would identify the failures in the outdoor FSEC data (see Section 2.3.2).
All failures were defined at a series of environmental conditions (Irradiance: [400, 500, …, 1000] W m 2 , Cell Temperature: [35, 40, …, 55] C). A baseline cell is defined to have a minor impact on R s _ mult with a truncated Gaussian distribution ( μ = 1.05 , σ = 0.1 , min = 0.98 , max = 1.20 ) to account for minor changes in slope found in measurements near the area between the IV curve’s knee and V o c . Establishing a definition as a distribution (no matter how small) enables the generation of samples by sampling the distribution and permits the creation of a (potentially) large number of samples, aiding the generation of a training corpus for ML. A shaded cell is defined to have a large impact on I L _ mult with a truncated Gaussian distribution ( μ = 0.6 , σ = 0.7 , min = 0.33 , max = 0.95 ). Lastly, a cracked cell is defined with an impact on R s _ mult ( μ = 1.3 , σ = 0.5 , min = 1.1 , max = 1.8 ) and R s h _ mult ( μ = 0.5 , σ = 0.6 , min = 0.3 , max = 0.7 ). All cells in a faulted module were impacted with their respective failure definition. For partial soiling, 6 out of 12 modules were faulted, and for cell cracking, 4 of the 12 modules were faulted. After simulation, all curves are preprocessed according to the procedure in Section 2.4. The processed curves are utilized to train the classifier described in Section 2.5.
The results show a 100% classification accuracy when using simulated curves to classify measured curves from the test split (Table 2). The studies using simulated data split the data using a 90–10% train-test split, similar to the split used on the measured data. A ∼96% accuracy is found when using a simulated corpus to classify all measured curves. Every misclassification was found between the unstressed and cell cracking failure modes, which is intuitive because the IV curve profiles are similar. Because we had full control of the simulations, we were able to tune the simulations towards the failures that we knew were in the measured corpus; this allowed us to reach high, perfect accuracies. Further work will need to be conducted to build a more generalized model using larger sets of simulated data with more failure definitions, namely incipient faults, for the purpose of failure prevention.

4. Conclusions

In this paper, we have developed, verified, and validated an IV curve simulation framework by observing the framework’s flexibility to a diverse set of failures, comparing simulations to measurements with failures, and utilizing simulations for machine learning failure classification. The goal of this endeavor was to generate a toolset for the rapid analysis of IV curve monitoring data collected on PV plants. Future work will extend the functionality of this classifier by building a library of failure definitions. With the constructed simulation methodology, an augmented training corpus can be built to increase failure specificity (i.e., failure diagnosis of more failures and failure combinations) and failure location estimation. As a note, embedding the knowledge to discriminate between a large number of failures will likely require a larger neural network. Attention-based models may be helpful in conditioning the model to observe certain areas on the curve for a given failure category, potentially allowing for a more generalized model with fewer parameters. Additionally, confirming the system-independent nature of the ML models will be an important step toward deploying generalized models. If the pipeline indeed is reliant on system-specific tendencies in the classification process, then that would mandate that a new model be generated for each field. Instead, having one centralized model that can be utilized on all systems would allow faster incorporation of an established model.

Author Contributions

Conceptualization, M.W.H. and J.S.S.; methodology, M.W.H., J.S.S. and J.L.B.; software, M.W.H.; validation, M.W.H.; formal analysis, M.W.H.; investigation, M.W.H.; resources, J.S.S.; data curation, J.S.S. and H.P.S.; writing—original draft preparation, M.W.H. and H.P.S.; writing—review and editing, M.W.H., J.S.S., J.L.B. and H.P.S.; visualization, M.W.H.; supervision, J.S.S. and J.L.B.; project administration, J.S.S.; funding acquisition, J.S.S. All authors have read and agreed to the published version of the manuscript.

Funding

Sandia National Laboratories is a multimission laboratory managed and operated by National Technology & Engineering Solutions of Sandia, LLC, a wholly owned subsidiary of Honeywell International Inc., for the U.S. Department of Energy’s National Nuclear Security Administration under contract DE-NA0003525. This paper describes objective technical results and analysis. Any subjective views or opinions that might be expressed in the paper do not necessarily represent the views of the U.S. Department of Energy or the United States Government.

Institutional Review Board Statement

Not applicable.

Informed Consent Statement

Not applicable.

Conflicts of Interest

The authors declare no conflict of interest.

References

  1. Seigneur, H.; Mohajeri, N.; Brooker, R.P.; Davis, K.O.; Schneller, E.J.; Dhere, N.G.; Rodgers, M.P.; Wohlgemuth, J.; Shiradkar, N.S.; Scardera, G.; et al. Manufacturing metrology for c-Si photovoltaic module reliability and durability, Part I: Feedstock, crystallization and wafering. Renew. Sustain. Energy Rev. 2016, 59, 84–106. [Google Scholar] [CrossRef] [Green Version]
  2. Köntges, M.; Kurtz, S.; Packard, C.; Jahn, U.; Berger, K.; Kato, K.; Kazuhilo, F.; Thomas, F.; Liu, H.; van Iseghem, M. IEA-PVPS Task 13: Review of Failures of Photovoltaic Modules; SUPSI: Manno, Switzerland, 2014. [Google Scholar]
  3. Haque, A.; Bharath, K.V.S.; Khan, M.A.; Khan, I.; Jaffery, Z.A. Fault diagnosis of photovoltaic modules. Energy Sci. Eng. 2019, 7, 622–644. [Google Scholar] [CrossRef] [Green Version]
  4. Lillo-Bravo, I.; González-Martínez, P.; Larrañeta, M.; Guasumba-Codena, J. Impact of Energy Losses Due to Failures on Photovoltaic Plant Energy Balance. Energies 2018, 11, 363. [Google Scholar] [CrossRef] [Green Version]
  5. Moser, D.; Buono, M.D.; Jahn, U.; Herz, M.; Richter, M.; Brabandere, K.D. Identification of technical risks in the photovoltaic value chain and quantification of the economic impact. Prog. Photovolt. Res. Appl. 2017, 25, 592–604. [Google Scholar] [CrossRef]
  6. Jordan, D.C.; Marion, B.; Deline, C.; Barnes, T.; Bolinger, M. PV field reliability status—Analysis of 100 000 solar systems. Prog. Photovolt. Res. Appl. 2020, 28, 739–754. [Google Scholar] [CrossRef]
  7. Madeti, S.R.; Singh, S. A comprehensive study on different types of faults and detection techniques for solar photovoltaic system. Sol. Energy 2017, 158, 161–185. [Google Scholar] [CrossRef]
  8. Li, B.; Delpha, C.; Diallo, D.; Migan-Dubois, A. Application of Artificial Neural Networks to photovoltaic fault detection and diagnosis: A review. Renew. Sustain. Energy Rev. 2021, 138, 110512. [Google Scholar] [CrossRef]
  9. Pillai, D.S.; Rajasekar, N. A comprehensive review on protection challenges and fault diagnosis in PV systems. Renew. Sustain. Energy Rev. 2018, 91, 18–40. [Google Scholar] [CrossRef]
  10. Gabor, A.M.; Schneller, E.J.; Seigneur, H.; Rowell, M.W.; Colvin, D.; Hopwood, M.; Davis, K.O. The impact of cracked solar cells on solar panel energy delivery. In Proceedings of the 2020 47th IEEE Photovoltaic Specialists Conference (PVSC), Calgary, ON, Canada, 15 June–21 August 2020; pp. 0810–0813. [Google Scholar]
  11. Zhao, Y. Fault Detection, Classification and Protection in Solar Photovoltaic Arrays; Northeastern University: Boston, MA, USA, 2015. [Google Scholar]
  12. Akram, M.N.; Lotfifard, S. Modeling and health monitoring of DC side of photovoltaic array. IEEE Trans. Sustain. Energy 2015, 6, 1245–1253. [Google Scholar] [CrossRef]
  13. Appiah, A.Y.; Zhang, X.; Ayawli, B.B.K.; Kyeremeh, F. Review and performance evaluation of photovoltaic array fault detection and diagnosis techniques. Int. J. Photoenergy 2019, 2019, 6953530. [Google Scholar] [CrossRef]
  14. Livera, A.; Theristis, M.; Makrides, G.; Georghiou, G.E. Recent advances in failure diagnosis techniques based on performance data analysis for grid-connected photovoltaic systems. Renew. Energy 2019, 133, 126–143. [Google Scholar] [CrossRef]
  15. Rodrigues, S.; Ramos, H.G.; Morgado-Dias, F. Machine Learning in PV Fault Detection, Diagnostics and Prognostics: A Review. In Proceedings of the 2017 IEEE 44th Photovoltaic Specialist Conference (PVSC), Washington, DC, USA, 25–30 June 2017; pp. 3178–3183. [Google Scholar] [CrossRef]
  16. Lu, X.; Lin, P.; Cheng, S.; Lin, Y.; Chen, Z.; Wu, L.; Zheng, Q. Fault diagnosis for photovoltaic array based on convolutional neural network and electrical time series graph. Energy Convers. Manag. 2019, 196, 950–965. [Google Scholar] [CrossRef]
  17. Ma, M.; Zhang, Z.; Yun, P.; Xie, Z.; Wang, H.; Ma, W. Photovoltaic Module Current Mismatch Fault Diagnosis Based on I-V Data. IEEE J. Photovolt. 2021, 11, 779–788. [Google Scholar] [CrossRef]
  18. Huang, J.M.; Wai, R.J.; Gao, W. Newly-Designed Fault Diagnostic Method for Solar Photovoltaic Generation System Based on IV-Curve Measurement. IEEE Access 2019, 7, 70919–70932. [Google Scholar] [CrossRef]
  19. Chine, W.; Mellit, A.; Lughi, V.; Malek, A.; Sulligoi, G.; Massi Pavan, A. A novel fault diagnosis technique for photovoltaic systems based on artificial neural networks. Renew. Energy 2016, 90, 501–512. [Google Scholar] [CrossRef]
  20. Aziz, F.; Ul Haq, A.; Ahmad, S.; Mahmoud, Y.; Jalal, M.; Ali, U. A Novel Convolutional Neural Network-Based Approach for Fault Classification in Photovoltaic Arrays. IEEE Access 2020, 8, 41889–41904. [Google Scholar] [CrossRef]
  21. Li, X.; Yang, Q.; Lou, Z.; Yan, W. Deep Learning Based Module Defect Analysis for Large-Scale Photovoltaic Farms. IEEE Trans. Energy Convers. 2019, 34, 520–529. [Google Scholar] [CrossRef]
  22. Tang, W.; Yang, Q.; Xiong, K.; Yan, W. Deep learning based automatic defect identification of photovoltaic module using electroluminescence images. Sol. Energy 2020, 201, 453–460. [Google Scholar] [CrossRef]
  23. Zhao, Y.; Zhan, K.; Wang, Z.; Shen, W. Deep learning-based automatic detection of multitype defects in photovoltaic modules and application in real production line. Prog. Photovolt. Res. Appl. 2021, 29, 471–484. [Google Scholar] [CrossRef]
  24. Hoffmann, M.; Buerhop-Lutz, C.; Reeb, L.; Pickel, T.; Winkler, T.; Doll, B.; Würfl, T.; Marius Peters, I.; Brabec, C.; Maier, A.; et al. Deep-learning-based pipeline for module power prediction from electroluminescense measurements. Prog. Photovolt. Res. Appl. 2021, 28, 920–935. [Google Scholar] [CrossRef]
  25. Pierce, B.G.; Karimi, A.M.; Liu, J.; French, R.H.; Braid, J.L. Identifying Degradation Modes of Photovoltaic Modules Using Unsupervised Machine Learning on Electroluminescense Images. In Proceedings of the 2020 47th IEEE Photovoltaic Specialists Conference (PVSC), Calgary, ON, Canada, 15 June–21 August 2020; pp. 1850–1855. [Google Scholar]
  26. Karimi, A.M.; Fada, J.S.; Parrilla, N.A.; Pierce, B.G.; Koyutürk, M.; French, R.H.; Braid, J.L. Generalized and mechanistic PV module performance prediction from computer vision and machine learning on electroluminescence images. IEEE J. Photovolt. 2020, 10, 878–887. [Google Scholar] [CrossRef]
  27. Bommes, L.; Pickel, T.; Buerhop-Lutz, C.; Hauch, J.; Brabec, C.; Peters, I.M. Computer vision tool for detection, mapping, and fault classification of photovoltaics modules in aerial IR videos. Prog. Photovolt. Res. Appl. 2021, 29, 1236–1251. [Google Scholar] [CrossRef]
  28. Dunderdale, C.; Brettenny, W.; Clohessy, C.; van Dyk, E.E. Photovoltaic defect classification through thermal infrared imaging using a machine learning approach. Prog. Photovolt. Res. Appl. 2020, 28, 177–188. [Google Scholar] [CrossRef]
  29. Hopwood, M.W.; Gunda, T.; Seigneur, H.; Walters, J. Neural network-based classification of string-level IV curves from physically-induced failures of photovoltaic modules. IEEE Access 2020, 8, 161480–161487. [Google Scholar] [CrossRef]
  30. Gao, W.; Wai, R.J. A Novel Fault Identification Method for Photovoltaic Array via Convolutional Neural Network and Residual Gated Recurrent Unit. IEEE Access 2020, 8, 159493–159510. [Google Scholar] [CrossRef]
  31. Guo, S.; Schneller, E.; Walters, J.; Davis, K.O.; Schoenfeld, W.V. Detecting loss mechanisms of c-Si PV modules in-situ I-V measurement. In Proceedings of the Reliability of Photovoltaic Cells, Modules, Components, and Systems IX, International Society for Optics and Photonics, San Diego, CA, USA, 6–7 August 2016; Volume 9938, p. 99380N. [Google Scholar] [CrossRef]
  32. Ma, X.; Huang, W.H.; Schnabel, E.; Köhl, M.; Brynjarsdóttir, J.; Braid, J.L.; French, R.H. Data-Driven IV Feature Extraction for Photovoltaic Modules. IEEE J. Photovolt. 2019, 9, 1405–1412. [Google Scholar] [CrossRef] [Green Version]
  33. Hopwood, M.; Gunda, T.; Seigneur, H.; Walters, J. An assessment of the value of principal component analysis for photovoltaic IV trace classification of physically-induced failures. In Proceedings of the 2020 47th IEEE Photovoltaic Specialists Conference (PVSC), Calgary, ON, Canada, 15 June–21 August 2020; pp. 0798–0802. [Google Scholar] [CrossRef]
  34. Wang, M.; Liu, J.; Burleyson, T.J.; Schneller, E.J.; Davis, K.O.; French, R.H.; Braid, J.L. Analytic Method and Power Loss Modes From Outdoor Time-Series IV Curves. IEEE J. Photovolt. 2020, 10, 1379–1388. [Google Scholar] [CrossRef]
  35. Teodorescu, R.; Kerekes, T.; Sera, D.; Spataru, S. Monitoring and Fault Detection in Photovoltaic Systems Based On Inverter Measured String I-V Curves. In Proceedings of the 31st European Photovoltaic Solar Energy Conference and Exhibition, Hamburg, Germany, 14–18 September 2015; pp. 1667–1674, ISBN 9783936338393. [Google Scholar] [CrossRef]
  36. Cáceres, M.; Firman, A.; Montes-Romero, J.; González Mayans, A.R.; Vera, L.H.; F Fernández, E.; de la Casa Higueras, J. Low-Cost I–V Tracer for PV Modules under Real Operating Conditions. Energies 2020, 13, 4320. [Google Scholar] [CrossRef]
  37. Pordis, LLC. String-Level I-V Curve Tracer Specification Sheet. Available online: http://www.pordis.com/ (accessed on 17 March 2021).
  38. Walters, J.; Seigneur, H.; Schneller, E.; Matam, M.; Hopwood, M. Experimental Methods to Replicate Power Loss of PV Modules in the Field for the Purpose of Fault Detection Algorithm Development. In Proceedings of the 2019 IEEE 46th Photovoltaic Specialists Conference (PVSC), Chicago, IL, USA, 16–21 June 2019; pp. 1410–1413. [Google Scholar] [CrossRef]
  39. Buerhop-Lutz, C.; Pickel, T.; Denz, J.; Doll, B.; Hauch, J.; Brabec, C. Analysis of Digitized PV-Module/System Data for Failure Diagnosis. In Proceedings of the EU PVSEC 2019 Conference, Marseille, France, 9–13 September 2019; pp. 1336–1341. [Google Scholar]
  40. Bishop, J. Computer simulation of the effects of electrical mismatches in photovoltaic cell interconnection circuits. Sol. Cells 1988, 25, 73–89. [Google Scholar] [CrossRef]
  41. Akkaya, I.; Andrychowicz, M.; Chociej, M.; Litwin, M.; McGrew, B.; Petron, A.; Paino, A.; Plappert, M.; Powell, G.; Ribas, R.; et al. Solving rubik’s cube with a robot hand. arXiv 2019, arXiv:1910.07113. [Google Scholar]
  42. Grzeszczuk, R.; Terzopoulos, D.; Hinton, G.E. Fast neural network emulation of dynamical systems for computer animation. Adv. Neural Inf. Process. Syst. 1998, 11, 882–888. [Google Scholar]
  43. Tompson, J.; Schlachter, K.; Sprechmann, P.; Perlin, K. Accelerating eulerian fluid simulation with convolutional networks. In Proceedings of the International Conference on Machine Learning, PMLR, Sydney, NSW, Australia, 6–11 August 2017; pp. 3424–3433. [Google Scholar]
  44. Chunlai, L.; Xianshuang, Z. A survey of online fault diagnosis for PV module based on BP neural network. In Proceedings of the 2016 International Conference on Smart City and Systems Engineering (ICSCSE), Hunan, China, 25–26 November 2016; pp. 483–486. [Google Scholar]
  45. Garoudja, E.; Chouder, A.; Kara, K.; Silvestre, S. An enhanced machine learning based approach for failures detection and diagnosis of PV systems. Energy Convers. Manag. 2017, 151, 496–513. [Google Scholar] [CrossRef] [Green Version]
  46. Mendoza, H.; Hopwood, M.; Gunda, T. pvOps: Improving operational assessments through data fusion. In Proceedings of the 2021 IEEE 48th Photovoltaic Specialists Conference (PVSC), Virtual, 20–25 June 2021; pp. 0112–0119. [Google Scholar]
  47. Holmgren, W.F.; Hansen, C.W.; Mikofski, M.A. pvlib python: A python package for modeling solar energy systems. J. Open Source Softw. 2018, 3, 884. [Google Scholar] [CrossRef] [Green Version]
  48. Mikofski, M.; Meyers, B.; Chaudhari, C. PVMismatch Project; SunPower Corporation: Richmond, CA, USA, 2018. [Google Scholar]
  49. CEC DB PVLib. Module-Level CEC Database Hosted on PVLib. Available online: https://github.com/pvlib/pvlib-python (accessed on 17 March 2021).
  50. McKay, M.D.; Beckman, R.J.; Conover, W.J. A comparison of three methods for selecting values of input variables in the analysis of output from a computer code. Technometrics 2000, 42, 55–61. [Google Scholar] [CrossRef]
  51. ISO/IEC TR 29110-1:2016; Photovoltaic System Performance—Part 1: Monitoring. International Electrotechnical Commission: Geneva, Switzerland, 2017.
  52. Kingma, D.P.; Ba, J. Adam: A method for stochastic optimization. arXiv 2014, arXiv:1412.6980. [Google Scholar]
Figure 1. PV plant block diagram displaying potential failure locations.
Energies 15 05085 g001
Figure 2. A failure classification pipeline is postulated where simulated data is utilized for training a model. With this trained model, measured curves can be classified in a production setting. Using simulated data allows the augmentation of data representing rare failures, which are not often present in measured data.
Energies 15 05085 g002
Figure 3. Four features are passed into the neural network (i.e., current, power, current difference, and finite difference), all of which are plotted here against voltage (except power). The normalized current on the top plot clearly shows the partial soiling signal (in red). Similarly, the finite difference represents the derivative of the current with respect to voltage; the plot (middle plot) clearly shows the partial soiling signal. The current differential (bottom plot) calculates the difference between the current from an unstressed simulation and the sample, providing a signal that helps discriminate between the cell cracking and unstressed signals. The data visualized here comes from string-level IV curves from the Florida Solar Energy Center (FSEC), which has known faults applied (see data description in Section 2.3).
Energies 15 05085 g003
Figure 4. A heatmap of the difference in normalized current of a simulated unstressed curve (at the measured curve’s environmental conditions) and a measured curve displays profiles consistent with knowledge of the failure.
Energies 15 05085 g004
Figure 5. The flexibility of the IV simulation is displayed in a heatmap showing the different IV profiles across a spectrum of failure definitions. The test’s names on the vertical axis represent the magnitude of the impact on the diode parameter. The horizontal axis contains the normalized voltage domain. The color bar contains the difference between a pristine IV curve’s current and the failure IV curve’s current.
Energies 15 05085 g005
Figure 6. Module-level and string-level IV curves display a random failure, capturing the flexibility of the simulation framework.
Energies 15 05085 g006
Figure 7. A comparison of the module-level partial soiling across multiple cell-mapping configurations for simulated and measured IV curves shows close matching profiles.
Energies 15 05085 g007
Table 1. Module specifications under standard test conditions of modules in the FSEC dataset. These parameters describe the real system, which is collect measurements; however, the simulations also use these parameter specifications to more accurately characterize the system.
SymbolParameterValue
P m a x Maximum Power270 W
V m p p Maximum Power Voltage31.7 V
I m p p Maximum Power Current8.52 A
V o c Open Circuit Voltage38.8 V
I s c Short Circuit Current9.09 A
β V o c temperature coefficient−0.3%/ ° C
α I s c temperature coefficient0.06%/ ° C
θ Tilt Angle of system 30 °
ϕ Azimuth Angle of system (angle from North) 180 °
NNumber of cells connected in series60
A m Module Area1.64 m2
Table 2. Consistent classification results are found when using different measured, and simulated data splits. Seeing similar performance using simulated data as the training set provides validation that the simulations replicate the measured failures well. With this validation, future work will focus on including more failures in the classifier’s capabilities.
Training SetEvaluation SetAccuracy (%)Train SupportTest Support
MeasuredMeasured (test split)10028833
SimulatedSimulated1002457273
SimulatedMeasured (test split)100245733
SimulatedMeasured (all)95.92457321
Publisher’s Note: MDPI stays neutral with regard to jurisdictional claims in published maps and institutional affiliations.

