Article

Numerical Simulation of a Kaplan Prototype during Speed-No-Load Operation

by
Raluca Gabriela Iovănel
1,*,
Arash Soltani Dehkharqani
2 and
Michel Jose Cervantes
1
1
Division of Fluid and Experimental Mechanics, Luleå University of Technology, 971 87 Luleå, Sweden
2
R&D Engineer, Svenska Rotor Maskiner, Svarvarvägen 2, 132 38 Saltsjö-boo, Sweden
*
Author to whom correspondence should be addressed.
Energies 2022, 15(14), 5072; https://doi.org/10.3390/en15145072
Submission received: 15 June 2022 / Revised: 5 July 2022 / Accepted: 7 July 2022 / Published: 12 July 2022

Abstract

:
Hydropower plants often work in off-design conditions to regulate the power grid frequency. Frequent transient operation of hydraulic turbines leads to premature failure, fatigue and damage to the turbine components. The speed-no-load (SNL) operating condition is the last part of the start-up cycle and one of the most damaging operation conditions of hydraulic turbines. Hydraulic instabilities and high-stress pressure fluctuations occur due to the low flow rate and unsteady load on the runner blades. Numerical simulations can provide useful insight concerning the complex flow structures that develop inside hydraulic turbines during SNL operation. Together with experimental investigations, the numerical simulations can help diagnose failures and optimize the exploitation of hydraulic turbines. This paper introduces the numerical model of a full-scale 10 MW Kaplan turbine prototype operated at SNL. The geometry was obtained by scaling the geometry of the corresponding model turbine as the model and prototype are geometrically similar. The numerical model is simplified and designed to optimize the numerical precision and computational costs. The guide vane and runner domains are asymmetrical, the epoxy layer applied to two runner blades during the experimental measurements is not modelled and a constant runner blade clearance is employed. The unsteady simulation was performed using the SAS–SST turbulence model. The numerical results were validated with torque and pressure experimental data. The mean quantities obtained from the numerical simulation were in good agreement with the experiment. The mean pressure values were better captured on the pressure side of the runner blade compared to the suction side. However, the amplitude of the pressure fluctuations was more accurately predicted on the suction side of the runner blade. The amplitude of the torque fluctuations was considerably underestimated.

1. Introduction

The energy demand is steadily increasing together with the commitment to reduce global warming. In this sense, the exploitation of renewable energy resources such as solar, wave and wind power is heavily encouraged. However, to compensate for the intermittent character of renewable resources, the role of hydropower in regulating the power grid frequency is becoming as challenging and problematic as it is essential. Hydropower plants are now frequently working in off-design conditions to maintain the balance in the electrical grid. As the recurring transient operations of the hydropower plants become more frequent, hydraulic turbines experience early fatigue and damage.
Hydraulic turbines operate at a constant synchronous rotational speed. The main operating parameters are the net head and discharge. During a startup sequence, the guide vanes open progressively. Consequently, the flow rate increases, setting the runner in motion until it reaches the rated rotational speed. The speed-no-load (SNL) operating condition is the last part of the startup. At this stage, the turbine rotates at a synchronous speed, but the generator produces no electricity. The runner blade and guide vane angles are constant. The hydraulic efficiency is null.
Strongly stochastic recirculating flow, low-frequency pressure fluctuations and significant vibration characterize SNL operation. Such flows lead to premature wear of the hydraulic machines [1]. SNL operation is considered and has been proven to be the most dangerous operation of hydraulic turbines [2]. The turbine does not extract any energy from the fluid. Therefore, the fluid dissipates its energy mainly through turbulent recirculations in the runner and draft tube. However, studies demonstrated also the presence of coherent flow structures such as inter-blade vortices and rotating stall at SNL [3,4]. Experimental and numerical investigations have been performed to understand better the flow phenomena occurring at SNL and mitigate the damages caused by this operating regime.
The effects of SNL operation on radial–axial Francis turbines have been extensively studied, especially numerically [5,6,7] showing that standard two-equation turbulence models are limited in predicting the flow structures and pressure fluctuations that occur during SNL. The mean global parameters are reasonably captured with accuracy below 5% while the flow dynamics and the turbulent flow structures were not. Different turbulence models were employed, from the most robust k-epsilon [8] to the more complex Scale-Adaptive Simulation–Shear-Stress Transport (SAS-SST) turbulence model [2] and Large Eddy Simulation (LES) [9]. The SAS–SST model was recommended as a good compromise between the limitations of Reynolds-Averaged Navier-Stokes (RANS) turbulence models and the high mesh requirements of the LES model.
The SNL operation of pump-turbines was also investigated [10,11] showing that pumping flows develop in the runner blade channels and extend to the draft tube with pressure fluctuation amplitudes that can be 3.8 to 8 times larger compared to a full-load operation [12].
Concerning axial turbines, the studies focused on the SNL operation are sparse and present only a preliminary analysis of the flow field instability and structure [13,14]. One of the first detailed studies on the part-load and SNL flow dynamics in a model propeller turbine was carried out by Houde [15]. Numerical simulations were performed without including the runner blades in the computational domain thus showing that the formation of the rotating stall is linked to the unstable shear layer developed in the draft tube of the turbine and not to the runner blades themselves [15]. Another numerical investigation concerning the same model propeller turbine captured twin vortex structures rotating below the runner hub [16]. The authors showed that the twin structures are rotating at a smaller frequency than the runner rotational frequency leading to strog pressure fluctuations in the draft tube and runner.
A detailed experimental investigation of a Kaplan turbine prototype operated at SNL was presented by Soltani et al. [17]. Pressure and strain measurements were performed on a runner blade capturing low-frequency pulsations. Additionally, torsion strain measurements on the shaft showed peak-to-peak values 12 times larger than the corresponding values recorded at the best efficiency point.
There are a limited number of studies regarding the SNL operation of prototype turbines. In addition to the large flow scales and high Reynolds number, the main reason is that the complex flow phenomena are challenging to capture experimentally and numerically. The numerical simulations describe more flow details and can support experimental investigations in explaining and reducing SNL’s harmful effects on hydraulic machines. However, the complexity of the flow implies high computational demands and an extended simulation time. Therefore possible simplifications of the numerical model should be explored and implemented to attain a reasonable compromise between numerical accuracy, computational costs and time.
The present paper introduces the first numerical investigation of the flow in a full-scale 10 MW Kaplan turbine prototype operated at SNL. The objective is to develop a numerical model that correlates with experimental data provided by Soltani et al. [18]. Furthermore, the numerical model is simplified and designed to optimize the numerical precision and computational costs.

2. Experimental Data

The Porjus U9 Kaplan turbine prototype operates at the Porjus hydropower plant situated along the Lule River in the north of Sweden. The turbine includes a distributor, a runner with six blades and a draft tube. The distributor has 18 unequally distributed stay vanes and 20 equally spaced guide vanes. The Kaplan runner is installed approximately 7 m below the tailwater and has a rotational speed of 600 rpm. The runner diameter is D = 1.55 m and the draft tube length is about 11 m. The turbine’s rated net head and discharge are 55.5 m and 20 m3s−1, respectively. The output rated power of the Porjus U9 Kaplan prototype is 10 MW.
Pressure and torque measurements were performed by Soltani et al. [17] under different operating conditons. Miniature piezo-resistive pressure transducers (Kulite LL-080 series) were mounted on one runner blade; six transducers on each side of the blade. The sensors were installed on two rows at 1/3 and 2/3 of the blade’s span and 1/4, 1/2 and 3/4 of the blade’s chord lines. An epoxy layer was applied to make the pressure sensor flush with the runner blade surface. Therefore, the diametrically opposed blade was also covered with an epoxy layer to avoid a mass unbalance of the runner. The uncertainty of the pressure sensors ranged from 0.7% to 1.11%. Additionally, two torsion strain gauges (K-XY41-6/350-3-2M manufactured by HBM, Darmstadt, Germany) were mounted on the shaft with a 180° spacing. The maximum uncertainty of the torque measurements was 3.42%. Soltani [18] presents a detailed description of the experimental setup, methods, uncertainty, and results.
In this study, the experimentally investigated operating point SNL is selected, and the measurements are employed to validate the numerical simulation. The chosen operating point is characterized by a low discharge leading to low-frequency load fluctuations and stochastic flow structures. The guide vane angle, in this case, corresponds to approximately 9% of the maximum guide vane opening. The operating parameters are listed in Table 1.

3. Numerical Simulations Set-Up

3.1. Geometry

The computational domain used in the numerical simulations presented in this paper included the distributor (stay vanes and guide vanes), runner and draft tube (Figure 1). The Kaplan prototype geometry was obtained by scaling the turbine model geometry.
According to previous numerical studies concerning the part-load operation of the Porjus U9 prototype [19], the complete guide vane and runner domain were modelled to capture the complex flow structures developed during SNL operation. The distributor domain was built axisymmetric and comprised 20 similar stay vane and guide vane passages to simplify the geometry and mesh. In comparison, the actual prototype geometry includes 18 unequally spaced stay vanes. The runner domain was built similarly by multiplying a single runner blade passage six times. Transient rotor-stator interfaces were defined between the three domains to capture the transient fluctuations when switching from a stationary reference frame to a rotating reference frame and vice versa.
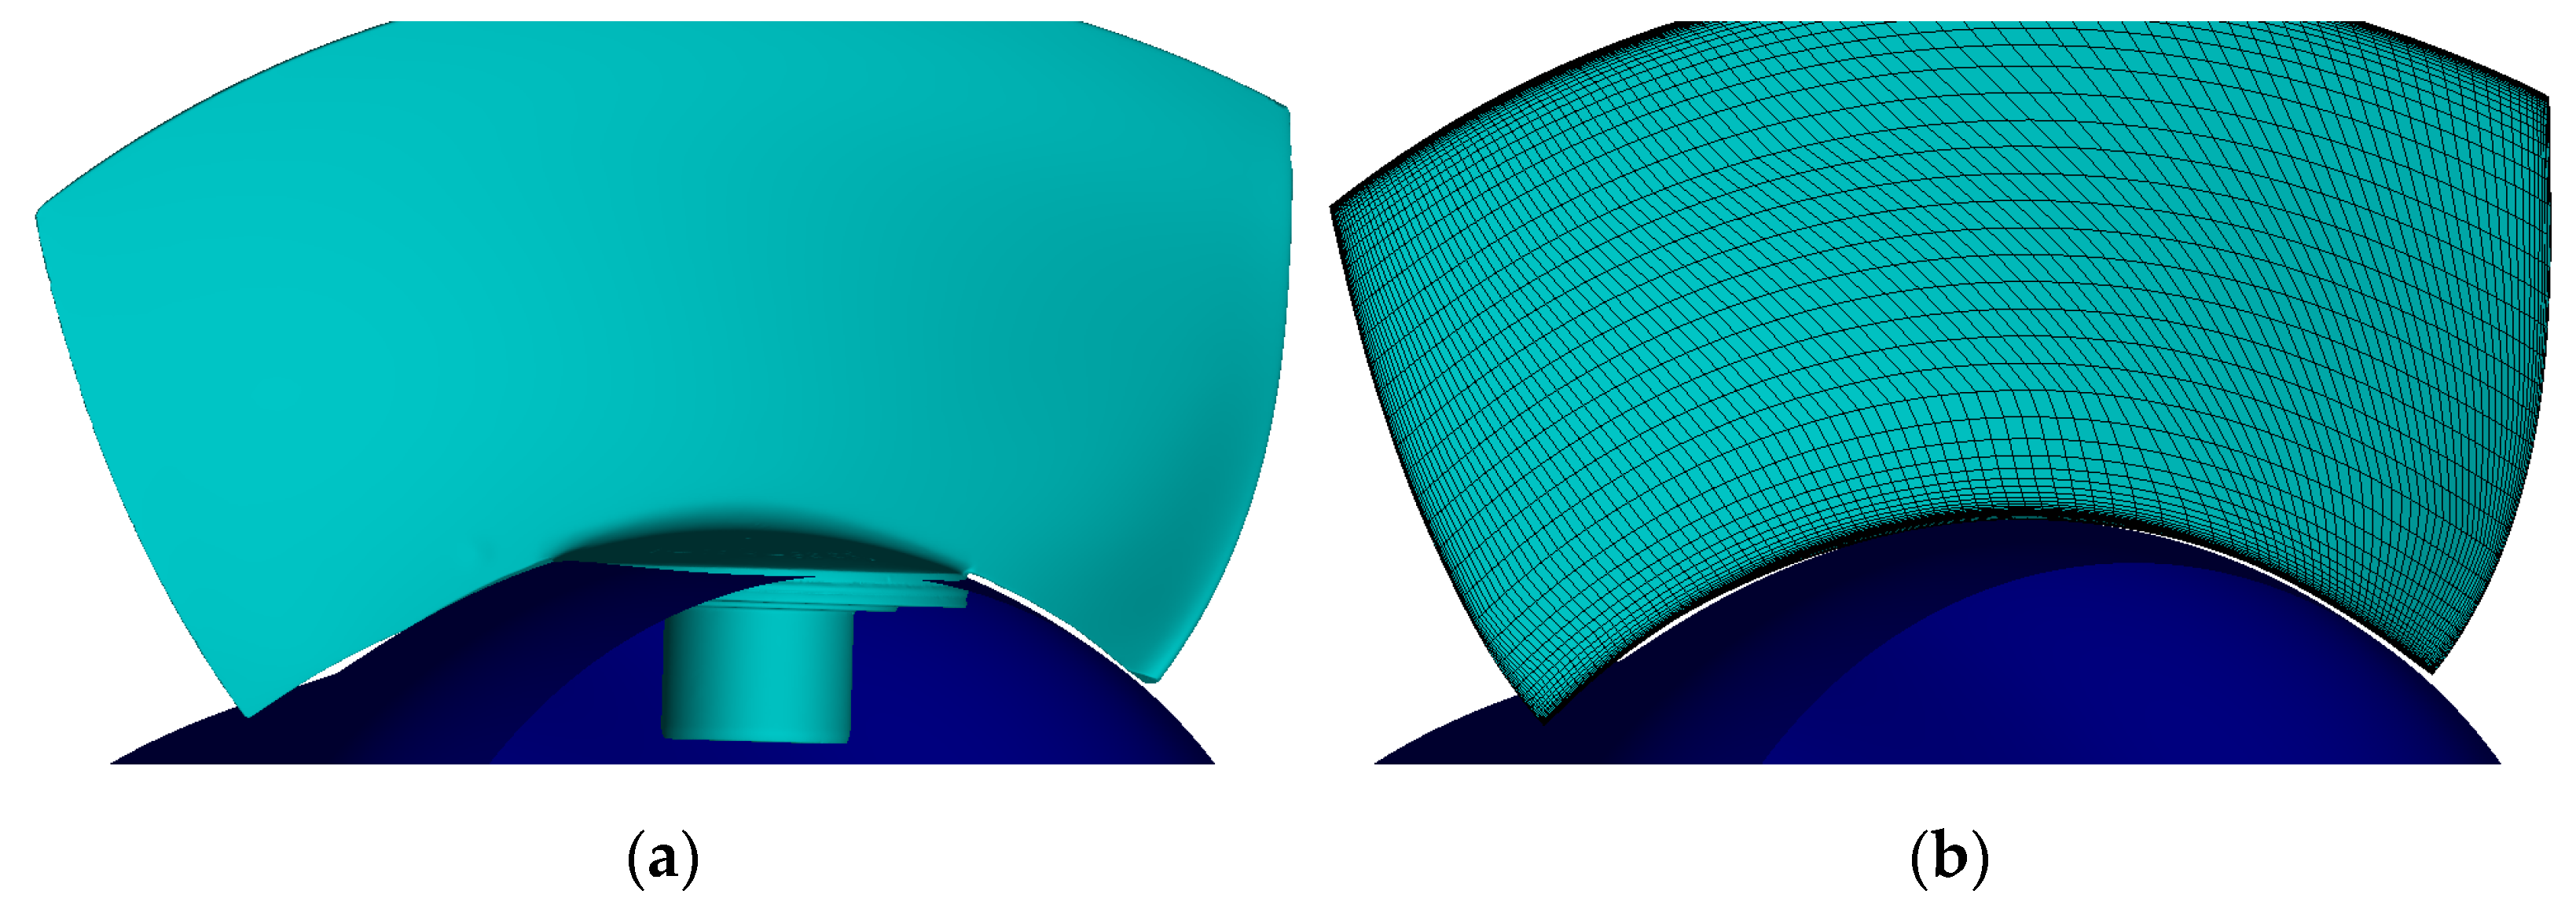
The numerical model did not include the epoxy layer added to the instrumented runner blades considering the previous study exploring modelling a prototype turbine [19]. The same work showed that the clearance size has a negligible influence on the numerical results when modelling large scale prototype turbines. Therefore, to model the flow through a Kaplan turbine prototype operated at the best efficiency point or part-load, modelling the runner blade clearances is not mandatory. However, the clearance flow may substantially influence both the downstream flow and the flow in the vaneless space at SNL because of the large recirculation region extending from the draft tube to the vaneless space [15]. Therefore, a constant clearance of 0.08% D and 0.05% D was defined at the hub and shroud, respectively, in the present study. The size of the clearances is chosen based on the approximate average of the actual clearance values measured on the scanned runner of the scaled turbine model. The variable hub clearance of the scanned model blade is presented in Figure 2a. The constant hub clearance built for the prototype blade is presented in Figure 2b.
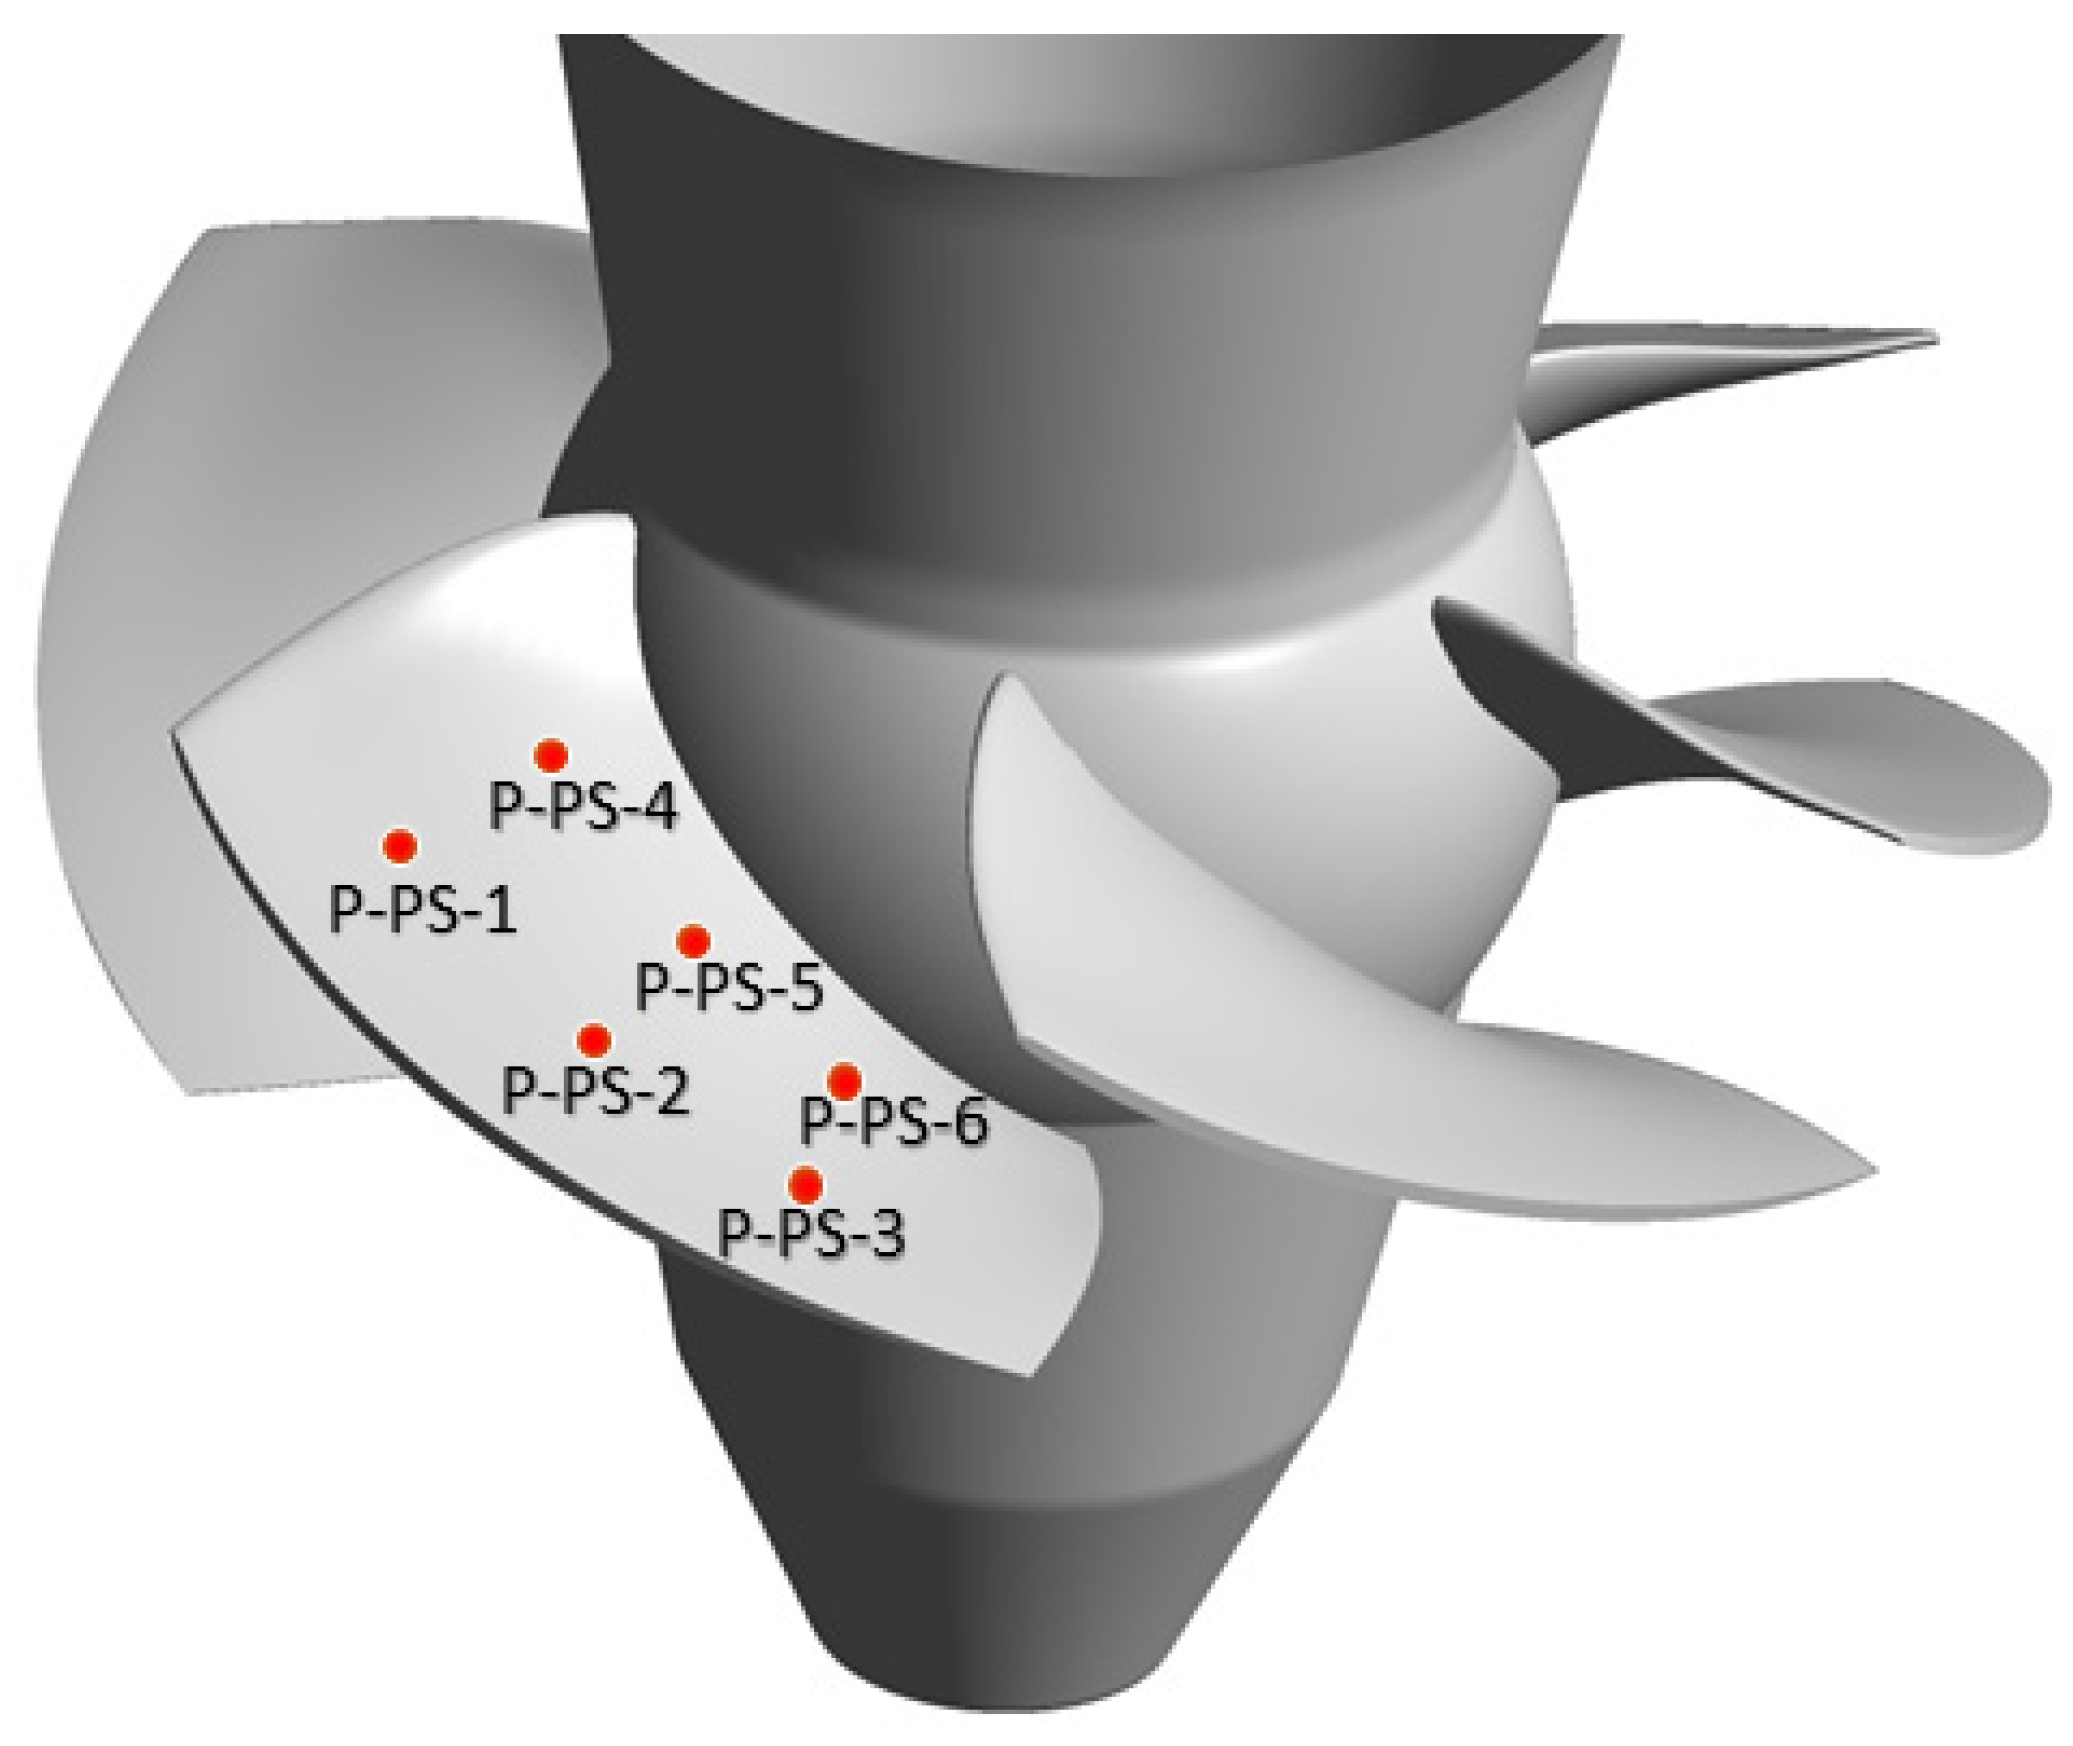
Twelve monitor points (P-PS-1 to P-PS-6 and P-SS-1 to P-SS-6) were defined on a runner blade to monitor the pressure variation, in a similar way to the experimental measurements [17], see Figure 3. Additionally, an identical configuration of monitor points was defined on the opposite runner blade for the simulation to investigate possible flow asymmetry reported by other authors [15,20].

3.2. Mesh

Hexahedral meshes were designed in ICEM v16.2 to discretize the guide vanes and draft tube domains. The hexahedral runner mesh was generated in Turbogrid v16.2, with the software optimized for blade passage discretization. Hexahedral elements are recommended as they can be better aligned to capture flow features and provide more accurate numerical results than tetrahedral elements. Additionally, the mesh size is considerably reduced when using hexahedral elements, a factor of 4 to 8 for a similar result, and consequently, the computational time is shorter. The refinement of the spatial discretization was chosen according to the mesh sensitivity studies carried out previously [19,21,22]. The numerical error was computed using the Richardson extrapolation. The influence of the runner mesh size on the torque value was less than 1%, while the draft tube discretization led to a 5% numerical error. The mesh quality parameters evaluated in Ansys CFX Solver are presented in Table 2 for each computational domain.
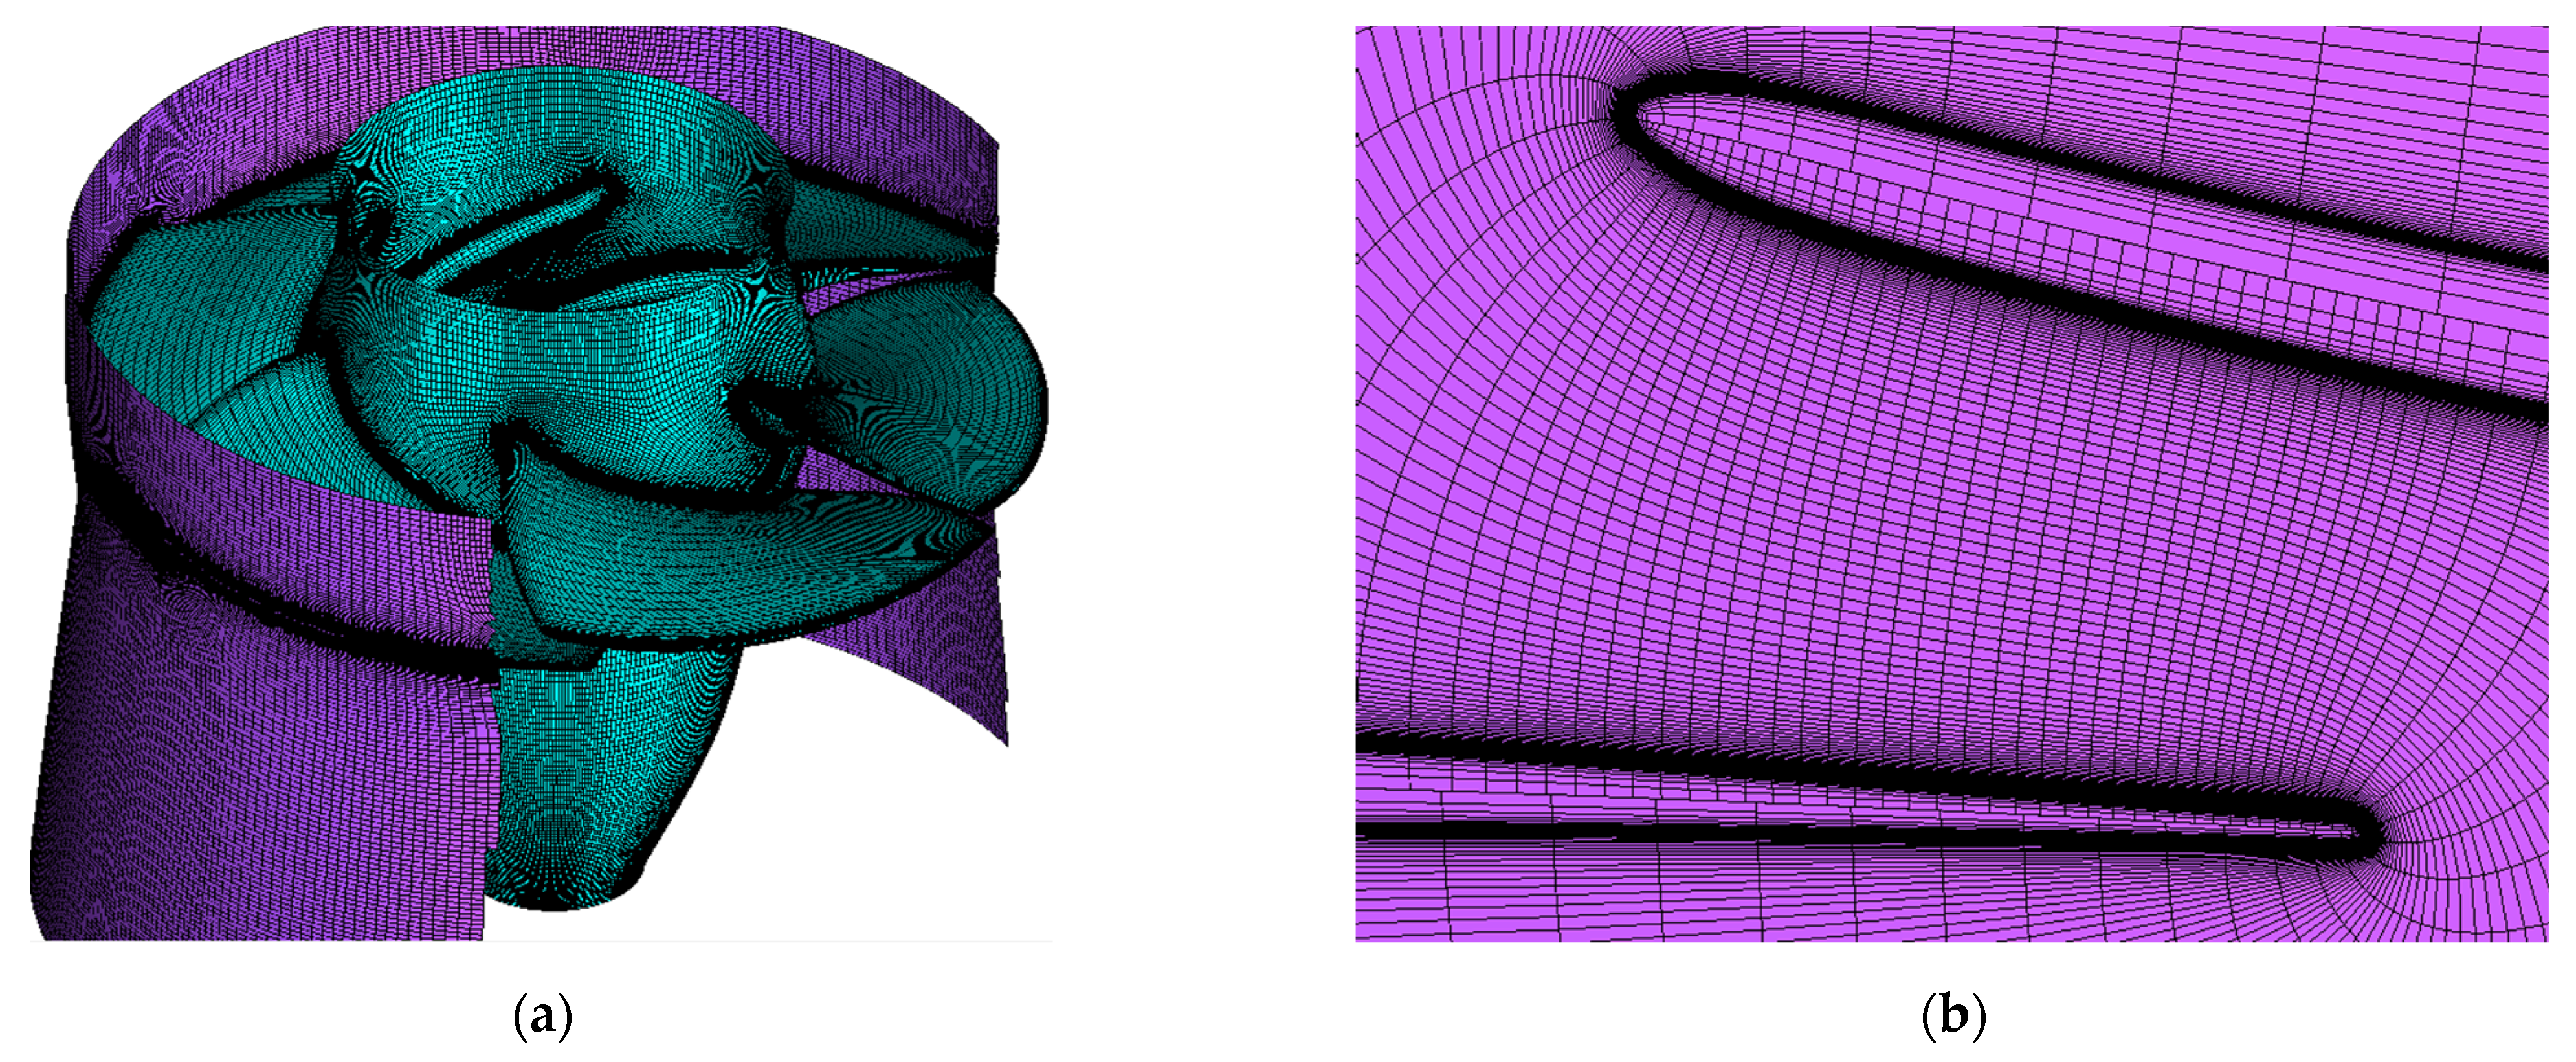
Figure 4 presents the discretization of the guide vanes and stay vanes and a detail of the boundary layer refinement near the leading and trailing edges of the guide vane (Figure 4b). Similarly, the runner discretization is presented in Figure 5. The average y+ value was kept below 30 on the guide vane and runner blade. The average y+ was 12.2 in the draft tube domain.
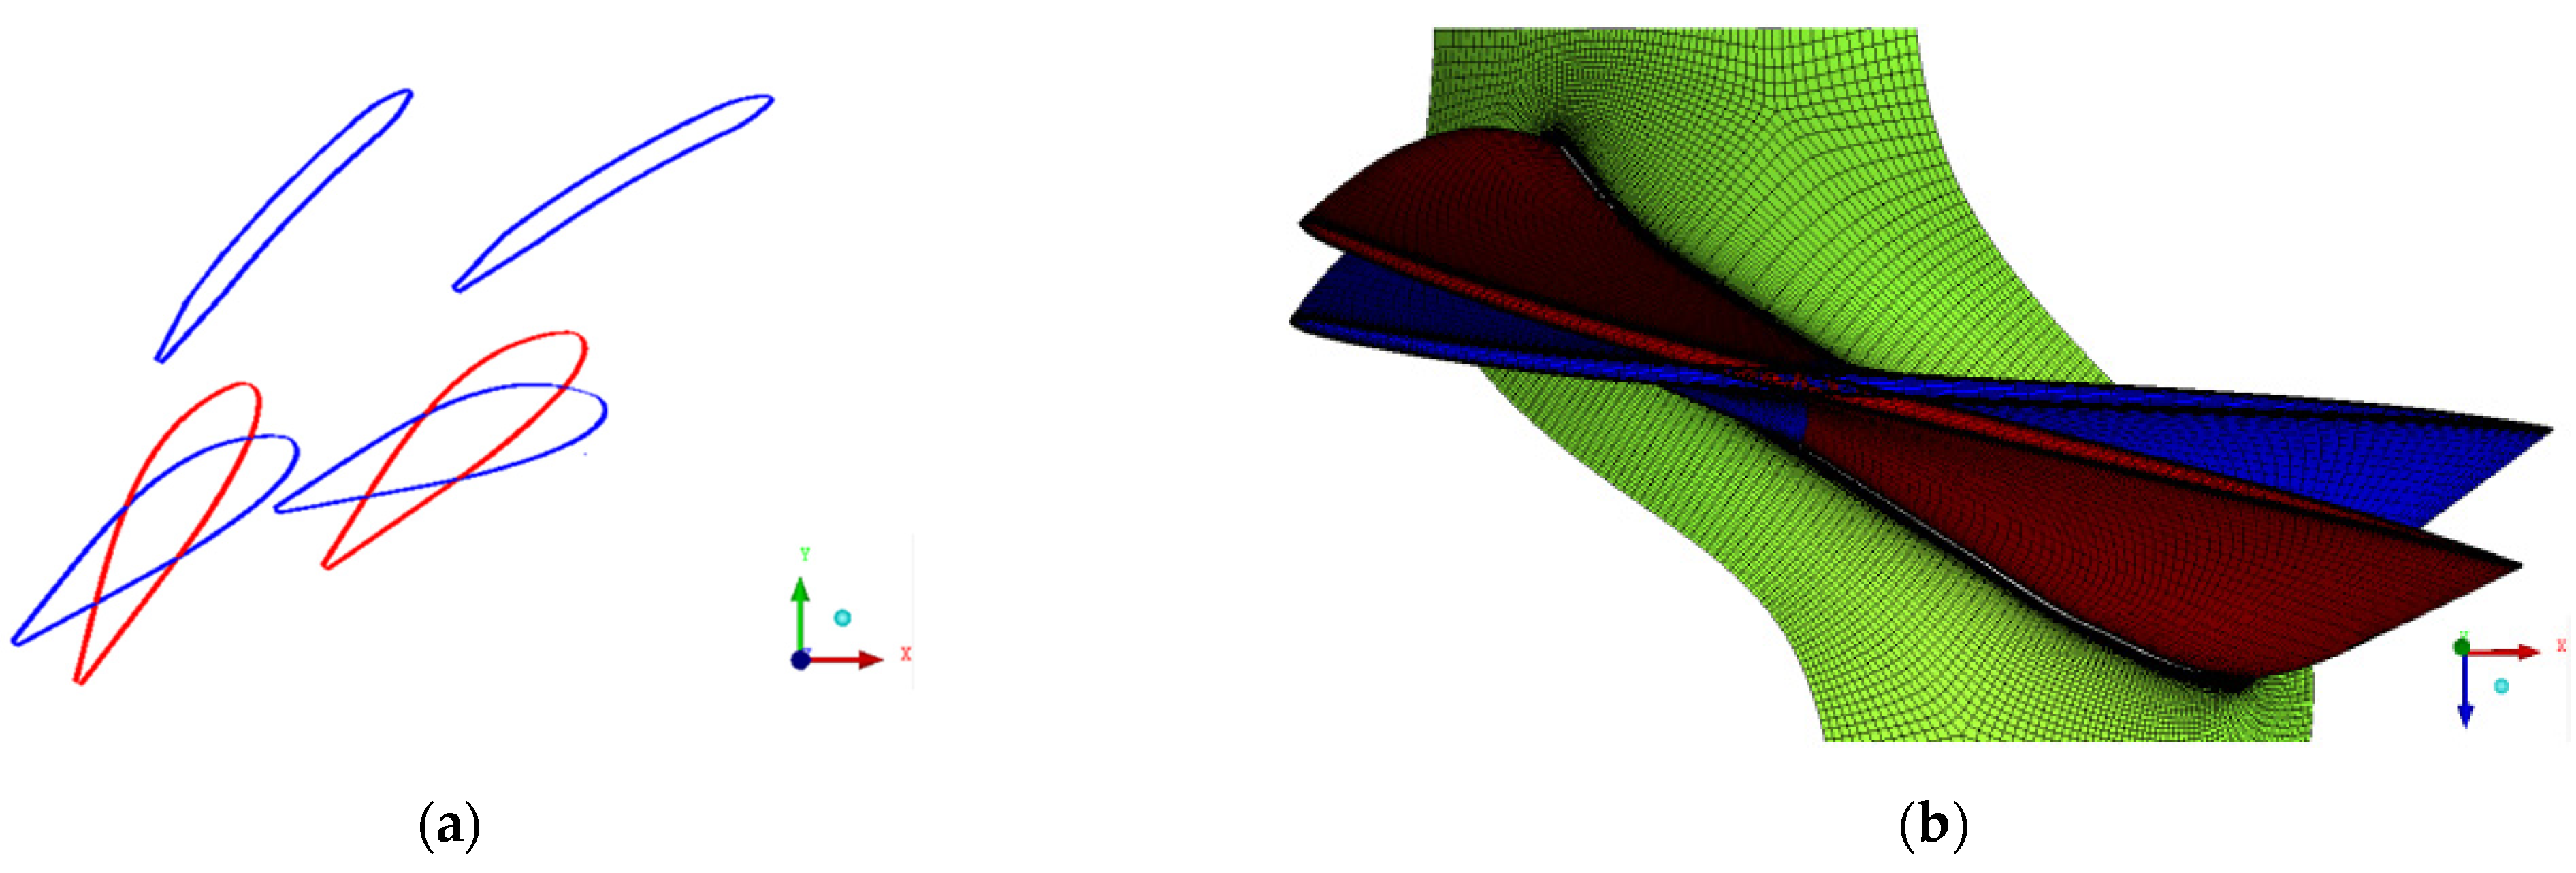
The slight guide vane angle at the SNL operation point creates a narrow flow channel, see Figure 4a and Figure 6a. Consequently, the guide vane domain’s mesh size must be considerably increasedcompared to the best efficiency and part-load simulations to maintain good values of the mesh quality parameters. Similarly, the runner mesh was tripled in size compared to the best efficiency point simulations as the small blade angle also leads to a narrow flow channel; see Figure 5b and Figure 6b. Additionally, the modelling of the runner blade clearances was included.
Given the geometrical and physical complexity of SNL simulation, the complete numerical model used in this study contained 19.72 million elements. The unsteady simulation ran for 45 runner rotations during approximately 49 days on four identical computers with 94 cores. Further refining the mesh was prohibited by the limited computational power. However, extensive mesh studies showed that the deviation in numerical pressure values could be less than 4% from coarse to fine discretization [23].

3.3. Boundary Conditions

The inlet of the computational domain was modelled as an opening to allow backflow. A total pressure of 695 kPa was prescribed for the inlet boundary condition. This value was obtained by subtracting the pressure losses that occur upstream from the inlet of the stay vanes from the gross head of the prototype turbine. A steady-state simulation was previously carried out to estimate the pressure losses in the penstock and spiral casing of the prototype turbine [19]. The static pressure difference between the inlet of the stay vanes and the outlet of the draft tube was also subtracted from the gross head.
The outlet of the computational domain was also modelled as an opening considering a static pressure of 218 kPa, similar to the experimental measurements.
The runner was defined as a rotating domain and the angular velocity was set as 600 rpm. The runner hub and shroud and the draft tube were defined as no slip walls. The experimental parameters used as boundary conditions in the simulation are presented in Table 3.

3.4. Flow Modelling and Numerical Setup

The numerical results presented in the following sections were obtained from an unsteady simulation performed with the Ansys CFX Solver v20.2. A steady-state simulation was first performed to provide the initial conditions. In the steady-state simulation, the k-epsilon turbulence model was used, the advection scheme was set as Upwind, and cavitation was modelled using the Rayleigh–Plesset model [24].
The SAS–SST turbulence model [2,25,26] was employed in the unsteady simulation. The SAS–SST turbulence model is recommended to capture strong flow instabilities. When modelling highly unsteady flow regions, the modelled dissipation rate is controlled and adapted to employ LES-like capabilities.
The time step size was set to one degree of the runner rotation (2.78 × 10⁻⁴ s). The time step value was selected according to previous studies on the influence of the time step size on the numerical accuracy [21,27] that recommended time steps corresponding to a runner rotation of 0.5–5°. The time derivative was discretized using the Second Order Backward Euler transient scheme. The advection term was computed using the Upwind discretization scheme. The turbulence kinetic energy and eddy frequency equations were modelled using the Upwind scheme for the advection term and the First Order Backward Euler transient scheme.
The unsteady simulation was considered converged when the value of the root-mean-square (RMS) solution differences obtained for each solved equation was less than 10−4. The unsteady simulation was carried out for approximately 45 runner rotations after reaching convergence.
In the attempt to reduce the computational time, using a single stay vane–guide vane passage and a single runner blade passage was first tested. Unfortunately, the steady-state simulation crashed after only a few iterations. The second unsuccessful attempt employed the same computational domain (a single stay vane–guide vane passage and a single runner blade passage) in an unsteady simulation. Such a setup failed as the flow is asymmetrical at the guide vanes. Furthermore, adding the cavitational model to the numerical setup did not bring any improvements at this stage.
The same attempts were made using a single stay vane–guide vane passage and the complete runner (six runner blades). It was concluded that the complete stay vane–guide vane passage and the runner is mandatory despite the considerable duration of one numerical simulation.

4. Results

The pressure values presented in the following sections are normalized with the reference pressure value recorded in the turbine chamber before filling the waterway [17].

4.1. Mean Quantities

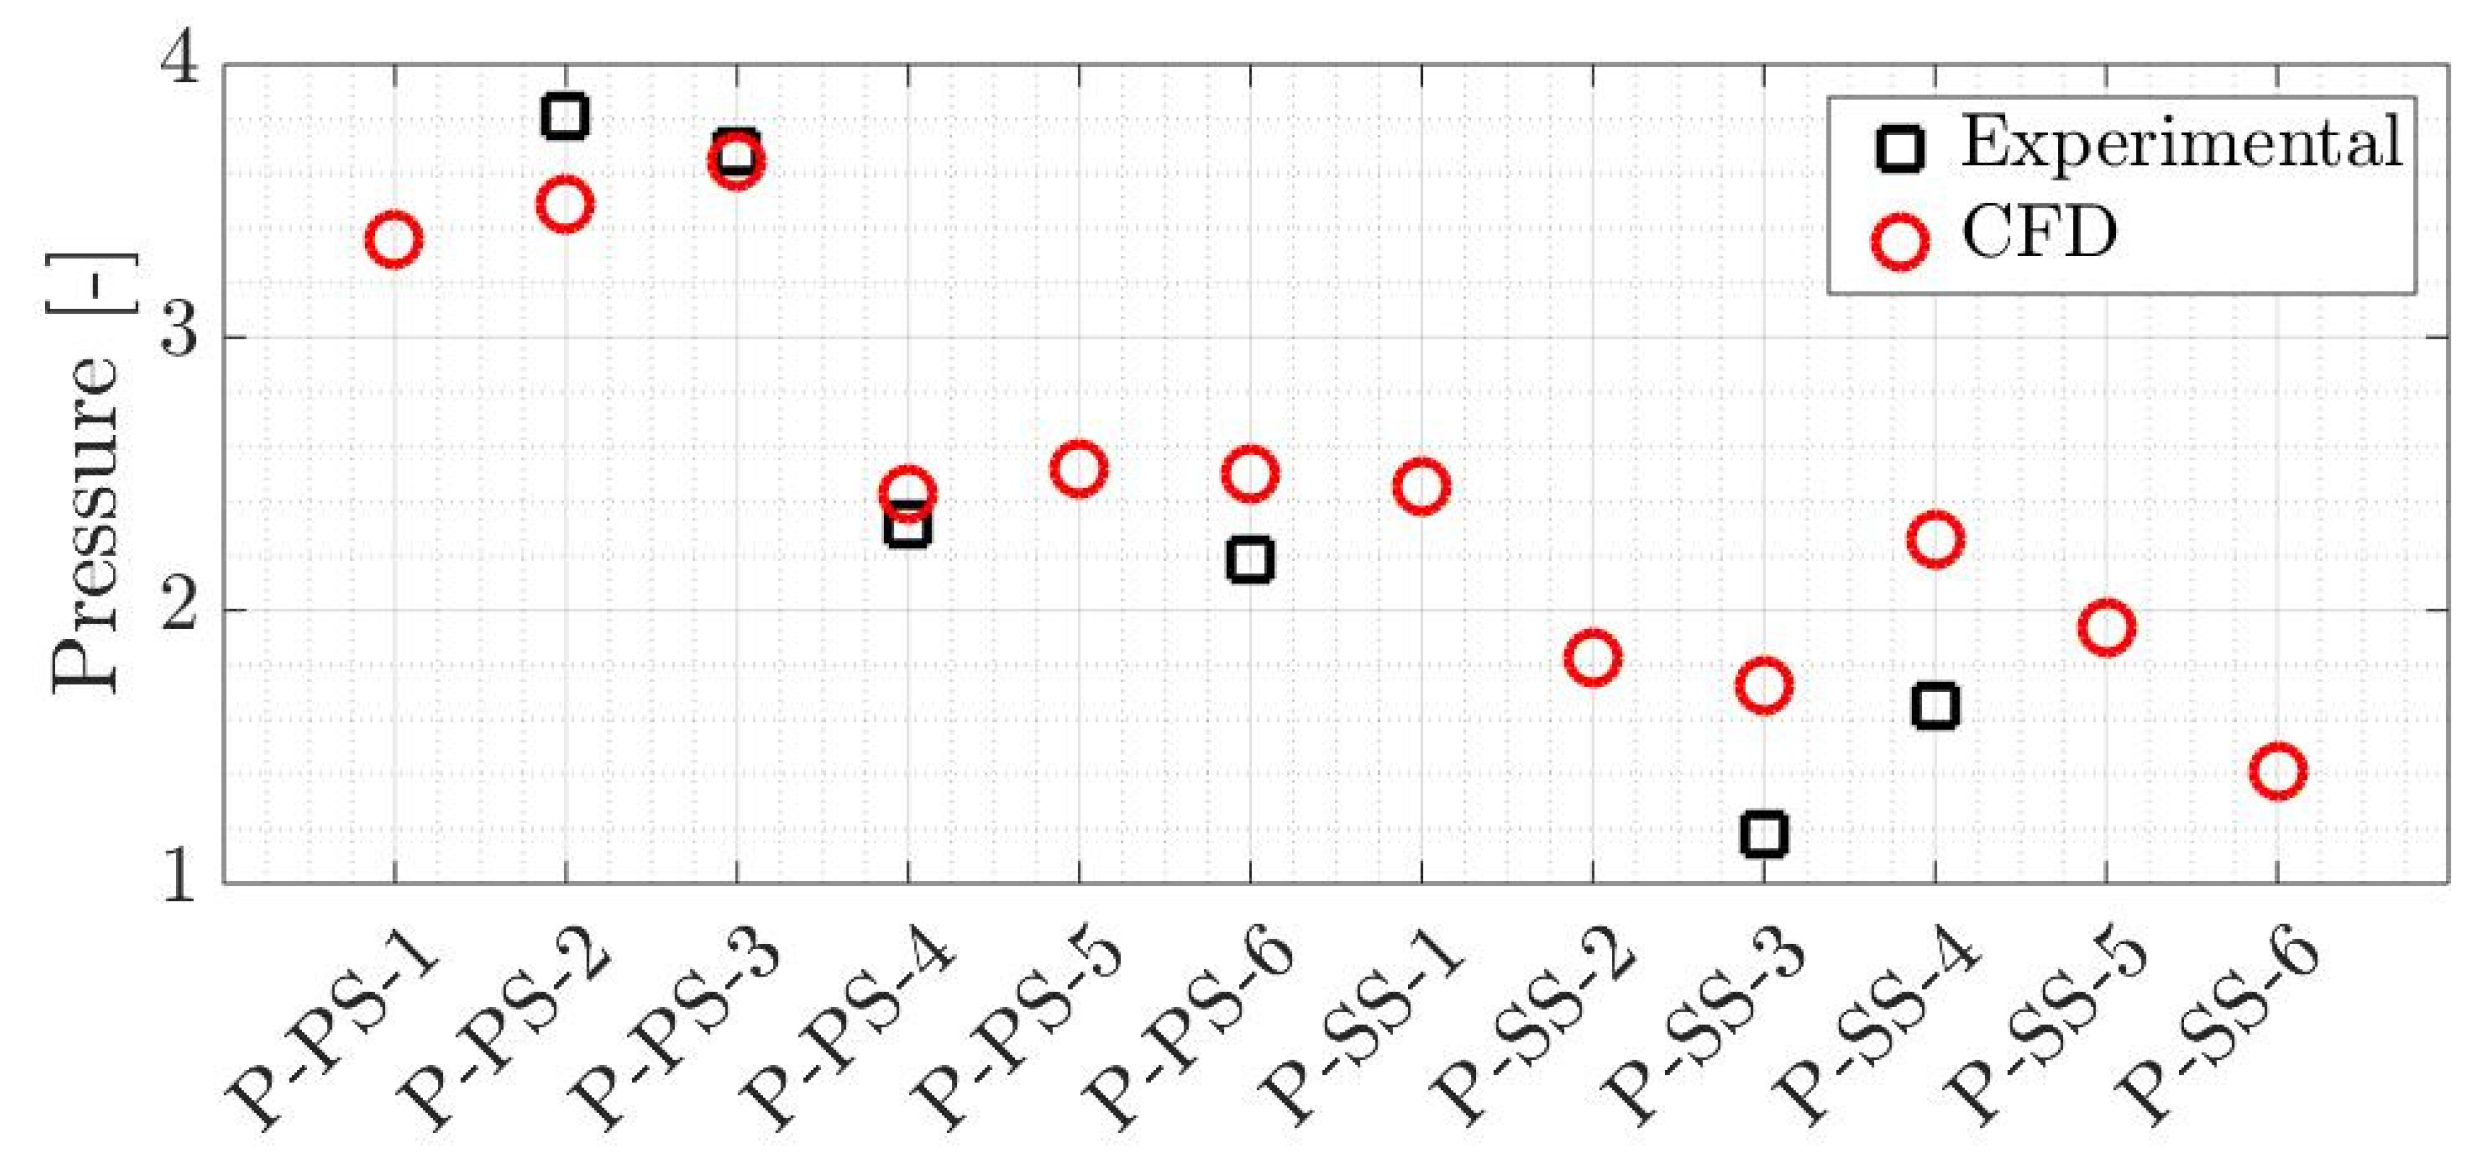
Figure 7 presents the scaled mean absolute pressure values obtained from the unsteady numerical simulation and the experiment at the locations presented in Figure 3. The mean pressure values are synthesised in Table 4. The numerical results are reasonably similar to the experimental values and show a good prediction of the pressure on the pressure side of the runner blade (P-PS). The deviation is 1 to 8.5% in the numerical results (Table 4), with the exception P-PS-6 location, where the mean pressure is overestimated in the numerical simulation by 14.6%. However, the numerical pressure monitored at the periphery of the runner (P-PS-1 to P-PS-3) increases slightly from the leading edge to the trailing edge as opposed to the experimental pressure values decreasing towards the trailing edge. Closer to the runner hub (P-PS-4 to P-PS-6), the numerical pressure is quasi-constant, while the experimental values maintain a decreasing trend towards the trailing edge. Considering the sizeable negative blade angle at SNL, see Figure 6, a quasi-constant pressure distribution is expected near the shroud of the runner, and the pressure is expected to decrease slightly closer to the runner hub. This suggests that there could be a minor difference between the runner blade angle used in the simulation and the experimental runner blade angle.
The numerical simulation overestimates the pressure on the suction side of the runner blade along the entire blade span (P-SS-4 and P-SS-3) by 37–46% (Table 4). Similar differences were obtained when simulating the part-load and best efficiency operation [19], showing that the flow behavior on the suction side of the runner blade is challenging to capture numerically, regardless of the operating conditions. The overestimation of the numerical pressure values can also be related to the larger size of the pressure sensors used in the experiment compared to the monitor points defined in the simulations [15].
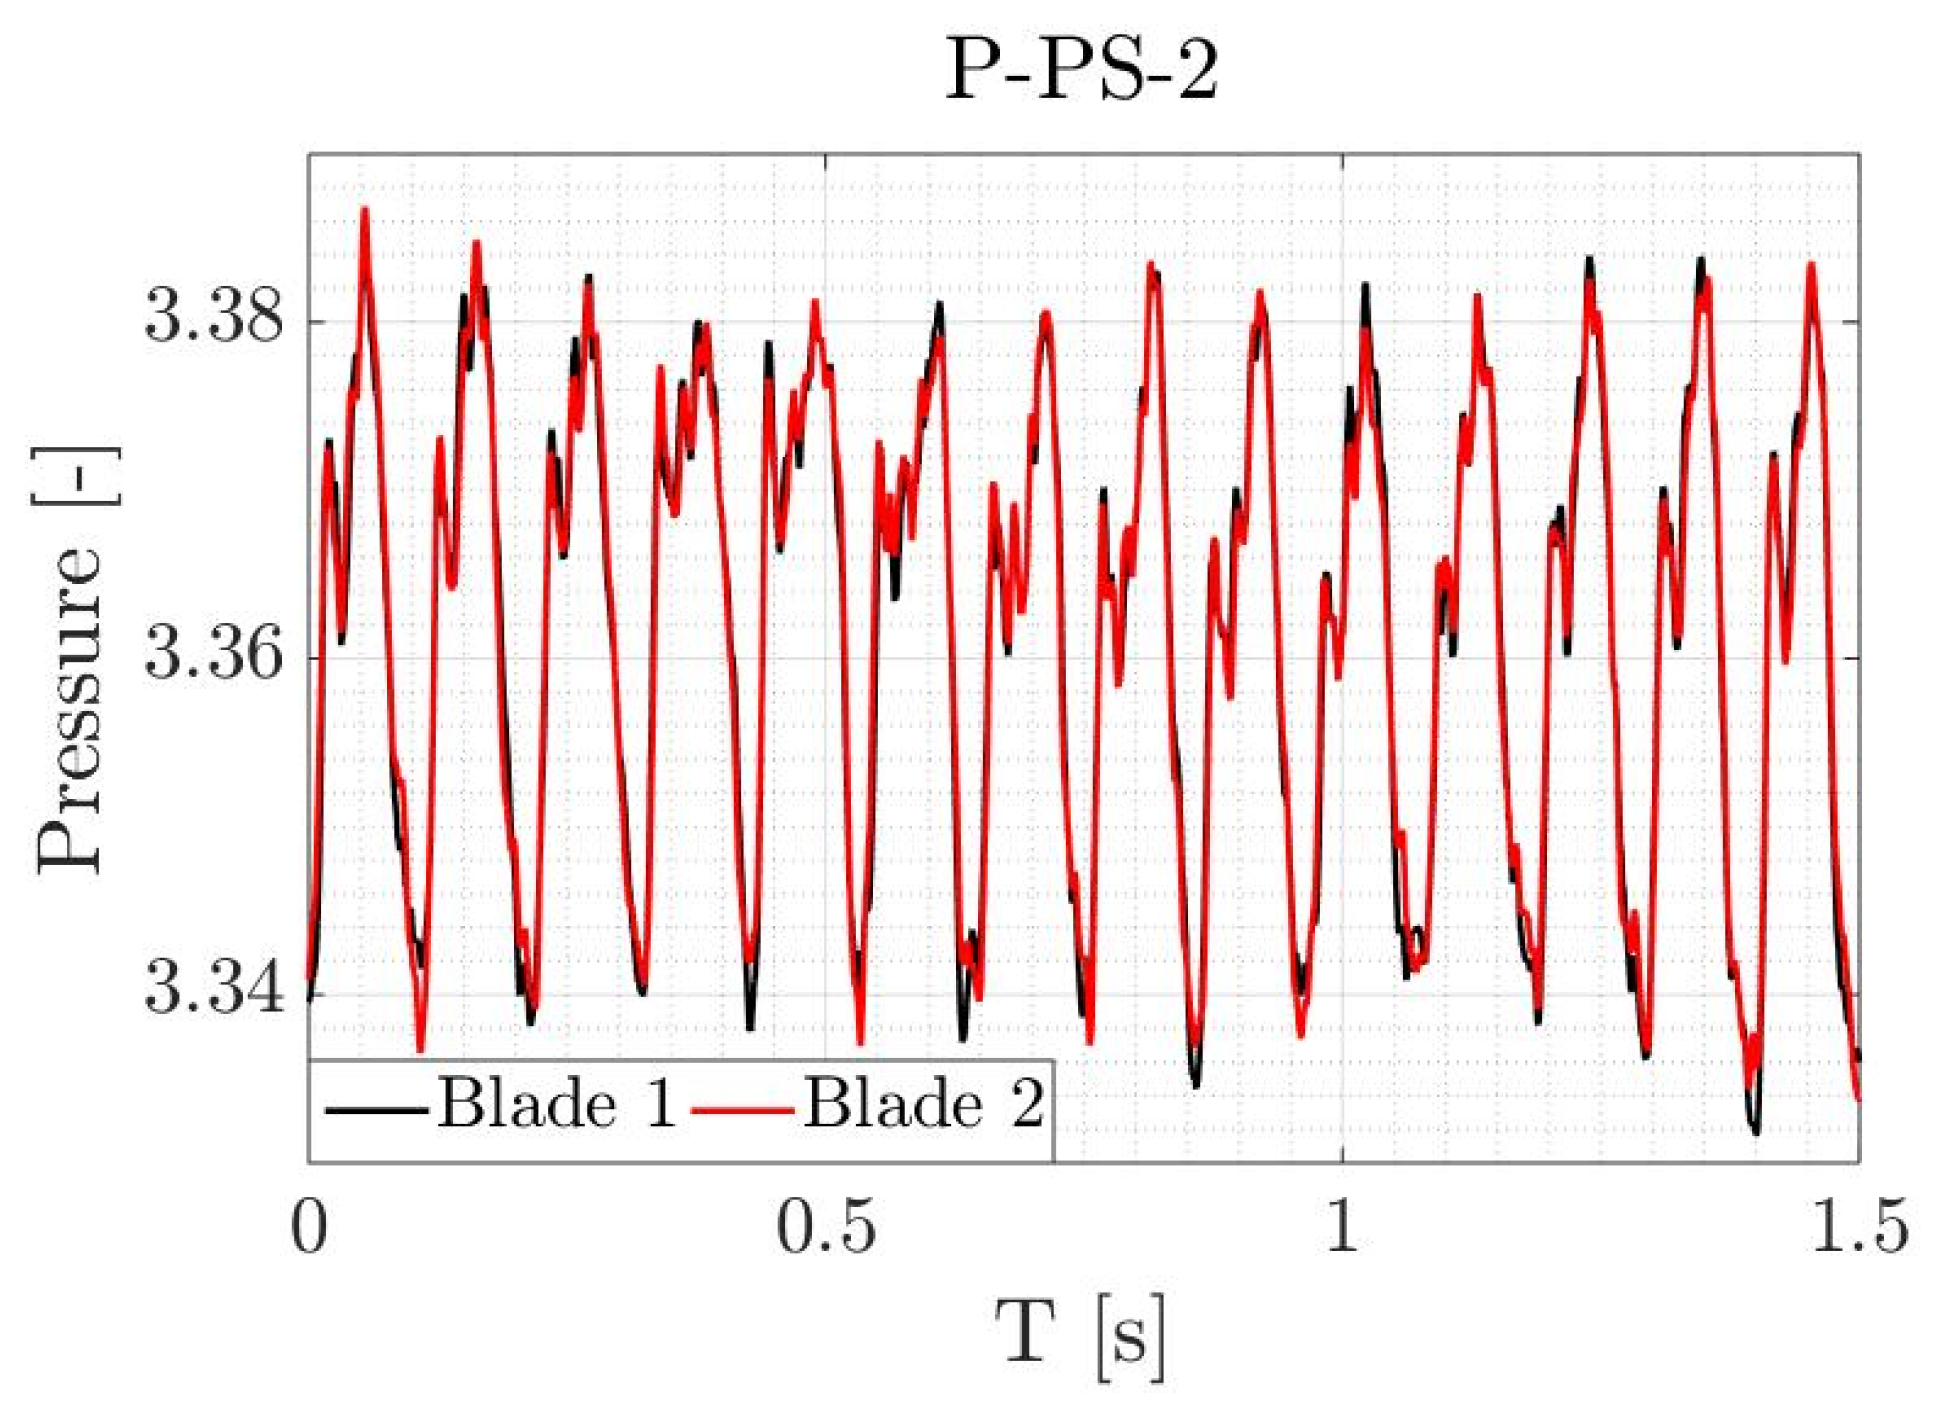
Figure 8 presents the absolute pressure recorded during the numerical simulation by two monitor points located on the pressure side (P-PS-2) of two opposite runner blades. Although the upstream guide vane and runner domains are axisymmetric, the pressure fluctuations monitored on the runner blades are not identical. However, the differences are minimal, and the axial symmetry of the flow in the runner domain is confirmed by the pressure contour plot presented in Figure 9. The minor differences in the pressure distribution on and around each runner blade are most likely due to turbulent fluctuations. No inter-blade vortices were captured in this prototype numerical simulation, as opposed to Houde’s observations on a model propeller turbine [15].
The numerical mean torque value obtained from the simulation was 1856.7 N, corresponding to 0.12 MW or 1.2% of the nominal power output. The bearing and ventilation losses were measured for Porjus U9. The energy lost in the bearings ranged between 1–1.5% of the nominal power output.

4.2. Frequency Analysis

The length of the numerical signal selected for the frequency analysis corresponded to 45 runner rotations. The mean value was subtracted from the numerical and the experimental signals to calculate and compare their amplitude spectra. Next, the pressure results were scaled by the reference pressure. Finally, the runner frequency (fr) normalized all the frequency values.
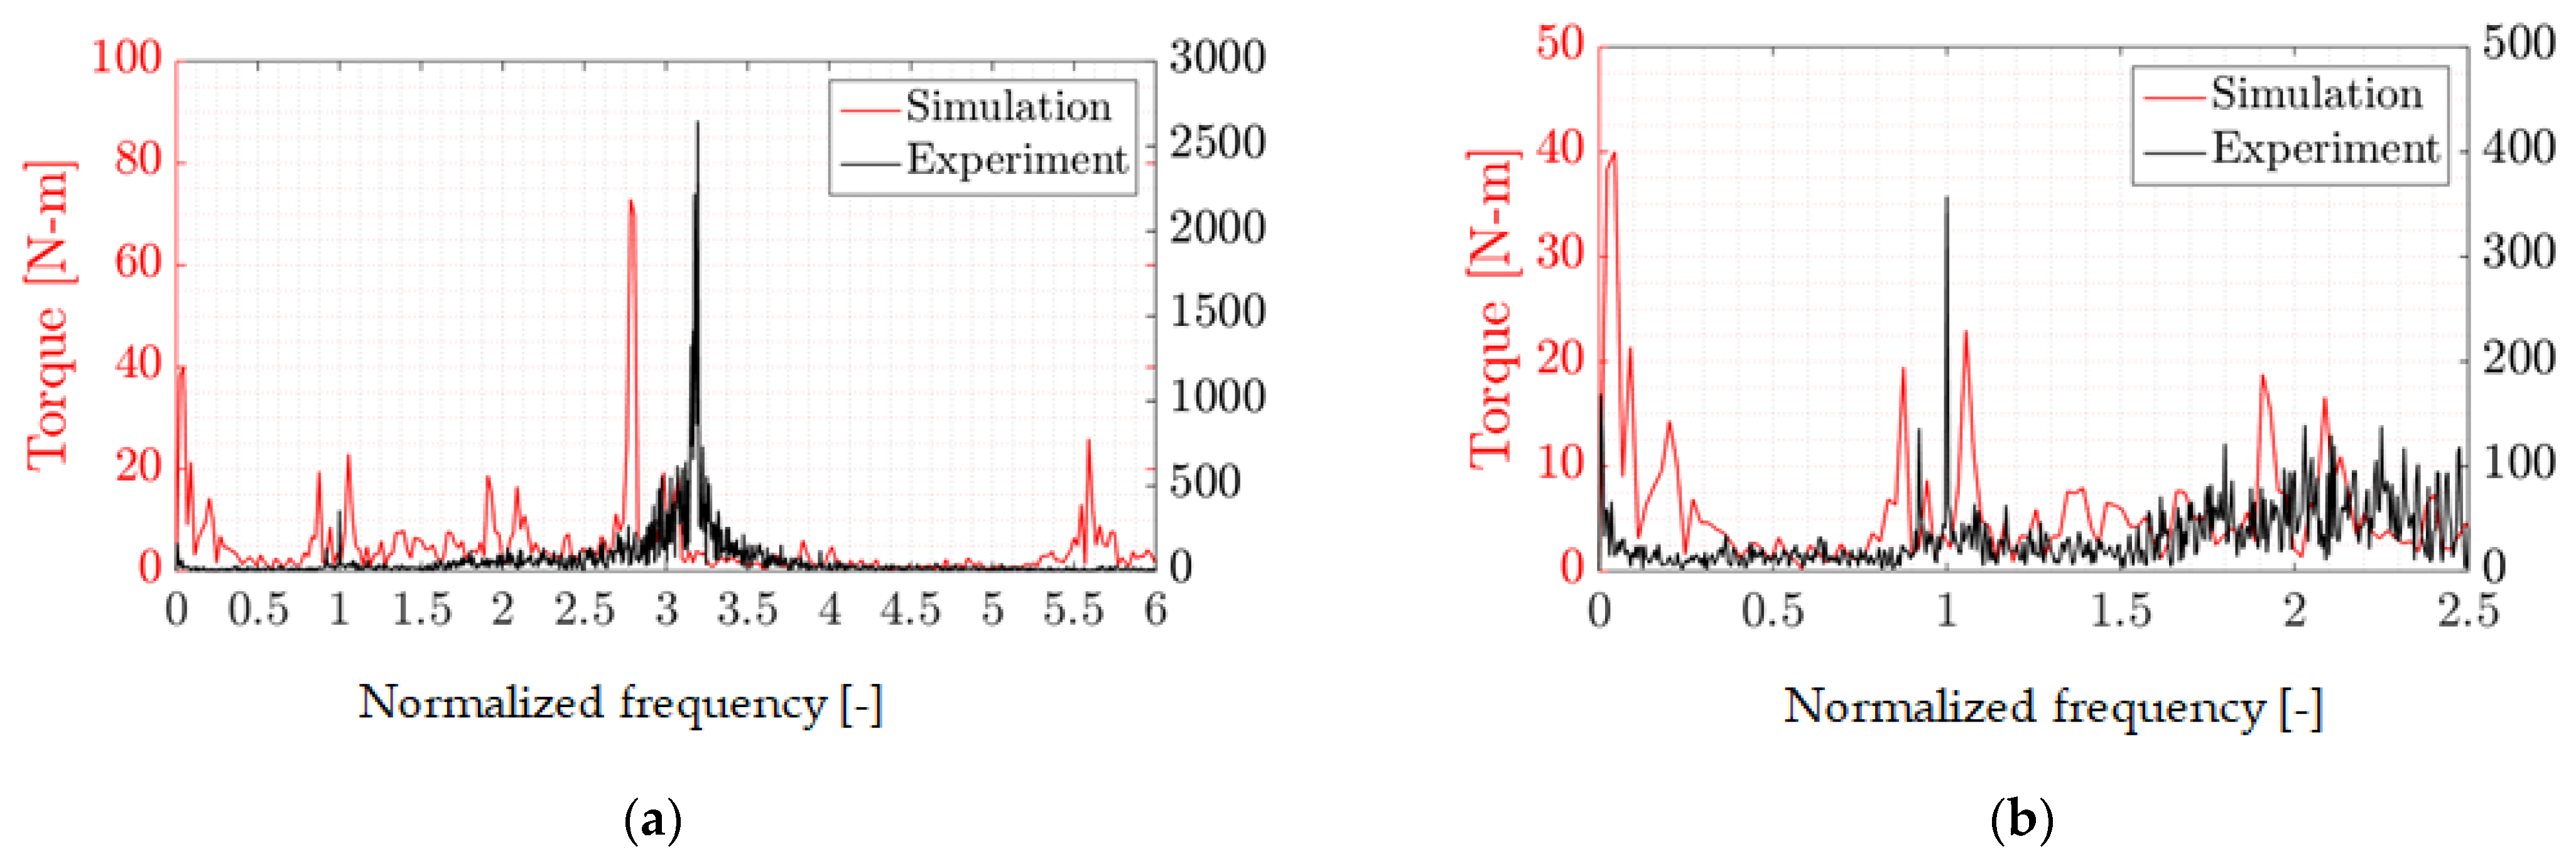
Figure 10 presents the amplitude spectrum of the numerical and experimental torque values. A factor of approximately 30 is obtained between the amplitudes of the two signals when considering the largest frequency peak, Figure 10a. The numerical simulation is strongly underestimating the torque fluctuations. The measurements capture two frequency peaks at the dimensionless frequency (f*) of 0.92 and 1, whereas in the numerical simulation, these peaks are found at f* = 0.88 and f* = 1.06 (Figure 10b). A third peak is visible in the analysis of the experimental torque signal, at f* = 3.2. A similar peak (f* = 3.16) was also present in the experimental investigation carried out at best efficiency operation but not visible in the numerical results [19]. For this reason, the f* = 3.16 peak was considered a shaft torsional natural frequency. However, as opposed to the numerical simulation performed at the best efficiency point, in the SNL numerical results, a at f* = 2.78 is captured, most likely corresponding to the f* = 3.2 seen in the spectrum of the experimental torque signal.
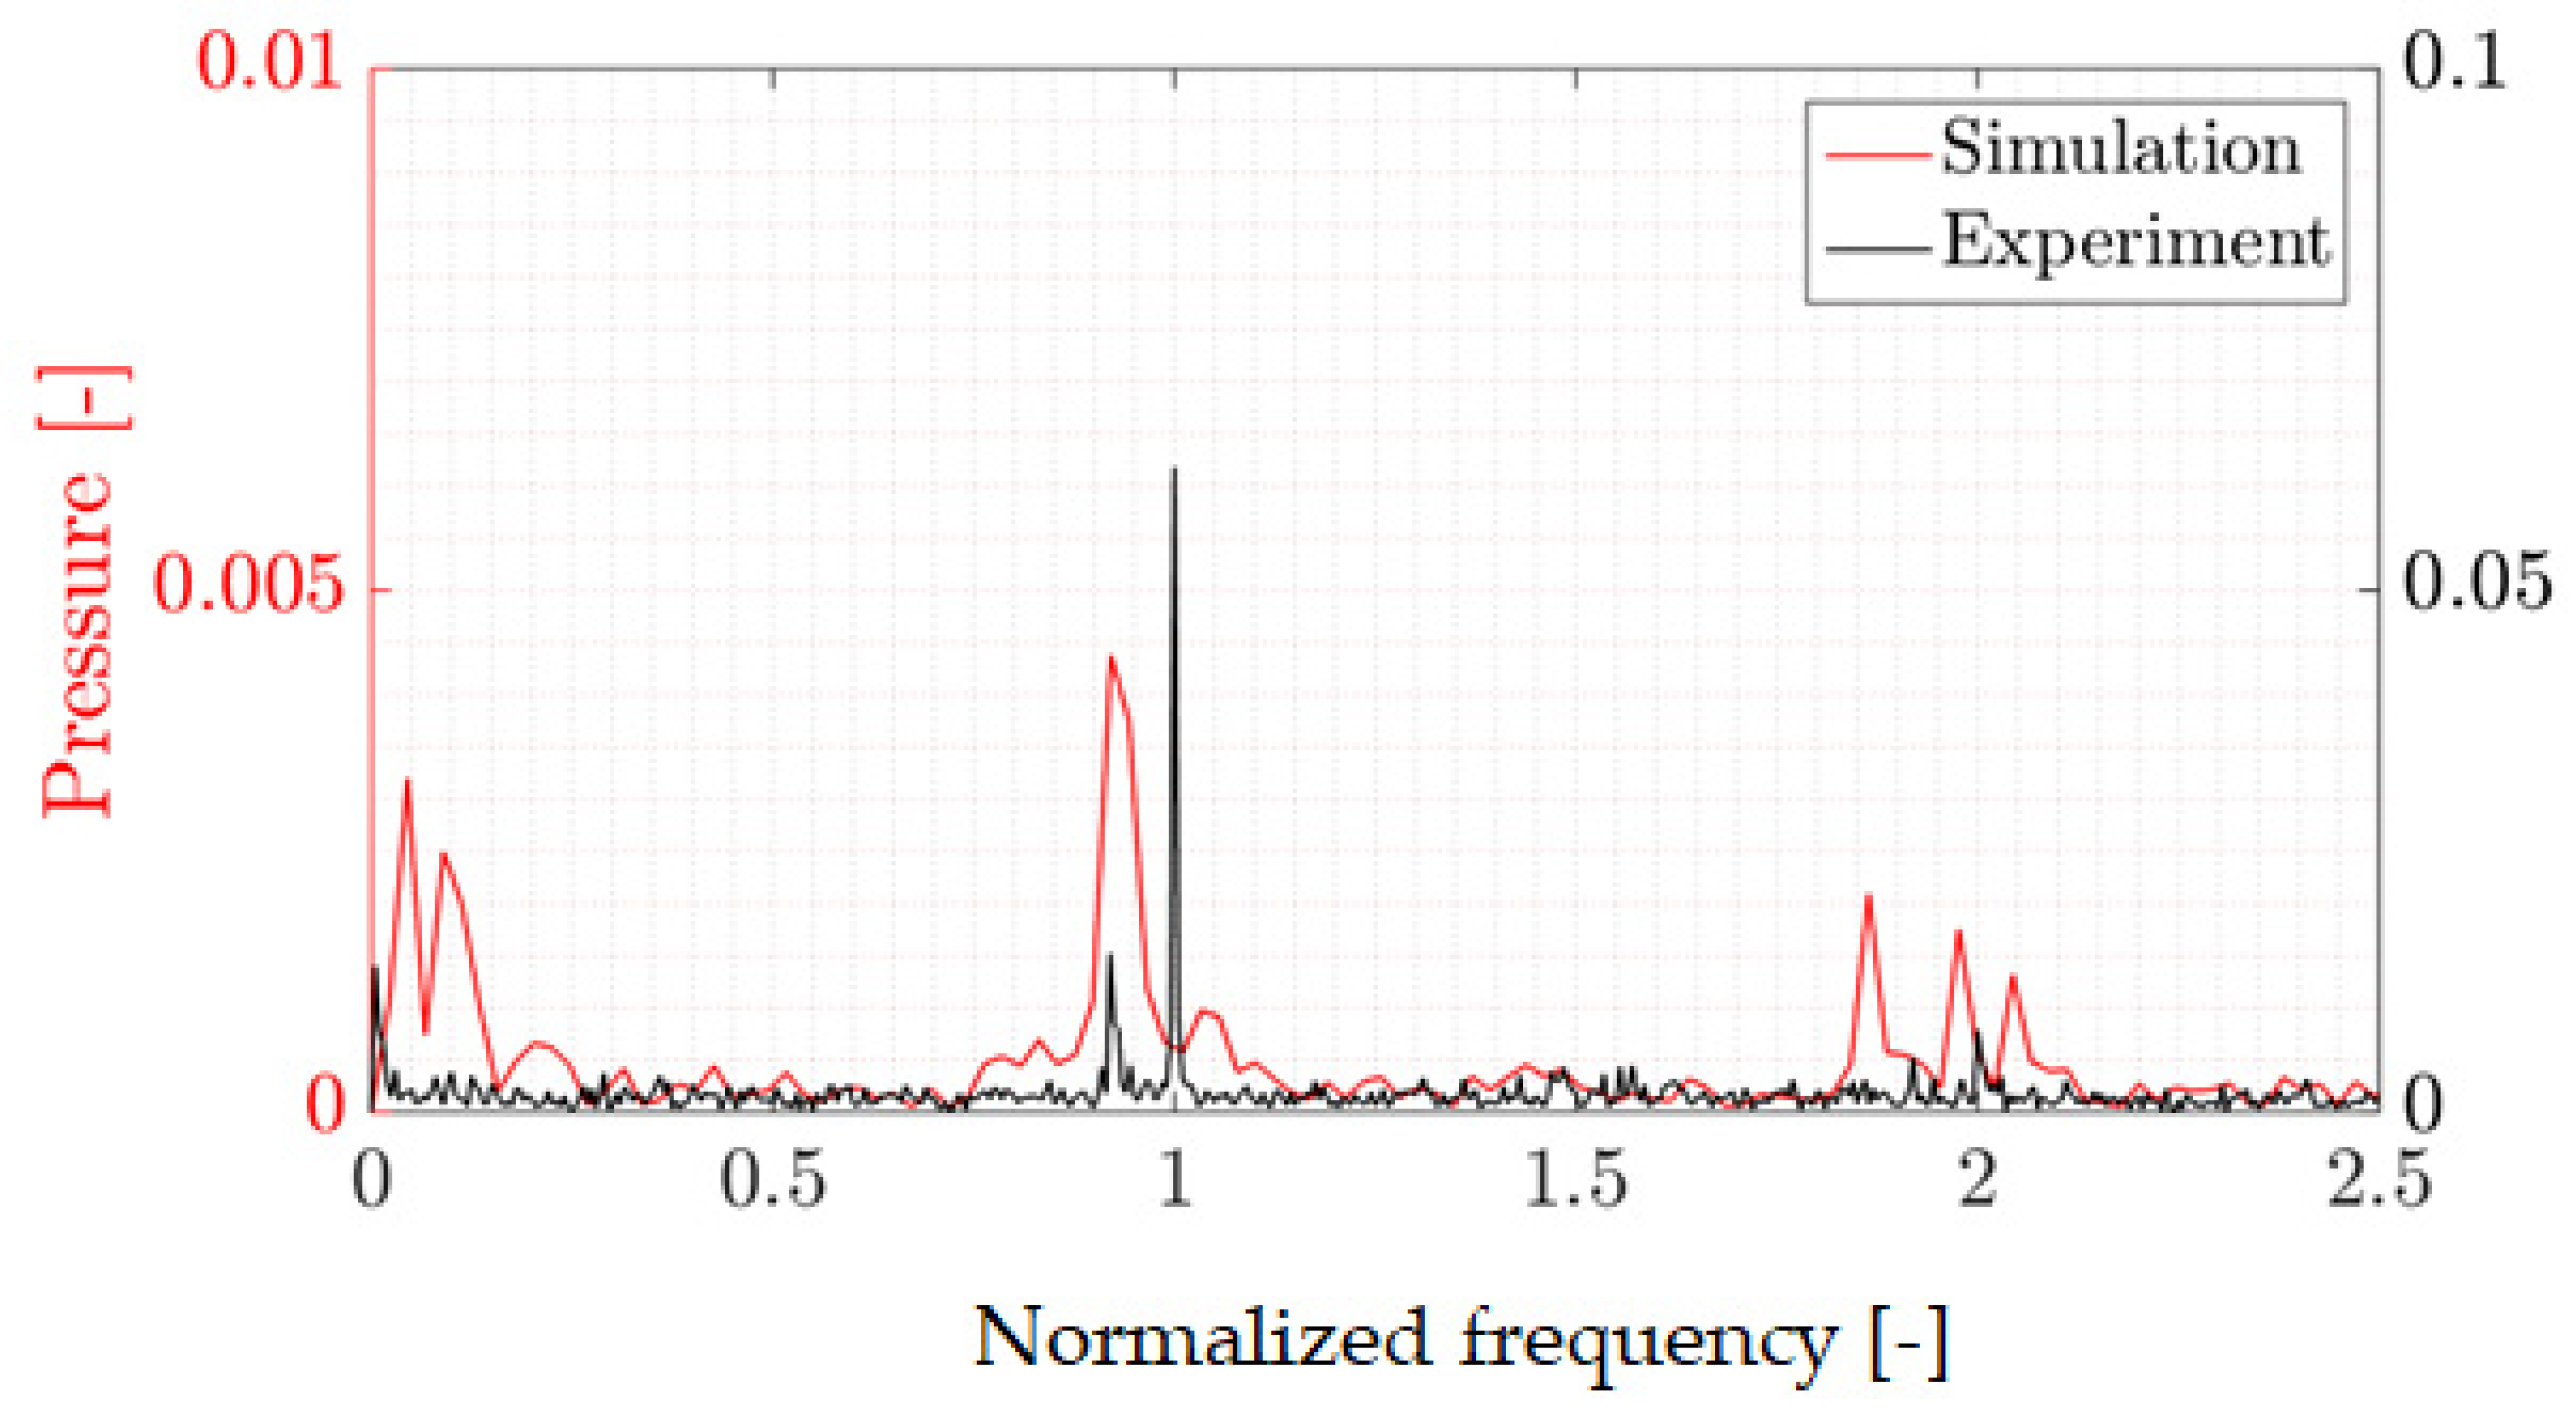
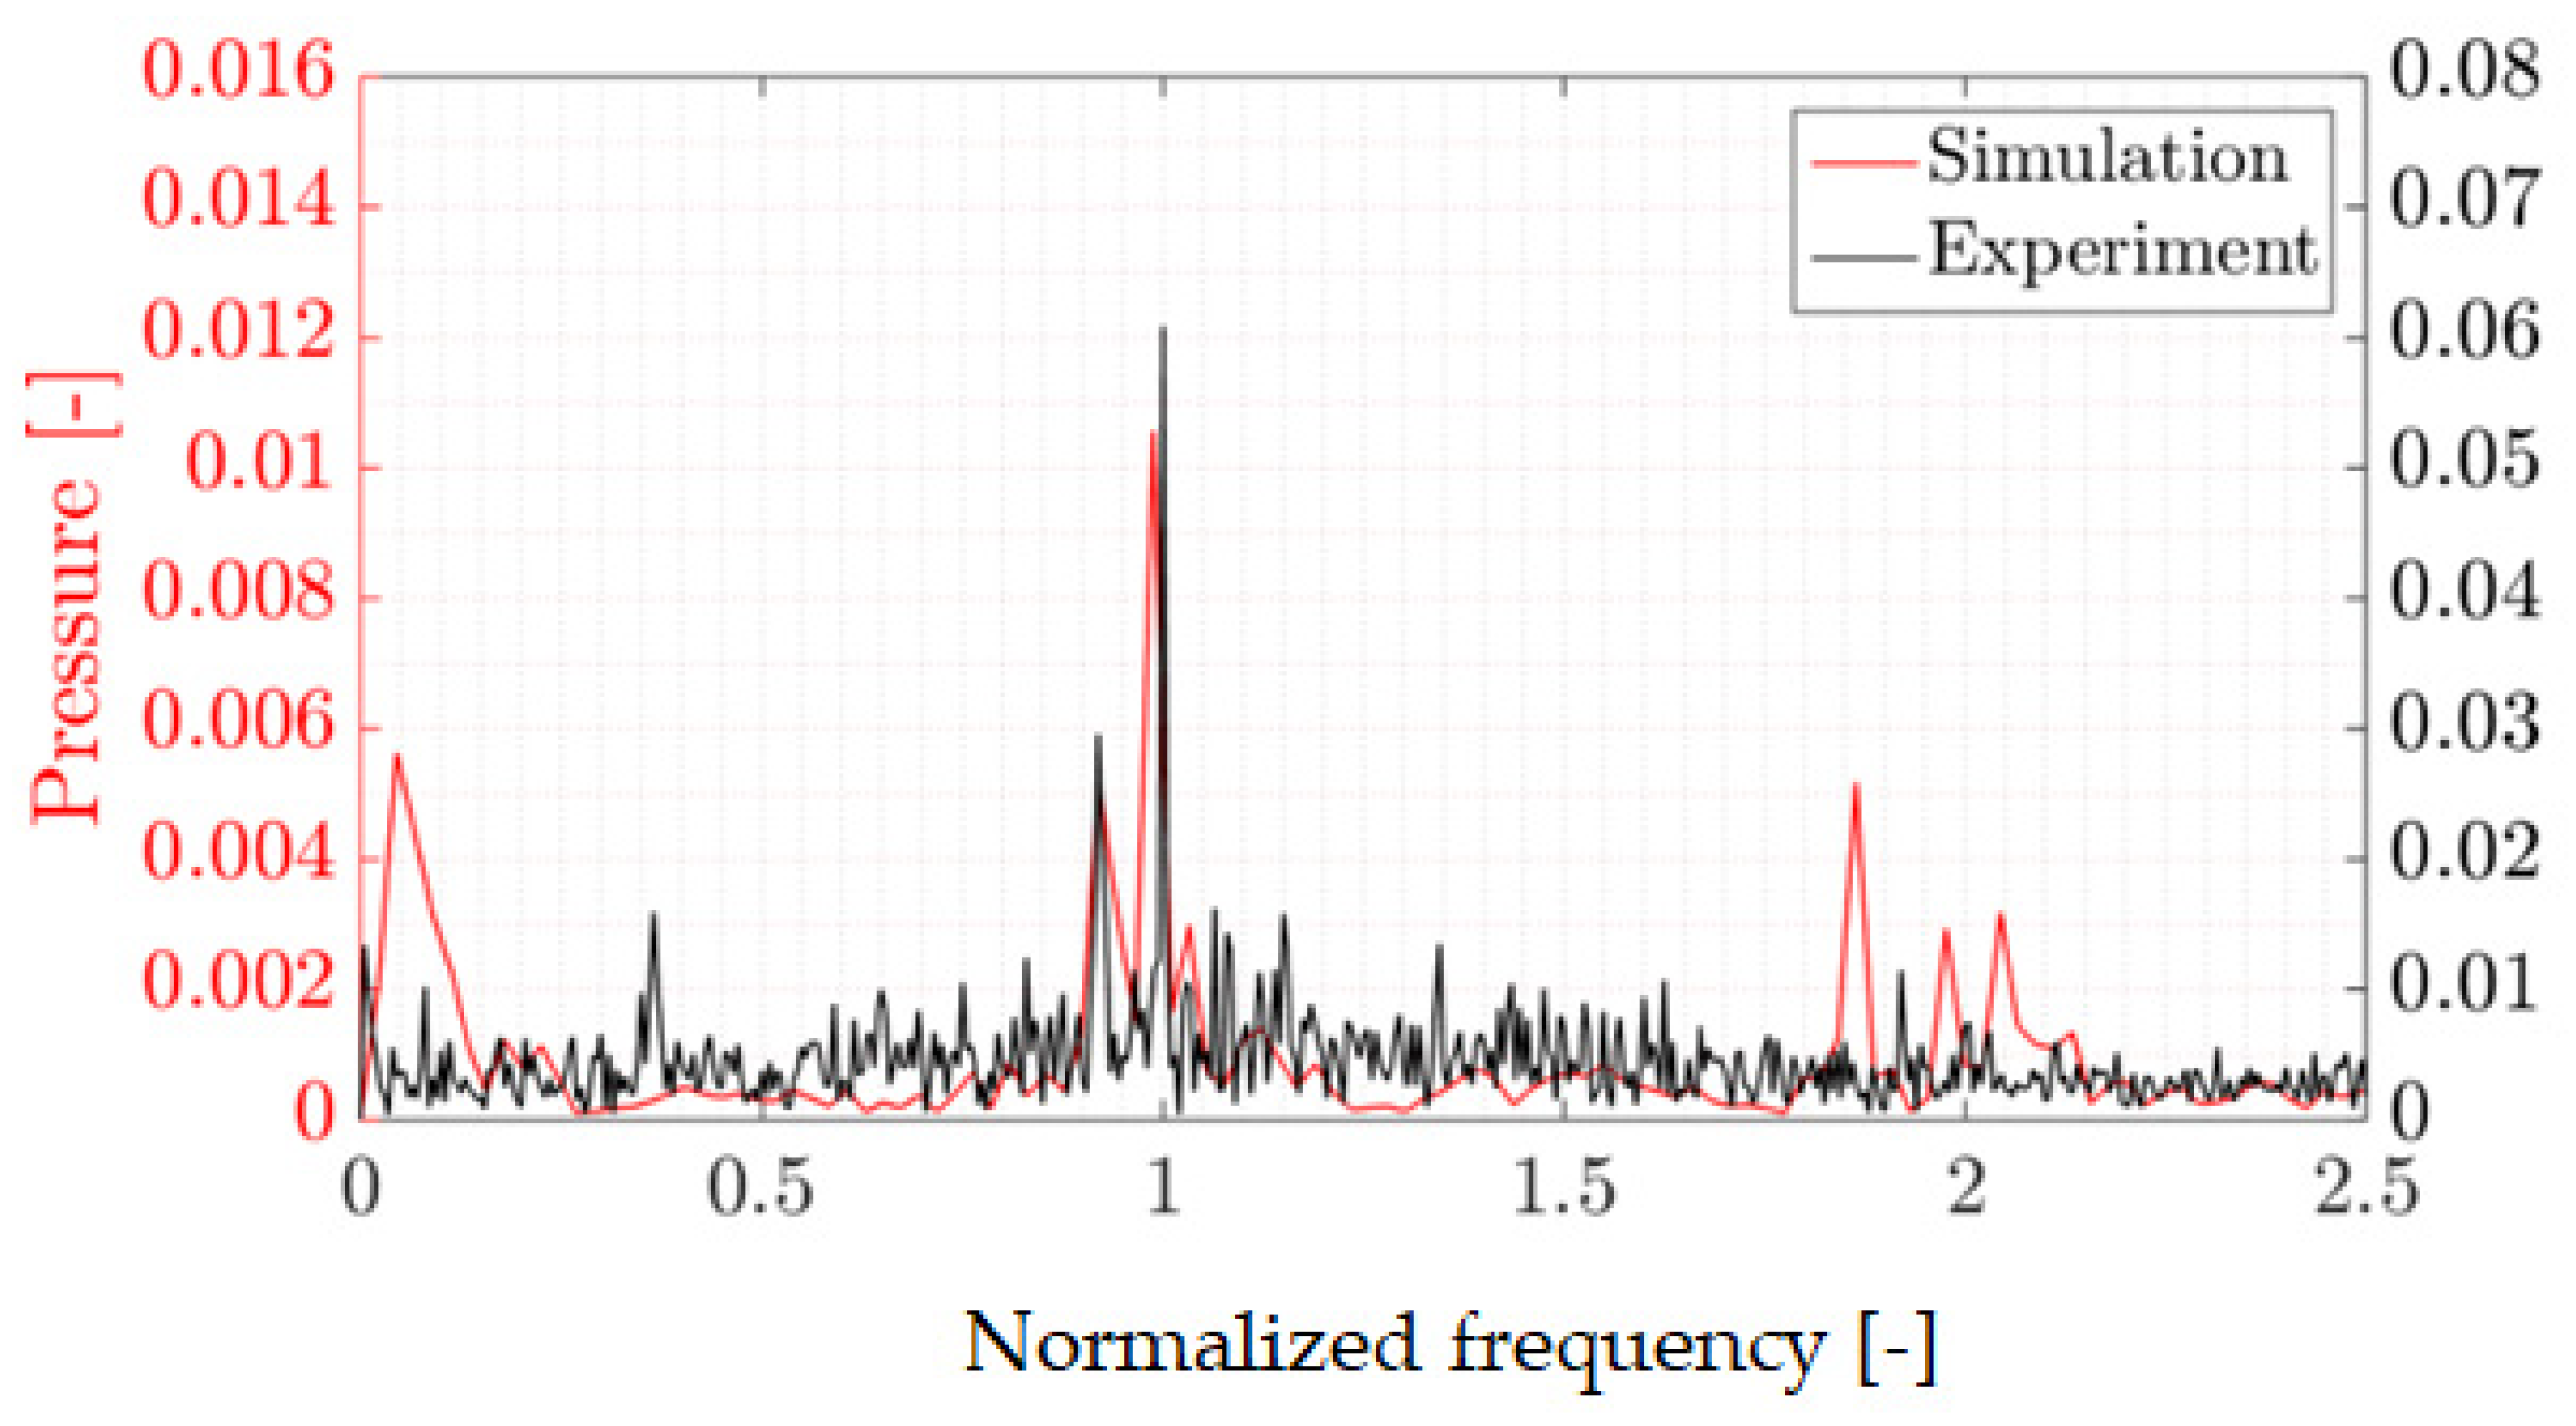
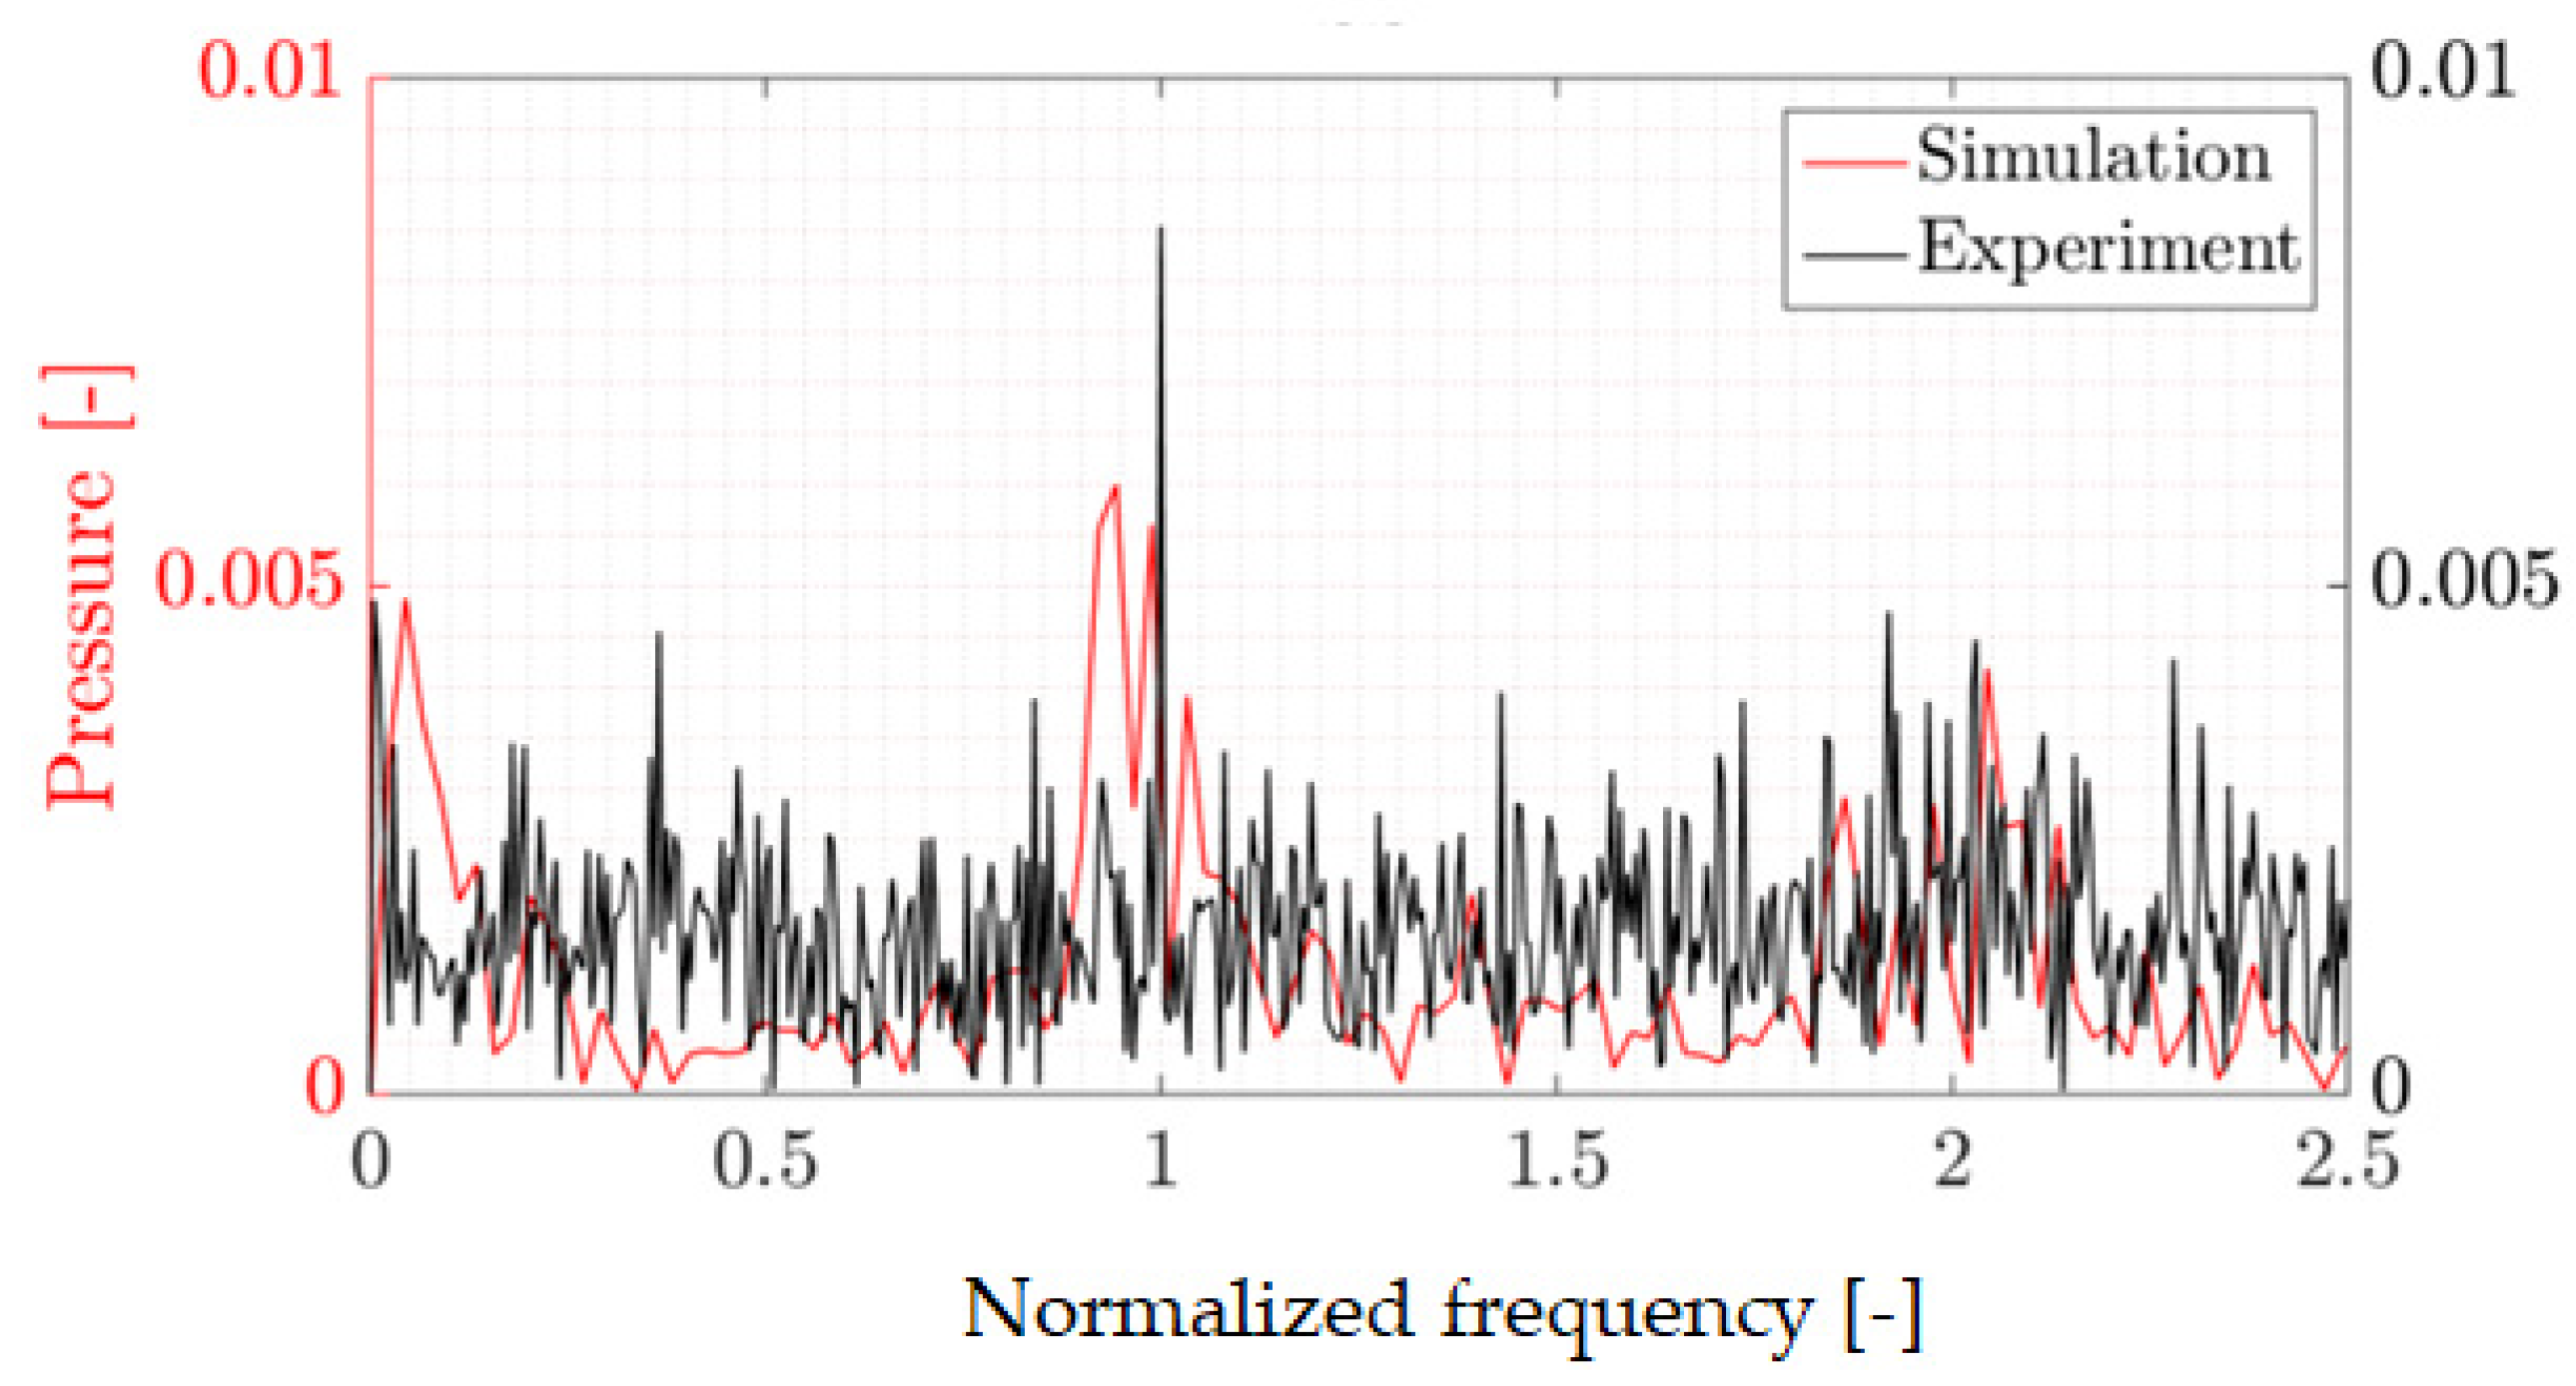
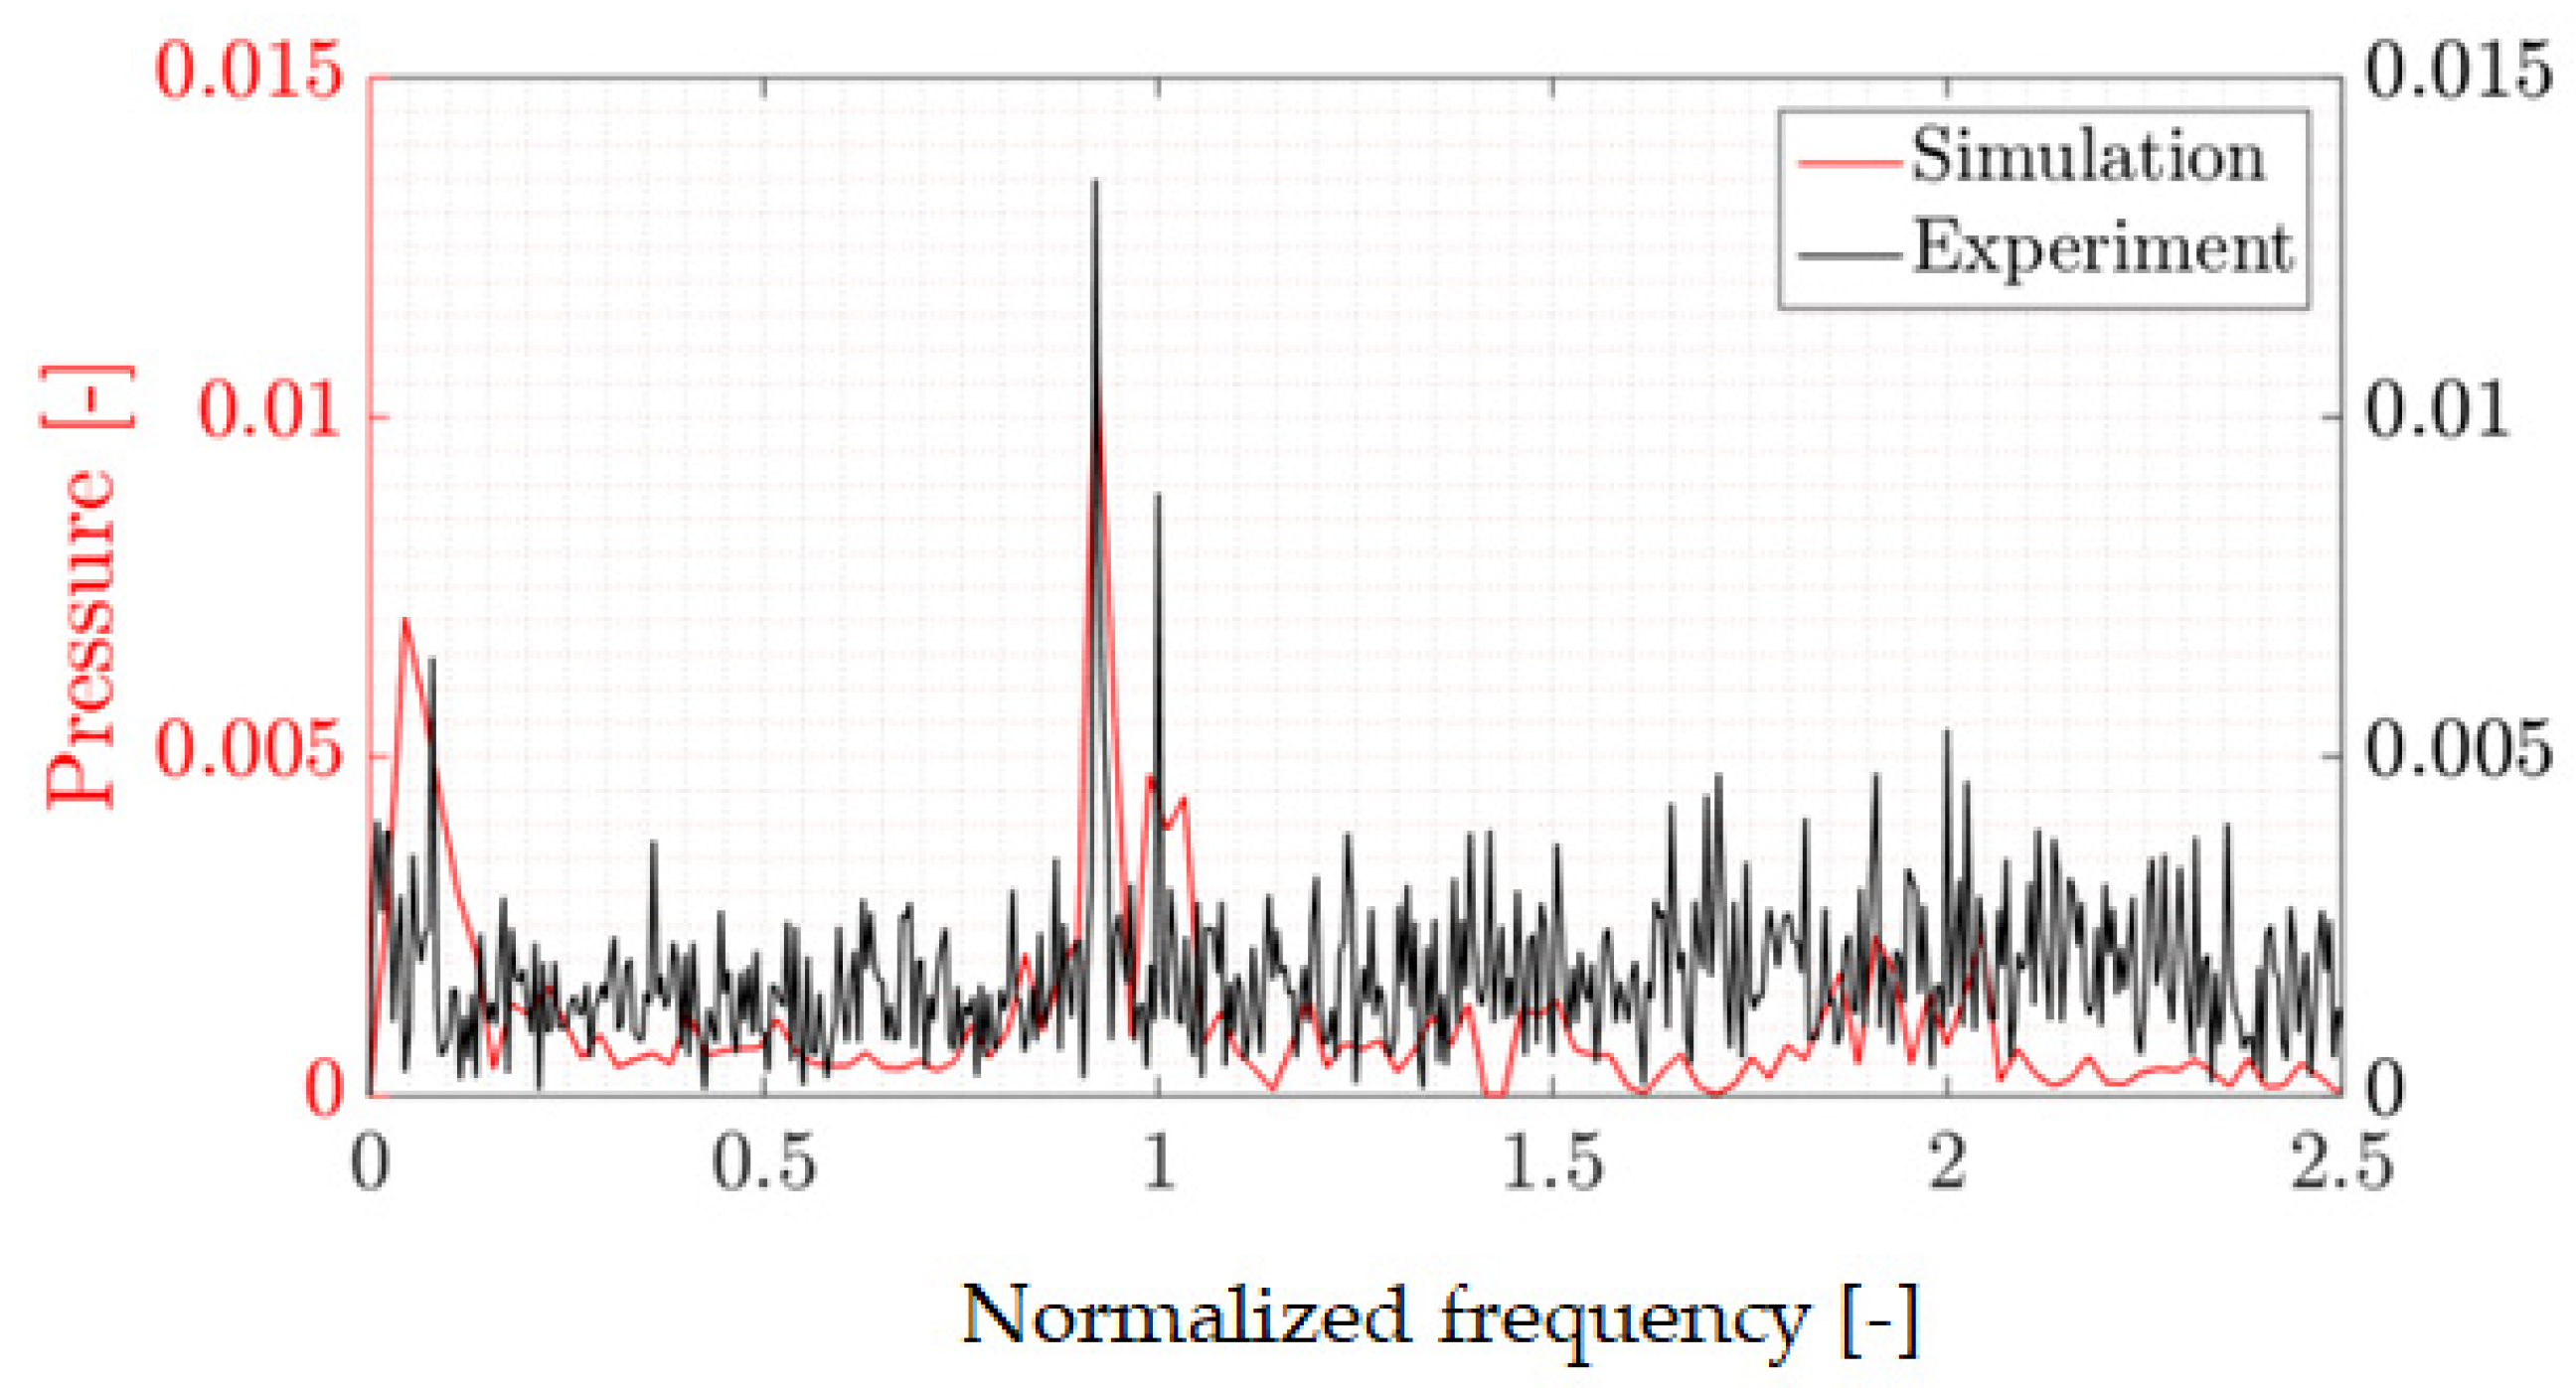
Figure 11, Figure 12, Figure 13, Figure 14, Figure 15 and Figure 16 present the amplitude spectra of the numerical and experimental pressure signals obtained at four locations on the pressure side of one runner blade and two on the suction side. The amplitude of the pressure fluctuations on the runner blades is very difficult to capture on the pressure side of the blade. The simulation provides smaller amplitude–frequency fluctuations compared to the experiment. A factor of 10 is obtained between the amplitudes of the numerical and experimental signals at most locations on the pressure side of the runner blade (Figure 11, Figure 12 and Figure 13). The only exception is the pressure sensor P-PS-6 (Figure 14), near the trailing edge towards the hub, where a factor of 5 is obtained. This order of magnitude is comparable to the one obtained for the low-frequency torque fluctuations. However, there are no significant amplitude differences between the numerical simulation and the experiment (Figure 15 and Figure 16) on the suction side of the runner blade as opposed to the mean values presented before.
Like the experimental torque spectrum, the pressure measurements capture two frequency peaks at f* = 0.92 and f* = 1 regardless of the pressure sensors’ location on the blade, indicating that a coherent structure is causing these fluctuations. Towards the leading edge of the runner blade at P-PS-4, both pressure frequency peaks are visible in the numerical results at f* = 0.92 and f* = 0.99 (Figure 11). The numerical simulation underestimates the amplitude of the first peak by a factor of 5; two different vertical axes are used. The frequency peak at f* = 0.04 is seen in the spectrum analysis of the numerical pressure, together with its second harmonic at f* = 0.08. These two low-frequency peaks may be due to the signal length selection and spectral leakage [28]. Another group of frequency peaks is visible in the numerical results, the first being the f* = 1.86, which is the second harmonic of the f* = 0.92 peak. In the experimental signal, this second harmonic is f* = 1.92. The second harmonic of the runner frequency is also visible in the experiment and the numerical simulation at f* = 2 and f* = 1.98, respectively. There is another frequency peak found at f* = 2.04, showing that the pressure fluctuations are modulated by fluctuations from other sources.
In the center area of the runner blade pressure side (P-PS-2), the numerical simulation shows a frequency peak at f* = 0.92, nearly three times smaller in amplitude than the experimental peak (Figure 12). The runner frequency is poorly captured in the simulation at this location, being the only monitor point where the amplitude of the runner frequency, f* = 1.03 is this strongly underestimated. The second harmonics of these two signals are smaller in amplitude and show frequency values identical to those presented at the previous location (P-PS-4, Figure 10). Similar to the last spectrum amplitude, the frequency peak at f* = 0.04 and its second harmonic at f* = 0.08 are present.
Close to the trailing edge, at P-PS-3, (Figure 13), the pressure frequency peak found at f* = 0.92 in the experimental signal is slightly shifted towards the right in the numerical results, at a larger value of f* = 0.94. The second harmonic of this peak (f* = 0.92 in the experiment) is not visible in the experimental pressure signal at this location. Still, it remains visible in the numerical results at f* = 1.86. The amplitude of the experimental values decreases from the leading to the trailing edge. In the numerical results, on the other hand, this trend is not so clear mainly due to the pressure fluctuations recorded in the center area of the blade (Figure 12) despite not showing any flow separation or other flow particularities in that region.
The P-PS-6 monitor point is located near the trailing edge of the runner blade but closer to the runner hub than the P-PS-3 monitor point, which is closer to the runner shroud. As mentioned before, at this location, the amplitude of the pressure fluctuations captured in the numerical simulation is better predicted than at the other locations from the pressure side of the runner blade presented so far (Figure 14). The numerically obtained frequency values are similar to the previous monitor points and reasonably predicted compared to the experimental values.
On the suction side of the runner blade, the prediction of the frequency and amplitude of the pressure fluctuations matches the experimental values better, especially regarding the magnitude of the fluctuations. The less accurate modelling of the pressure pulsations on the pressure side of the runner blades could be explained by the numerical simplification of the guide vane domain, including the stay vanes and the guide vanes upstream of the runner, which is not axisymmetric in reality and influences the pressure distribution.
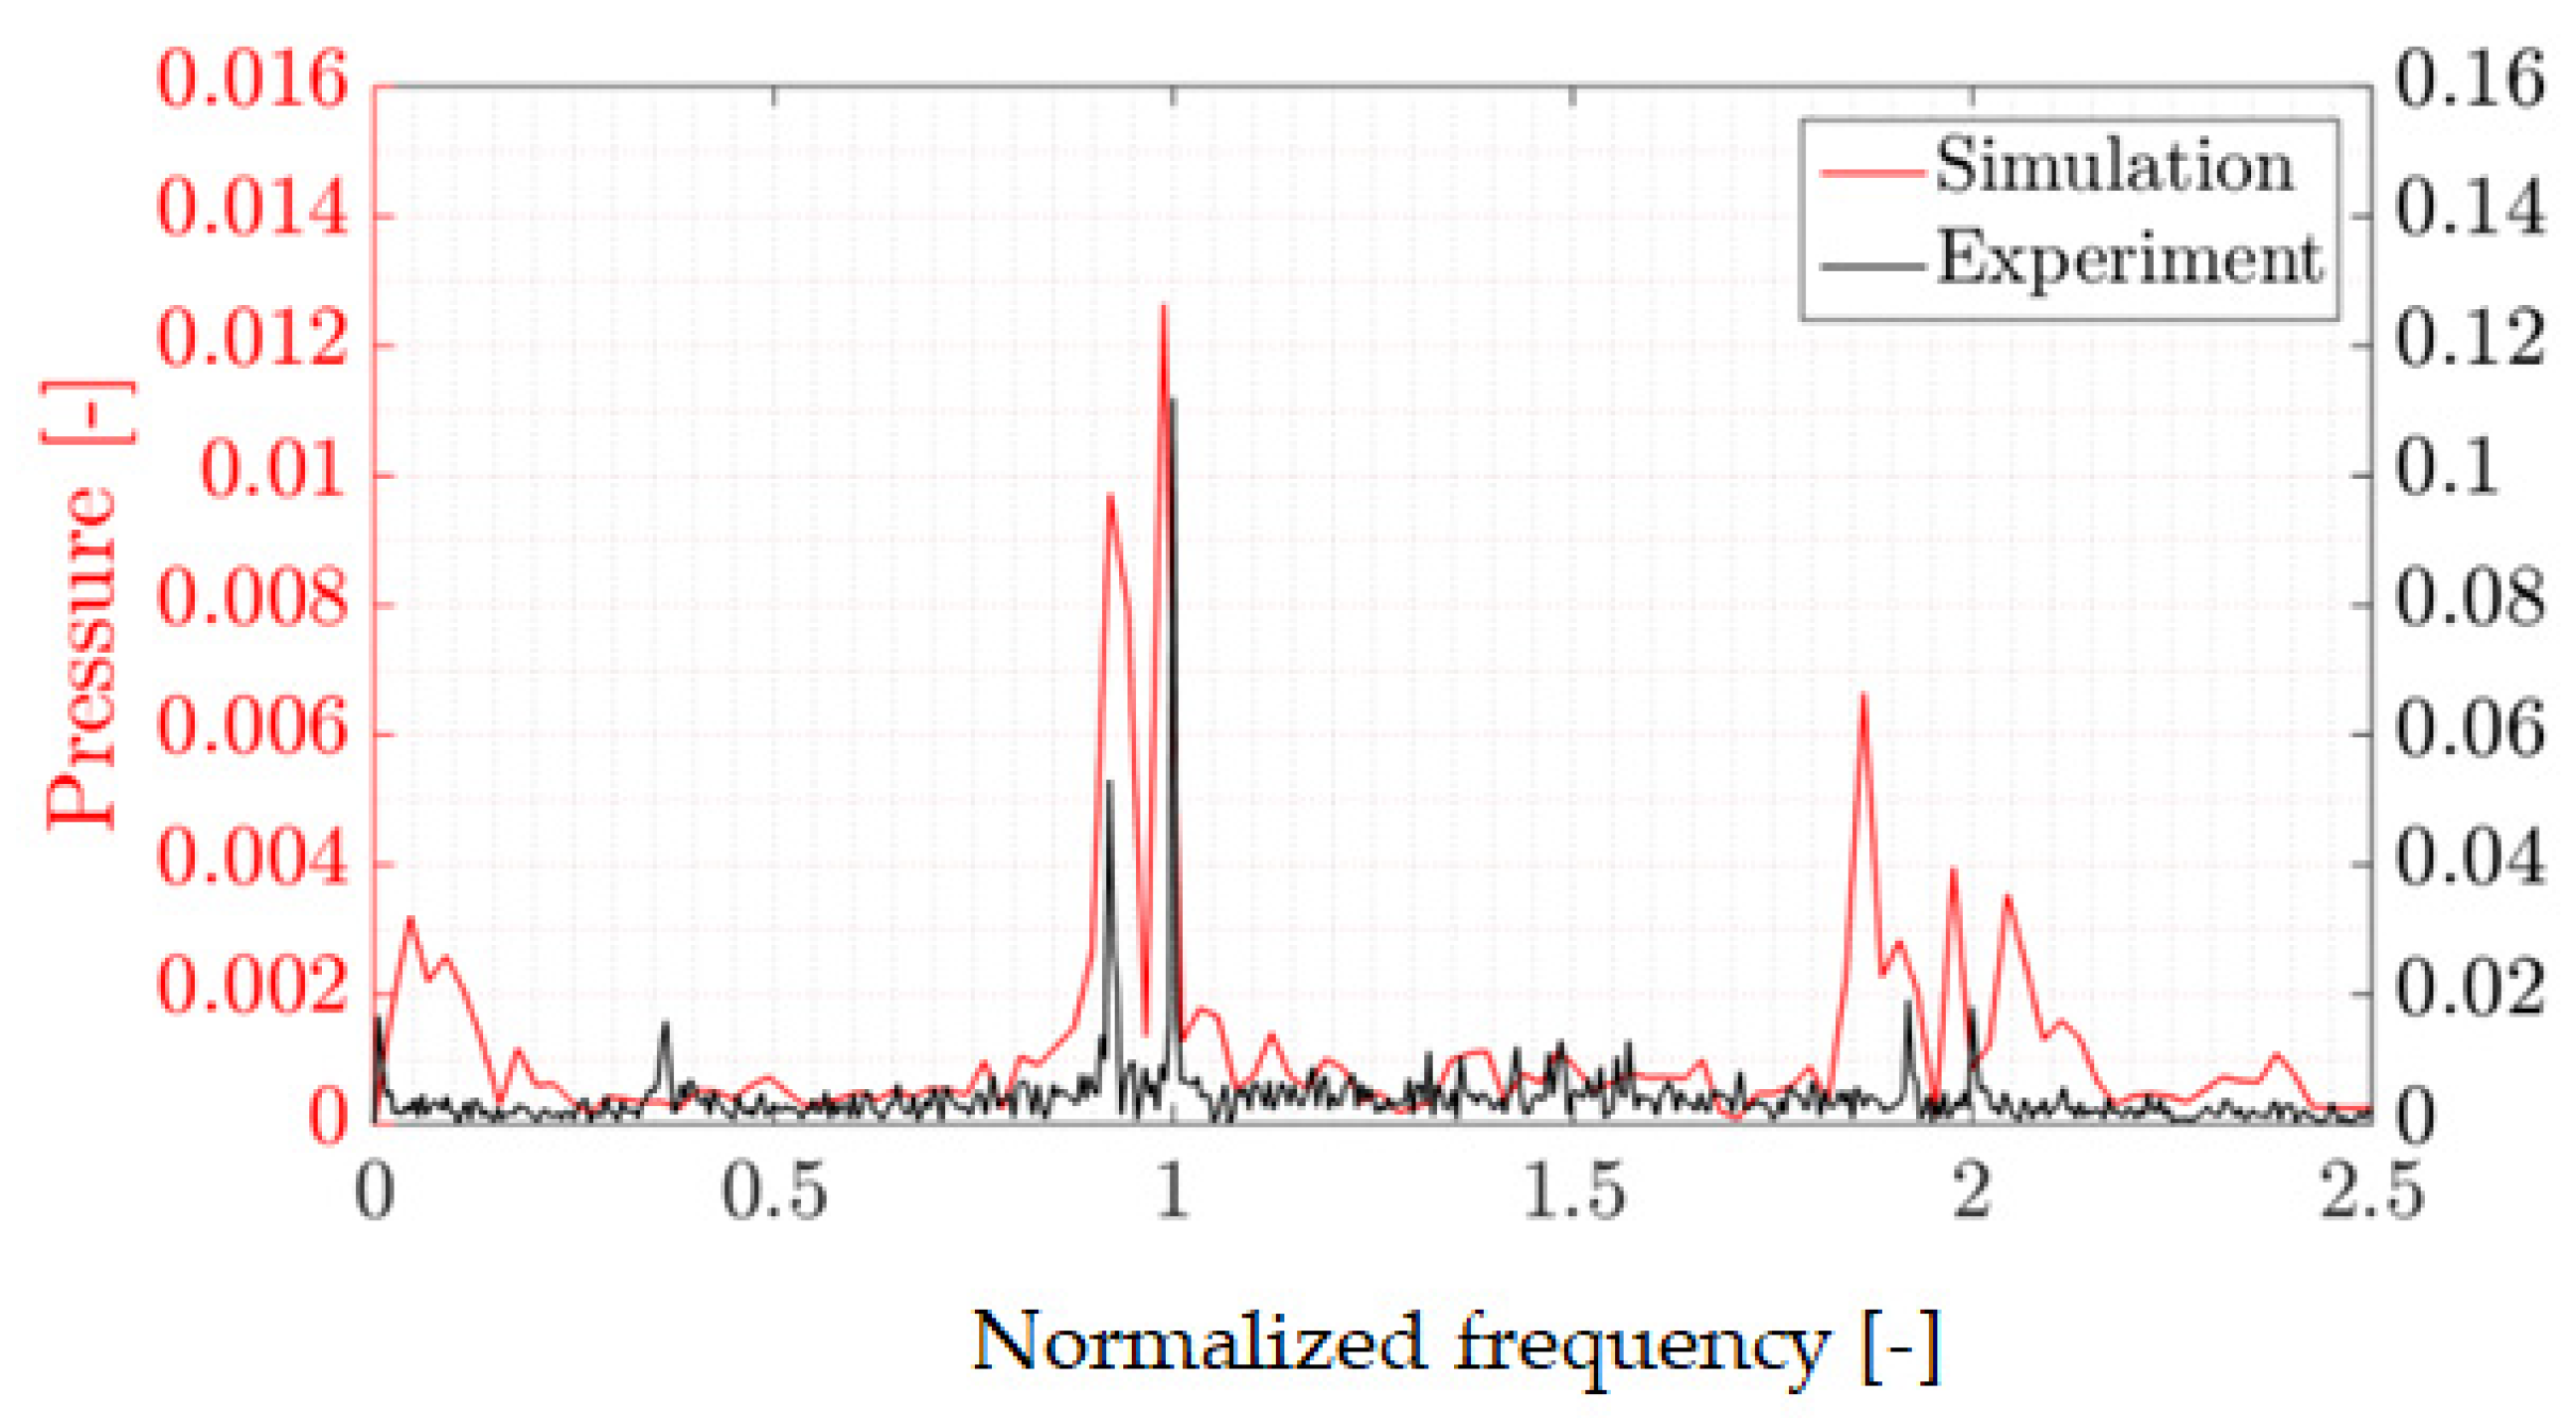
Figure 15 presents the amplitude spectrum of the pressure at P-SS-4 located near the blade leading edge on the suction side. The experimental signal recorded on the suction side of the blade is much noisier. The first pressure peak found at f* = 0.92 in the previously presented experimental pressure signals is not visible anymore. If present, this peak has amplitude comparable to the noise in the signal. The runner frequency is at the highest amplitude in the experimental pressure spectrum. In the numerical results, both peaks are visible at f* = 0.94 and f* = 0.99, similarly to the previous results. Because there is less noise in the numerical pressure signals, the second harmonics of the two peaks frequency mentioned above are visible in the numerical results at f* = 1.86 and f* = 1.98, similarly to the previous results.
The amplitude spectrum of the pressure at P-SS-3 located on the suction side of the runner blade near the trailing edge is presented in Figure 16. In the experimental pressure signal, two peaks are identified at f* = 0.08 and f* = 0.92, possibly corresponding to the plunging and rotating components of the vortical structure. In the vicinity of these two peaks, the numerical simulation captures similar frequency peaks at f* = 0.04 and f* = 0.92.
The frequencies of the presure peaks obtained numerically and experimentally are summarized for comparison in Table 5.

4.3. Flow Visualization

Figure 17 presents the evolution of a pressure iso-surface at 205 kPa towards the end of the simulated time, the final 200 ms, equivalent to two runner rotations. The first three captions are taken at approximately 83 ms from each other, and the fourth caption is the final stage at the end of the simulation. Given the very low flow rate and large runner rotational speed, the flow field is far from the design conditions. With the exception of the rotating stall, mainly stochastic fluctuations occur at SNL. The fluid energy dissipates predominantly in strongly turbulent flow structures. The fluid is drawn to the draft tube walls leaving a large recirculation area in the center of the draft tube. A strong shear layer is developing in the runner and draft tube. Initially, only three vortexes are visible in the numerical simulation, and the low-pressure area created in the center of the draft tube is the largest. The formation of a fourth vortex is captured in the following two images. The four vortexes are joined in pairs at the end of the simulation (Figure 18). The merge of the vortexes occurs below the runner-draft tube interface, confirming that the transient rotor-stator has a minimal influence on the flow structures captured by the numerical simulation. Other numerical studies concerning the SNL operation of a bulb turbine model showed the formation of three rotating vortexes [15] and a twin vortex structure [16]. Therefore, the total simulated time seems critical when modelling the flow in a hydraulic turbine operating at SNL.
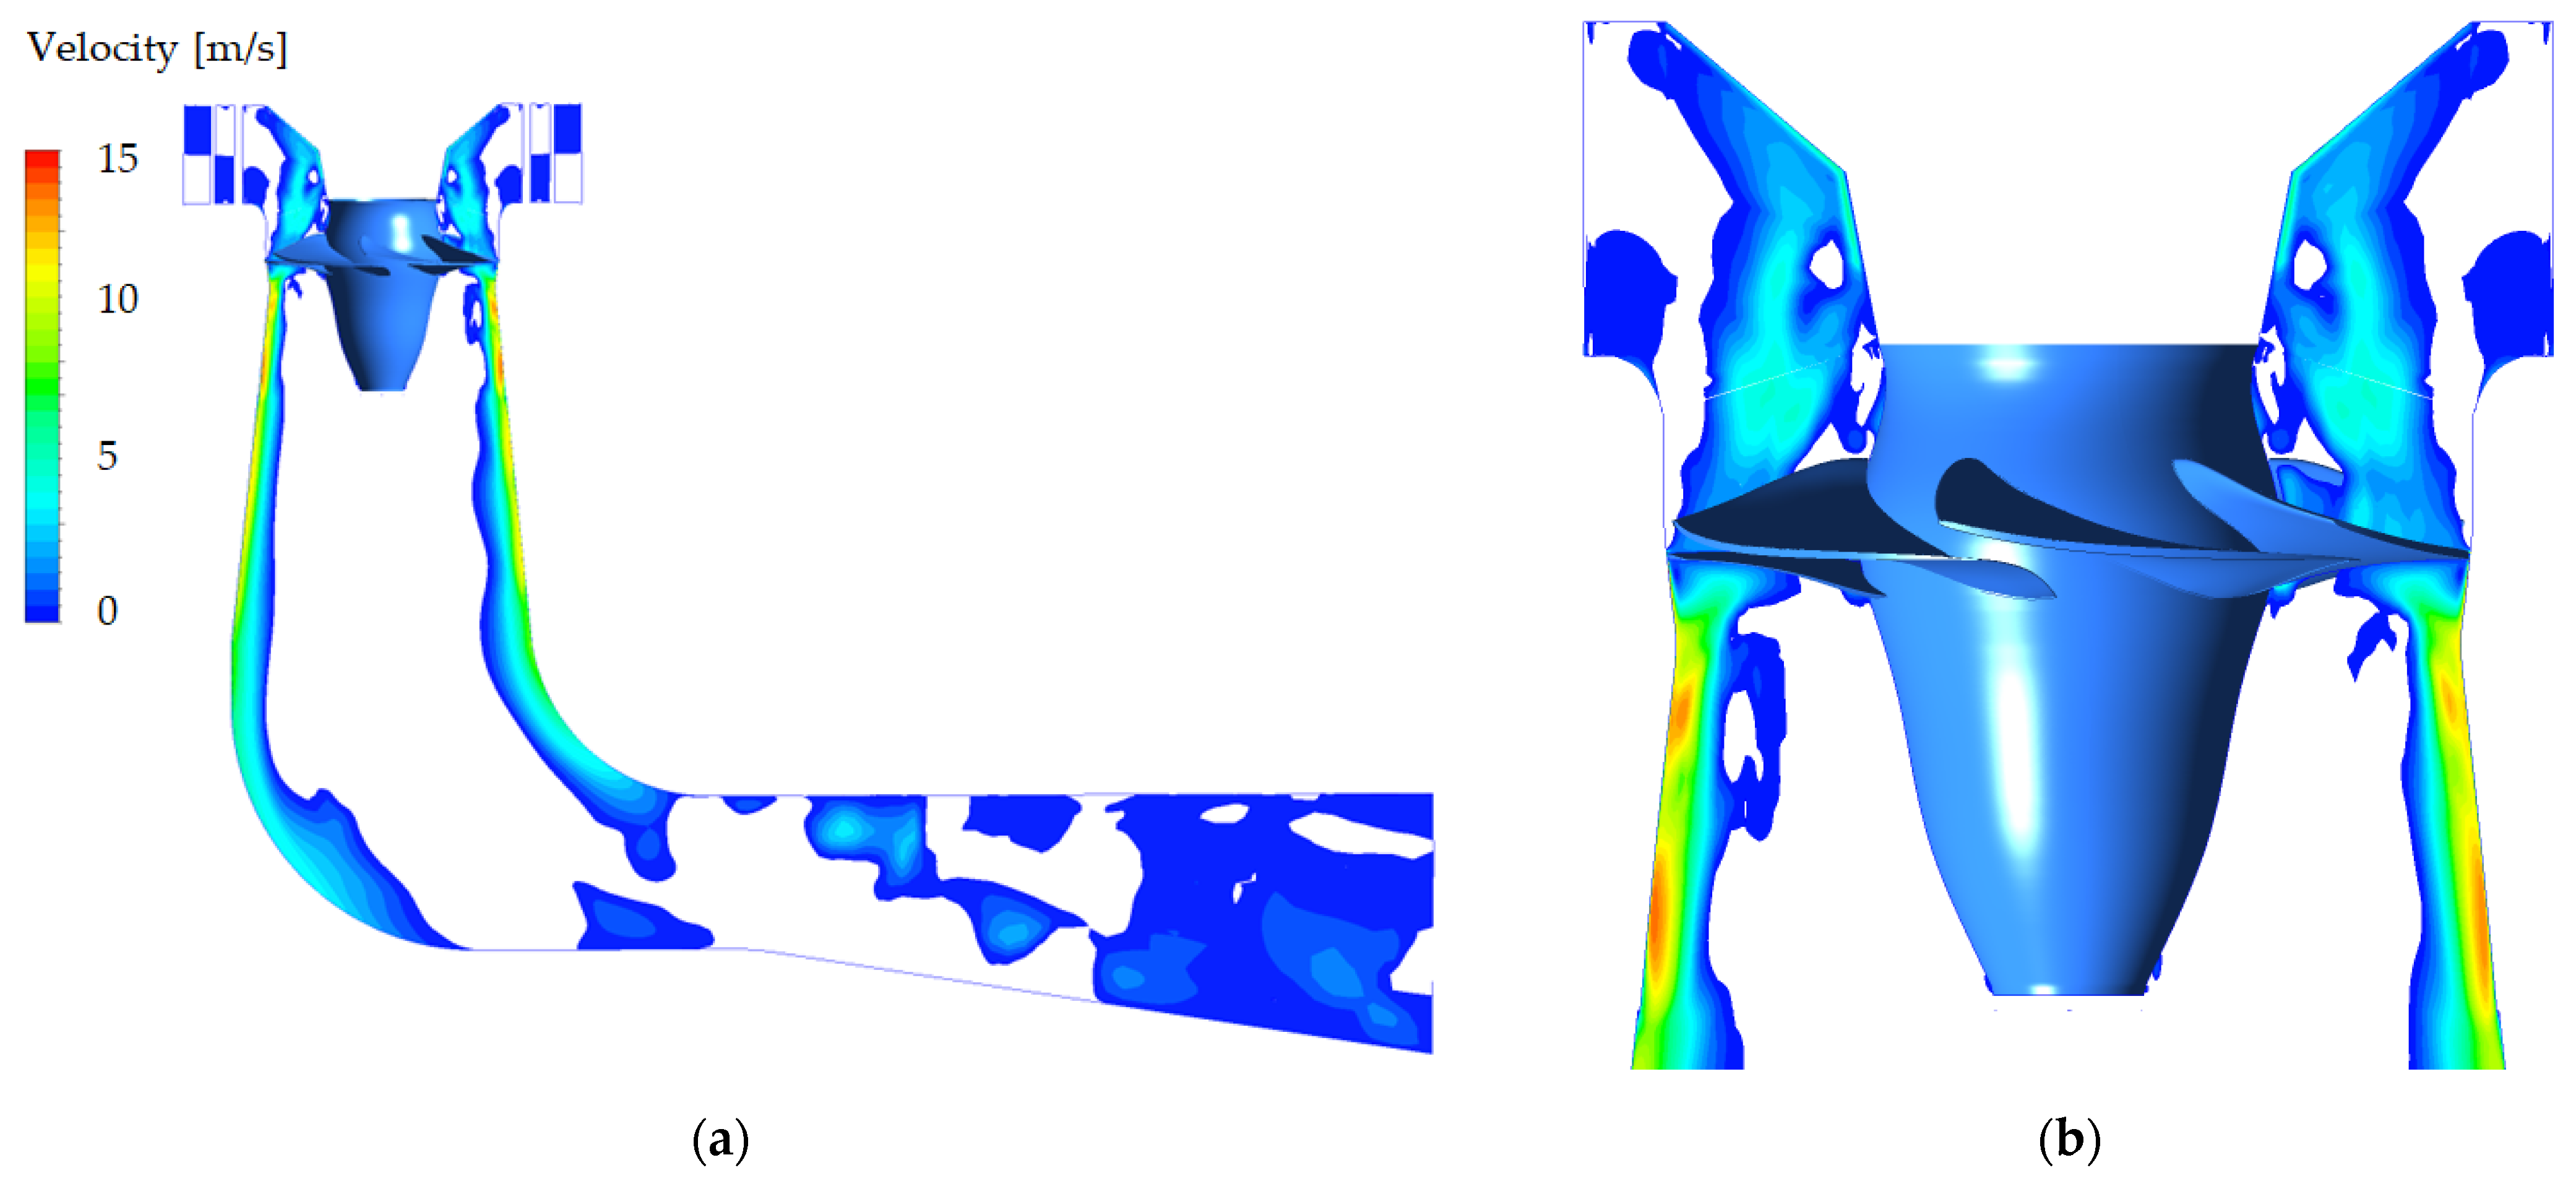
The axial velocity is positive only on the periphery of the numerical domain (Figure 19). The velocity contour plotted on the mid-section plane shows a large recirculating area in the center of the draft tube. A stagnation area with very low but positive velocity is present in the draft tube diffuser near the outlet of the domain. The backflow regions extend upstream from the runner blades near the hub, but also near the shroud towards the outlet of the guide vane domain.
The streamlines plotted in the forward direction from the runner blades (in blue, Figure 20) are concentrated near the draft tube walls, especially in the draft tube cone and elbow. Towards the draft tube axes, the streamlines plotted in the backward direction from the runner blades (in red, Figure 20) are predominant. The velocity contour plot (Figure 19) shows that the velocity becomes mostly positive in the draft tube diffuser, leaving the computational domain.

5. Conclusions

The present paper introduces the numerical investigation of the flow in a full-scale 10 MW Kaplan turbine prototype operated at SNL. A numerical model was developed starting from the scaled geometry of the turbine model, and potential simplifications that can optimize the numerical accuracy and computational costs were explored. The experimental data provided by Soltani et al. [17] was employed to validate the numerical simulation.
To decrease the meshing time and the model complexity, the stay vane–guide vane domain was defined as axisymmetric. At the same time, the distributor of the actual turbine prototype has 18 unequally distributed stay vanes. The epoxy layer applied to the instrumented blade and a second, opposite runner blade was not included in the numerical model. Despite the considerable increase in the runner mesh size, constant clearances were defined between the runner blades and runner hub and shroud because the influence of the clearance flow on the upstream and downstream flow field is considered significant at SNL. The mesh size increased substantially due to small runner blade and guide vane angles leading to higher computational demands and larger simulation time. The simulation ran for 49 days to obtain 45 runner rotations after achieving convergence using 94 cores.
The mean quantities were reasonably predicted in the numerical simulation. The pressure values were better captured on the pressure side of the runner blade (1–14.6%) compared to the suction side (37.2–46%). The numerical mean torque value obtained from the simulation corresponded to 1.2% of the nominal torque while the measured values ranged between 1–1.5% of the nominal torque. However, the amplitude of the torque fluctuations was underestimated by a factor of 30.
The frequencies of the numerical pressure fluctuations were in very good agreement with the experimental values, especially at the locations defined on the suction side of the runner blade. The amplitudes of the pressure peaks were underestimated on the pressure side of the runner blade, by a factor of 5−10.
The total simulation time corresponded to 45 runner rotations. Four vortex structures were captured at the end of the numerical simulation. However, the intermediate results capture initially only two vortex structures followed by the formation of a third and fourth vortex showing that the selection of the total simulation time has a strong influence on the conclusions of a numerical study.

Author Contributions

Investigation, R.G.I., A.S.D. and M.J.C.; methodology, M.J.C.; supervision, M.J.C.; writing—original draft preparation, R.G.I.; writing—review and editing, A.S.D. and M.J.C. All authors have read and agreed to the published version of the manuscript.

Funding

The European Union’s Horizon 2020 research and innovation program under grant agreement No. 814958 partially financed the research.

Institutional Review Board Statement

Not applicable.

Informed Consent Statement

Not applicable.

Data Availability Statement

Not applicable.

Acknowledgments

The presented research was carried out as a part of the Swedish Hydropower Centre (SVC), which was established by the Swedish Energy Agency, Elforsk and Svenska Kraftnät, together with the Luleå University of Technology, The Royal Institute of Technology, Chalmers University of Technology, and Uppsala University.

Conflicts of Interest

The authors declare no conflict of interest.

Abbreviations

SNL Speed-no-load
SAS-SST Scale-Adaptive Simulation–Shear-Stress Transport
LES Large Eddy Simulation
RANS Reynolds-Averaged Navier-Stokes
D runner diameter
β runner blade angle
y+ dimensionless distance from the wall
fr runner frequency
f* dimensionless frequency

References

  1. Houde, S.; Dumas, G.; Maciel, Y.; Deschênes, C. Investigations of rotating stall inception in a propeller turbine runner operating in low-load conditions. IOP Conf. Ser. Earth Environ. Sci. 2019, 240, 022021. [Google Scholar] [CrossRef]
  2. Morissette, J.F.; Nicolle, J. Fluid-structure simulations of the stochastic behaviour of a medium head Francis turbine during startup. IOP Conf. Ser. Earth Environ. Sci. 2019, 240, 022026. [Google Scholar] [CrossRef]
  3. Botero, F.; Hasmatuchi, V.; Roth, S.; Farhat, M. Non-intrusive detection of rotating stall in pump-turbines. Mech. Syst. Signal Processing 2014, 48, 162–173. [Google Scholar] [CrossRef]
  4. Mende, C.; Weber, W.; Seidel, U. Progress in load prediction for speed-no-load operation in Francis turbines. IOP Conf. Ser. Earth Environ. Sci. 2016, 49, 062017. [Google Scholar] [CrossRef] [Green Version]
  5. Decaix, J.; Hasmatuchi, V.; Titzschkau, M.; Münch-Alligné, C. CFD Investigation of a High Head Francis Turbine at Speed No-Load Using Advanced URANS Models. Appl. Sci. 2018, 8, 2505. [Google Scholar] [CrossRef] [Green Version]
  6. Minakov, A.; Sentyabov, A.; Platonov, D. Numerical Investigation of Flow Structure and Pressure Pulsation in the Francis-99 Turbine during Startup. J. Phys. Conf. Ser. 2017, 782, 012004. [Google Scholar] [CrossRef]
  7. Nicolle, J.; Morissette, J.F.; Giroux, A.M. Transient CFD simulation of a Francis turbine startup. In Proceedings of the 26th IAHR Symposium on Hydraulic Machinery and Systems, Beijing, China, 19–23 August 2012. [Google Scholar] [CrossRef]
  8. Nicolle, J.; Giroux, A.M.; Morissette, J.F. CFD configurations for hydraulic turbine startup. In Proceedings of the 27th IAHR Symposium on Hydraulic Machinery and Systems, Montreal, QC, Canada, 22–26 September 2014. [Google Scholar] [CrossRef]
  9. Trivedi, C. Compressible large eddy simulation of a Francis turbine during speed-no-load: Rotor stator interaction and inception of a vortical flow. J. Eng. Gas Turbines Power 2014, 140, 112601. [Google Scholar] [CrossRef]
  10. Staubli, T.; Senn, F.; Sallaberger, M. Instability of Pump-Turbines during Start-Up in Turbine Mode 2008; Hydro: Ljubljana, Slovenia, 2008. [Google Scholar]
  11. He, L.Y.; Wang, Z.W.; Kurosawa, S.; Nakahara, Y. Resonance investigation of pump-turbine during startup process. In Proceedings of the 27th IAHR Symposium on Hydraulic Machinery and Systems, Montreal, QC, Canada, 22–26 September 2014. [Google Scholar] [CrossRef] [Green Version]
  12. Li, Z.; Bi, H.; Wang, Z.; Yao, Z. Three-dimensional simulation of unsteady flows in a pump-turbine during start-up transient up to speed no-load condition in generating mode. Proc. Inst. Mech. Eng. A J. Power Energy 2016, 230, 570–585. [Google Scholar] [CrossRef]
  13. Yang, J.; Gao, L.; Wang, Z.; Zhou, X.; Xu, H. The flow field investigations of no load conditions in axial flow fixed-blade turbine. IOP Conf. Ser. Earth Environ. Sci. 2014, 22, 032028. [Google Scholar] [CrossRef] [Green Version]
  14. Holmström, H. Preliminary Simulation of Porjus U9 Turbine at Speed No Load. Master’s Thesis, Luleå Univeristy of Technology, Luleå, Sweden, 2019. [Google Scholar]
  15. Houde, S. Analysis of the Part-Load and Speed-No-Load Flow Dynamics in a Model Propeller Hydraulic Turbine. Ph.D. Thesis, Universite Laval, Quebec City, QC, Canada, 2018. [Google Scholar]
  16. Yamamoto, K.; Roubaty, M.; Morisod, M.; Coulaud, M.; Houde, S. Numerical investigation of flow instabilities in Speed No-Load operation of a Bulb turbine. IOP Conf. Ser. Earth Environ. Sci. 2021, 774, 012115. [Google Scholar] [CrossRef]
  17. Soltani Dehkharqani, A.; Engström, F.; Aidanpää, J.O.; Cervantes, M. Experimental investigation of a 10 MW prototype Kaplan turbine during start-up operation. Energies 2019, 12, 4582. [Google Scholar] [CrossRef] [Green Version]
  18. Soltani Dehkharqani, A. An Experimental Investigation of a Prototype Kaplan Turbine and Numerical Analysis of Fluid Added Parameters on the Corresponding Model Turbine Runner. Ph.D. Thesis, Luleå Univeristy of Technology, Luleå, Sweden, 2020. [Google Scholar]
  19. Iovănel, R.G.; Soltani Dehkharqani, A.; Bucur, D.M.; Cervantes, M.J. Numerical simulation and experimental validation of a Kaplan prototype turbine operating on a cam curve. Energies 2022, 15, 4121. [Google Scholar] [CrossRef]
  20. Pulpitel, L.; Skotak, A.; Koutnik, S. Vortices rotating in the vaneless space of a Kaplan turbine operating under off-cam high swirl flow conditions. In Hydraulic Machinery and Cavitation; Springer: Dordrecht, The Netherlands, 1996; pp. 925–934. [Google Scholar] [CrossRef]
  21. Iovănel, R.G.; Dunca, G.; Bucur, D.M.; Cervantes, M.J. Numerical simulation of the flow in a Kaplan turbine model during transient operation from the best efficiency point to part load. Energies 2020, 13, 3129. [Google Scholar] [CrossRef]
  22. Mulu, B.G.; Cervantes, M.J.; Devals, C.; Vu, T.C.; Guibault, F. Simulation-based investigation of unsteady flow in near-hub region of a Kaplan turbine with experimental comparison. Eng. Appl. Comput. Fluid Mech. 2015, 9, 139–156. [Google Scholar] [CrossRef] [Green Version]
  23. Trivedi, C.H.; Gogstad, P.J.; Dahlhaug, O.G. Investigation of the unsteady pressure pulsations in the prototype Francis turbines–Part 1: Steady-state operating conditions. Mech. Syst. Signal Processing 2018, 108, 188–202. [Google Scholar] [CrossRef] [Green Version]
  24. Gohil, P.P.; Saini, R.P. Unsteady simulation of cavitating turbulent flow for low head Francis turbine. IOP Conf. Ser. Earth Environ. Sci. 2019, 240, 022007. [Google Scholar] [CrossRef]
  25. Nennemann, B.; Morissette, J.F.; Chamberland-Lauzon, J.; Monette, C.; Braun, O.; Melot, M.; Coutu, A.; Nicolle, J.; Giroux, A.M. Challenges in Dynamic Pressure and Stress Predictions at No-Load Operation in Hydraulic Turbines. IOP Conf. Ser. Earth Environ. Sci. 2014, 22, 032055. [Google Scholar] [CrossRef] [Green Version]
  26. Melot, M.; Coulaud, M.; Chamberland-Lauzon, J.; Nennemann, B.; Deschênes, C. Hydraulic turbine start-up: A fluid-structure simulation methodology. In Proceedings of the 29th IAHR Symposium on Hydraulic Machinery and Systems, Kyoto, Japan, 17–21 September 2019. [Google Scholar]
  27. Trivedi, C.H.; Gandhi, B.; Cervantes, M.J. Effect of transients on Francis turbine runner life: A review. J. Hydraul. Res. 2013, 51, 121–132. [Google Scholar] [CrossRef]
  28. Lyon, D. The Discrete Fourier Transform, Part 4: Spectral Leakage. J. Object Technol. 2009, 8, 23–34. [Google Scholar] [CrossRef]
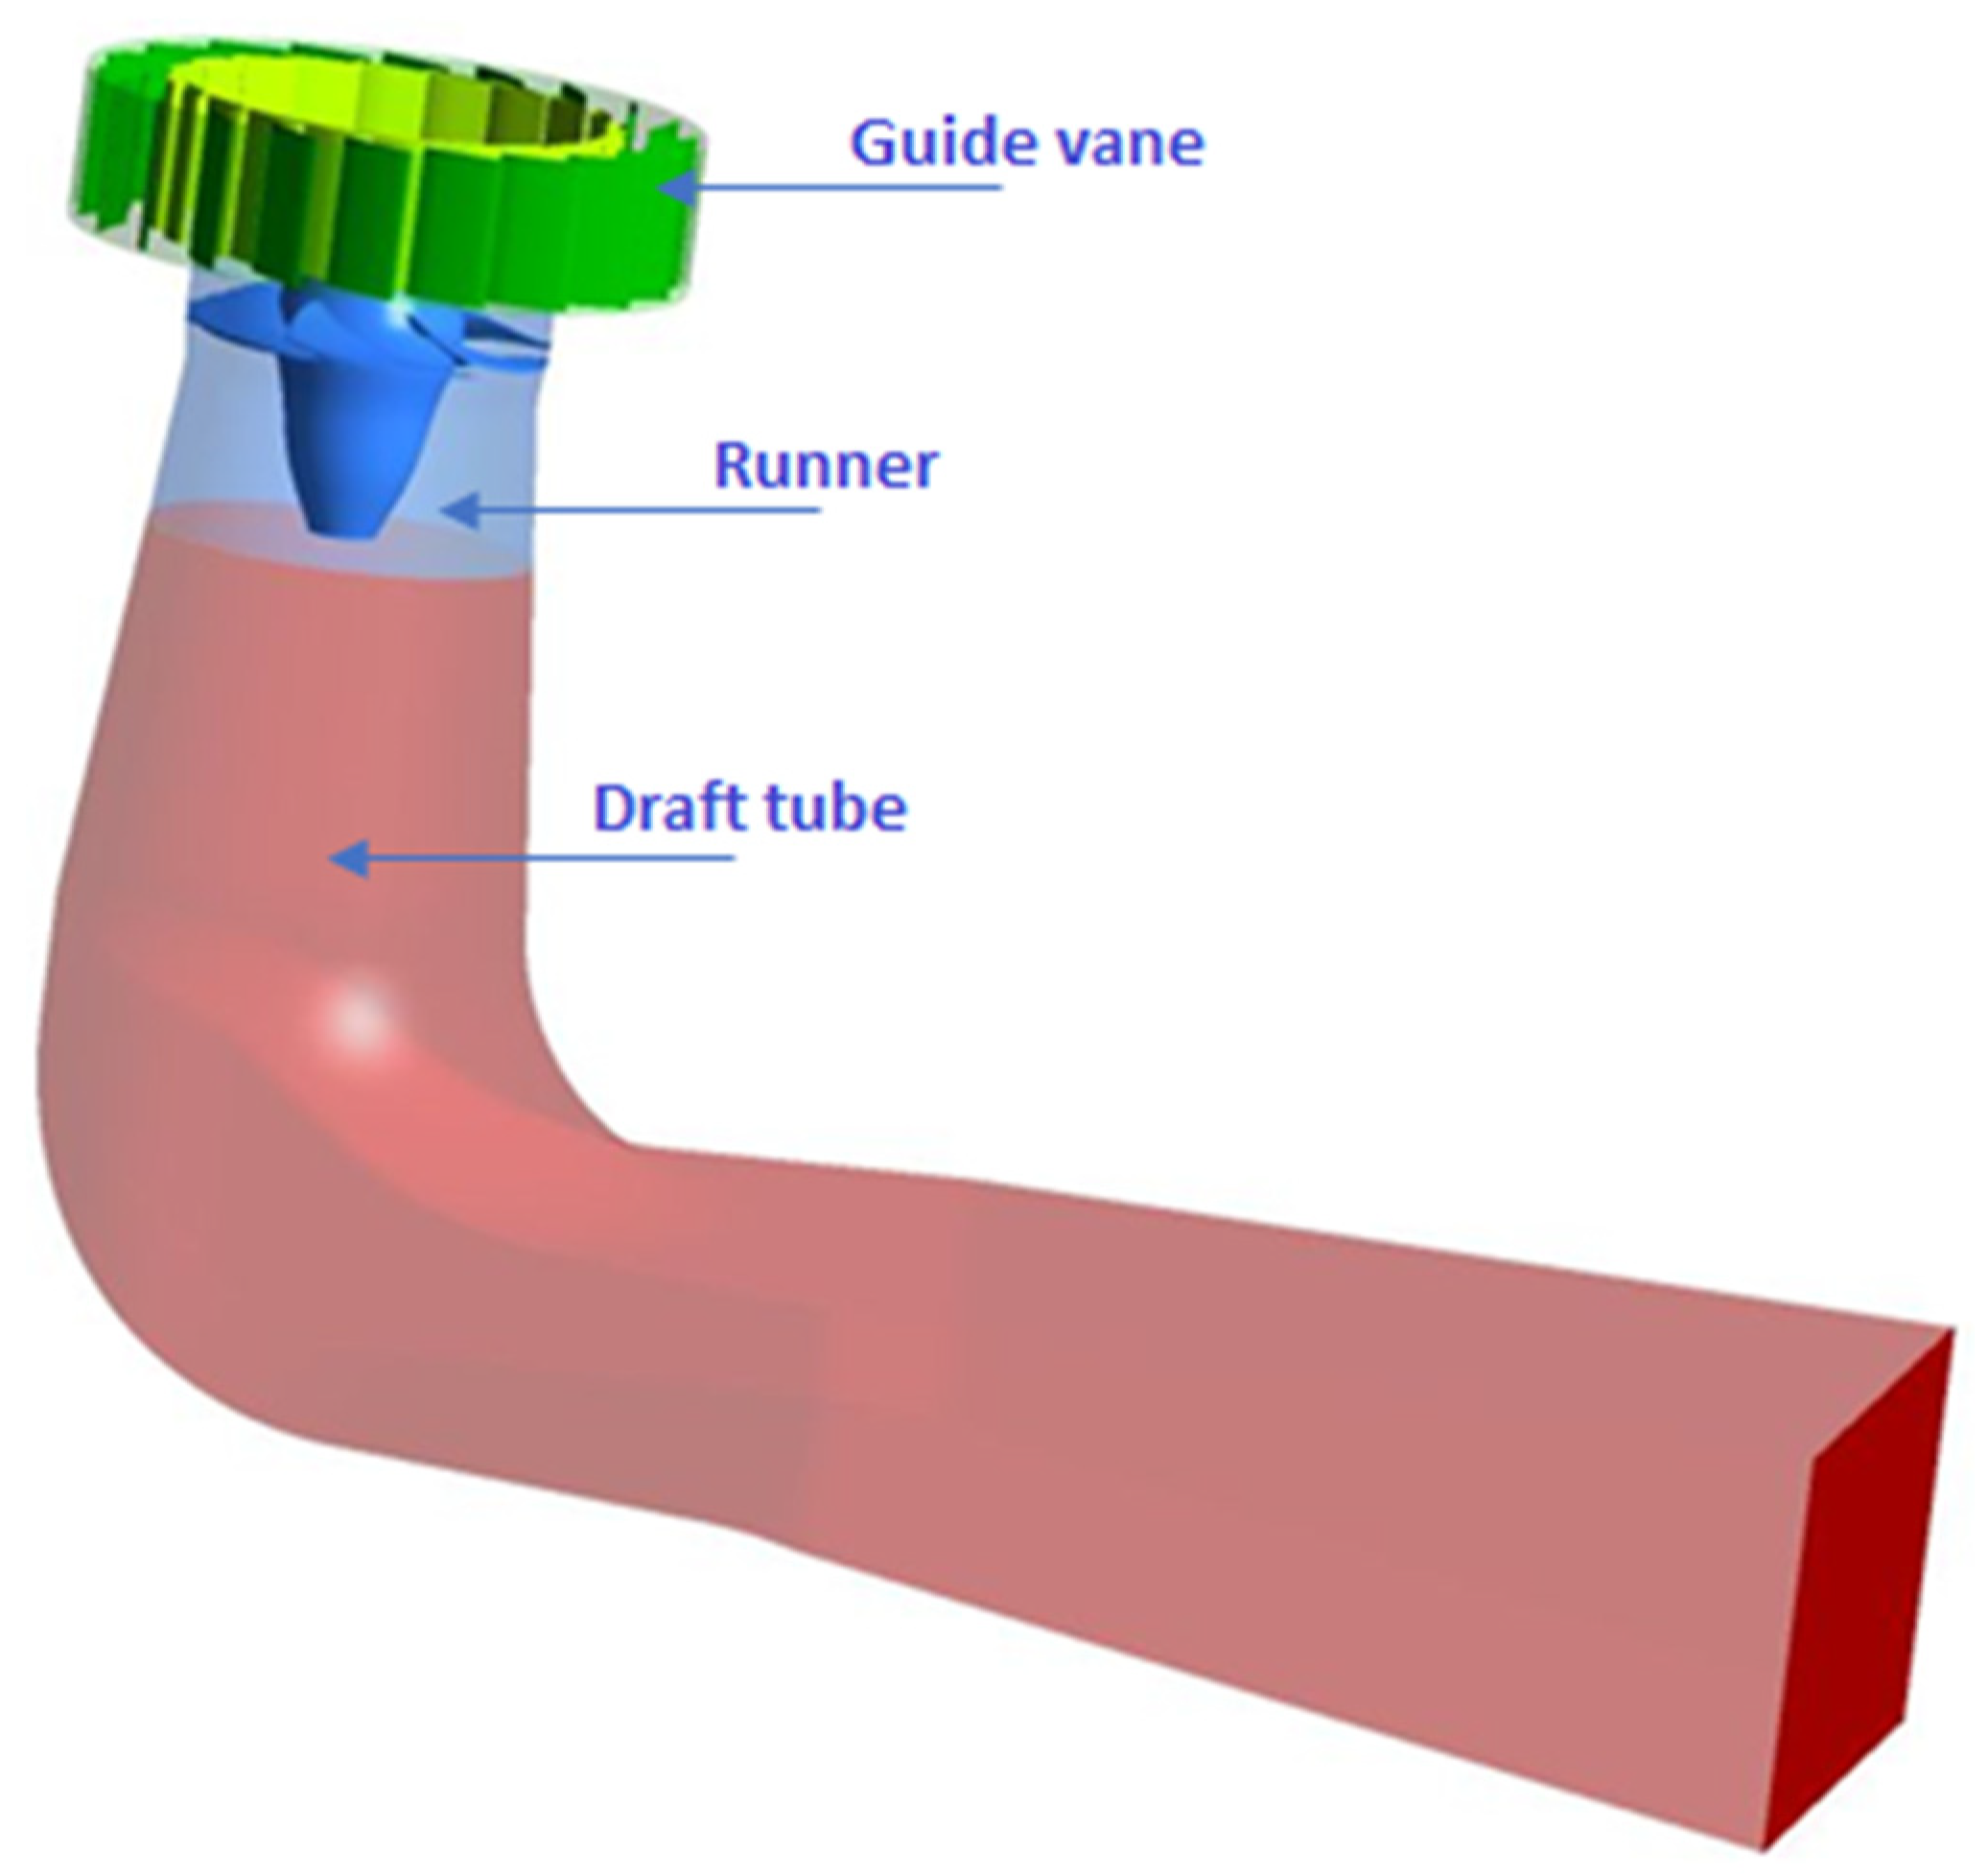
Figure 1. Computational domains.
Energies 15 05072 g001
Figure 2. (a) Real variable hub clearance of the scanned model blade. (b) Constant hub clearance modeled for the prototype blade.
Energies 15 05072 g002
Figure 3. Runner and monitor points on the blade pressure side.
Energies 15 05072 g003
Figure 4. (a) Guide vane mesh. (b) Zoom on the inter-blade mesh.
Energies 15 05072 g004
Figure 5. (a) Runner mesh. (b) Zoom on the inter-blade mesh.
Energies 15 05072 g005
Figure 6. (a) Guide vane flow channel comparison. (b) Runner blade angle comparison. The green area represents the runner hub. Best efficiency point in red and SNL in blue.
Energies 15 05072 g006
Figure 7. Scaled mean absolute pressure values.
Energies 15 05072 g007
Figure 8. Numerical absolute pressure was recorded at P-PS-2 on two opposite runner blades.
Energies 15 05072 g008
Figure 9. Numerical absolute pressure contours in the runner domain.
Energies 15 05072 g009
Figure 10. (a) Amplitude spectrum of the torque. (b) Low-frequency spectrum. Two vertical axes are used; numerical results—red, experimental results—black.
Energies 15 05072 g010
Figure 11. Amplitude spectrum of the pressure at P-PS-4 (pressure side, near the leading edge). Two vertical axes are used; numerical results—red, experimental results—black.
Energies 15 05072 g011
Figure 12. Amplitude spectrum of the pressure at P-PS-2 (pressure side, center area of the runner blade). Two vertical axes are used; numerical results—red, experimental results—black.
Energies 15 05072 g012
Figure 13. Amplitude spectrum of the pressure at P-PS-3 (pressure side, near the trailing edge). Two vertical axes are used; numerical results—red, experimental results—black.
Energies 15 05072 g013
Figure 14. Amplitude spectrum of the pressure at P-PS-6 (pressure side, near the trailing edge, closer to the hub). Two vertical axes are used; numerical results—red, experimental results—black.
Energies 15 05072 g014
Figure 15. Amplitude spectrum of the pressure at P-SS-4 (suction side, center of the blade). Two vertical axes are used; numerical results—red, experimental results—black.
Energies 15 05072 g015
Figure 16. Amplitude spectrum of the pressure at P-SS-3 (suction side, near the trailing edge). Two vertical axes are used; in red are the numerical results and in black are the experimental results.
Energies 15 05072 g016
Figure 17. Evolution of the pressure iso-surface at 205 kPa.
Energies 15 05072 g017
Figure 18. Detail of the pressure iso-surface at 205 kPa showing the vortexes joined in pairs.
Energies 15 05072 g018
Figure 19. Contour plot of the liquid water axial velocity. (a) Complete computational domain. (b) Zoom on the runner domain.
Energies 15 05072 g019
Figure 20. Streamlines coming from (blue) and to (red) the runner blades.
Energies 15 05072 g020
Table 1. Operating parameters of the Porjus U9 Kaplan prototype at SNL.
Operating PointGuide Vane Angle (°)Runner Blade Angle β (°)
SNL3.08−15.23
Table 2. Mesh size and quality parameters of the mesh used in the simulation.
Domain NameMesh Size
(106 Elements)
Minimum Orthogonality Angle (°)Maximum Expansion Factor [-]Aspect Ratio [-]
Guide vane3.645.8341369
Runner12.940.9101481
Draft tube3.1830.597393
Table 3. Experimental parameters used as boundary conditions in the simulation.
ParameterBoundary Condition
Inlet total pressure695 kPa
Outlet static pressure218 kPa
Rotational speed600 rpm
Table 4. Scaled mean absolute pressure values.
Sensor LocationExperimental Values [kPa]Numerical Values [kPa]ε [%]
P-PS-23.83.5−8.6
P-PS-33.73.6−1.0
P-PS-42.32.44.6
P-PS-62.22.514.6
P-SS-31.21.746.0
P-SS-41.62.337.2
Table 5. Numerical and experimental normalized frequency values corresponding to the pressure peaks captured on the runner blades.
Sensor LocationExperimental Values [-]Numerical Values [-]Experimental Values [-]Numerical Values [-]
1st Pressure Peak2nd Pressure Peak
P-PS-20.920.9211.03
P-PS-30.920.9410.99
P-PS-40.920.9210.99
P-PS-60.920.9210.99
P-SS-30.920.9210.99
P-SS-4-0.9410.99
Publisher’s Note: MDPI stays neutral with regard to jurisdictional claims in published maps and institutional affiliations.