Article

Revisiting Home Heat Control Theories through a UK Care Home Field Trial

Faculty of Engineering & Physical Sciences, Boldrewood Innovation Campus, University of Southampton, Southampton SO16 7QF, UK
*
Authors to whom correspondence should be addressed.
Energies 2022, 15(14), 4990; https://doi.org/10.3390/en15144990
Submission received: 30 May 2022 / Revised: 23 June 2022 / Accepted: 4 July 2022 / Published: 7 July 2022
(This article belongs to the Special Issue Human-in-the-Loop Technologies for Occupant Centric Building Control)

Abstract

:
Smart heating controls are being introduced in the domestic sector with the aim of reducing heating demand in buildings. However, the impact of controls on heat demand is not fully understood. This study set out to add empirical evidence to Kempton’s theory on mental models of home heat controls. With this purpose, radiator setpoint records from smart thermostatic valves in 47 flats from a care home in the South of England were evaluated over a 12-month period. Three types of households were identified: (i) low interactors who do not have interaction, or have minimal interaction, with the controls (24.5%); (ii) medium interactors who adjust their setpoint when the outdoor temperature changes and whose behavior is comparable to households that have a “feedback” mental model (49%); and (iii) high interactors who adjust the setpoint based on their own strategy, which does not necessarily follow outdoor temperature changes and reflects a lack of understanding of how the controls work (26.5%). These results highlight the contrast between expected and actual usage of home heat controls, as only half of the residents showed a behavior that is consistent with the principles of operation of the STVs.

1. Introduction

Domestic energy consumption accounts for 29% of the UK’s energy demand, of which space heating represents 60% [1]. As part of its carbon reduction goals, the UK means to reduce its heating demand by (i) making homes more energy efficient, (i) decarbonizing the heat supply by introducing renewable systems, and (iii) encouraging users to uptake energy efficient practices through social interventions [2].
Home heating systems, including controls, play a key role in household energy demand. The most recent extensive survey of heating demand in UK households is the Energy Follow up Survey—EFUS-[3]. This survey shows that 92% of households have central heating systems, which include gas boilers and radiators. Of these, 79% have thermostatic radiator valves (TRVs) in their radiators. It is estimated that 5% of homes upgrade their boilers every year, and when they do so, they are very likely to also upgrade their heat controls [4]. Furthermore, UK Building Regulations require that new builds have heat controls fitted [5]. Given the range of new home heating controls and technologies available for users and building developers, it is of foremost importance to understand how people interact with them and their impact on heating demand and comfort. Currently there is a gap in the relationship between smart controls and energy savings [4,6,7] that needs to be closed.
The way users interact with technology depends on their habits and their understanding of home-heating technologies, by which they generate mental models that represent their belief about how a system and its controls work [8]. The most referenced study on mental models of home heating systems is Kempton’s “Two Theories of Home Heat Control” (1986) [9] where two mental models for thermostats are presented: the “feedback” and “valve” theories. A better understanding of how people interact with heating controls and the mental models they develop would contribute to more accurate prediction of heating patterns, adequate selection of equipment for new builds and retrofits, and fit-for-purpose design of new technologies.
This paper aims to increase the understanding of home heat controls and add empirical evidence to validate Kempton’s theory on mental models of heat controls [9]. With this purpose, an analysis of users’ engagement with heating controls is presented for a care home in England. This study continues the preliminary analysis presented at the IEA Annex 79 Expert Meeting & International Symposium on Occupant Behavior [10]. Firstly, a literature review presents the key aspects of heat usage in care homes and evaluates the state of knowledge of smart heating technologies, highlighting usability of home heat controls and users’ mental models. Furthermore, the setpoint temperature records from smart thermostatic valves from 47 flats in a care home in Portsmouth, UK are analyzed. The characteristics of control usage are summarized by evaluating methods of engagement with controls, heating patterns, and performing a direct comparison to Kempton’s theory on heat controls mental models.

2. Background

2.1. Heat Demand in Care Homes

Care homes are facilities that provide accommodation and care for people who need it. In England and Wales, 3.2% of those aged 65 and over reside in care homes, reaching almost 14% in the over-85 age band [11]. Given that care homes host a specific type of residents, their heat demand is expected to present distinctive characteristics [12]. The way people consume heating, including their desired temperatures and usage patterns, is deeply rooted to their sociodemographic characteristics [4,13,14,15,16] and the technology available [15,17,18]. People’s activities, occupancy patterns, comfort requirements, and financial situation all have an impact in how people consume heating.
Hanmer et al. [15] speaks of “thermal routines” to refer to the activities occupants perform throughout the day to achieve comfort. The comfort requirements of the elderly are different from those of the main population. Guerra Santin [19,20] evaluated user profiles and heating behavioral patterns, showing that senior residents preferred higher temperatures and a higher degree of comfort. Jones et al. [2] also showed evidence for higher temperatures in social housing residents above 50 years of age. Finally, Lewis et al. [21] indicated that not only do elderly populations require higher temperatures than the average in order to feel comfortable, but they are also more reluctant to engage with any type of control or system monitoring. Furthermore, a study on heating behavior in UK households [22] highlighted that elderly residents consider that feeling warm is very important, particularly in relation to health. Moreover, elderly residents were found to be unlikely to change their heating behavior, including both their usage patterns and how they interact with controls, as most believed they were using their heating correctly.

2.2. Smart Heating Controls

Smart heating controls are defined by Munton et al. [4] as “a group of technologies that, installed into a domestic heating system, seek to facilitate the centralized control of heating”. They can be classified into active and passive. The first aim to increment or improve the level of control of users. The second, passive controls, learn users’ behavior to maintain comfort aiming to decrease energy demand. Smart thermostatic valves, such as those analyzed in this study, fit in the first category.
Given the theoretical potential for energy reduction of smart heating controls, both active and passive, the UK government developed the “Smarter Heating Controls Research Programme” [23] to evaluate if this claim has any validity, and why, by evaluating usability and user’s perception of controls. Other studies have indicated that adding heating controls, and, in particular, smart heating controls, may not show the expected results in energy reduction. Shipworth et al. [24] compared modeling assumptions to actual room thermostat settings, indicating that there was no evidence of controls reducing temperature setpoints and or heating hours, and called for more data collection. Dyson [25] evaluated the impact of smart heating controls system in UK homes. Results did not evidence a reduction in energy demand but did show an increase in comfort with the use of zonal heating. Finally, Miu et al. [26] highlighted that people may not use smart controls as expected; each user has their own interpretation of the system and develops strategies accordingly. Further research is needed to understand what makes a control, and a smart one in particular, successful.

2.3. Usability of Controls and Mental Models

Heating patterns and potential energy savings from smart technologies depend on both a system’s design and on people knowing how to use it. In relation to usability, some key aspects about the design of a system can be highlighted. A UK government study [27] evaluated different types of smart heating controls available in the market, showing that none of the devices were perceived as effective by the users, resulting in frustration when interacting with the controls. The key characteristics that worsened the usability of the controls were the iconography used, the lack of clarity of information about the system’s operation, the difficulty in identifying the system’s state, and the lack of feedback. The smart controls evaluated in the study showed less usability amongst users of old age and or those having visual impairments, which is of particular importance in the context of a care home. Furthermore, Day et al. [6] also evaluated the factors that affect the interaction of users with room thermostats, highlighting interface design, access of control, placement, and need of training, as key factors for a technology to be successful.
A user’s understanding of controls is related to ’mental models‘, meaning internal constructs that people generate to represent how controls work [8]. In 1986, Willett Kempton identified two theories or mental models of thermostat usage, and hypothesized that the choice of one or the other had an impact on energy demand [9]. The two theories were classified as “feedback” and “valve”. Users that hold a feedback theory believe that the setpoint in the thermostat determines the on/off temperature, and that the heating system operates at a constant speed; the heat ratio of the system does not vary with the setpoint. Feedback users tend to adjust their thermostat based on changes in their desired temperature, and they usually do so when the occupancy or their activity changes. The setpoint may remain constant for multiple days until changes in outdoor temperature or activities trigger a change in their comfort preferences. In contrast, those that develop or hold a valve theory believe that the thermostat setpoint regulates the heat ratio of the system. Similar to a water tap or gas knob, the higher the setting (the setpoint for a thermostat), the higher the flow (of heat for a heating system). These users will interact with their thermostats frequently, setting higher setpoints when they want the room to heat faster.

2.4. Thermostatic Radiator Valves (TRVs)

The mental model a user has of a technology determines how appropriately” they operate it. In the case of thermostatic radiator valves (TRVs), Revell and Stanton [8] defined their main characteristics and potential sources of misunderstanding. TRVs are slow-response controls which, despite their name, do not actually work like a valve. The setpoint in a TRV does not regulate the volumetric flow of hot water that goes into the radiators; this is a constant value. Instead, it specifies a maximum temperature at which the valve will shut off all flow of water. The level of response and feedback of a system can impact how people perceive it, in addition to their sense of control over their own thermal comfort. This determines how people use heating controls and consequently affects their energy consumption [6]. Despite the relevance of the way users interact with their heating systems, most users do not receive any training or education about how to use their home heat devices and controls.
Furthermore, Revell and Stanton [8] suggest that possible improvements to the TRV design would be to use a temperature scale instead of a numeric one, and to indicate that this value represents a limit and not a target. The setpoint selected in the TRV represents the maximum limit of the indoor temperature; however it is not ensured that this temperature target will be achieved. Radiators have a limited capacity; the setpoint temperature may never be achieved if the system is undersized or the heat losses in the room outweigh the gains. The valves analyzed in this study are a type of smart thermostatic valve STV) that incorporate this suggested improvement. They operate in the same manner as a TRV but aim to provide more clarity by showing the value of the temperature setpoint on a screen.

3. Case Study

The case study analyzed is a care home for elderly residents located in the city of Portsmouth in the south-east of England. It is a social housing complex that offers rented apartments. The building consists of a three-story 1984 traditional masonry construction comprising 80 flats having similar layouts. Most living units are one-bedroom properties (N = 64) of approximately 40 m2. The remaining units consist of a combination of studio (N = 8), and two (N = 6) and three-bedroom (N = 2) flats. Figure 1 shows a general layout of the building and a typical flat.
Regarding systems, the building is naturally ventilated, free running, and has a high temperature (60 °C) water-based heating network that provides heating through radiators to all flats and common areas. Unlike the majority of UK households, these flats do not have room thermostats or timers [4]; they have radiator valves as the sole point of control of the heating. Windows can be opened freely. It is important to note that heating is not metered; instead, residents pay a fixed rate based on the flat’s square footage. Consequently, heating usage is unlikely to be impacted by financial limitations and higher setpoints are expected [15,16].
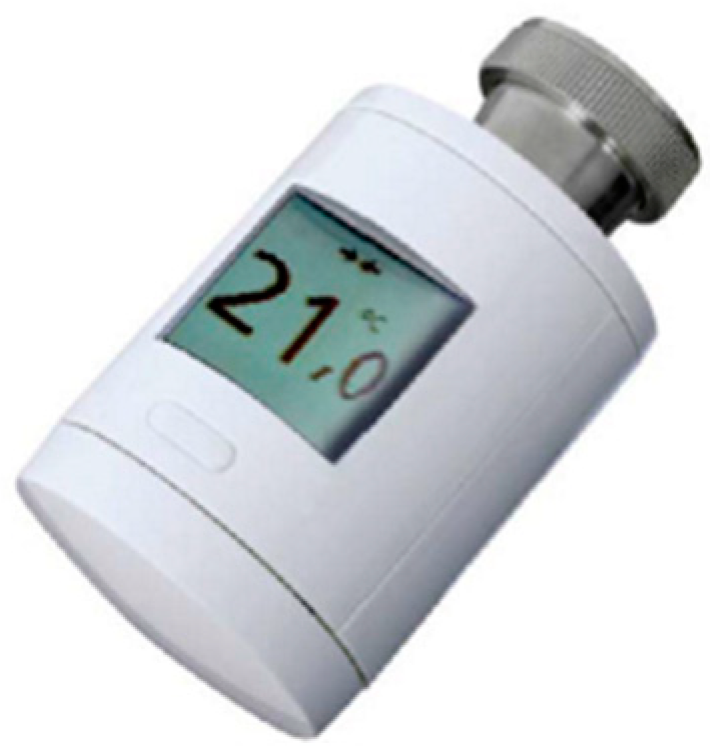
At the beginning of 2019, as part of THERMOSS—a European project to evaluate the impact of different heating technologies [28], the heating system in the building was upgraded. This involved replacing all the existing manual radiator valves with smart thermostatic valves (STVs). The devices selected were HORA SmartDrive MX valves, which allow users to set their desired setpoint temperature, and can both send data and receive commands (Figure 2). A bespoke communication system was deployed in the building to monitor the following parameters from each valve: (a) setpoint temperature, (b) water supply temperature, (c) valve position, and (d) room temperature.
It is important to highlight some characteristics of the valve that may affect how users interact with them. First, the screen only lights up when the dial is turned and remains on for less than a minute afterwards. Additionally, there is no indication of which direction to rotate the cap of the valve to increase or decrease the setpoint, and there is no limit to the rotation of the cap. Even if the lower and upper limits of 10 and 30 °C, respectively, are reached, the cap of the valve can still be rotated. It should also be noted that residents were not involved in the selection of the equipment, nor do they normally participate in decisions about the building’s systems. Additionally, installers, who are generally more familiar with user-specific needs, and tend to choose simpler equipment for elderly users [29], were not involved in the selection of the equipment. The valves were selected by project members.
The participants of the study are the residents of the building, which, being a care home, hosts residents over the age of 55. The site operates with non-resident management staff 24 h per day as residents may need assistance in their everyday activities due to health reasons. These may include cognitive and physical impairments which can limit their mobility and or their capacity to understand and control the heating in their flats [8]. It is estimated that up to 70% of care home residents have dementia or severe memory problems [30], and the typical occupancy in flats in care homes is one person [31]. However, the authors assume that, in the case study building, the proportion of residents having physical or cognitive impairments is lower than 70%. The site offers independent living with assistance when needed; as shown in Figure 1, each flat is an independent home, having its own kitchen, bathroom, bedroom, and living area. The authors assumption of residents being fairly independent is also reinforced by personal experience when interacting with the residents. Multiple visits to the site were performed throughout the project and each flat was visited individually for the installation of the STVs and commissioning of the monitoring system. Regarding the data recorded, residents were able to opt out from the monitoring study and to have their data excluded from the analysis.

4. Study Design

4.1. Data Cleaning

The analysis presented in this paper derives from the examination of the setpoint and room temperature records from the smart thermostatic valves inside the flats of the case study care home. The period of analysis was 15 March 2019 to 30 Apr 2020. However, between July and October 2019, no data were recorded because the communication system was not functioning. The valves were set to transmit a reading of all of its operation parameters (setpoint temperature, water supply temperature, valve position, and room temperature) every 5 min. Additionally, whenever there was an interaction, meaning that someone rotated the dial of the valve, an additional reading was created in the 5 min records. This means that each valve had a dataset containing unique timestamps and numbers of observations.
Of the 80 flats in the building, 2 residents asked not to have the smart thermostatic valves installed,13 requested to be removed from the monitoring study, and 3 flats were empty throughout the monitoring period. Additionally, all the studio flats (4) were excluded from the analysis. This resulted in 61 properties available for analysis. For each STV, the flat number and their location within each flat was available (bedroom, living room, bathroom, kitchen, or hallway). The dataset from the 61 participating flats was separated by room and inspected to evaluate data quality. Only the living room and bedrooms records were used in this study. In the case of two- (N = 5) or three-bedroom flats (N = 2), only the main bedroom was included. A first inspection of these two datasets (living room and bedroom) showed high intermittency in the records due to problems with the communication system. Some valves never communicated, others sent data for only brief periods of time, and others intermittently; this varied even within each flat. As a result, data from different flats were available for each room: living rooms (N = 43) and bedrooms (N = 47), with only 34 flats in common across both rooms.
Given the irregularity of the datasets, minimum quality conditions were set for short- and long-term analysis. For short-term analysis, the following requirements were set at a daily level: (i) minimum of 12 h of data and (ii) maximum data gap of 3 h. For long-term analysis, only valves having at least 30 complete days, meaning days that fulfilled requirements (i) and (ii), were used in the analysis.
In relation to daily level conditions, the 12 h minimum (i) was set to enable the capture of residents’ occupancy patterns. The 3 h maximum gap (ii) was set to capture occupant’s reactivity to outdoor temperature. To determine this gap, the speed at which the variation in outdoor temperature results in a change in indoor temperature was estimated by comparing the thermal capacitance of the building with the observed outdoor temperature variation during the monitoring period. Following the work of Turner et al. [32], a typical one-bedroom flat was modeled to evaluate the thermal decay of the property. Two scenarios, windows closed and fully open, were simulated, resulting in thermal constants of 33 and 28 h. The maximum hourly outdoor temperature variation observed during the monitoring period was 4.75 °C. Based on the thermal constants obtained, it would take between 5.3 h (with windows open) and 6.3 h (with windows closed) for this change to occur in the indoor temperature. This excludes the effects of solar irradiance, internal gains, and heating on the temperature variation. Based on this, it was considered unlikely that occupants would react to outdoor temperature variation within less than 3 h.
Overall, data cleaning resulted in losing an additional 9 flats and almost 10% of daily data. The final datasets included data from a total of 47 flats: 30 in common across living room and bedroom, 9 with only bedroom records, and 8 with only living room records (living room N = 38, bedroom N = 38).

4.2. Identification of Interactions with STVs

The first step of the analysis was to identify the types of interactions occupants have with the STVs. This was done by looking for changes in the setpoint temperature. When multiple setpoint changes occurred within 5 min, they were considered to be part of the same interaction. Interactions were classified based on the number of movements (single or multiple) and the change in the value of the setpoint, resulting in three types of interactions, as summarized in Table 1. This distinction helps to understand how occupants use the system. An interaction of type A is a straightforward change in the setpoint; it involves only one movement resulting in a change in the setpoint. Type B involves multiple movements, whether gradual steps in one direction or a combination of up and down changes, resulting in a change in the setpoint. Finally, type C consists of a series of movements that result in a setpoint that is that same as that at the start of the interaction. Given that the screen of the STVs only lights up when rotating the cap of the valve, this interaction was labelled a “control” movement, meaning that its purpose is to check or control the setpoint without the intention of changing it.
It should be noted that, given the intermittency of the dataset, some setpoint changes were reported at a later time when the valve next connected with the communication system. If the disconnection time was more than 12 h, the setpoint change was not marked as an interaction, as it could not be allocated to a specific time.

4.3. Grouping

The flats in each dataset, living room and bedroom, were grouped according to the total number interactions of types A and B, meaning interactions where the setpoint changed. As the time and length of the monitoring varied across valve, a weighted count was used to compare across flats. The count of interactions was weighted by the length of the monitoring records of each valve. The distribution of the weighted number of interactions was inspected, and the lower and upper quantiles were selected as limits for grouping (Figure 3). This resulted in three groups of low, medium, and high levels of interactions for both living rooms and bedrooms.
The following step was to compare the level of interactions in each group across different levels of heating degree hours and hours of the day. The first step consisted of normalizing the datasets across flats. Given the intermittency of the data transmission, different flats reported data during different periods, resulting in a variable number of observations for each hour of each day. Hence, the number of interactions was weighted by the number of observations from each valve during each period of evaluation (whether HDH range level or hour of the day). When evaluating interactions against heating degree hours, there was a second step that consisted of normalizing across HDH levels, based on the frequency with which each level was observed during the monitoring period. Finally, to compare across groups, results were scaled to 100 flats per group. A timeline comparison was not possible due to the intermittency of the data within and across flats.

4.4. Weather

For the calculation of heating degree hours, weather records from a local weather station were used. This station was installed on-site in 2018 as part of the THERMOSS monitoring study. The resolution of this dataset was five minutes and, in contrast with the STVs, the quality of the dataset was very good. Heating degree hours (HDH) were calculated for each day using a base temperature of 15.5 °C, following the UK’s Chartered Institution of Building Services Engineers Degree Days calculation method [33].

5. Results and Discussion

5.1. Occupant’s Perception of the Smart Thermostatic Valves

The researchers that coordinated the study monitored the installation of the smart thermostatic valves in the building and performed follow up visits to flats to correct problems with the monitoring system. Upon these visits, conversations with residents and site staff members were held about the STVs and residents’ perception of them. The comments reported here were derived from informal records of these visits.
The initial response from residents was not positive and staff members were contacted regularly by residents to complain about the controls. The most reported issue was lack of visibility, in terms of both not being able to see the number on the screen clearly and having to turn the valve for the screen to come on. Another commonly reported issue was not knowing in which direction to turn the STVs, as there is no indication of this on the device. Moreover, many residents reported that they could not achieve the same level of heating as before, even when setting the setpoint at 30 °C (maximum setpoint).
The success of a technology, in terms of user engagement and acceptance, can be determined by a user’s perception of its usefulness and their acceptance of technology in general [34]. In the case study, most complaints referred to usability aspects of the STVs, particularly the graphical interface. Residents did not perceive the STVs as being either useful or easy to use. Regarding their attitudes, elderly residents are unlikely to change their behavior or embrace new technologies [22]. Furthermore, the one characteristic of the valves that could be perceived as most useful is the possibility of selecting the desired ambient temperature. However, this differs from the valves that were originally fitted in the building (manual on/off valves), which adds extra difficulty to the adaptation of residents to the new system.
Overall, the feedback obtained from residents and members of staff highlights the importance of considering the end user and their needs. In this case, the equipment was selected by researchers in view of the potential monitoring capacity and residents were not involved. According to Munton et al. [4], in UK homes it is generally more common for installers to make decisions about the heating systems and controls, excluding consumers from decision making. In an environment with residents having specific physical and cognitive characteristics, such as a care home, it is paramount to consider their limitations and preferences.

5.2. Group Characteristics

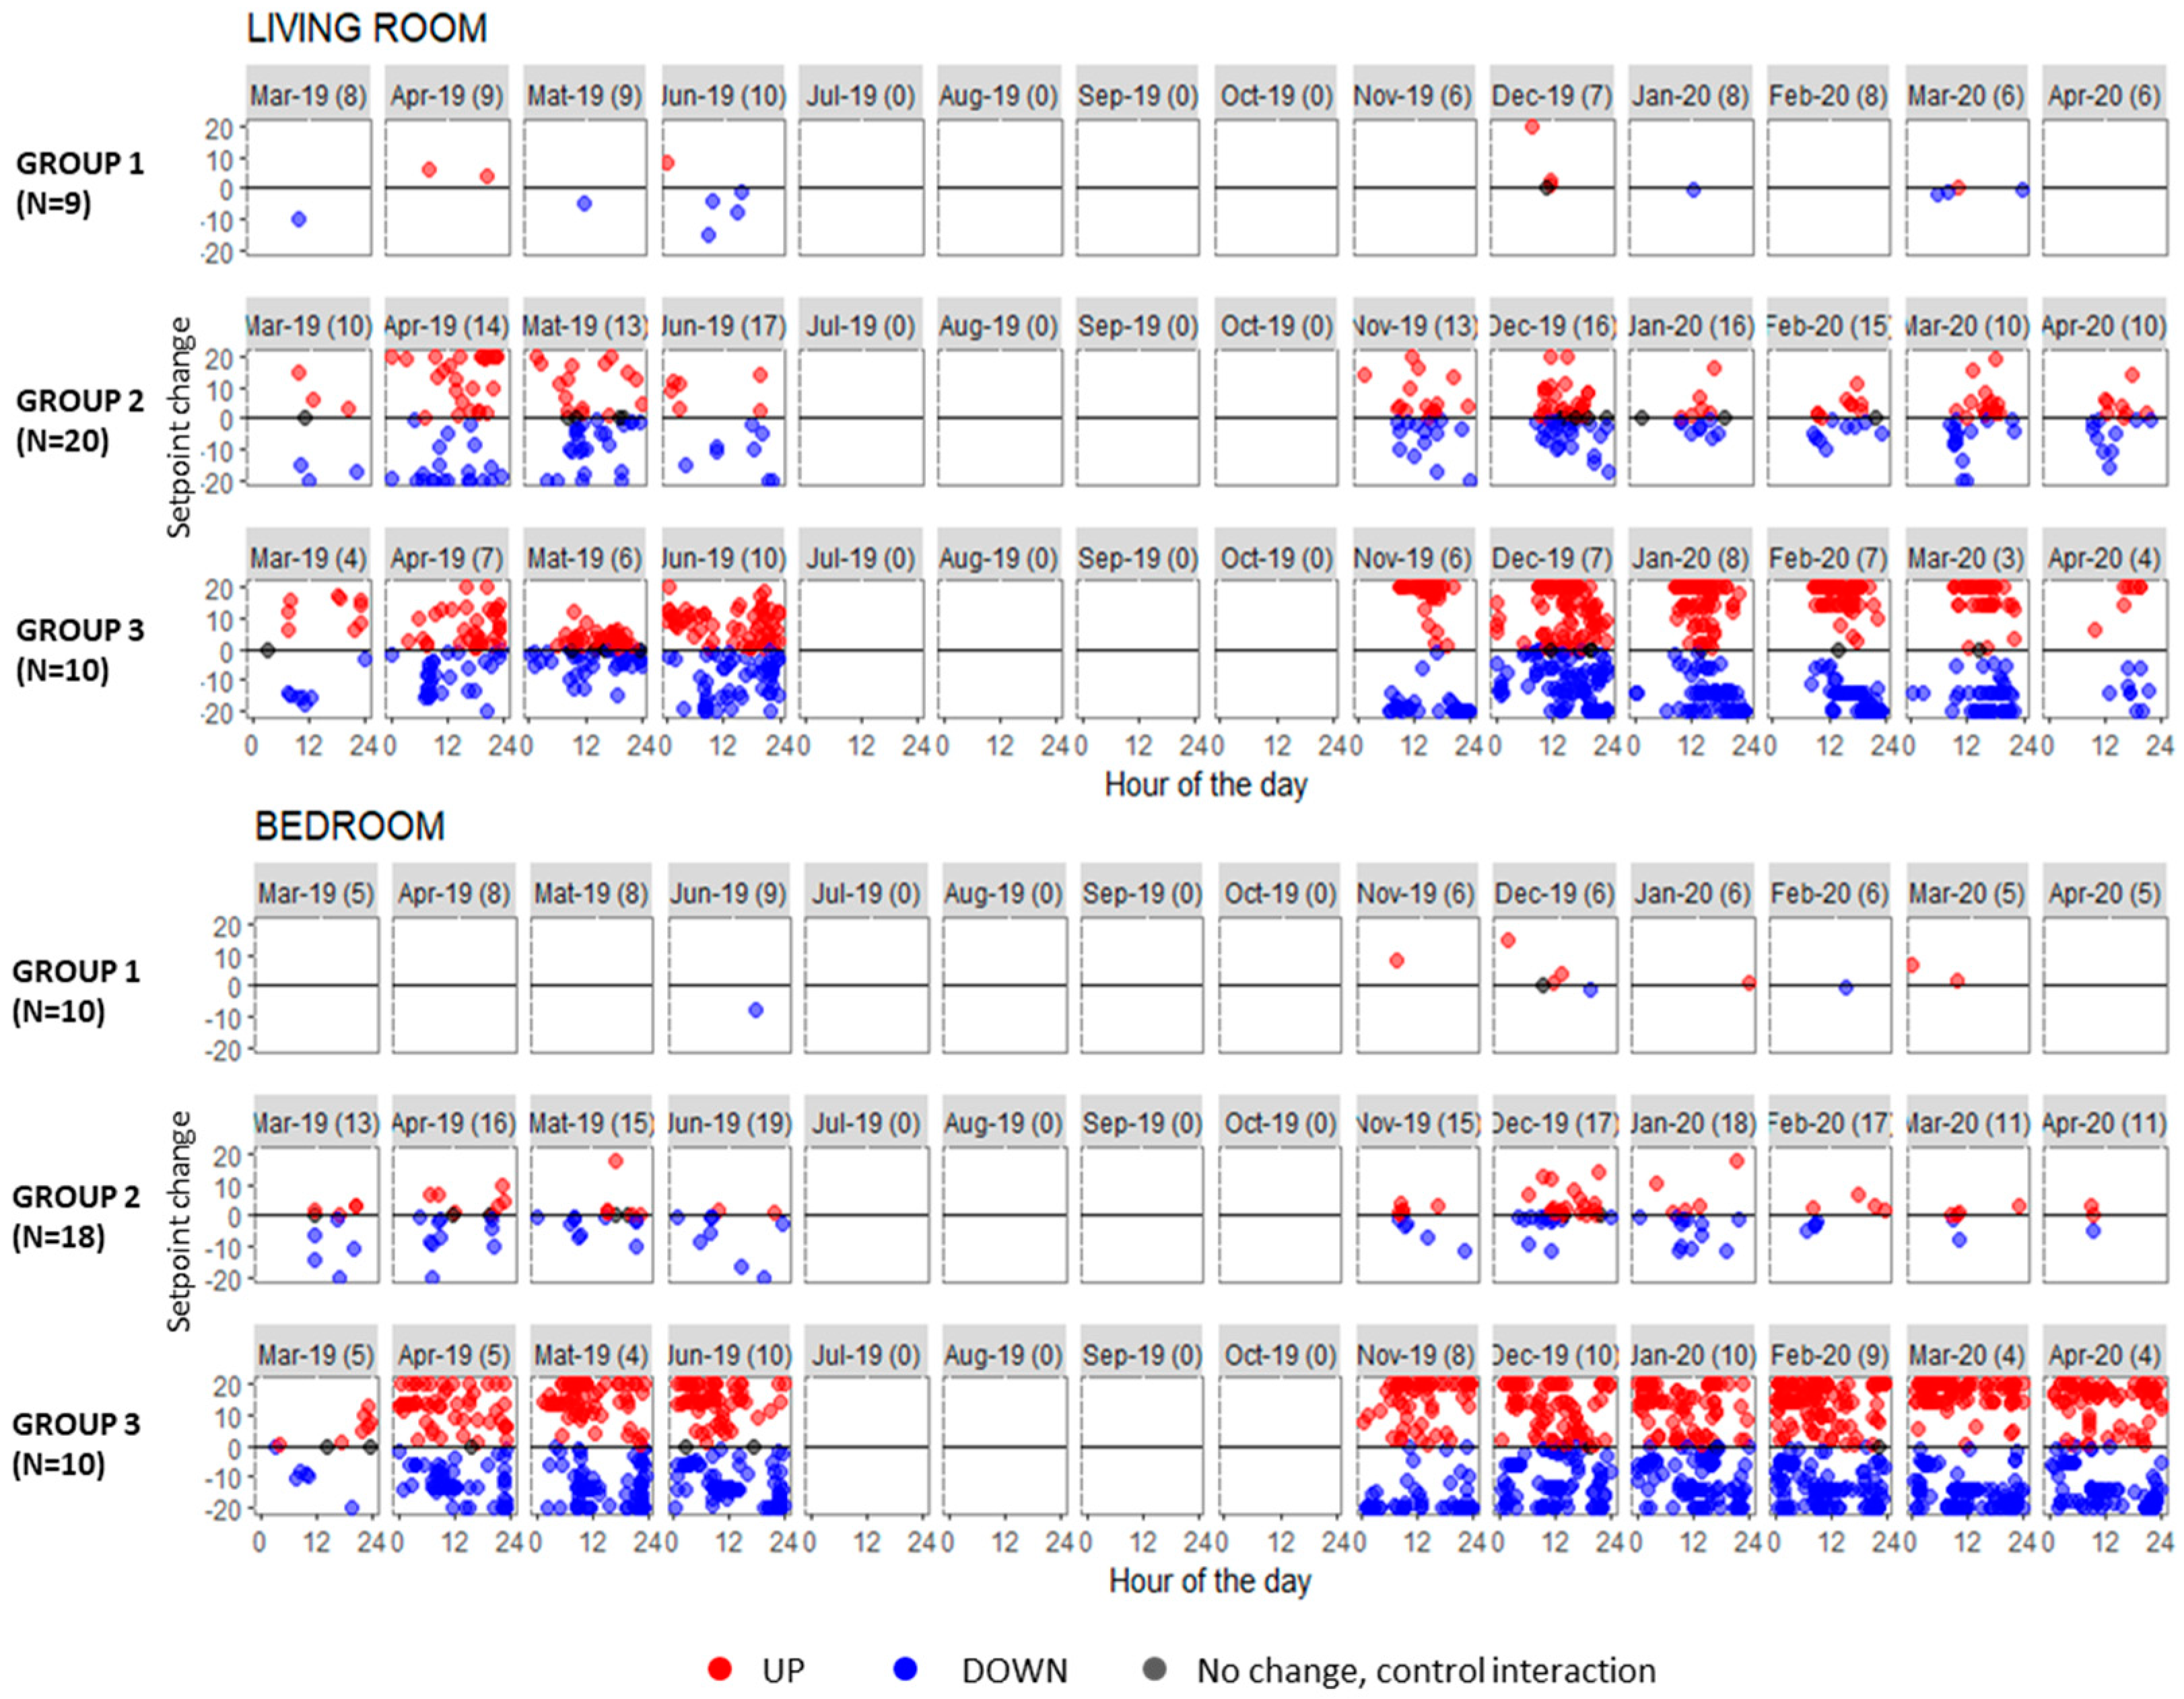
As described in Section 4, the flats from each dataset, bedroom (N = 39) and living room (N = 38), were divided into three groups based on their level of interaction with the STVs. Groups 1 and 3 are comparable in size and represent around 25% each of bedrooms and living room samples. Group 2 represents 51% of the bedroom sample, and 47% of the living room sample. Figure 4 shows all the interactions identified by group, by hour of the day, and by month. This timeline highlights the differences across the numbers and types of setpoint changes in each group, in addition to the irregularity and/or intermittency of the datasets. A summary of the main characteristics of each group is presented in Table 2.
First, the indoor temperature distributions were significantly different, both when comparing across rooms and across groups for each type of room. The medians of the mean daily temperatures ranged between 22.9 and 24.0 °C in living rooms, and 22.4 and 23.4 °C in bedrooms. As a comparison, the Energy Follow up Survey (EFUS) reports mean temperatures of 20.2 and 19.4 °C for living rooms and bedrooms, respectively, in English households [3]. As shown in Section 2.1, higher indoor temperatures are expected in a care home. The difference in indoor temperatures cannot be attributed to the variability in heat control strategies alone; other comfort strategies such as opening windows may play an important role. Furthermore, all groups showed a small percentage of “control” interactions (type C), in which the setpoint was not changed. This may be evidence of occupants wanting to confirm the setpoint value.
The differences in the setpoint distributions and in the number of interactions across groups suggest that each group has different thermal comfort strategies and mental models of the smart thermostatic valves. First, group 1 is composed of low interactors; the setpoint is either never changed (a third of the groups show zero interactions) or changed only once or twice throughout the year. It is not known whether this is because users did not need to interact with the controls or because they could not. It may be that these residents have low mobility, and thus could not engage with the heating controls. Another option is that their heating patterns only respond to seasonal or long-term temperature variations. The number of movements is too small to hypothesize about their mental models.
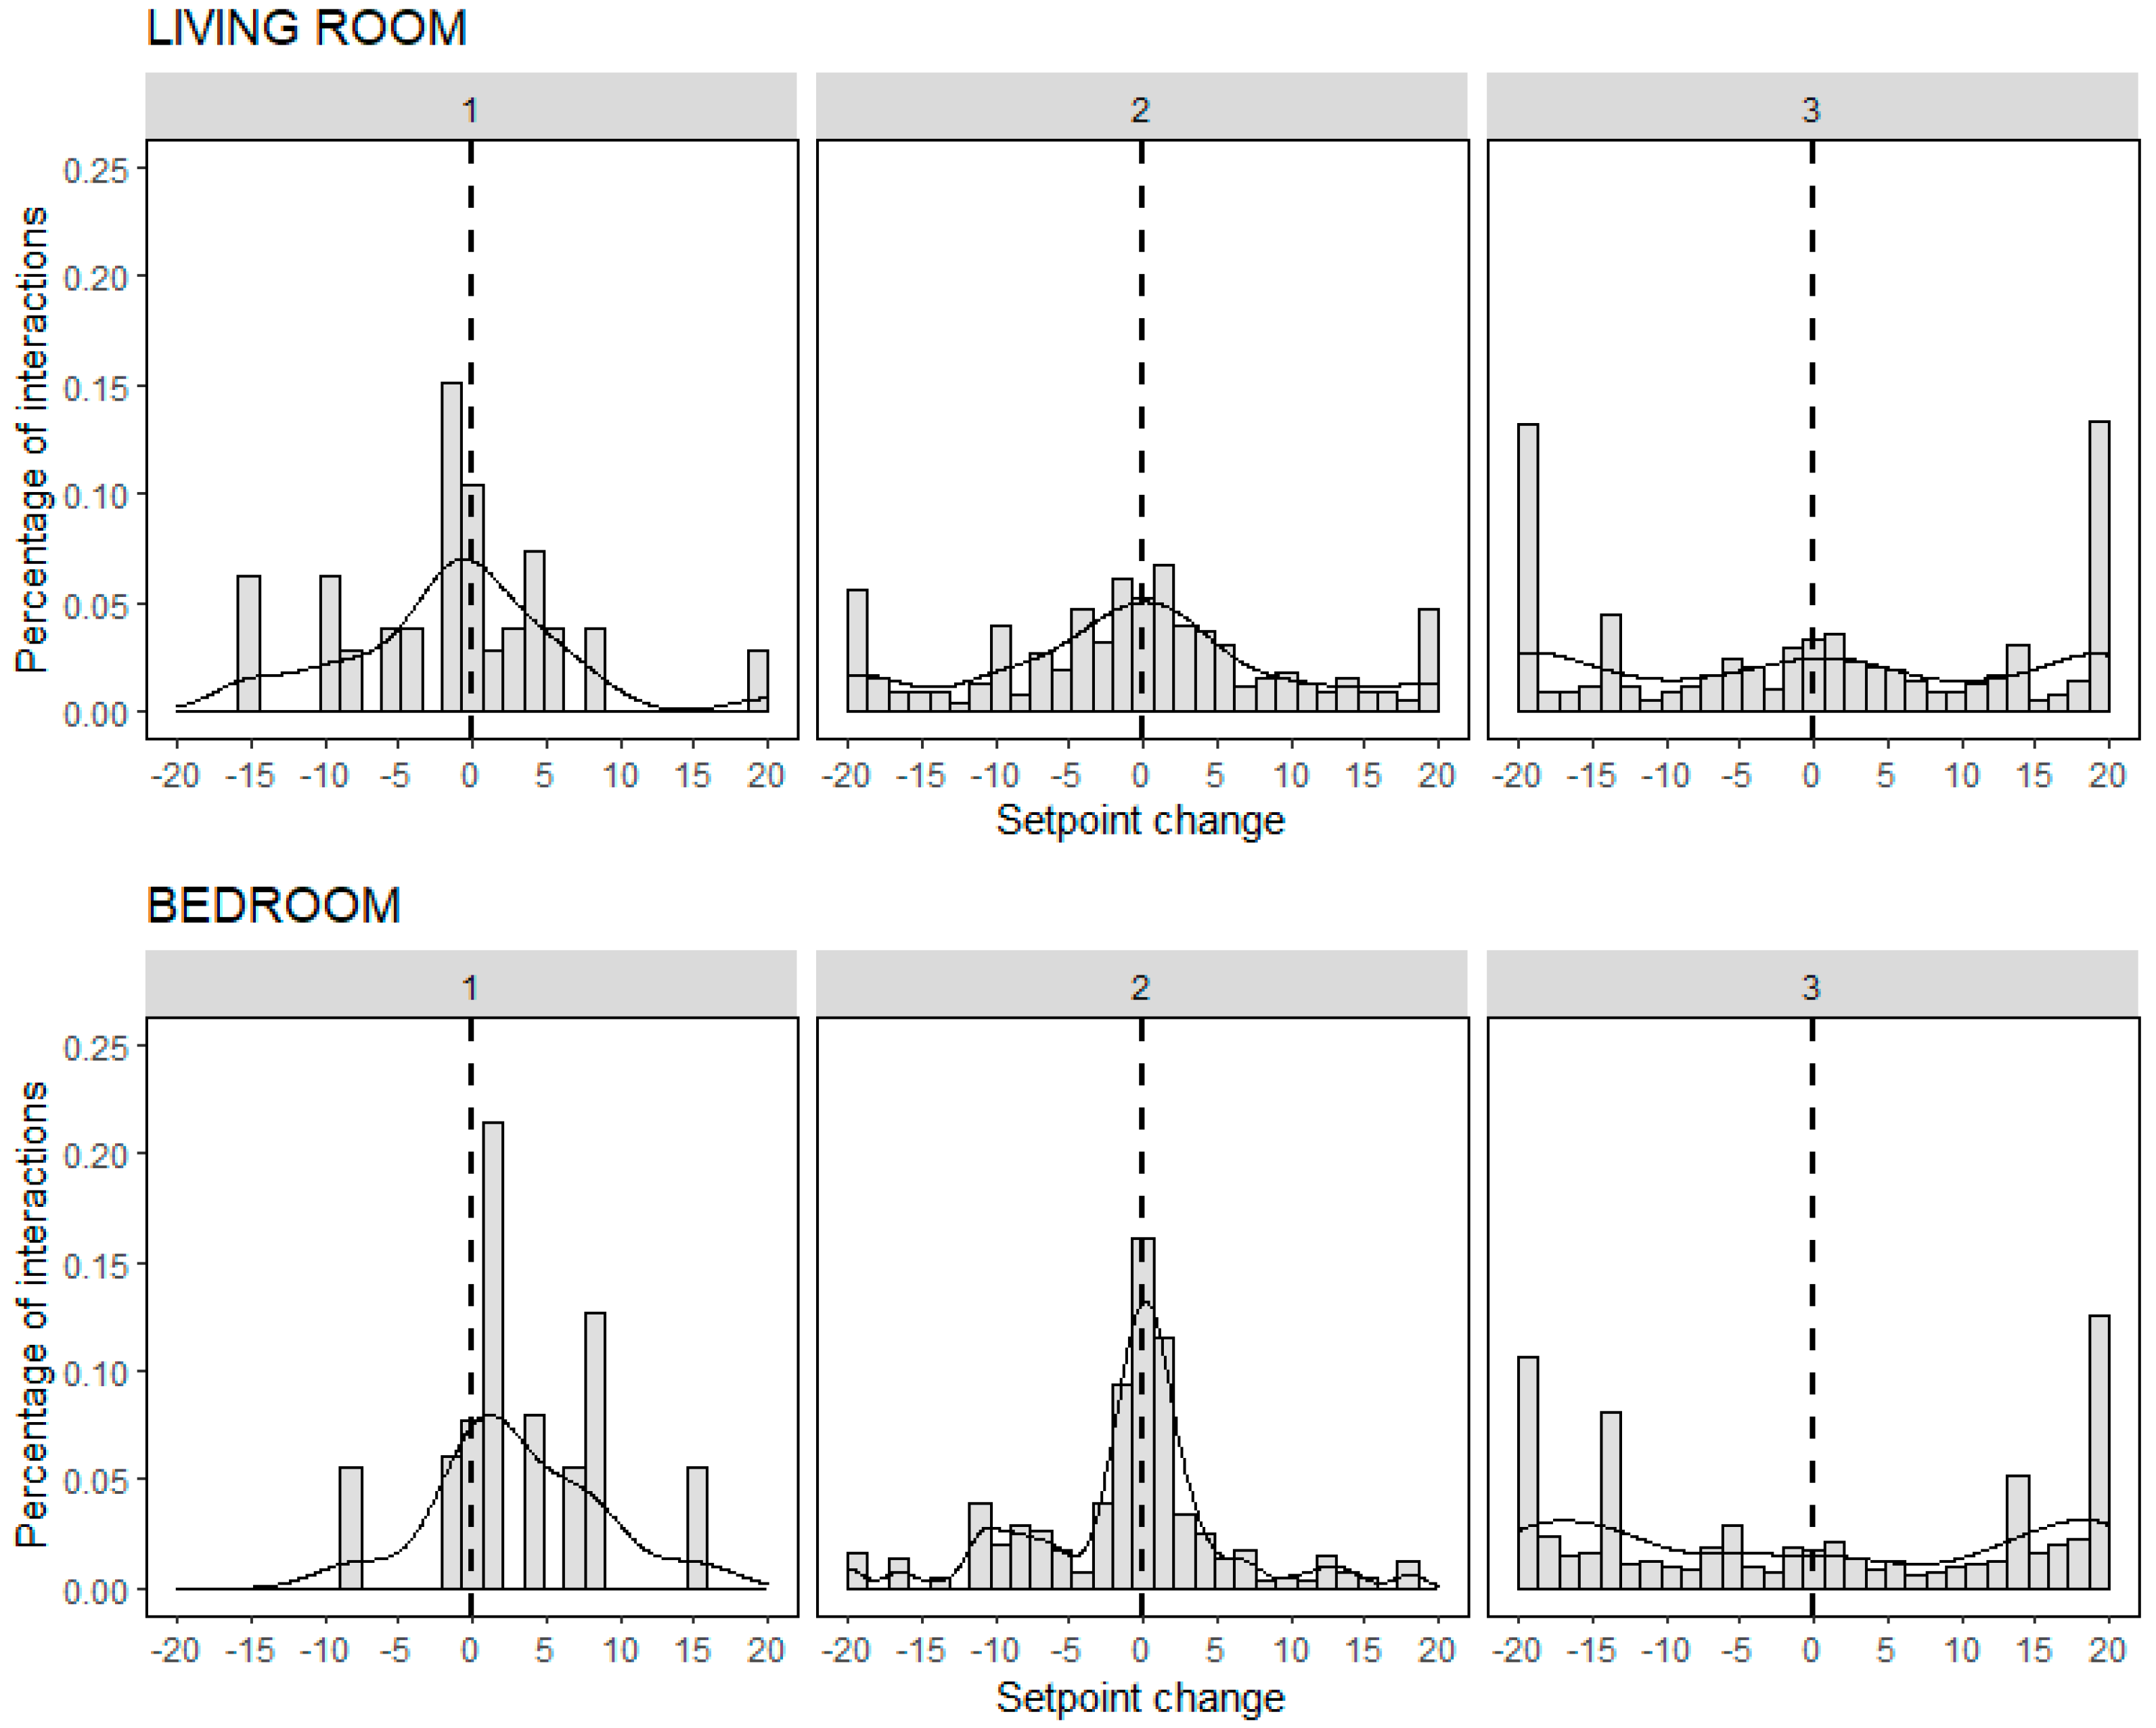
In contrast, groups 2 and 3 show higher levels of interactions with the STVs. Flats in group 2 exhibit multiple setpoint changes across months, and those in group 3 change their setpoints on an almost daily basis. Furthermore, looking at the type of interaction, flats in group 3 display a wider setpoint range, meaning that they alternate the setpoint between extreme values. These characteristics are further evidenced in Figure 5, which shows the types of setpoint changes for each room and group.
Regarding the evolution of the interactions during the monitoring period (Figure 4), the highest number of interactions in groups 2 and 3 occurred during December, which is in the middle of the heating season and is also expected to be a period of higher occupancy. Morton et al. [35] evaluated the interaction of residents with heating controls in 12 houses, showing that peak interaction occurred during the heating season and was lower during shoulder months. Because of the intermittency of the dataset, however, the number of flats that recorded data differed in each month across groups. Hence, analyzing the monthly progression of interactions is not possible.

5.3. Mental Models

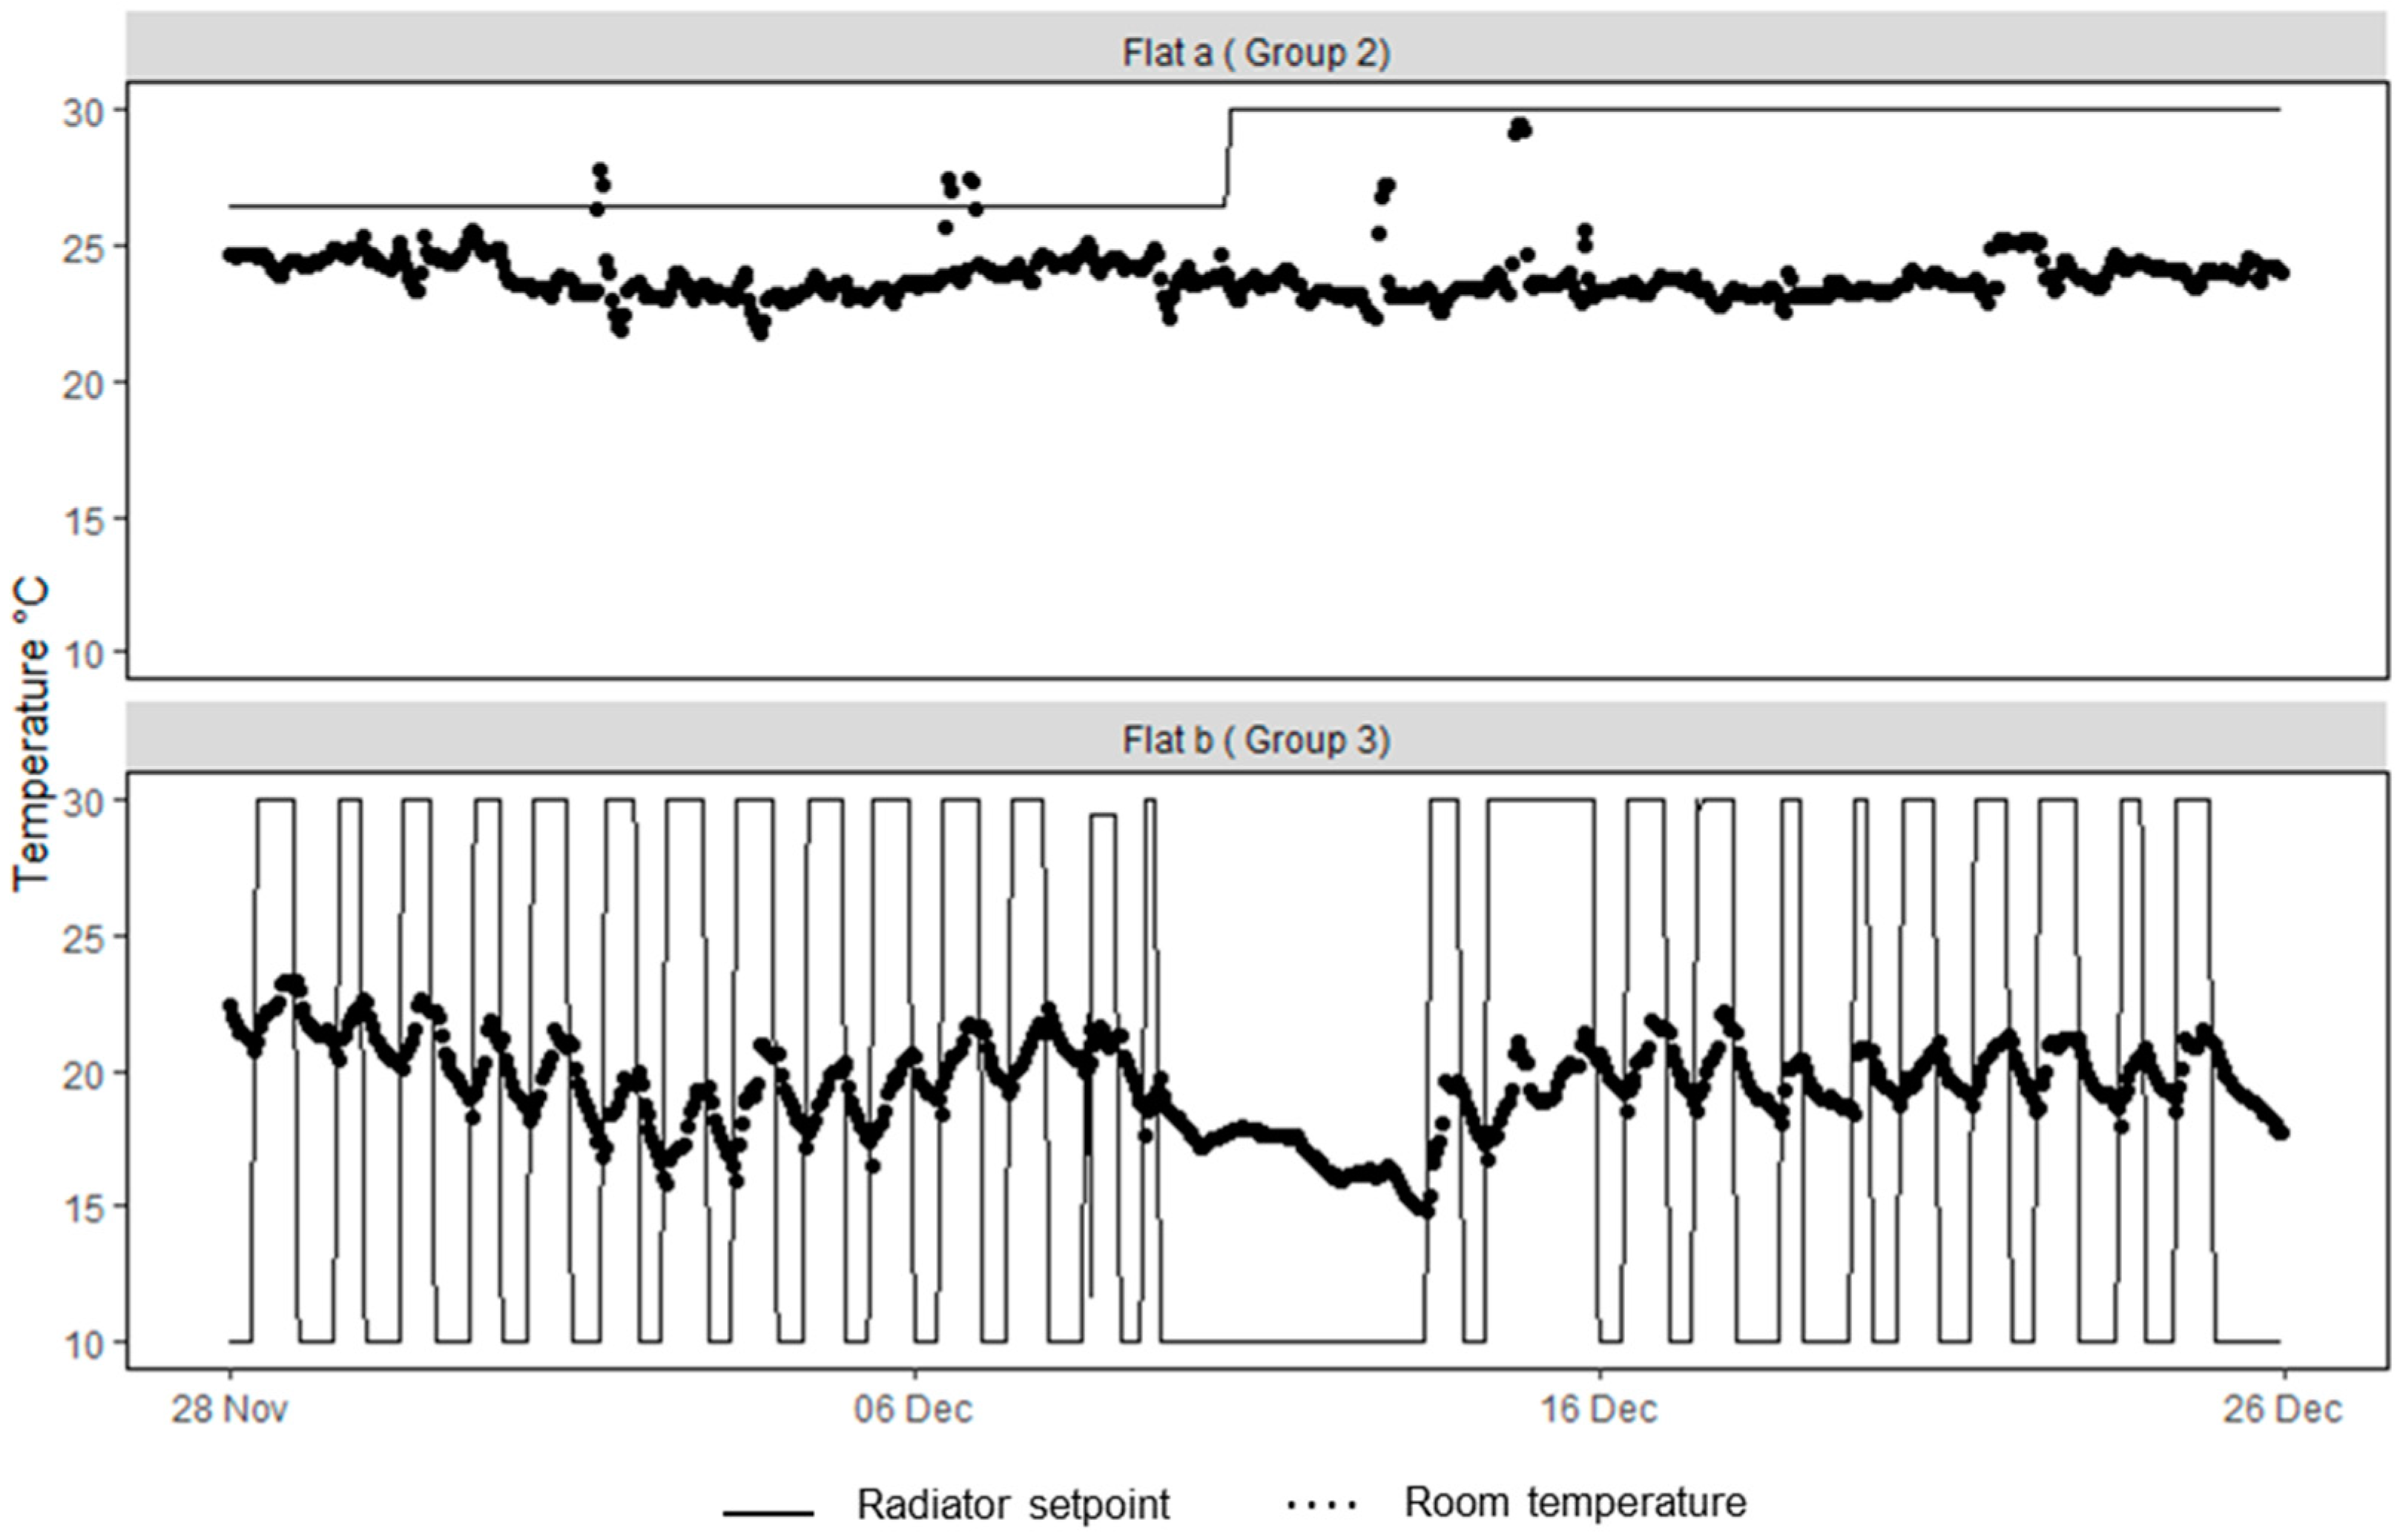
Based on the features shown in Section 5.2, the authors aimed to compare the residents’ behavior against that expected from the valve and feedback models described in Kempton’s theory. Figure 6 shows examples of how two flats, one in group 2 and one in group 3, adjusted the STVs setpoints in the living room throughout December 2019. This was undertaken as a direct comparison to Kempton’s experiment and to show the contrast in the heating strategies.
The flat from group 2 adjusted the setpoint only once during the month, and the daily indoor temperature was stable. In contrast, the flat from group 3 showed a daily interaction pattern, alternating the setpoint from minimum to maximum. The indoor temperature varied according to the heating setpoint. At first glance, it would seem that the flat in group 2 holds a feedback theory, whereas that in group 3 holds either a valve theory or another model that does not reflect the actual operation of the STV. It is important to consider the system that was previously installed in the flats, i.e., manual on/off valves, and how the change from this to the STV may have impacted resident’s understanding of the valve’s operation. Further evidence, such as the relationship with outdoor temperature and daily patterns, is necessary to strengthen this hypothesis. This is explored in the next section.

5.4. Patterns of Interaction

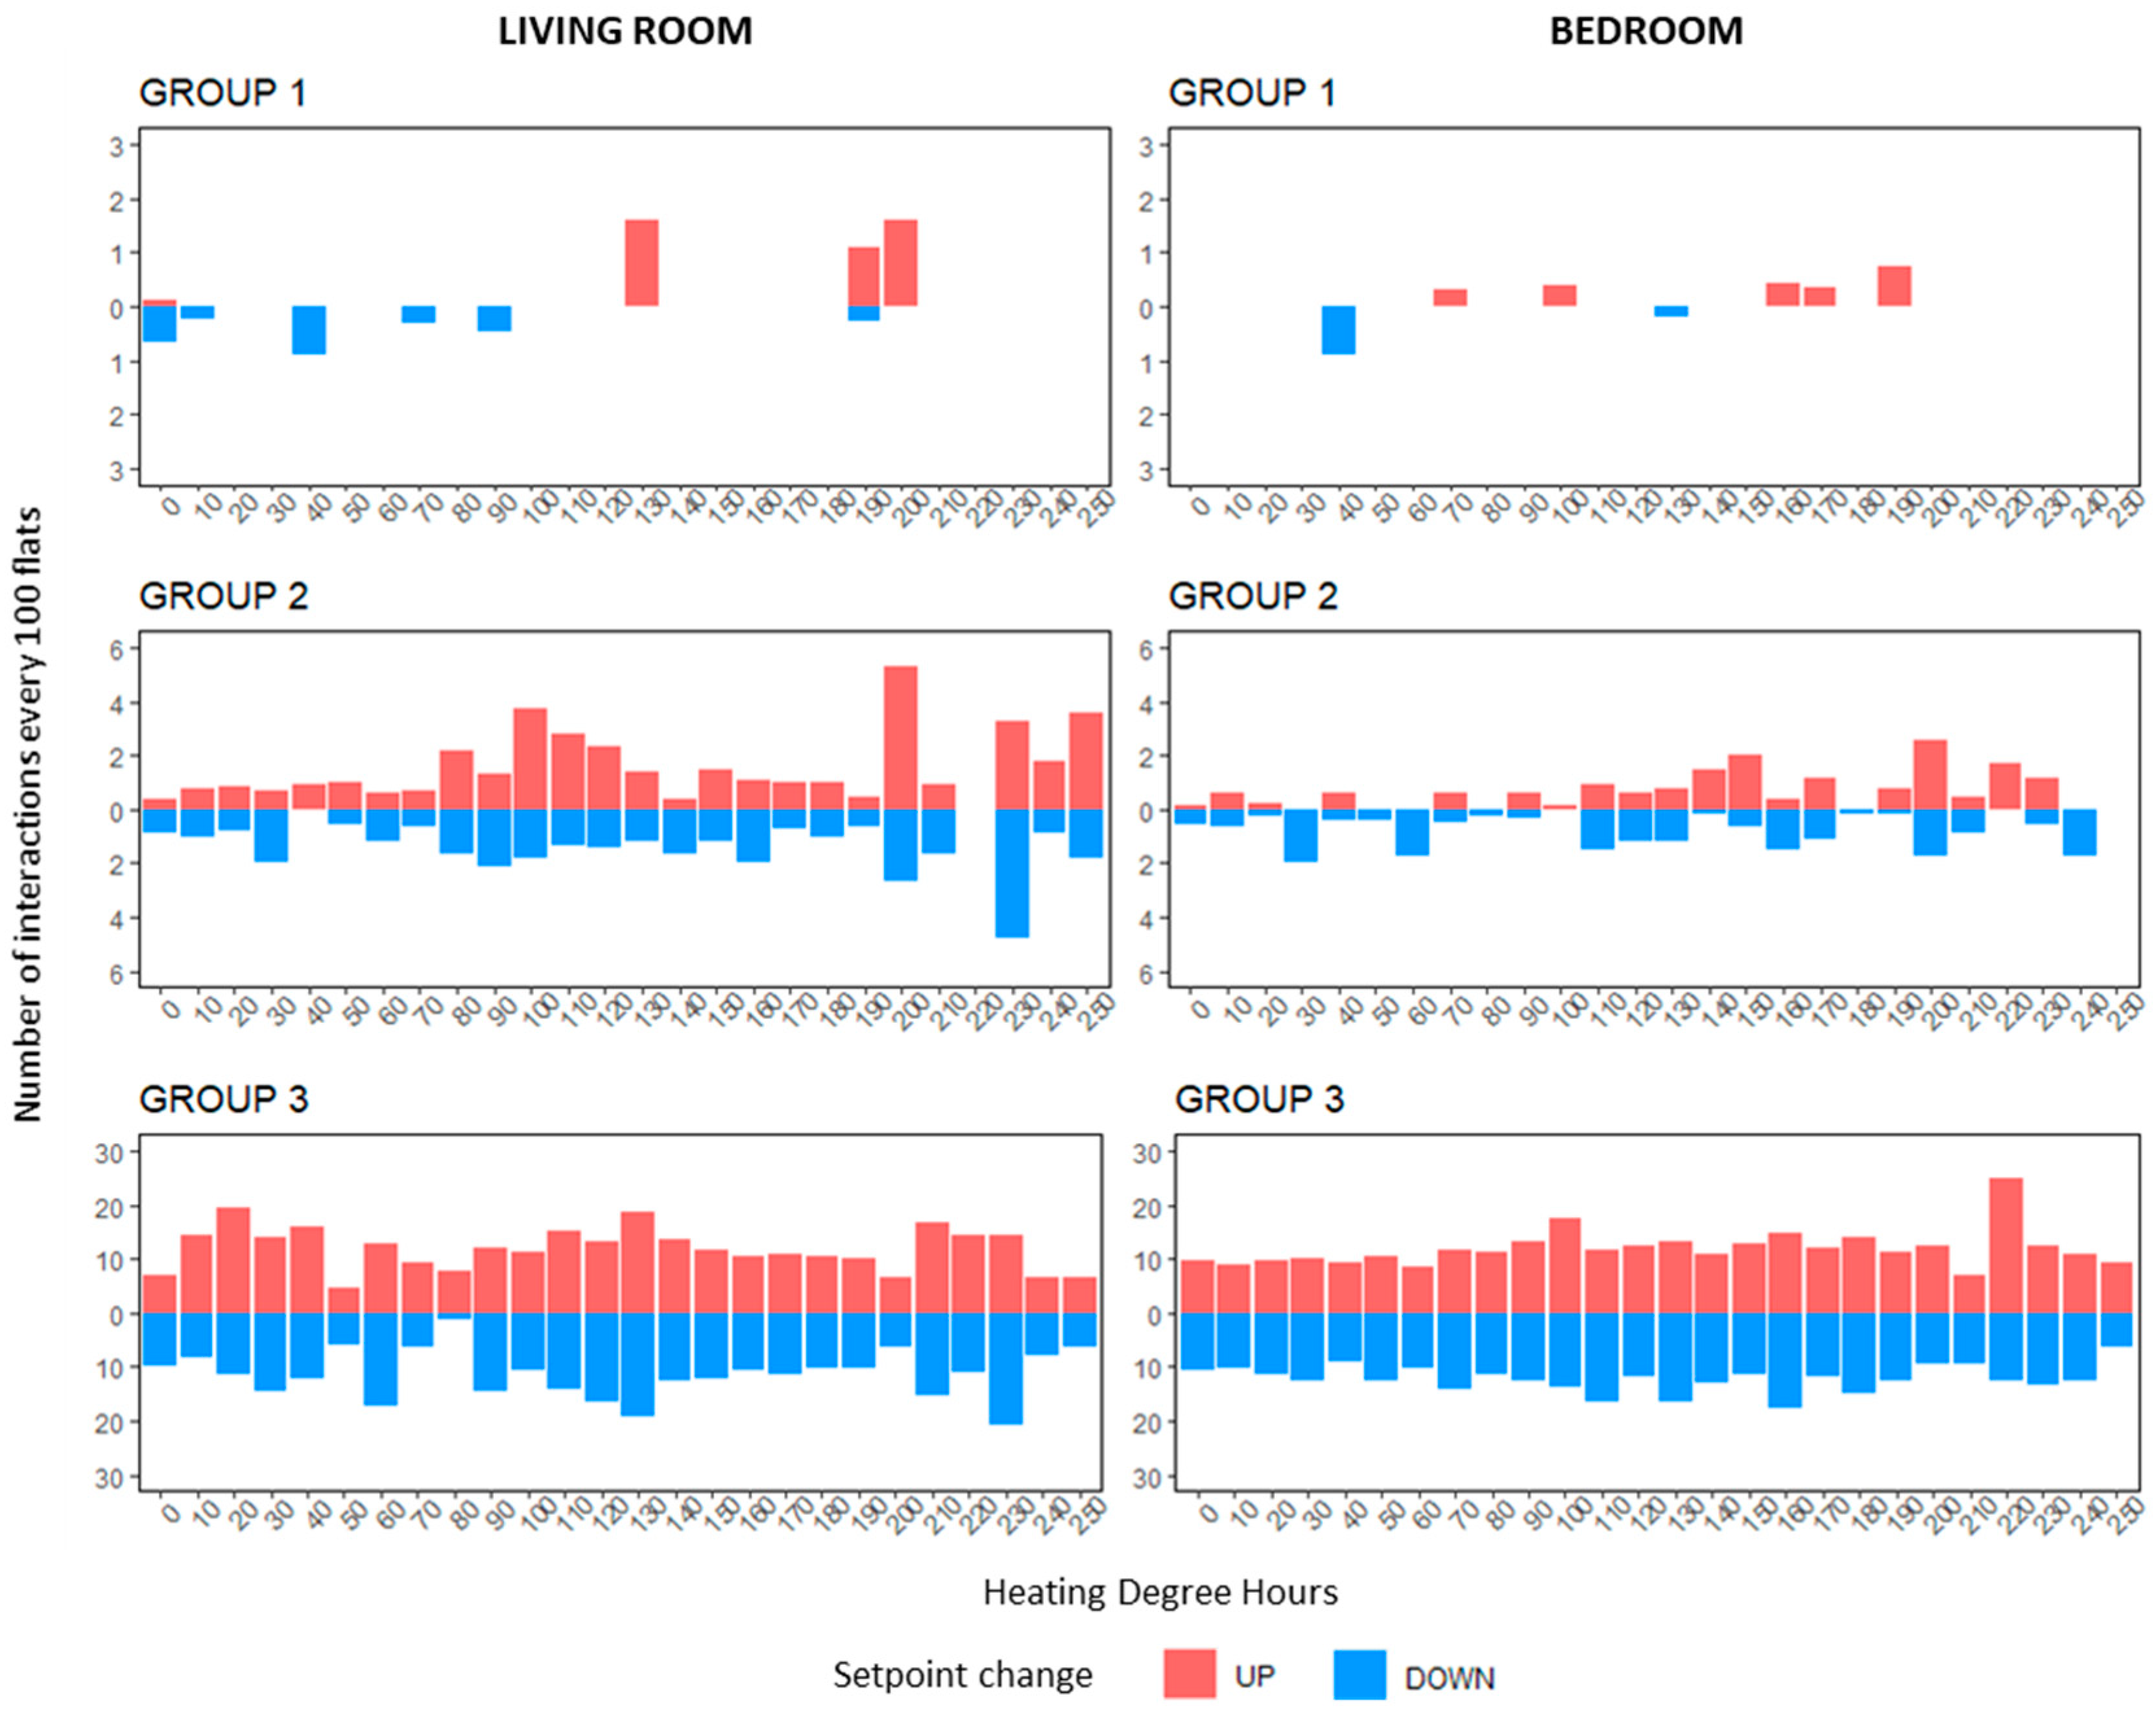
As detailed in Section 4, the samples were weighted to compare across flats with different lengths of monitoring. Figure 7 shows the distribution of daily setpoint changes across different levels of heating degree hours. Both groups 1 and 2 show a higher level of setpoint changes at higher values of heating degree hours, indicating a lower outdoor temperature. This adds to the hypothesis of group 2 using the feedback theory; they only modify the thermostat settings (in this case the STVs) when they experience a change in the desired temperature. Furthermore, in group 2, the heating seems to come on (positive setpoint change) earlier in living rooms than in bedrooms. Moreover, most positive setpoint changes (heating on) concentrate around two peaks: an early one (80 to 120 HDH) and a second one at higher values of heating degree hours (190 to 230 HDH).
In contrast, group 3 shows no significant variation across heating degree hours, particularly in the bedrooms. In addition, the number of “up” and “down” setpoint changes is similar within the same range of heating degree hours, which indicates that the presence of a daily pattern. Figure 8 shows the 24 h profiles for each group, where a daily pattern is clearly evidenced in the living rooms. The setpoint is turned up early in the morning and/or in the afternoon and turned down at the end of the day. No distinction was made for days of the week, as daily occupancy patterns are not expected to differ in households with residents over 60 years of age who are not employed full time [36]. In the bedrooms, however, there is a high number of interactions during night-time, which correspond to one flat in particular. The dataset was weighted by hour to ensure equal representation from each flat. Other flats recorded data for these hours, but the number of interactions from this particular flat was extremely high at night.
The high level of interaction, in combination with the range of the setpoint, indicates that residents in group 3 may not understand how the STVs operate. Users alternate from maximum to minimum settings, which is comparable to how they operated the previous valves. Before installing the STVs, the building had only manual valves, which only provided two settings: “fully open” or “fully closed”. It is possible that residents simply continued their prior behavior and did not adapt to the new system. The literature suggests that elderly residents are unlikely to change their heating behavior [22].
In relation to the understanding of the system, the residents were briefed on how to operate the valves upon installation, and in subsequent visits from building staff and or researchers when commissioning the monitoring system. However, this does not ensure a complete understanding of the system. A study by Yano and Imahara [37], for example, evaluated the introduction of occupant-reactive heating controls in households, showing that, even after explaining to residents how the new system worked, a large proportion still found it difficult to understand. In the case of a care home, there are extra limitations to consider, such as cognitive impairments.
Furthermore, the 24 h profiles for flats in group 2 are not a reflection of what happens within one day, but instead show the hours of the day where occupants are more likely to interact with the system. As evidenced by Hanmer et al. [15], users are more likely to interact with their heating in the morning. Overall, the number of interactions was higher in living rooms than in bedrooms. This seems reasonable, considering that residents occupy the living room during most of the day, while they are active. This, and the differences in when the heating comes on in each room, reinforce the need for zonal controls in households.
Overall, groups 1, 2, and 3 showed distinct heat strategies and patterns of interactions with the smart thermostatic valves. The behavior from group 2 coincides with the characteristic of users having feedback theories, meaning that this group understands how to correctly operate the STVs. Although the flats in group 3 seem comparable to users having valve theories, due to the high number of interactions, they instead seem to fit a mental model that reflects the operation of the previous heating system. These users have not yet adapted to the new system (STVs) and/or do not understand how it works.
The findings of this study are limited by the lack of information available about residents. Understanding their capacities, such as the presence of cognitive and or physical impairments, would contribute to identifying the reasons behind a resident’s behavior. Additionally, the lack of data on occupant behavior and thermal comfort limits the evaluation of heating strategies. Information on window-opening behavior and occupants’ thermal preferences is needed. Furthermore, the intermittency of the data meant that it was not possible to evaluate the adaptation of residents to the smart thermostatic valves. It would be interesting to determine if residents changed their behavior from one group to another as they adapted to a new technology.

6. Conclusions

This study set out to add empirical evidence to Kempton’s theory on mental models of home heat controls in a care home. The analysis of the setpoint records from smart thermostatic valves from 47 flats showed a significant variation in both the number and the patterns of interaction with controls. First, three types of interactions with the valves were identified: control interactions (no change in the setpoint), setpoint changes performed in one movement, and setpoint changes from multiple movements. Overall, the level of interactions was higher in the living rooms than in the bedrooms.
Furthermore, flats were classified into three levels of interaction: (i) low interactors who do not interact with control or do so very little (24.5%); (ii) medium interactors who adjust their setpoint when the outdoor temperature changes, whose behavior is comparable to households that have a “feedback” theory (49%); and (iii) high interactors who adjust the setpoint based on their own strategy, which does not necessarily follow outdoor temperature changes and is more suited to the previous type of heating controls, i.e., manual valves (26.5%). This highlights the contrast between expected and actual usage of home heat controls and the difficulty of adapting to new technologies. Only 50% of residents (group 2) showed a behavior that is consistent with the principles of operation of the STVs.
In addition, this study also provides evidence on the introduction of smart heating technologies in care homes. The smart thermostatic valves installed in the case study proved to not be adequate for the type of residents. Care homes host elderly people having a high likelihood of cognitive and physical impairments. Additionally, elderly people are expected to have a set view on how the heating system should be operated and are unlikely to change it. These characteristics affect the manner in which they will perceive and interact with home heat controls. Future upgrades should consider the specific needs of residents and or involve them in the decision process.
The findings pose multiple questions for further evaluation: Can elderly residents adapt their behavior when new technologies are introduced? Can mental models change? What is the length of the adaptation period? What level of information and handover is necessary? Is acceptance of a technology more dependent on the user’s perception and understanding than on the performance of the technology? What roles should occupants, installers, and building managers or owners play in retrofits? How do we ensure that users are kept in the loop?
Understanding users, the type of mental models they develop, and how they interact with controls contributes to more accurate prediction of building energy demand and the successful design and application of technologies. This work would be useful for property developers and managers, in addition to policy makers, looking to deploy smart heating technologies and/or to further understand the requirements and particularities of heating demand in care homes.

Author Contributions

Conceptualization, V.A.; Data curation, V.A.; Formal analysis, V.A.; Supervision, P.J. and S.G.; Writing—original draft, V.A. All authors have read and agreed to the published version of the manuscript.

Funding

This work was supported by the H2020-EEB-2016 European project [grant number 723562 (THERMOSS)]. Additionally, this work was done in partnership with Portsmouth City Council.

Institutional Review Board Statement

This study was reviewed by and granted approval from the Ethics Committee of the Faculty of Engineering and Physical Sciences (FEPS) of the University of Southampton.

Informed Consent Statement

Informed consent was obtained from all subjects involved in the study.

Conflicts of Interest

The authors declare no conflict of interest.

References

  1. Palmer, J.; Cooper, I. United Kingdom Housing Energy Fact File 2013. Available online: https://assets.publishing.service.gov.uk/government/uploads/system/uploads/attachment_data/file/345141/uk_housing_fact_file_2013.pdf (accessed on 23 September 2019).
  2. Jones, R.V.; Fuertes, A.; Boomsma, C.; Pahl, S. Space heating preferences in UK social housing: A socio-technical household survey combined with building audits. Energy Build. 2016, 127, 382–398. [Google Scholar] [CrossRef] [Green Version]
  3. Department for Business Energy & Industrial Strategy. Energy Follow Up Survey: Heating Patterns and Occupancy Final Report. 2021. Available online: https://assets.publishing.service.gov.uk/government/uploads/system/uploads/attachment_data/file/1018727/efus-heating-patterns-occupancy.pdf (accessed on 1 October 2021).
  4. Munton, A.G.; Wright, A.J.; Mallaburn, P.S.; Boait, P. How Heating Controls Affect Domestic Energy Demand: A Rapid Evidence Assessment; Department of Energy & Climate Change: London, UK, 2014; pp. 10–63. [Google Scholar]
  5. HM Government. Conservation of Fuel and Power (Approved Document L1 and L2); HM Government: London, UK, 2014. [Google Scholar] [CrossRef]
  6. Day, J.K.; McIlvennie, C.; Brackley, C.; Tarantini, M.; Piselli, C.; Hahn, J.; O’Brien, W.; Rajus, V.S.; De Simone, M.; Kjærgaard, M.B.; et al. A review of select human-building interfaces and their relationship to human behavior, energy use and occupant comfort. Build. Environ. 2020, 178, 106920. [Google Scholar] [CrossRef]
  7. University of Southampton. Occupancy Patterns Scoping Review Project. 2016. Available online: https://www.gov.uk/government/publications/scoping-review-of-occupancy-patterns (accessed on 7 July 2016).
  8. Revell, K.M.A.; Stanton, N.A. Mental Models Design of User Interaction and Interfaces for Domestic Energy Systems; CRC Press: Boca Raton, FL, USA, 2017. [Google Scholar]
  9. Kempton, W. Two Theories of Home Heat Control. Cogn. Sci. 1986, 10, 75–90. Available online: http://onlinelibrary.wiley.com/doi/10.1207/s15516709cog1001_3/abstract (accessed on 5 December 2020). [CrossRef]
  10. IEA Annex 79. Recorded Sessions from the Annex 79 Symposium. 2020. Available online: https://energy.soton.ac.uk/recorded-sessions-from-the-5th-international-symposium-on-occupant-behaviour/ (accessed on 15 March 2021).
  11. Office for National Statistics. Changes in the Older Resident Care Home Population between 2001 and 2011. 2014. Available online: https://www.ons.gov.uk/peoplepopulationandcommunity/birthsdeathsandmarriages/ageing/articles/changesintheolderresidentcarehomepopulationbetween2001and2011/2014-08-01 (accessed on 29 September 2021).
  12. Brounen, D.; Kok, N.; Quigley, J.M. Energy literacy, awareness, and conservation behavior of residential households. Energy Econ. 2013, 38, 42–50. [Google Scholar] [CrossRef]
  13. Gram-Hanssen, K. Residential heat comfort practices: Understanding users. Build. Res. Inf. 2010, 38, 175–186. [Google Scholar] [CrossRef]
  14. Zhang, T.; Siebers, P.-O.; Aickelin, U. A three-dimensional model of residential energy consumer archetypes for local energy policy design in the UK. Energy Policy 2012, 47, 102–110. [Google Scholar] [CrossRef]
  15. Hanmer, C.; Shipworth, M.; Shipworth, D.; Carter, E. How household thermal routines shape UK home heating demand patterns. Energy Efficiency 2019, 12, 5–17. [Google Scholar] [CrossRef] [Green Version]
  16. Burak Gunay, H.; O’Brien, W.; Beausoleil-Morrison, I.; Perna, A. On the behavioral effects of residential electricity submetering in a heating season. Build. Environ. 2014, 81, 396–403. [Google Scholar] [CrossRef]
  17. Andersen, S.; Andersen, R.K.; Olesen, B.W. Influence of heat cost allocation on occupants’ control of indoor environment in 56 apartments: Studied with measurements, interviews and questionnaires. Build. Environ. 2016, 101, 1–8. [Google Scholar] [CrossRef] [Green Version]
  18. Guerra-Santin, O.; Itard, L. Occupants’ behaviour: Determinants and effects on residential heating consumption. Build. Res. Inf. 2010, 38, 318–338. [Google Scholar] [CrossRef]
  19. Guerra Santin, O. Behavioural Patterns and User Profiles related to energy consumption for heating. Energy Build. 2011, 43, 2662–2672. [Google Scholar] [CrossRef]
  20. Guerra-santin, O.; Tweed, C. Summer post occupancy evaluation of a Passivhaus care home in the UK. In Proceedings of the PLEA Sustainable Architecture for a Renewable Future, Munich, Germany, 10–12 September 2013. [Google Scholar]
  21. Lewis, A. Designing for an imagined user: Provision for thermal comfort in energy-efficient extra-care housing. Energy Policy 2015, 84, 204–212. [Google Scholar] [CrossRef]
  22. Day, R.; Hitchings, R. Older People and Their Winter Warmth Behaviours: Understanding the Contextual Dynamics. 2009. Available online: https://research.birmingham.ac.uk/portal/en/publications/older-people-and-their-winter-warmth-behaviours(1bd54821-4707-43b2-9370-7d62bb327c54).html (accessed on 3 September 2017).
  23. Department of Energy and Climate Change. Smarter Heating Controls Research Program; Department of Energy and Climate Change: London, UK, 2015; pp. 1–11. Available online: https://assets.publishing.service.gov.uk/government/uploads/system/uploads/attachment_data/file/254877/smarter_heating_controls_research_programme_overview.pdf (accessed on 7 March 2022).
  24. Shipworth, M.; Firth, S.K.; Gentry, M.I.; Wright, A.J.; Shipworth, D.T.; Lomas, K.J. Central heating thermostat settings and timing: Building demographics. Build. Res. Inf. 2010, 38, 50–69. [Google Scholar] [CrossRef] [Green Version]
  25. Dyson, A.A. Energy Reduction in Domestic Homes Using Smart Control Systems; Energy Technology and Innovation Initiative, The University of Leeds: Leeds, UK, 2016; Available online: https://etheses.whiterose.ac.uk/14373/1/Dyson_A_A_Energy_PhD_2016.pdf (accessed on 17 February 2022).
  26. Miu, L.M.; Mazur, C.M.; van Dam, K.H.; Lambert, R.S.; Hawkes, A.; Shah, N. Going smart, staying confused: Perceptions and use of smart thermostats in British homes. Energy Res. Soc. Sci. 2019, 57, 101228. [Google Scholar] [CrossRef]
  27. Department of Energy and Climate Change. Usability Testing of Smarter Heating Controls. 2013. Available online: https://assets.publishing.service.gov.uk/government/uploads/system/uploads/attachment_data/file/266220/usability_testing_smarter_heating_controls.pdf (accessed on 7 March 2022).
  28. European Comission. Building and District Thermal Retrofit and Management Solutions. 2020. Available online: https://cordis.europa.eu/project/id/723562 (accessed on 6 May 2022).
  29. Wade, F.; Shipworth, M.; Hitchings, R. How installers select and explain domestic heating controls. Build. Res. Inf. 2017, 45, 371–383. [Google Scholar] [CrossRef]
  30. Berg, V. Care Home Stats: Number of Settings, Population & Workforce. 2021. Available online: https://www.carehome.co.uk/advice/care-home-stats-number-of-settings-population-workforce (accessed on 29 September 2021).
  31. HM Department for Communities and Local Government. English Housing Survey. Headline Report. 2017. Available online: https://www.gov.uk/government/collections/english-housing-survey (accessed on 26 June 2020).
  32. Turner, W.J.N.; Walker, I.S.; Roux, J. Peak load reductions: Electric load shifting with mechanical pre-cooling of residential buildings with low thermal mass. Energy 2015, 82, 1057–1067. [Google Scholar] [CrossRef]
  33. CIBSE. Degree-Days: Theory and Application (TM 41); The Chartered Institution of Building Services Engineers: London, UK, 2006. [Google Scholar]
  34. Godoe, P.; Johansen, T.S. Understanding adoption of new technologies: Technology readiness and technology acceptance as an integrated concept. J. Eur. Psychol. Students 2012, 3, 38–52. [Google Scholar] [CrossRef]
  35. Morton, A.; Haines, V.; Allinson, D. How do households interact with their heating controls? In Conference Contribution, Proceedings of the BEHAVE 2016 4th European Conference on Behaviour and Energy Efficiency, Coimbra, Portugal, 8–9 September 2016; Energy for Sustainability Initiative of the University of Coimbra (EfS-UC) and the Portuguese Energy Agency (ADENE), Loughborough University: Coimbra, Portugal, 2016; Available online: https://hdl.handle.net/2134/21758 (accessed on 2 July 2020).
  36. Aragon, V.; Gauthier, S.; Warren, P.; James, P.; Anderson, B. Developing English domestic occupancy profiles. Build. Res. Inf. 2017, 47, 375–393. [Google Scholar] [CrossRef] [Green Version]
  37. Yano, T.; Imahara, S. Field Study on Actual Usage of Occupancy-Reactive Space Heating Control. IEEE Access 2021, 9, 47204–47215. [Google Scholar] [CrossRef]
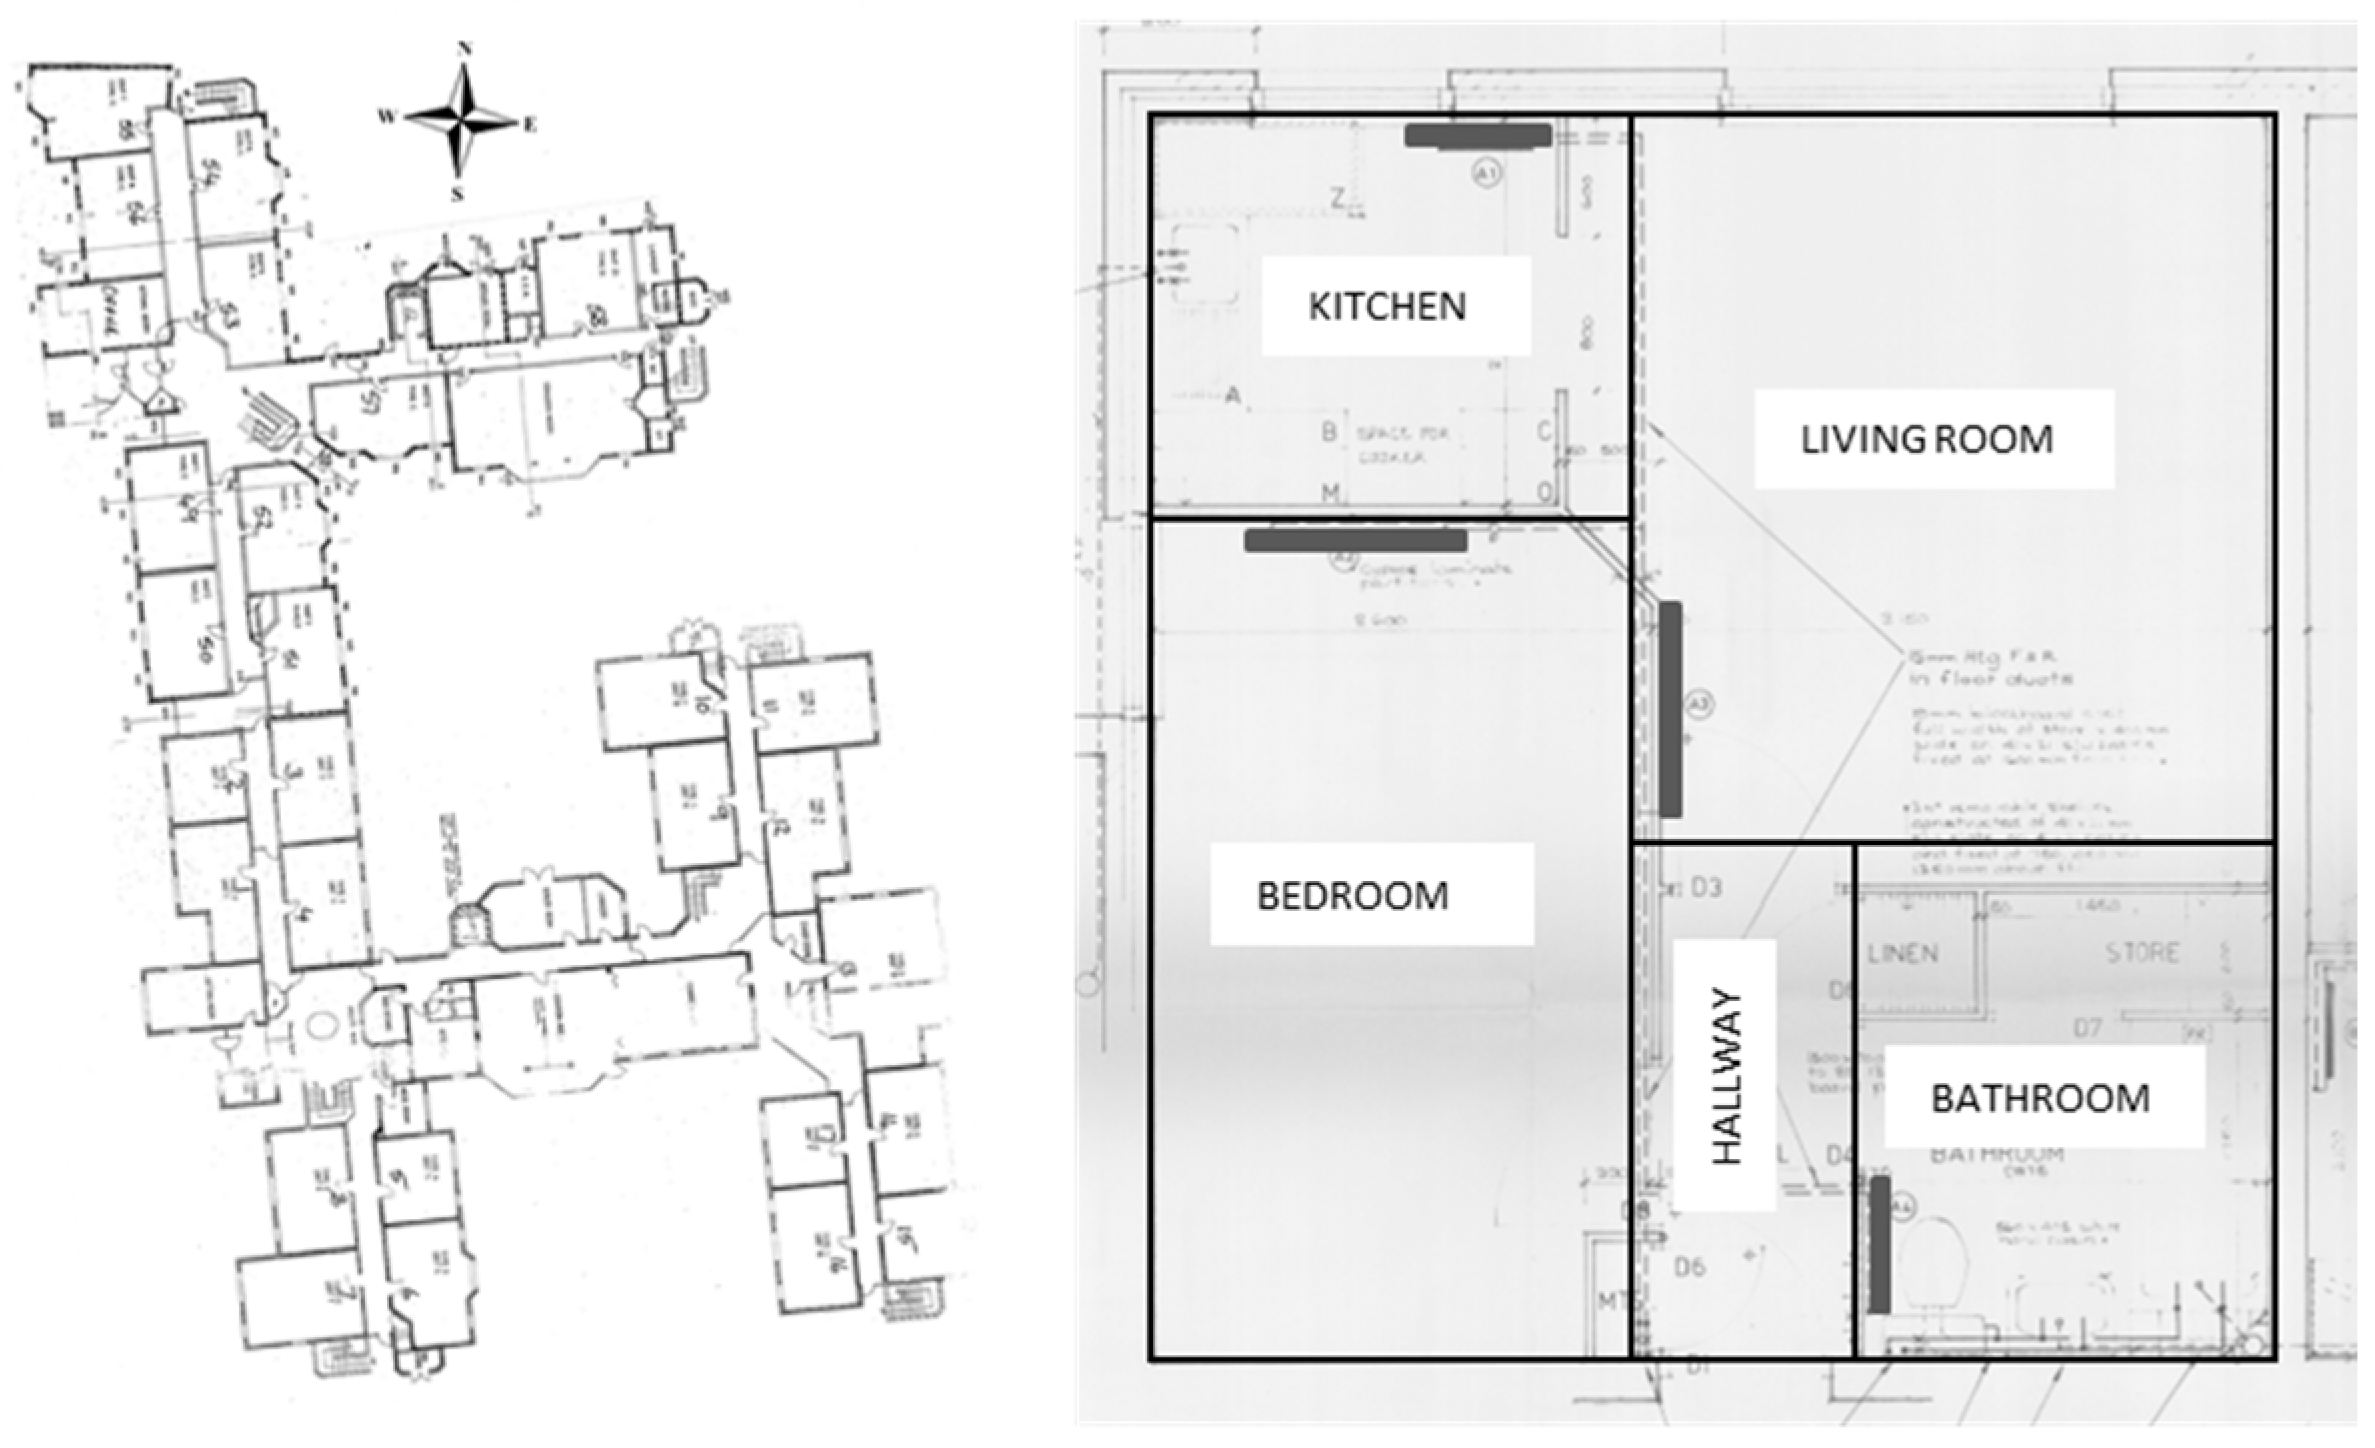
Figure 1. Building layout and typical one bedroom flat. The case study is a three-story 1984 building having 80 flats: 8 studio flats, 64 one-bedroom flats, 6 two-bedroom flats, and 2 three-bedroom flats. All flats have radiators and TRVs are the only point of control residents have of their heating.
Energies 15 04990 g001
Figure 2. Smart thermostatic valves: HORA SmartDrive Mx. The smart thermostatic valves (STVs) allow users to set their desired setpoint temperature, which is displayed on the screen. The setpoint range is 10 to 30 °C. Valve aperture is regulated by the setpoint and the room temperature. Room temperature is detected by an integrated temperature sensor and corrected for temperature influences by an algorithm.
Energies 15 04990 g002
Figure 3. Distribution of the total number of interactions in living rooms and bedrooms. The interaction count was weighted by the number of observations from each flat.
Energies 15 04990 g003
Figure 4. Observed interactions with STVs across months by hour of the day (x-axis) and type of interaction (y-axis). The number of flats that recorded data within each group is shown in brackets. Monitoring started on 15 March 2019 and ended on 30 April 2020. Between July and October 2019, no data were recorded because the communication system was not functioning.
Energies 15 04990 g004
Figure 5. Distribution of STV setpoint changes by room and group. Interactions were weighted by the number of observations in each flat. The dotted line represents a setpoint change of zero, meaning no change. Columns to the left represent interactions where the setpoint was lowered, and columns to the left, interactions where the setpoint was increased. Group 1 shows no discernible patterns, as the number of interactions is very low. Group 2 shows a higher percentage of small setpoint changes (less than 5 degrees). Group 3 shows a two-tailed distribution, where most of the interactions are maximum changes to the limit of the STV (from fully open to fully closed and vice versa).
Energies 15 04990 g005
Figure 6. Patterns of STV setpoint adjustment in living rooms from 28 November to 26 December 2019. “Flat a” shows only one small adjustment of the setpoint (less than 5 °C) in the month. The room temperature never reaches the setpoint specified, suggesting the radiator cannot achieve that temperature. The behavior of “Flat a” is comparable to that expected from a house that has a “feedback” theory. In contrast, “Flat b” adjusts the setpoint from minimum to maximum daily. During the period between 6 and 16 December, no setpoint change was recorded. This, in combination with the temperature drop and the time of the year, suggests that the occupants were away from the household.
Energies 15 04990 g006
Figure 7. Number of daily interactions with the smart thermostatic valves by heating degree hours/day. Results are scaled to 100 flats to compare across groups and rooms. The number of interactions were weighted by the number of observations of each flat and the frequency of each heating degree hour range for the monitoring period (March 2019 to April 2020).
Energies 15 04990 g007
Figure 8. Twenty-four-hour profile of interactions with smart thermostatic valves by group. Results are scaled to 100 flats to compare across groups and rooms. The number of interactions were weighted by the number of observations of each flat for the monitoring period (March 2019 to April 2020). Note that each graph has a different scale range, due to the contrasting number of interactions in each group.
Energies 15 04990 g008
Table 1. Types of user interactions with heat controls.
Type of InteractionNumber of MovementsChange in Setpoint
A1Setpoint changed, UP or DOWN
B>1Setpoint changed, UP or DOWN
C>1No change
Table 2. Summary of groups’ main characteristics for the monitoring period March 2019 to April 2020. Summary statistics were obtained by weighting the observations by the number of total observations in each flat. In the case of non-normal distributions, the median is indicated instead of the mean.
Title 1 Living RoomBedroom
Group 123123
Number of flats 10181092010
Type of interactionA78.6%70.3%76.6%58.3%75.9%82.3%
B17.9%23.7%21.9%33.4%15.6%9.1%
C3.5%6.0%1.5%8.3%8.5%8.6%
Median number of setpoint changes
(Interaction types A and B)
2131671958
Setpoint °CMax.30.030.030.025.030.030.0
Q330.029.028.022.529.529
Mdn.24.425.022.520.022.524.4
Q122.019.510.018.014.010.0
Min.10.010.010.010.010.010.0
Max.28.130.029.630.030.030.0
Q324.025.924.924.024.824.9
Mean daily temperature °CMdn.22.924.023.323.223.422.4
Q121.222.520.822.521.921.7
Min.12.814.510.814.312.810.8
Publisher’s Note: MDPI stays neutral with regard to jurisdictional claims in published maps and institutional affiliations.