Abstract
The coordination of optimal overcurrent relays (OCRs) for modern power networks is nowadays one of the critical concerns due to the increase in the use of renewable energy sources. Modern grids connected to inverter-based distributed generations (IDGs) and synchronous distributed generations (SDGs) have a direct impact on fault currents and locations and then on the protection system. In this paper, a new optimal OCR coordination scheme has been developed based on the nonstandard time–current characteristics (NSTCC) approach. The proposed scheme can effectively minimize the impact of distributed generations (DGs) on OCR coordination by using two optimization techniques: genetic algorithm (GA) and hybrid gravitational search algorithm–sequential quadratic programming (GSA–SQP) algorithm. In addition, the proposed optimal OCR coordination scheme has successfully employed a new constraint reduction method for eliminating the considerable number of constraints in the coordination and tripping time formula by using only one variable dynamic coefficient. The proposed protection scheme has been applied in IEEE 9-bus and IEC MG systems as benchmark radial networks as well as IEEE 30-bus systems as meshed structures. The results of the proposed optimal OCR coordination scheme have been compared to standard and nonstandard characteristics reported in the literature. The results showed a significant improvement in terms of the protection system sensitivity and reliability by minimizing the operating time (OT) of OCRs and demonstrating the effectiveness of the proposed method throughout minimum and maximum fault modes.
1. Introduction
1.1. Background
One of the major technical challenges facing the microgrid (MG) is the relay coordination for the different operations of the network. The different operation modes of MG result in frequent variations, thereby leading to changes in the fault current magnitude and its direction. The protection scheme needs to guarantee the optimal operation in all network scenarios, which include meshed and radial configurations as well as the connected grid and islanded modes of MGs. In case of a fault in the grid connection mode, the fault current will be fed from distributed generators (DGs) and the utility grid. On the other hand, when the grid is in islanded mode, the supply of the fault current will result from DGs as the only connection present in the MG [1,2]. These changes in the fault current have a significant impact on the basic requirements of the protection system such as speed, reliability, and sensitivity, which then result in some protection issues such as delay in tripping, false tripping, loss of mains, and blinding of protection [3,4]. In recent years, the coordination problem of overcurrent relays (OCRs) has obtained wide attention in the protection system research area. These studies are focused on addressing and preserving the protection schemes’ reliability in interconnected MGs to acquire the optimal configuration for protection approaches in MGs. Optimal relay coordination methods regarding whole previous studies can be divided into five methods, namely, optimization techniques, new constraints, dual-setting protection schemes, new or modifying objective functions, and nonstandard characteristics (NSCs) [3]. Figure 1 illustrates the classification of OCR coordination methods. The mutual goal among these methods is to obtain the optimal OCR coordination. Initially, the optimization techniques played an essential role in the optimal OCR coordination, starting with simple ways and passing through nature-inspired algorithms and advanced artificial intelligence [3].
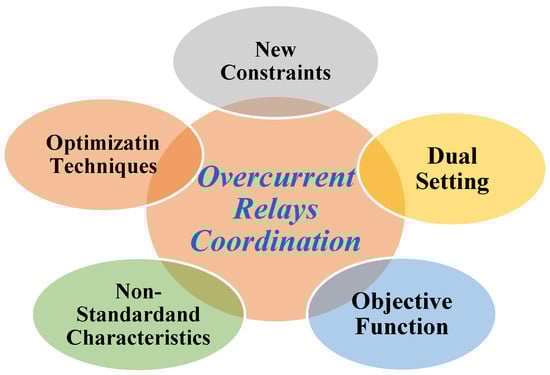
Figure 1.
Overcurrent Relay Coordination Methods.
1.2. Literature Review
Metaheuristic techniques such as genetic algorithm (GA) have been applied successfully for reducing the tripping time of relays and avoiding miscoordination problems [5]. For miscoordination problems that are associated with both discrete- and continuous-time multiplier settings, in ref. [6], the particle swarm optimization (PSO) algorithm proved its effectiveness to deal with complex coordination problems. In addition, hybrid techniques have been established to improve metaheuristic techniques. For instance, a hybrid particle swarm optimization and moth–flame optimization (PSOMFO), which is a combination between the PSO and MFO to improve their achievement, and the outcomes proved its effectiveness compared to PSO and MFO algorithms individually [7]. In ref. [8], the authors proposed a hybrid gravitational search algorithm and sequential quadratic programming (GSA–SQP) algorithm that introduces a robust high-quality solution to solving the OCR coordination problem. It is effective due to it taking the pros of both GSA and SQP techniques; it has been tested and evaluated on various test systems. Secondly, some papers proposed and considered the effect of the new or reduced constraints on solving the OCR coordination problem. For the distribution system with a combination of the DGs in ref. [9], the study relieved about 43% of burdensome constraints from the process of coordination optimization compared to the two standards. A considerable number of constraints is an optimization problem; the inactive inequality constraints in the OCR coordination problem have been detected and removed by using a new proposed index. It is defined as a ratio for each OCR pair. The given results illustrate that the proposed index detected and removed more than 90% of unused constraints [10].
Dual-setting directional overcurrent relays (DOCRs) can operate in both directions which are forward and reverse; it is another solution that has been introduced for overcoming challenges relating to the MGs’ protection systems. In ref. [11], a new coordination scheme using dual-setting DOCRs has been proposed to determine two optimum pairs of settings for each relay in connected and disconnected DGs. The obtained results appear to demonstrate the effectiveness of the proposed approach and reduce the overall operation time (OT) by roughly 50% compared to the traditional coordination scheme that utilizes the DOCRs with a pair of settings. A novel protection scheme for dual-setting DOCRs in MGs with DGs has been introduced in ref. [12]. This scheme uses a dual-protection setting in the main and backup operation topologies in one relay. Two strategy cases of one-point and three-point have been executed by the optimization. During utilization of the three-point coordination strategy, the total OT has been reduced by 57% compared with the conventional dual-setting method. The proposed method proves its applicability for both grid-connecting and islanding modes and improves the system’s reliability by eliminating the demand for communication between relays. One of the suggestions made by many authors to contribute to preventing the miscoordinations is modifying the objective function. Multiple modifications in the objective function for DOCRs for meshed networks have been suggested by Alam et al. in ref. [13]; it minimized the OT for main and backup relays simultaneously. In ref. [14], a novel objective function is proposed to direct the settings of the OCRs towards optimal solutions suitably. The proposed approach showed a significant reduction in the OT of relays and avoided miscoordinations among them.
Investigation of alternative methods to standard protection schemes has required a considerable amount of effort by researchers by employing NSCs, which will be taken into consideration in this literature. There is limited literature on designing OCR coordination schemes based on NSCs for a power network equipped with DGs. For example, a hybrid application uses an inverse-time characteristic and a definite-time characteristic in parallel with the absence of the DG units has been proposed in ref. [15]. This novel hybrid NSC entails no complexity or additional cost, whereas the problem of dynamic coordination has appeared in these hybrid NSCs which require careful application. Thus, they can lead to miscoordination and less flexibility. In addition to the fault current characteristic, there are some NSCs based on the fault voltage that have been proposed and applied [16,17]. The authors in ref. [16] added per-unit voltage to measure the IEC standard characteristics (SCs) to reduce the overall OTs of the relays. In ref. [4], a significant reduction in the total OT of the OCRs has been achieved by employing the fault voltage natural logarithm function in the denominator of the characteristic equation. However, this logarithm function had a limited effect on the obtained characteristic. In another study [18], a new scheme excluded the time multiple setting (TMS) and utilized fault voltage in the numerator as a logarithm function. The relay OTs are not raised when the location of the relay moves to the source due to TMS elimination. To achieve lower OTs in comparison with SCs, an NSC-based algorithm function has been introduced in [19]. However, the major disadvantage of NSCs in refs. [4,16,18] is the inability of applying the approaches within existing industrial OCRs. In addition, the new requirements of measuring the fault voltage beside the fault current will increase the problem’s complexity.
To mitigate and avoid the limitations in the SCs such as the inverse time–current characteristics of MG systems, a new NSC based on adding the auxiliary variable to the conventional OCR OT equation is presented by ref. [20], which aims to achieve a fast protection scheme based on well-defined time–current characteristics (TCCs). All of these auxiliary variables are measured as coordination constraints; however, it is inapplicable in existing industrial OCRs. Therefore, a piece-wise linear (PWL) characteristic has been proposed in ref. [21] to preserve the coordination time interval (CTI) between the primary and the backup relay pairs for the entire range of the fault current. The successive straight lines were joined together to formulate the new characteristic curve and a tabular format is used to adjust the curve for the existing industrial relays. For obtaining the optimal coordination of OCRs in meshed networks, the piece-wise linear characteristic (PWLC) has been evolved as a novel method [22]. It used variables coefficients, namely A and B, of the PWLCs of the OCRs for adjusting purposes and obtaining a more flexible TCC with the normally inverse (NI) standard; however, the proposed method was not tested by changing the location and the size of the DGs to evaluate their effect on the performance of the proposed approach. There are some researchers who have considered the SCs’ constant parameters as variable set points, which is another NSC format [23,24]. This NSC format aims to develop flexible TCCs by creating necessary CTI for the range of the entire fault current between the primary/backup pairs of the relay. To improve the selectivity and sensitivity in the OCR coordination and avoid the NI standard curve disadvantages, an optimal coordination scheme based on nonstandard time–current characteristics is presented in refs. [25,26]. However, the nonstandard time–current characteristics are created by using the logarithmic function and constant coefficients, which lead to significantly minimizing the overall operational time on maximum fault currents, but it showed limited behavior on minimum fault currents. Table 1 shows an overview of the literature review that has been introduced above.

Table 1.
A Literature Review Comparison Analysis for Protection of Radial and Meshed Networks.
1.3. Contribution of The Paper
It can be seen that there are some drawbacks or imperfect points that create a research gap. There is a significant need to find an alternative to the NI standard curve for more flexible and dynamic protection coordination schemes for radial and ring distribution networks (DNs) and MGs, especially at far-end faults (minimum faults). In addition, ensuring the CTI selectivity between OCRs and minimizing the tripping time in different operating modes are required. For filling this discussed research gap, optimal OCR coordination based on a new nonstandard time–current characteristic (NSTCC) with dynamic coefficients to provide a fast and reliable response in different network scenarios is proposed. An optimization task to present the OCR coordination problem has been solved by applying two optimization techniques, namely GA and GSA–SQP algorithms. The main and key contributions of this article are ordered as follows:
- For improving the performance of the protection system by integrating the DG units and during the occurrence of different fault currents in the MGs, the novel NSTCC is created with consideration to the constraints of the existing model.
- In the OCR scheme, an optimum coordination approach is utilizing NSTCC to reduce the total OT compared to traditional SCs and other NSCs presented in the literature. This paper achieves a significant reduction in total OT without a miscoordination record.
- The proposed new optimal scheme based on NSTCC is developed with a lower number of constraints compared to the optimal coordination in the literature because it uses just one flexible coordination scheme. Therefore, the new proposed approach in this work achieves the optimal solution with minimum computational costs.
- There is no communication required between the OCRs in the proposed optimal coordination strategy in this work, where the measurement of the current is acquired locally. Therefore, the proposed approach provides adequate robustness to the OCR coordination approach, decreasing the demand for communication infrastructure. Moreover, it reduces the computational cost as well as the requirement to gain way in large quantities of the MGs and grid data.
- The sensitivity improvement for the proposed optimal scheme is shown by comparing the results of the NSTCC and the standard curves under different testing and MG operation modes.
- Finally, a comparison analysis has been provided for the proposed optimum coordination approach under various faulty conditions for two DNs types: radial networks (IEEE 9-bus test system and IEC MG benchmark) as well as meshed networks (IEEE 9- and 30-bus test system). This comparison proves the proposed approach’s superiority over others, especially for minimum fault in islanding mode.
1.4. Outline of Paper
This paper is categorized as follows: Section 2 presents the problem statement and suggested solution. Section 3 illustrates the novel optimal OCR protection scheme methodology and the proposed NSTCC. The MG topology and the distribution grid with the simulation analysis and results are represented in Section 4. Finally, Section 5 presents the summary, conclusions, and the suggested future work of this paper.
2. Problem Statement: OCR Coordination
OCR is considered the most common apparatus for protection as applied in distribution systems. An OCR is used in measuring the current passing through it and also determines if a signal for opening a circuit breaker is to be sent or not [27]. Relays are of different types, some of which include definite-time OCRs and directional relays. However, one of the most preferred types is the inverse-time OCR since it is a protection relay with a time characteristic used for grading and, thus, can allow some loads to specifically draw more currents in a very short period of time [28]. OT is part of inverse-time OCRs, and is found to be in inverse proportionality with the fault current as indicated by the relay. OCRs are in two forms: electromechanical and digital. Electromechanical OCRs have dominated the market for the past two decades. This is because they were not expensive and had well-known performance, resulting from many years of application. The second form, which is the digital OCR, has several advantages over the electromechanical type and is more likely to be preferred in the future for the following reasons [29,30]: first, they are economically competitive, since they are cheap to acquire, similar to the electrochemical types. Second, they have increased reliability since they have properties that can detect and report any internal problems in the relay, thus avoiding any possible malfunction operation. Third, they have smart grid natives since they are compatible with the concept of the smart grid due to their digitalized nature. Further, they have a multifunctionality ability; thus, they can perform other added tasks such as measuring the current and voltage values as well as performing protection work. Finally, they have the flexibility ability, which arises from their capability to define TCCs, which are arbitrarily set by the user [28].
To achieve the maximum operation of OCRs, two parameters should be set. These consist of the TSM and plug setting multiplier (PSM). The former is determined based on the minimum load current as well as the maximum fault current. The required interrupting capacities of overcurrent protective devices can be determined by helping the maximum fault currents, while the minimum fault currents are utilized in overcurrent device coordination operations [31]. The maximum fault currents have ratings from 50 to 200%, at intervals of 25%, whereas minimum fault currents have ratings from 0.05 to 1, with 0.05 intervals. TSM is calculated in such a way that the system for protection can disconnect easily from the power system’s faulty part [28,32]. The digital relays, which are new in the market, however, are able to make these parameters be set at intervals of 0.01 [33]. In general, the structure of OCR coordination problems in MGs is complex and intensive. This is especially seen in linked distribution systems, in which the burden of computation increases as the size and the network intricacy also increases. Figure 2 illustrates the coordination constraint between primary and backup relays, in which is horizontal axis represents the fault location and the vertical axis represents the tripping time. As ordinarily in a coordination approach, the fault is isolated firstly by using the primary OCR (Rp). If the Rp does not operate, the fault will be isolated by using the backup OCR (Rb) after a particular time, called CTI, which is represented in Figure 2 between the green curve and black curve [3].

Figure 2.
Coordination Constraint between Primary and Backup relay.
Most renewable energy sources such as wind turbines and photovoltaic systems have been used power electronic inverters for connecting to the MG system. In MGs, the inverter-based distributed generations (IDGs) have been used in protection; however, the inverters have a limitation of the generated fault current: 150% of the current rating [34]. This makes the conventional overcurrent devices either stop responding or respond at a much larger operating time [4]. New challenges and opportunities appeared due to the growing wind turbine energy share, which led to a preference in the use of doubly fed induction generators (DFIG) over fixed-speed wind turbine systems. The connection of the wind farm to the network contains a low-voltage ride-through (LVRT) ability that is the most important requirement. Furthermore, owing to the DFIG essentially working the same to synchronous distribution generations (SDGs), power factor control might be applied at a reduced cost [35]. The contribution of fault current from synchronous distribution generations (SDGs) can rise to about ten times the current rating [27]. In general, the fault currents in MGs are dependent on the ratio of ratings between SDGs and IDGs. Likewise, the fault current contribution ability (FCCA) of IDG is very low (110%). This means that the mode used is the islanding mode; the OCRs may be unsuccessful in the case the MG only has IDGs. This is because the ratio of IDGs to SDGs in the mixture causes difficulty in the protection coordination as well as low fault current. In general, the DOCR aims to deal with bidirectional flow of power failures evenly. In addition, if the MG is able to operate in the loop and radial topology, the relay coordination and the detection scheme under primary fault becomes complex using different types of DGs. In order to handle the protection challenges in MGs, a fast and robust optimal protection scheme is required. The main objective of this article is to present an optimal and fast coordination scheme that minimizes OCR operational times for all operation and fault scenarios in MGs.
2.1. Problem Description: Illustration-Based Analysis
MGs with sources of renewable energy must be protected to ensure that the operating conditions are reliable and safe [28,29,30,31,32,33,34,35,36]. The coordination of OCRs in distribution systems can be done easily, especially those in radial structures and weakly meshed MGs [37,38]. However, in interconnected and meshed systems, each of the given relays acts as backup relays, where several delays are set as a backup for one relay. Figure 3a shows the single-line diagram of DN with three distribution lines (,) protected by overcurrent relays (,). Figure 3a illustrates the OCR coordination from the side of the load to the source. For instance, a fault at the F1 point results in primary relay and backup relay. If the is unable to detect the fault or tripping delays, the will have time delays. Figure 3b shows the effect of the fault location on the fault current. It can be noticed that the fault current is increased whenever closer to the main source. Figure 3c is an illustration of the OCR coordination curves in three modes, which are a conventional network (that has no sources of renewable energy), a power network with DG, and an islanding mode. Ordinarily, the OCR operating time, in the no-DG case, is high due to a CTI ranging from 0.2–0.5 s, stressing the network equipment, possibly causing the relay to fall into the precise time region. This is more so for maximal fault modes (when faults occur near the source) [29,34,36].
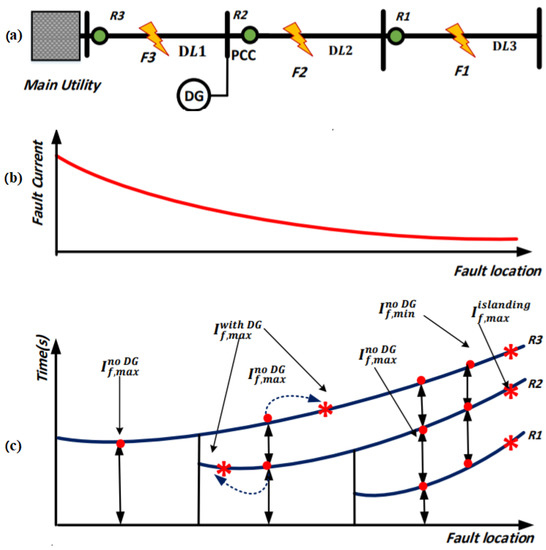
Figure 3.
(a) The single-line diagram of the distribution grid with DG under three fault modes, (b) the relationship between fault current and fault location, and (c) the miscoordination between the primary and backup relays and fault characteristics with the absence and presence of DG.
The conventional protection scheme experiences more challenges because of the different fault characteristics between the distribution systems in the presence and absence of sources of renewable energy. The rising number of sources of renewable energy in the network has widened the variation range between the minimum and maximum levels of fault current. Consequently, the calculation of the traditional protection setting will not meet the system requirements of the main protection: sensitivity, speed, and selectivity [4,28]. For instance, when the fault occurs at the F2 point for a distribution grid that has DG as illustrated in Figure 3c, the fault current value will go up in the primary relay and go down in the backup relay, resulting in a time delay causing disconnection or OCR coordination failure [30,36]. Figure 3c illustrates the effect of the connection between the DG and the fault current,. For , maximum fault current for DG power network,, goes up while it goes down for when comparing with the maximum fault current during the absence of DG, . Generally, the fault characteristics of a DN with DG have been altered because of loading/generation level changes, variations in the network typology, islanding, fault point resistance, and the location of the fault point in relation to the main relay. Alterations of the fault current will result in OCR miscoordination; for instance, the will possibly not operate once there is a failure on for the minimum fault current, , in which the current value will be reduced compared with the distribution network in the absence of DG, . For the islanding case, the fault current is too low, making its detection based on the conventional scheme difficult [28,30]. As a result, the conventional coordination and protection scheme will not have the capacity to handle the issue, which makes the development of a new time–current characteristic to address the challenges of DG protection very important. Furthermore, a DG-equipped system of protection for DN is needed to respond to the faults in all modes of DG operation, e.g., grid and islanded. This study proposes and develops various quick and intelligent schemes of protection and coordination. The coordination schemes’ main objective is calculating the PSM and coordination curves which reduce the OT.
2.2. The Coordination of Overcurrent Relay
The traditional coordination between OCRs is generally obtained with the assumption that the conditions and network parameters such as resistance, current, and voltage during a fault will remain constant [34,36]. Equation (1) describes the CTI between the OT for the primary relay and backup relay for short circuits that occurs, for instance, at the F2 point [34,36,39]. The CTI presentation is such that the time of coordination between the backup relay, , and the main relay,, is equal to or more than the designated CTI.
Figure 3b illustrates how DG addition to the distribution grid affects the scheme of coordination protection [40,41]. The fault current variations will result in a CTI between the primary relay and backup relay that is lesser than the chosen CTI, causing a miscoordination. Calculations of the OCR operating time, t, in traditional methods are based on constant fault currents as well as known fault currents, , as shown in Equations (2) and (3).
where TMS represents the time multiplier setting, represents the short-circuit current, and represents the pickup current. Parameters A, B, and C in Equations (2) and (3) are related to a variety of relay characteristics that are defined on the basis of the standard of relay [42,43]. In general, numerical OCRs have the capability to update and modify the time operating characteristics based on real-time measurements. In this paper, the numerical OCRs provide the ability to use different time operating characteristics, such as the standard characteristics (IEC, ANSI), or generate new nonstandard operating characteristics. The proposed nonstandard time characteristic in this paper, NSTCC, aims to minimize the total tripping time and improve the performance of power protection in terms of selectivity and sensitivity.
3. The Proposed Methodology: Nonstandard Time Current Characteristics
This section aims to introduce optimal OCR coordination based on a new nonstandard time–current characteristic (NSTCC) with dynamic coefficients to reduce the tripping time associated with the value of fault currents. The proposed NSTCC scheme will be compared to the traditional OCR scheme (inverse definite minimum time (IDMT)) [29,36]. Further, there are different applications, such as the thermal stress issues occurring in the equipment (such as transformers and cables), that can use the proposed NSTCC. The next equation represents the proposed NSTCC, and the logarithmic function therein [19] is the basis of this equation.
To ensure OCR coordination selectivity, the grading time should be kept constant and free from the network’s location of the fault or the current level of the fault. Equation (4) represents the NSTCC for all relays through the use of logarithmic [19,36] and variable coefficients (A) with a range between 2 and 6.5; the time of grading will not be affected by the degree and point of fault. This will make the selectivity of the protection system better and independent of the fault location or current. Moreover, it was difficult for the normal inverse curves to detect the minimum fault. The NSTCC offers ample area for the detection and coordination of the OCRs in the minimum fault, as illustrated in Figure 4, to ensure selectivity without missing the tripping time. The following section describes an optimization task for determining the TMS based on Equation (4) that reduces the OT to a minimum. Therefore, coordination on the basis of nonstandard tripping characteristics will result in an optimal time of grading in relation to the time of tripping.
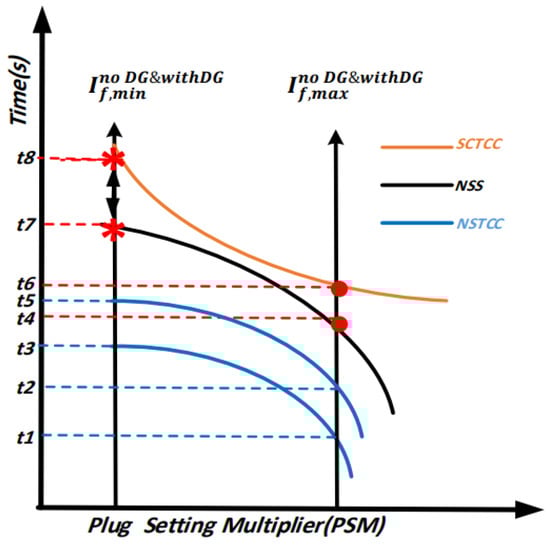
Figure 4.
A Standard Tripping Current Characteristic (STCC), Nonstandard Scheme (NSS) and Proposed Nonstandard Tripping Current Characteristic (NSTCC).
The effect of adding renewable energy sources connected to the DN on the PSM and miscoordination problems that appear between OCRs during the maximum and minimum faults is shown in Figure 3b. Generally, the ratio between short-circuit current and the pickup current (Isc/Ip) is presented as a PSM. This section presents the importance of using NSTCC in coordinating the OCRs as illustrated in Figure 4. The fault’s location near or at the end of the protected zone is responsible for obtaining the OCR coordination task. The fault’s location near the protected line (maximum fault current) is covered by the F1 point, while the end of the protected zone (minimum fault current) is related to the F2 point. The two scenes were selected to attain the required CTI, cover on time attributes, and raise the OCR OT because of the addition of sources of renewable energy as shown in Figure 3 and Figure 4.
It can be noticed that in Figure 4, the curve of the standard time–current characteristic (STCC) has high values of fault currents at both maximum and minimum fault currents. This curve represents the inverse definite minimum time (IDMT) overcurrent relay. As seen in Figure 4, the OTs of the STCC at the minimum and maximum fault current are and , which are unchangeable values. Then, two variables’ coefficients A and B for the maximum and minimum faults are required to reduce the tripping time effectively to control the two sides of the curve of the STCC. The researchers in the available literature such as [20,44] used this approach to reduce the operating time; however, this leads to increasing the number of constraints which is another disadvantage. In addition, the authors in ref. [25] have proposed the curve of the nonstandard scheme (NSS), which is represented by the black curve in Figure 4; they have used Equation (4) with constant coefficient A equal to 5.8. Yet, due to the curve being constant as seen in Figure 5, the fault currents at minimum faults, especially in islanding mode, are still slightly high-valued and there is a delay time that will lead to miscoordination problems between OCRs at as seen in Figure 4. In this work, this gap can be filled by using the NSTCC which reduces the tripping time compared with the STCC at maximum and minimum faults and nonstandard curve in ref. [25] by making the coefficient A a variable needed to have optimal value to achieve the best reduction in the total OT for relays. The coefficient A in the proposed NSTCC is controllable at both the maximum and minimum fault currents as shown in Figure 4; the blue curves represent the NSTCC and they illustrate how just the one variable coefficient A can control at both ends of the curve and reduce the OCR tripping time. It can be seen that the NSTCC can decrease the OT from to and from to at minimum and maximum faults.
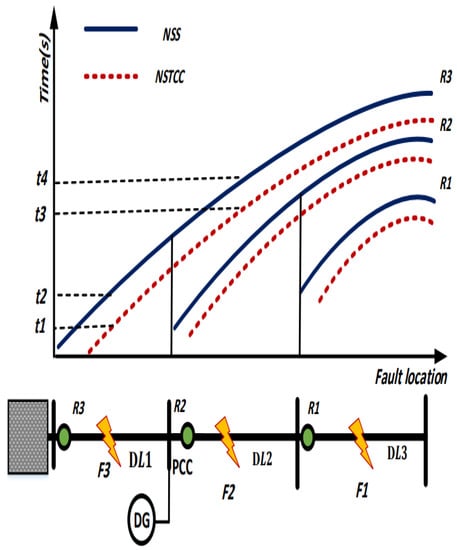
Figure 5.
Proposed Nonstandard Time–Current Characteristics with variable coefficient A (NSTCC) and Nonstandard Scheme with constant coefficient A (NSS).
For the first point, the minimum tripping time (maximum fault current) must be guaranteed by each OCR in the DN. A lower OT is provided by using the NSTCC curve which is represented by the red dotted line compared to NSS which is demonstrated by the black line, as shown in Figure 5. With the existence of the DG units at the grid at the minimum fault current (islanding current) for the second point, the OCR OT will be increased more than the distribution grid in absence of the DGs. The avoidance of any miscoordination problem or nonoperational cases can be achieved by applying the proposed NSTCC curve, which minimizes the OCR tripping time as illustrated in Figure 5.
3.1. Formulating the OCR Coordination Problem
This study formulates the problem of OCR coordination in a DN that has DGs as a problem of optimization to discover the TMS which minimizes the OT for OCRs, insuring the selectivity between the primary relay and backup relay. This part introduces the suggested approach, mathematical formulae of the optimization for solving the issue of coordination, and the performance of the OCR optimization techniques in the MG protection in comparison to the traditional protection approaches.
Objective Function
The main variable for the OCR coordination issue in Equation (4) is the TMS which manages the OT of the relay. In this section, the operational time for OCRs and the coordination problem, as described in Section 2, is formulated as an objective function. This objective function (OF) minimizes the overall OT for the main relay and backup relay. The operational time, t, for the total number of relays, x, and total number fault locations, y, is formulated as follows [29,36]:
where j is the relay number (j = 1, 2, …., x), k is the fault location number (k = 1, 2, …, y), and is the operational time for j relay at k fault. In this work, the NSTCC is used to calculate the total tripping time, OT, where the coefficient A is controllable at both the maximum and minimum fault currents. Equation (5) can be rewritten as follows:
There are various constraints taken into consideration during application of the OF in Equations (5) and (6) as shown below:
- Coordination Criteria and Selectivity
The selectivity constraint for OCR coordination aims to add operational time delays between the primary and backup OCRs, to minimize power outages on the network based on the location of the fault. The backup OCR will not work except when the main OCR is nonoperational. The formulation of the criteria for selectivity can be done based on CTI as constraints of inequality:
where represents the OT for primary relays and represents the OT for backup relays. Generally, the CTI (in seconds) is between 0.2–0.5 to guarantee selectivity [29,30,31,32,33,34,35,36,37]. The value of CTI is dependent on various parameters like relay type and circuit breaker speed. This study works with a CTI from 0.2 to 0.5.
- Relay Setting, Operating Time Bounds:
To keep the limitations of operational time, the constraints should be presented for the minimal and maximal OCR operational time. Nevertheless, the protective relays should have quick operation taking the minimum possible time; if the OCR operation takes more time, there will be damage to the equipment and an unstable power system. The minimal and maximal operation time bounds are shown below:
where and are the minimal and maximal TMS values of relay j and and represent the minimal and maximal time of operation needed for the relay j [28,30]. The OCRs’ operation must be within the protection scheme’s normal operation time. As a result, the PSM needs to be set in the domain of the minimal and maximal values in the minimum and maximum fault currents in the relay, even with light overloads.
- Proposed Setting of Coefficient Bounds:
In this study, the characteristic coefficient in Equation (4) is considered as a decision variable, as presented in Equation (6). In previous studies, the inverse curve requires more than one variable coefficient to shift it upwards and downwards [20,45], which leads to greater OCR tripping times with a slight shift in steepness and increase in the number of constraints. This causes miscoordination between primary and backup relays. For development purposes, the NSTCC is formulated in Equation (4) with just a single variable coefficient, which is A. The NSTCC tends to shift the curve downwards by changing values; this leads to a reduction in OCR tripping times and the reduction of constraints. As a result, the OCR coordination performance is guaranteed. The following equation shows the maximum and minimum bounds of the variable coefficient A:
where and represent the minimal and maximal variable coefficient needed for relay j. It has been chosen to be between 2 and 6.5 in this study.
3.2. Optimization Methods for Solving the OCR Coordination Problem
In Section 3.2, the OCR coordination problem in a network connected to DGs is presented as an optimization task. This section presents two optimization algorithms, namely GA and GSA–SQP, as common and new powerful optimization algorithms for solving OCR coordination problems [8,37].
3.2.1. Genetic Algorithm Optimization (GA)
For solving complicated optimization problems, the genetic algorithm (GA) has been vastly used as an iterative optimization technique [46,47]. The GA technique considers various applicable solutions to obtain the best solution; it proves its worth in the power system protection coordination problem. Using GA in [37,47] was solely for power grids, without considering nonstandard OCR curves and renewable energy sources. In this study, the GA methodology is utilized as an innovative iterative optimization model to transact with the overcurrent coordination problem for a distribution system with DGs. Generally, the simulation of the GA is used with a specific population size, where the possible solutions for the proposed optimization problem are described by the population. Chromosome populations or individuals are the possible solutions in the population [37,39]. In the next step, an OF evaluates all solutions for the current generation; this step is called the fitness function (Equation (6)). The result of the fitness value is mainly associated with the proposed optimization problem for each solution. Creating a new population uses fitness evaluation by utilizing selecting, crossing, and mutating techniques.
In this paper, the general GA flowchart for the proposed ORC coordination problem is presented in Table 2. The process of the GA model launches for a profile group of first-generation OCR OTs. Therefore, for each OCR OT profile, Equation (6) of the objective function is used to evaluate fitness. Thus, an appropriate selection technique picks the parent OCR operating time profiles. For the next generation, the selection of the best performance (better fitness value or fittest solution) will be selected. These profiles are chosen for crossover as well as for creating a new generation (population); this step known as reproduction. From the profiles of the parent, the common genes of parents are retained to create the profile of a new generation of the OT whereas the residual genes are chosen at random from the parents. Nevertheless, the power network or relay constraint might be violated by the child OT profile; consequently, for examination purposes, whether the profile of the child is under the constraints or not, a feasibility test has been applied. Sometimes the child profiles are assigned to the impracticable zone. Then, the solution of the child, in this case, will be refused and an alternative one will be generated by randomizing the uncommon genes until the feasibility of the child profile is realized. At the initial time and for the initial iterations, the expectation about child profile will be varied and far away from parent OCR operation solutions. Nonetheless, in each iteration, the profiles of both children and parents are nearer to each other, and the search directs closely to the optimum OCRs operation time profile. Achieving the greatest number of iterations or reaching the proposed threshold is the goal of this process, which will be repeated many times until meeting this goal.
Table 2.
The procedures of the GA technique.
3.2.2. A Hybrid Algorithm Gravitational Search Algorithm–Sequential Quadratic Programming (GSA–SQP)
The GSA–SQP algorithm is presented by refs. [8,48] as a powerful optimization solver for OCR coordination. Firstly, the GSA–SQP algorithm is presented as a multipoint method of search that is based on probability through using the gravitational search algorithm (GSA). Secondly, non-linear programing (NLP) techniques such as sequential quadratic programming (SQP), which are the single-point method of search, have the disadvantage of getting trapped in a local optimum point when the first option is closer to the local optimum. The NLP techniques offer a globally optimal solution if the correct first choice is made [48]. The study by ref. [48] suggested a hybrid of GSA with SQP to take advantage of the methods while overcoming their drawbacks. The SQP routine is introduced in GSA as a local technique of search to boost the convergence. Initially, the GSA method is performed and the best fitness for each generation is chosen in each interaction. From this, the corresponding agent is set as the initial value of the variables in the SQPP technique. The SQP routine is then executed according to the local search’s adopted probability of local search (), improving the best fitness obtained from GSA in the current interaction. This is how the algorithm of GSA–SQP offers the global optimal solution. For calculating the optimal setting of the OCRs, several agents that represent a complete solution set are presented as the control variable of the OCR coordination problem, X.
where N is the population size (agents in the system), j = 1, 2,…; N and m are the numbers of the relay in the grid. The process of the GSA–SQP started with a set of the first-generation OCR operation time profiles based on the power network and fault calculation data. Then, for each OCR operation time profile, the objective function (Equation (6)) is used as an evaluation and fitness approach in this work. Thus, the best and worst solutions will be selected. For the next generation, a random number will be generated and compared to the constant . In the case that the random number is less than the , the model will calculate the gravitational constant at time t, G(t), masses of agents, M(t), and the total force that acts on the i-th agent at time t, F(t), to update the velocity and position of the searching agent. In case of a random number larger than the , the SQP method will be used to update the next generation by selecting the new agent as the best agent. Finally, the GSA–SQP model will select the optimal solution among all solutions which is helped to achieve the global solution as shown in Figure 6. The parameters of the algorithm applied for the optimal coordination problem in this paper are: constant G0, the initial gravitational which is set to 100, and constant α, a user-specified value which is adjusted to 20. Both constants G0 and α control the GSA performance. t is the current iteration while is the maximum iteration number which is set to 200; N is adjusted to 50; is 95. For miscoordination problems, β has been used. Miscoordination decreases with increasing β; however, the relay OTs rise. Thus, for omitting the miscoordination, a fit β value should be selected. In addition, there are other parameters related to local search that should be calculated throughout the process which are: G(t), the gravitational constant at time t, M(t), the masses of agents, F(t), the total force that acts on the i-th agent at time t, and a(t), the acceleration of the i-th agent. For meshed network case studies, the weighting factors are chosen as and which are set to 2 and 15, respectively. IEEE 9-bus system β is set to 500 and the IEEE 30-bus system is set to 1000.

Figure 6.
The flowchart of the GSA–SQP algorithm.
4. Simulation Results and Discussion
This section aims to present the results of the proposed nonstandard OCR coordination approach, NSTCC, using radial and meshed distribution systems and under different operating scenarios. Throughout this section, the NSTCC will be compared to the conventional OCR coordination scheme and nonstandard OCR scheme developed by ref. [25]. For solving the OCR protection coordination problem, GA and hybrid GSA–SQP optimization techniques are used in this study based on the following network scenarios:
- Radial Networks: IEEE 9-bus test system and IEC MG benchmark.
- Meshed Networks: IEEE 9-bus and IEEE 30-bus meshed networks.
4.1. Radial Networks
In this part, an IEEE 9-bus test system and IEC MG benchmark have been carried out as a radial network. Figure 7 shows the flowchart for the implementation of NSTCC in radial networks. Afterwards, the short-circuit calculations in various modes and locations were achieved. In this section, the GA method has been used to obtain the optimal setting (TMS and the coefficient A) for OCRs based on STCC [25], NSS [25], and the proposed NSTCC in this paper. Furthermore, the NSTCC has been compared with the STCC and NSS in terms of reducing the relays’ operation time, OT, and ensuring the CTI selectivity. For solving the OCR protection coordination problem, the GA technique is used in this section based on the presented network configurations in Figure 7.

Figure 7.
Flowchart of the Implementation of the NSTCC in Radial Networks.
4.1.1. The Radial 9-Bus Test Systems
The proposed network system is developed based on the Canadian Urban Benchmark 4-bus feeder distribution system [49]. As shown in Figure 8, the IEEE 9-bus consists of one DG and 10 OCRs as well as 2 directional OCRs, DOCRs, which are R8 and R10. A utility main source feeds this radial distribution capacity of short circuit = 500 MVA as well as the ratio of X/R = 6 and all lines with length = 500 m. The system is associated with the utility throughout a transformer of 20 MVA, 115 kV/12.47 kV. The simplified network, as shown in Figure 8, presents the OCRs and DOCRs. The plug setting (PS) and the current transformer ratio (CTR) for each OCR are stated as follows: for R1 and R5, the PS and CTR are 1.128 and 100/1, respectively, while 1.130 and 200/1 are the values of the PS and CTR for the R2 and R6. For all R3, R7, R8, and R9, the values of PS and CTR are 1.132 and 300/1, respectively. 1.135 and 400/1 are the PS and CTR values for all R4, R10, and R11. Lastly, the PS and CTR of the R12 are 1.140 and 600/1, respectively [25]. In the following subsection, the results of the proposed NSTCC, STCC, and NSS schemes are presented over different fault and power network model scenarios, as discussed in the previous section.

Figure 8.
The IEEE 9-Bus MG system.
- Radial IEEE 9-Bus System without DGs: Mode 1 test results
This mode represents a conventional power network, which is fed only via the main utility feeder without DGs, as shown in Figure 8. The GA optimization technique is used to evaluate the performance of the NTSCC method and compare it with the conventional STCC and the NSS [25]. In general, the optimized values of TMS, the overall OT, and coefficient A in mode 1 for all OCRs are presented in Table 3. The acquired settings and the total tripping time were computed by utilizing MATLAB software and GA methodology. As shown in Table 3, the NSTCC approach achieved the minimum overall OT of all OCRs which equals 8.224 s, compared to the STCC and NSS methods which are equal to 9.352 and 8.848 s, respectively. In addition, the optimized value of coefficient A for the NSTCC approach has been chosen as approximately 5 for all OCRs as shown in Table 3, which is a suitable value for maximum current faults in this conventional power network case.
Table 3.
The Overall OT for STCC, NSS, and NSTCC Curves in IEEE 9-Bus (DGs- Mode 1).
- Radial IEEE 9-Bus System with DGs: Mode 2 test results
Integration of the DGs in the network leads to raising the complexity of obtaining the optimal OCR coordination. This mode tests and evaluates the NSTCC on the network that is fed by all types of DGs, as illustrated in Figure 8. Table 4 shows the optimized values of TMS, the overall OT, and coefficient A in mode 2 for all OCRs. The total OT of the NSTCC in mode 2 of all OCRs equals 9.327 s, while the overall OTs for the STCC and NSS are 11.282 and 10.353 s, respectively. As with mode 1, an appropriate optimized value of coefficient A has been selected in mode 2 for the NSTCC approach, which is approximately 5 for all OCRs as illustrated in Table 4. As a result, the NSTCC scheme has recorded the lowest overall OT in Table 4 and optimal optimized value of the coefficient A.
Table 4.
The Overall OT for STCC, NSS, and NSTCC Curves in IEEE 9-Bus (DGs- Mode 2).
- Radial IEEE 9-Bus System under the islanding condition: Mode 3 test results
The grid’s operational way in this mode is called islanding mode. Applying the NSCC on the network with this mode shows the reliability and effectiveness of the proposed approach with a low fault current. Over the islanding mode, a comparison has been made between the proposed approach and other approaches in the Table 5, in terms of the optimized values of TMS and the overall OT. Similarly, the NSTCC approach achieves the minimum overall operational time of all OCRs compared to STCC and NSS approaches. The overall OT of all OCRs in mode 3 is 1.3728, 1.34, and 1.187 s for STCC, NSS, and NSTCC, respectively. It can be noticed that the optimized value of coefficient A in the Table 5 (islanding mode) for the NSTCC approach has been chosen to be approximately 2, which is suitable for detecting the minimum fault currents, and it is considered the key contribution of this NSTCC approach without delaying time during the optimization task.
Table 5.
The Overall OT for STCC, NSS, and NSTCC Curves in Radial IEEE 9-Bus—Mode 3.
- Discussion of the Radial IEEE 9-Bus System results
In this section, the performance of proposed NSTCC, NSS, and STCC approaches on the radial IEEE 9-bus system over the different operation modes is presented. The overall OT for operation modes shown in Figure 9 was obtained by using the GA algorithm. The previous subsections show that the NSTCC approach reduced the overall OT of OCRs for all modes compared to NSS and STCC approaches. For example, the NSTCC reduced the overall OT in Mode 2 by 17.32% and 9.91% compared to NSS and STCC approaches, respectively.
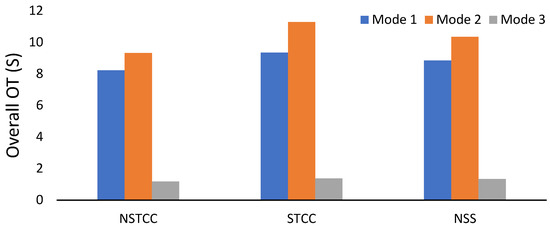
Figure 9.
The overall OT in Modes 1, 2, and 3.
4.1.2. The Radial IEC MG Test System
IEC MG benchmark connected to various DG technology types has been used to evaluate the NSTCC in this section. As shown in Figure 10, it has 4 DGs (two wind turbines and two synchronous generators), 5 transformers, and uses 15 OCRs as well as 5 DOCRs which are R1, R3, R5, R8, and R9, Refs. [49,50] give all details about IEC MG. The PS and CTR for each OCR and DOCR are described as follows: for R1, R2, R3, R4, R5, R6, R8, R9, R10, R12, and R15, the PS and CTR are 0.5 and 400/1, respectively. Whereas for R11 and R14, the PS is 0.65 and CTR is the same as the previous OCRs, which is 400/1. The PS and CTR values of the R13 are 0.88 and 400/1. Finally, for R7, the PS and CTR are 1 and 1200/1, respectively [25]. A short circuit on different lines was calculated for each mode in this study. The three-phase faults at different transmission lines in the MG are illustrated in Figure 10. In Figure 10, the DG is considered as a PMSG system where the contribution of fault current is low, similar to our case with the PV system, compared to the DFIG system, which is considered as high fault: around 7 times the full load. However, the DFIG condition will be protected by the first relay after the generator in this work.

Figure 10.
IEC MG Benchmark (Large-Scale Network).
These fault cases are: a fault on the line DL-5, named F1; a fault on the line DL-4, named F2; a fault on the line DL-2, named F3; a fault on the line DL-3, named F4; and a fault on the line DL-1, named F5. To optimize the TMS for the coordination of OCRs, GA optimization processes have been carried out to test the NSTCC using MATLAB simulations. For fault conditions, the primary OCR should isolate the fault firstly. If it fails to trip the fault, after allowable CTI, the backup OCR must be operated; it is assumed to be operated between 0.2 s and 0.5 s. Three operational modes have been implemented in this IEC MG.
- The radial IEC MG Simulation Results in Mode 1
In this case, the main source is only connected to the IEC MG; however, all the DGs are off. For comparative purposes, the results of the TMS and the operating times for all relays that were obtained from the literature [29,36,51,52] are presented in Table 6. The authors in ref. [25] did not evaluate the IEC MG as a radial system. It can be noticed that the proposed obtained OT equals 2.42 s for the proposed NSTCC, which is a considerable reduction from those reported in the Table 6.
Table 6.
The Overall OT for the radial IEC MG—Mode 1.
- The radial IEC MG Simulation Results in Mode 2
In this operational mode, the MG is connected to the main grid and the DG units. The results of the TMS and the operating times for all relays that were obtained from the literature [29,36,51,52] are presented in Table 7. It can be guaranteed that the value of the coordination between the primary and backup relays is achieved by obtaining the lowest tripping time for the NSTCC among the approaches reported in Table 7. The total OT was equal to 4.69 s for NSTCC compared to 11.6 s as the lowest OT value obtained from literature, which equals a 60% reduction for using NSTCC. The coefficient A’s optimized value equals approximately 4.8 too according to the maximum fault current in this mode.
Table 7.
The Overall OT for the radial IEC MG—Mode 2.
- The radial IEC MG Simulation Results in Mode 3
In mode 3, the MG operates in islanding mode, in which the main grid is in off-grid mode and the load is supplied by all the DG units. The results of the OCR coordination obtained from the literature [29,36,51,52] are shown in Table 8. In this case, too, the proposed approach NSTCC outperformed the other approaches that are reported in Table 8. The proposed NSTCC achieved an OT equal to 4.055 s as the lowest value among others in Table 8. Consequently, the coordination problems may not exist, which means the selectivity is guaranteed. The optimized value of coefficient A has been chosen as 6 in this mode to obtain the lowest OT value in Table 8.
Table 8.
The Overall OT for the radial IEC MG—Mode 3.
- Discussion of the radial IEC MG results
In this section, the performance of the proposed NSTCC and approaches from the literature [29,36,51,52] on the radial IEC MG over the different operation modes is presented. The overall operation time, OT, for relays was obtained by using the GA algorithm and is shown in Figure 11. The previous subsections show that the NSTCC approach reduced the overall OT of OCRs for all modes compared to approaches in the literature [29,36,51,52]. For example, compared to the literature approaches [29,36,51,52], the NSTCC reduced the overall OT in Mode 1 by 63.55%, 55.5%, 45.0%, and 47.7%, respectively.
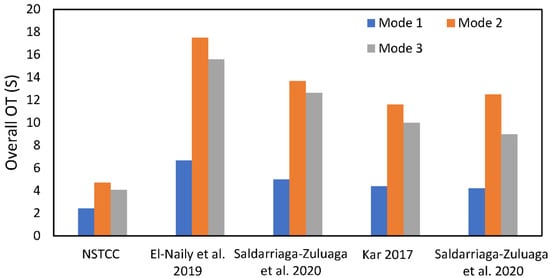
Figure 11.
The overall OT in Modes 1, 2, and 3 for the radial IEC MG by different approaches from the literature (Saldarriaga-Zuluaga et al. 2020 [29], El-Naily et al. 2019 [36], Kar 2017 [51], Saldarriaga-Zuluaga et al. 2020 [52]).
4.2. Meshed Networks
In this section, IEEE 9- and 30-bus meshed networks have been implemented to evaluate the proposed NSTCC approach. Figure 12 shows the flowchart for the implementation of NSTCC in radial networks. Afterwards, the short-circuit calculations in various modes and locations were performed. The MATLAB software is used to implement the proposed equation with the constant coefficient 5.8 and with the variable coefficient A for obtaining the short-circuit calculations. The optimal setting, TMS, the coefficient A, and Ip for OCRs have been obtained by using the MATLAB software and applying the hybrid GSA–SQP algorithm for the NSTCC approach. Finally, the NSTCC with a constant coefficient 5.8 and a variable constant A has been compared with the STCC to show the effectiveness of the proposed approach in terms of reducing the OT considerably and ensuring the CTI selectivity.

Figure 12.
Meshed Networks Flowchart of the Proposed NSTCC.
The main steps of using the hybrid GSA–SQP by applying it in the MATLAB software can be shown as follows:
- The objective function for the IEEE 9-bus system is run on the MATLAB software; it includes the short-circuit calculation values for all points that have been illustrated in Figure 13 from point A to L.
 Figure 13. IEEE 9-Bus MG system, meshed network.
 - For example, when the fault occurs at the point A: for primary R1, backup R15, and R17, the fault current was 24779 A, 9150 A, and 15632 A, respectively. The OT of primary and backup relays for faults in A have been calculated based on Equation (4). The best value of the A parameter in Equation (4) will be determined by solving the cost function in Equation (6) by using GSA–SQP in the MATLAB platform.
4.2.1. Description of the Meshed 9-Bus Test Systems under Study
For solving the OCR coordination problem, the NSTCC is applied to this 9-bus test system by using the hybrid GSA–SQP algorithm. This grid consists of 12 lines and 24 OCRs, and every line has two relays at both ends as illustrated in Figure 13. The power is received via bus 1, which is represented by a source of 100 MVA, 33 KV and more details about this grid are given in [48]. Twelve fault points have been considered, indicated from A to L (one on each line) as shown in Figure 13. For these fault points, Table 9 shows the primary–backup relationship of relays and the CTI is taken at a minimum of 0.2 s. In case of fault at different points, the short-circuit analysis has been conducted to find the current seen by the relays.
Table 9.
CTI for the Meshed 9-bus Test System.
The optimized TMS and Ip values and OTs based on a hybrid GSA–SQP algorithm are compared with obtained results in ref. [8]. The NSTCC reduces the overall operational time of primary OCRs to 1.869 s compared to the results that are illustrated in Table 10. The coefficient A’s optimized value is selected to be approximately 6.25 by MATLAB software operations in this case to obtain the lowest OT. The corresponding values of CTI are shown in the Table 9. The optimum results ensure the coordination between primary and backup relays. Further, the CTI is improved by using the NSTCC approach; the sum of CTI values equals 7.392, which is reduced compared with the sum of CTI values in ref. [8], which equals 8.892. The NSTCC scheme results in the best settings.
Table 10.
Optimal TMS, Ip, and A for the Meshed 9-bus Test System.
4.2.2. Description of the Meshed 30-Bus Test Systems under Study
The IEEE 30-bus system is considered as a meshed test system in this study to evaluate the proposed approach’s efficiency in solving large, meshed networks. As shown in Figure 14, it has 19 lines and 38 DOCRs and it receives power from three distribution substations by bus 1, 6, and 13; each one is represented by a source of 132 MVA, 33 KV as well as with two DG units. The nineteen fault points are labeled as L1 to L19; for each line, there is one fault point as shown in Figure 14. The primary–backup coordination of relays for these fault points and CTI values are illustrated in Table 11 and the optimal TMS, Ip, and A for the meshed 30-bus test system is presented in Table 12. The configurations of the short circuits’ current values and more information can be found in ref. [53]. The TMS range is between 1.1 to 1 and for Ip, from 1.4 to 5.9. The minimum value of the CTI is set as 0.3 s.
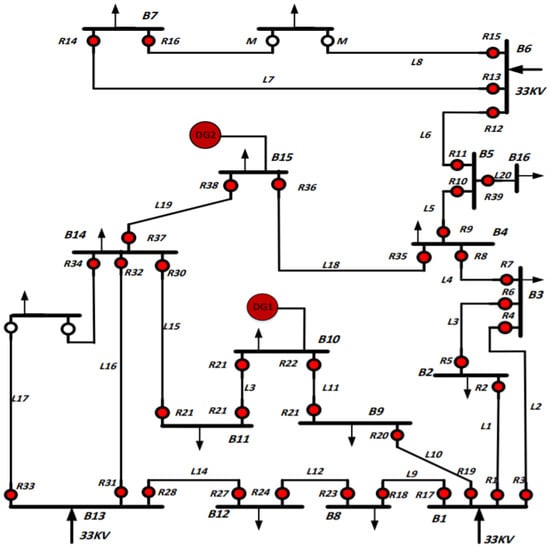
Figure 14.
IEEE 30-Bus MG system (Large-Scale Network).
Table 11.
CTI for the Meshed 30-bus Test System.
Table 12.
Optimal TMS, Ip, and A for the Meshed 30-bus Test System.
The optimized values of TMS, Ip, and OTs utilizing NSTCC with the hybrid GSA–SQP algorithm are illustrated in Table 12. It can be noticed from these results that NSTCC is the best approach and achieved the minimum overall OT of all OCRs of 12.231 s compared to 26.826 s and 19.727 s, for the STCC and NSTCC with constant coefficient A, respectively, as it is shown in Table 12. The CTI values calculated from the optimized TMS and Ip are shown in Table 11 and the coordination between primary and backup relays are ensured by the optimal results. Therefore, this signifies that the NSTCC can be efficiently used for solving the OCR coordination problem for the meshed and large-scale power systems.
4.2.3. Discussion of the Meshed Network Results
In this section, the performance of proposed NSTCC and approaches from the literature (STCC and NSTCC with constant coefficient A) on the IEEE 9- and 30-bus meshed networks are presented. The overall OTs for operation modes are shown in Figure 15 and were obtained by using the hybrid GSA–SQP algorithm. The previous subsections show that the NSTCC approach reduced the overall OT of OCRs for all modes compared to approaches from the literature. For example, the NSTCC reduced the overall OT in the meshed 30-bus test system by 54.4% and 37.9% compared to the literature approaches STCC and NSTCC with constant coefficient A, respectively.

Figure 15.
The overall OT in NSTCC with constant coefficient A, STCC by Radosavljević et al., 2016 [8], and NSTCC for the meshed 9- and 30-bus MGs.
5. Conclusions
An approach for the optimal coordination of OCRs in MGs that integrate DGs has been presented in this article. The approach has been successful in sustaining constant CTI between the primary and backup relay pairs and offering lower tripping times than the recent NSS introduced in the literature for different fault currents. The proposed NSTCC applies to long radial feeders and large meshed grids. The NSTCC is implementable when there is sufficient variance in the maximum and minimum fault currents. The GA algorithm was applied with several tests in radial networks, including the IEEE 9-bus test system and benchmark IEC MG that both integrate DGs under various operational modes. In all operational modes (grid-connected and islanding mode), better total operational times have been obtained by the proposed approach. Additionally, the hybrid GSA–SQP algorithm was carried out based on the proposed scheme in the 9- and 30-bus IEEE standard meshed power system to solve the OCR coordination optimization problem. This illustrates the superiority of the NSTCC in reducing operational time in meshed networks; hence, it is effective in both radial structures and meshed systems. These results broaden our understanding of the concept of using nonstandard curves in industrial relays to obtain optimal, flexible, and reliable outcomes. Regardless, future research could continue to explore the extent of applicability this proposed scheme has in the coordination of overcurrent relays with distance relays in radial networks. In addition, applying the proposed approach to hardware in the loop to confirm its reliability is possible.
Author Contributions
Conceptualization, S.A. and Y.H.; methodology, S.A. and Y.H.; software S.A. and Y.H.; validation, F.A., N.E.-N. and S.A.; formal analysis, F.A., N.E.-N. and S.A.; investigation, S.A. and Y.H.; resources, all authors; data curation, all authors; writing—original draft preparation, F.A., N.E.-N. and S.A.; writing—review and editing, all authors; visualization, all authors; supervision, all authors; project administration, S.A. All authors have read and agreed to the published version of the manuscript.
Funding
This research received no external funding.
Data Availability Statement
Not available.
Conflicts of Interest
The authors declare no conflict of interest.
References
- Alasali, F.; Haben, S.; Holderbaum, W. Energy management systems for a network of electrified cranes with energy storage. Int. J. Electr. Power Energy Syst. 2019, 106, 210–222. [Google Scholar] [CrossRef]
- Gomes, M.; Coelho, P.; Moreira, C. Microgrid protection schemes. In Microgrids Design and Implementation; Springer: Berlin/Heidelberg, Germany, 2019; pp. 311–336. [Google Scholar]
- Abeid, S.; Hu, Y. Overcurrent relays coordination optimisation methods in distribution systems for microgrids: A review. In Proceedings of the 15th International Conference on Developments in Power System Protection (DPSP 2020), Liverpool, UK, 9–12 March 2020. [Google Scholar]
- Jamali, S.; Borhani-Bahabadi, H. Non-communication protection method for meshed and radial distribution networks with synchronous-based DG. Int. J. Electr. Power Energy Syst. 2017, 93, 468–478. [Google Scholar] [CrossRef]
- So, C.; Li, K.; Lai, K.; Fung, K. Application of genetic algorithm for overcurrent relay coordination. In Proceedings of the Sixth International Conference on Developments in Power System Protection (Conf. Publ. No. 434), Nottingham, UK, 25–27 March 1997. [Google Scholar] [CrossRef]
- Zeineldin, H.; El-Saadany, E.; Salama, M. Optimal coordination of overcurrent relays using a modified particle swarm optimization. Electr. Power Syst. Res. 2006, 76, 988–995. [Google Scholar] [CrossRef]
- Bhesdadiya, R.; Trivedi, I.N.; Jangir, P.; Kumar, A. A novel hybrid approach particle swarm optimizer with moth-flame optimizer algorithm. In Advances in Computer and Computational Sciences; Springer: Berlin/Heidelberg, Germany, 2017; pp. 569–577. [Google Scholar]
- Radosavljević, J.; Jevtić, M. Hybrid GSA-SQP algorithm for optimal coordination of directional overcurrent relays. IET Gener. Transm. Distrib. 2016, 10, 1928–1937. [Google Scholar] [CrossRef]
- Purwar, E.; Vishwakarma, D.N.; Singh, S.P. A Novel Constraints Reduction-Based Optimal Relay Coordination Method Considering Variable Operational Status of Distribution System with DGs. IEEE Trans. Smart Grid 2019, 10, 889–898. [Google Scholar] [CrossRef]
- Saberi, N.A.; Sadeh, J.; Rajabi, M.H. A New Index for Constraint Reduction in Relay Coordination Problem Considering Uncertainty. J. Iran. Assoc. Electr. Electron. Eng. 2011, 8, 59–67. [Google Scholar]
- Zeineldin, H.H.; Sharaf, H.M.; Ibrahim, D.K.; El-Zahab, E.E.-D.A. Optimal Protection Coordination for Meshed Distribution Systems With DG Using Dual Setting Directional Over-Current Relays. IEEE Trans. Smart Grid 2016, 7, 1757. [Google Scholar] [CrossRef]
- Beder, H.; Mohandes, B.; El Moursi, M.S.; Badran, E.A.; El Saadawi, M.M. A New Communication-Free Dual Setting Protection Coordination of Microgrid. IEEE Trans. Power Deliv. 2021, 36, 2446–2458. [Google Scholar] [CrossRef]
- Alam, M.N.; Das, B.; Pant, V. An interior point method based protection coordination scheme for directional overcurrent relays in meshed networks. Int. J. Electr. Power Energy Syst. 2016, 81, 153–164. [Google Scholar] [CrossRef]
- Yazdaninejadi, A. Protection coordination of directional overcurrent relays: New time current characteristic and objective function. IET Gener. Transm. Distrib. 2018, 12, 190–199. [Google Scholar] [CrossRef]
- Henville, C. Combined use of definite and inverse time overcurrent elements assists in transmission line ground relay coordination. IEEE Trans. Power Deliv. 1993, 8, 925–932. [Google Scholar] [CrossRef]
- Saleh, K.A.; Zeineldin, H.H.; Al-Hinai, A.; El-Saadany, E.F. Optimal coordination of directional overcurrent relays using a new time–current–voltage characteristic. IEEE Trans. Power Deliv. 2014, 30, 537–544. [Google Scholar] [CrossRef]
- Jamali, S.; Borhani-Bahabadi, H. Recloser time–current–voltage characteristic for fuse saving in distribution networks with DG. IET Gener. Transm. Distrib. 2017, 11, 272–279. [Google Scholar] [CrossRef]
- Kılıçkıran, H.C.; Akdemir, H.; Şengör, I.; Kekezoğlu, B. A non-standard characteristic based protection scheme for distribution networks. Energies 2018, 11, 1241. [Google Scholar] [CrossRef] [Green Version]
- Keil, T.; Jager, J. Advanced coordination method for overcurrent protection relays using nonstandard tripping characteristics. IEEE Trans. Power Deliv. 2007, 23, 52–57. [Google Scholar] [CrossRef]
- Yazdaninejadi, A.; Nazarpour, D.; Golshannavaz, S. Dual-setting directional over-current relays: An optimal coordination in multiple source meshed distribution networks. Int. J. Electr. Power Energy Syst. 2017, 86, 163–176. [Google Scholar] [CrossRef]
- Ojaghi, M.; Ghahremani, R. Piece-wise Linear Characteristic for Coordinating Numerical Overcurrent Relays. IEEE Trans. Power Deliv. 2017, 32, 145–151. [Google Scholar] [CrossRef]
- Azari, M.; Mazlumi, K.; Ojaghi, M. Efficient non-standard tripping characteristic-based coordination method for overcurrent relays in meshed power networks. Electr. Eng. 2022, 1–18. [Google Scholar] [CrossRef]
- Sharaf, H.M.; Zeineldin, H.H.; Ibrahim, D.K.; EL-Zahab, E.E.D.A. A proposed coordination strategy for meshed distribution systems with DG considering user-defined characteristics of directional inverse time overcurrent relays. Int. J. Electr. Power Energy Syst. 2015, 65, 49–58. [Google Scholar] [CrossRef]
- Karegar, H.K. Relay curve selection approach for microgrid optimal protection. Int. J. Renew. Energy Res. (IJRER) 2017, 7, 636–642. [Google Scholar]
- Alasali, F.; El-Naily, N.; Zarour, E.; Saad, S.M. Highly sensitive and fast microgrid protection using optimal coordination scheme and nonstandard tripping characteristics. Int. J. Electr. Power Energy Syst. 2021, 128, 106756. [Google Scholar] [CrossRef]
- Alasali, F.; Zarour, E.; Holderbaum, W.; Nusair, K.N. Highly Fast Innovative Overcurrent Protection Scheme for Microgrid Using Metaheuristic Optimization Algorithms and Nonstandard Tripping Characteristics. IEEE Access 2022, 10, 42208–42231. [Google Scholar] [CrossRef]
- Kida, A.A.; Rivas, A.E.L.; Gallego, L.A. An improved simulated annealing–linear programming hybrid algorithm applied to the optimal coordination of directional overcurrent relays. Electr. Power Syst. Res. 2020, 181, 106197. [Google Scholar] [CrossRef]
- Darabi, A.; Bagheri, M.; Gharehpetian, G.B. Highly sensitive microgrid protection using overcurrent relays with a novel relay characteristic. IET Renew. Power Gener. 2020, 14, 1201–1209. [Google Scholar] [CrossRef]
- Saldarriaga-Zuluaga, S.D.; López-Lezama, J.M.; Muñoz-Galeano, N. Optimal coordination of overcurrent relays in microgrids considering a non-Standard characteristic. Energies 2020, 13, 922. [Google Scholar] [CrossRef] [Green Version]
- Hussain, N.; Nasir, M.; Vasquez, J.C.; Guerrero, J.M. Recent developments and challenges on AC microgrids fault detection and protection systems–a review. Energies 2020, 13, 2149. [Google Scholar] [CrossRef]
- Elmitwally, A.; Kandil, M.S.; Gouda, E.; Amer, A. Mitigation of DGs impact on variable-topology meshed network protection system by optimal fault current limiters considering overcurrent relay coordination. Electr. Power Syst. Res. 2020, 186, 106417. [Google Scholar] [CrossRef]
- Manditereza, P.T.; Bansal, R. Renewable distributed generation: The hidden challenges–A review from the protection perspective. Renew. Sustain. Energy Rev. 2016, 58, 1457–1465. [Google Scholar] [CrossRef]
- Telukunta, V.; Pradhan, J.; Agrawal, A.; Singh, M.; Srivani, S.G. Protection challenges under bulk penetration of renewable energy resources in power systems: A review. CSEE J. Power Energy Syst. 2017, 3, 365–379. [Google Scholar] [CrossRef]
- El-Naily, N.; Saad, S.M.; Mohamed, F.A. Novel approach for optimum coordination of overcurrent relays to enhance microgrid earth fault protection scheme. Sustain. Cities Soc. 2020, 54, 102006. [Google Scholar] [CrossRef]
- Din, Z.; Zhang, J.; Xu, Z.; Zhang, Y.; Zhao, J. Low voltage and high voltage ride-through technologies for doubly fed induction generator system: Comprehensive review and future trends. IET Renew. Power Gener. 2021, 15, 614–630. [Google Scholar] [CrossRef]
- El-Naily, N.; Saad, S.M.; Hussein, T.; Mohamed, F.A. A novel constraint and non-standard characteristics for optimal over-current relays coordination to enhance microgrid protection scheme. IET Gener. Transm. Distrib. 2019, 13, 780–793. [Google Scholar] [CrossRef]
- Chabanloo, R.M.; Maleki, M.G.; Agah, S.M.M.; Habashi, E.M. Comprehensive coordination of radial distribution network protection in the presence of synchronous distributed generation using fault current limiter. Int. J. Electr. Power Energy Syst. 2018, 99, 214–224. [Google Scholar] [CrossRef]
- Aghdam, T.S.; Karegar, H.K.; Zeineldin, H.H. Optimal coordination of double-inverse overcurrent relays for stable operation of DGs. IEEE Trans. Ind. Inform. 2018, 15, 183–192. [Google Scholar] [CrossRef]
- Meskin, M.; Domijan, A.; Grinberg, I. Optimal co-ordination of overcurrent relays in the interconnected power systems using break points. Electr. Power Syst. Res. 2015, 127, 53–63. [Google Scholar] [CrossRef]
- Adelnia, F.; Moravej, Z.; Farzinfar, M. A new formulation for coordination of directional overcurrent relays in interconnected networks. Int. Trans. Electr. Energy Syst. 2015, 25, 120–137. [Google Scholar] [CrossRef]
- Coffele, F.; Booth, C.; Dyśko, A. An adaptive overcurrent protection scheme for distribution networks. IEEE Trans. Power Deliv. 2014, 30, 561–568. [Google Scholar] [CrossRef] [Green Version]
- Benmouyal, G.; Meisinger, M.; Burnworth, J.; Elmore, W.A.; Freirich, K.; Kotos, P.A.; Leblanc, P.R.; Lerley, P.J.; McConnell, J.E.; Mizene, J.; et al. IEEE standard inverse-time characteristic equations for overcurrent relays. IEEE Trans. Power Deliv. 1999, 14, 868–872. [Google Scholar] [CrossRef]
- Darabi, A.; Bagheri, M.; Gharehpetian, G. Dual feasible direction-finding nonlinear programming combined with metaheuristic approaches for exact overcurrent relay coordination. Int. J. Electr. Power Energy Syst. 2020, 114, 105420. [Google Scholar] [CrossRef]
- Protection, O. 7SJ62 SIPROTEC 4 7SJ62 multifunction protection relay. Siemens 2006, 38, 44. [Google Scholar]
- Tirumala Pallerlamudi Srinivas, S.; Swarup, K.S. Optimal Protection Coordination of Nonstandard Overcurrent Relays Using Hybrid QCQP Method. Electr. Power Compon. Syst. 2020, 48, 1327–1338. [Google Scholar] [CrossRef]
- Wadood, A.; Gholami Farkoush, S.; Khurshaid, T.; Kim, C.-H.; Yu, J.; Geem, Z.W.; Rhee, S.-B. An optimized protection coordination scheme for the optimal coordination of overcurrent relays using a nature-inspired root tree algorithm. Appl. Sci. 2018, 8, 1664. [Google Scholar] [CrossRef] [Green Version]
- Alasali, F.; Haben, S.; Holderbaum, W. Stochastic optimal energy management system for RTG cranes network using genetic algorithm and ensemble forecasts. J. Energy Storage 2019, 24, 100759. [Google Scholar] [CrossRef]
- Bedekar, P.P.; Bhide, S.R. Optimum coordination of directional overcurrent relays using the hybrid GA-NLP approach. IEEE Trans. Power Deliv. 2010, 26, 109–119. [Google Scholar] [CrossRef]
- Kennedy, J.; Eberhart, R. Particle swarm optimization. In Proceedings of the ICNN’95-International Conference on Neural Networks, Perth, Australia, 27 November–1 December 1995. [Google Scholar]
- Kar, S. A comprehensive protection scheme for micro-grid using fuzzy rule base approach. Energy Syst. 2017, 8, 449–464. [Google Scholar] [CrossRef]
- Saldarriaga-Zuluaga, S.D.; López-Lezama, J.M.; Muñoz-Galeano, N. Optimal coordination of over-current relays in microgrids considering multiple characteristic curves. Alex. Eng. J. 2021, 60, 2093–2113. [Google Scholar] [CrossRef]
- Saldarriaga-Zuluaga, S.D.; López-Lezama, J.M.; Muñoz-Galeano, N. An approach for optimal coordination of over-current Relays in Microgrids with distributed generation. Electronics 2020, 9, 1740. [Google Scholar] [CrossRef]
- Christie, R. Power Systems Test Case Archive: 30 Bus Power Flow Test Case. 1993. Available online: https://labs.ece.uw.edu/pstca/pf30/pg_tca30bus.htm (accessed on 4 July 2022).
Publisher’s Note: MDPI stays neutral with regard to jurisdictional claims in published maps and institutional affiliations. |
© 2022 by the authors. Licensee MDPI, Basel, Switzerland. This article is an open access article distributed under the terms and conditions of the Creative Commons Attribution (CC BY) license (https://creativecommons.org/licenses/by/4.0/).