
System Dynamics Modeling and Fuzzy MCDM Approach as Support for Assessment of Sustainability Management on the Example of Transport Sector Company


Abstract
:1. Introduction
- Policymakers would be able to evaluate the present sustainability level of the passenger rail transport systems using a proposed sustainability evaluation model that takes into account the triple bottom line (TBL) attributes of sustainability, including social and environmental impact. These TBL characteristics were culled from a large body of research on railway transport systems sorted by specialists. This methodology may be used as a solid foundation for implementing fundamental sustainability steps in a variety of passenger rail transport systems;
- Many details of the dynamic model used in transport systems have been provided. For this reason, the features and feedback loops are specific to rail transport management systems. Since road transport tolls have never been considered before, the money paid in order to use any road has been included in the present study among the important indicators;
- In order to determine the best scenarios affecting the future of the selected rail transport company as well as its sustainability, the Fuzzy-TOPSIS method has been used. This method helps managers to identify appropriate strategies for their companies.
2. Background of Sustainability in Rail Transport Systems, System Dynamics, and Fuzzy-TOPSIS Logic
2.1. Background of Sustainability in Transport Systems
2.2. System Dynamics Modelling
2.3. Fuzzy-TOPSIS Method
3. Proposed Method
3.1. Problem Definition and Proposed Model
3.2. Key Indicators and Concepts of Railway Sustainability
3.3. The Cause and Effect Graph
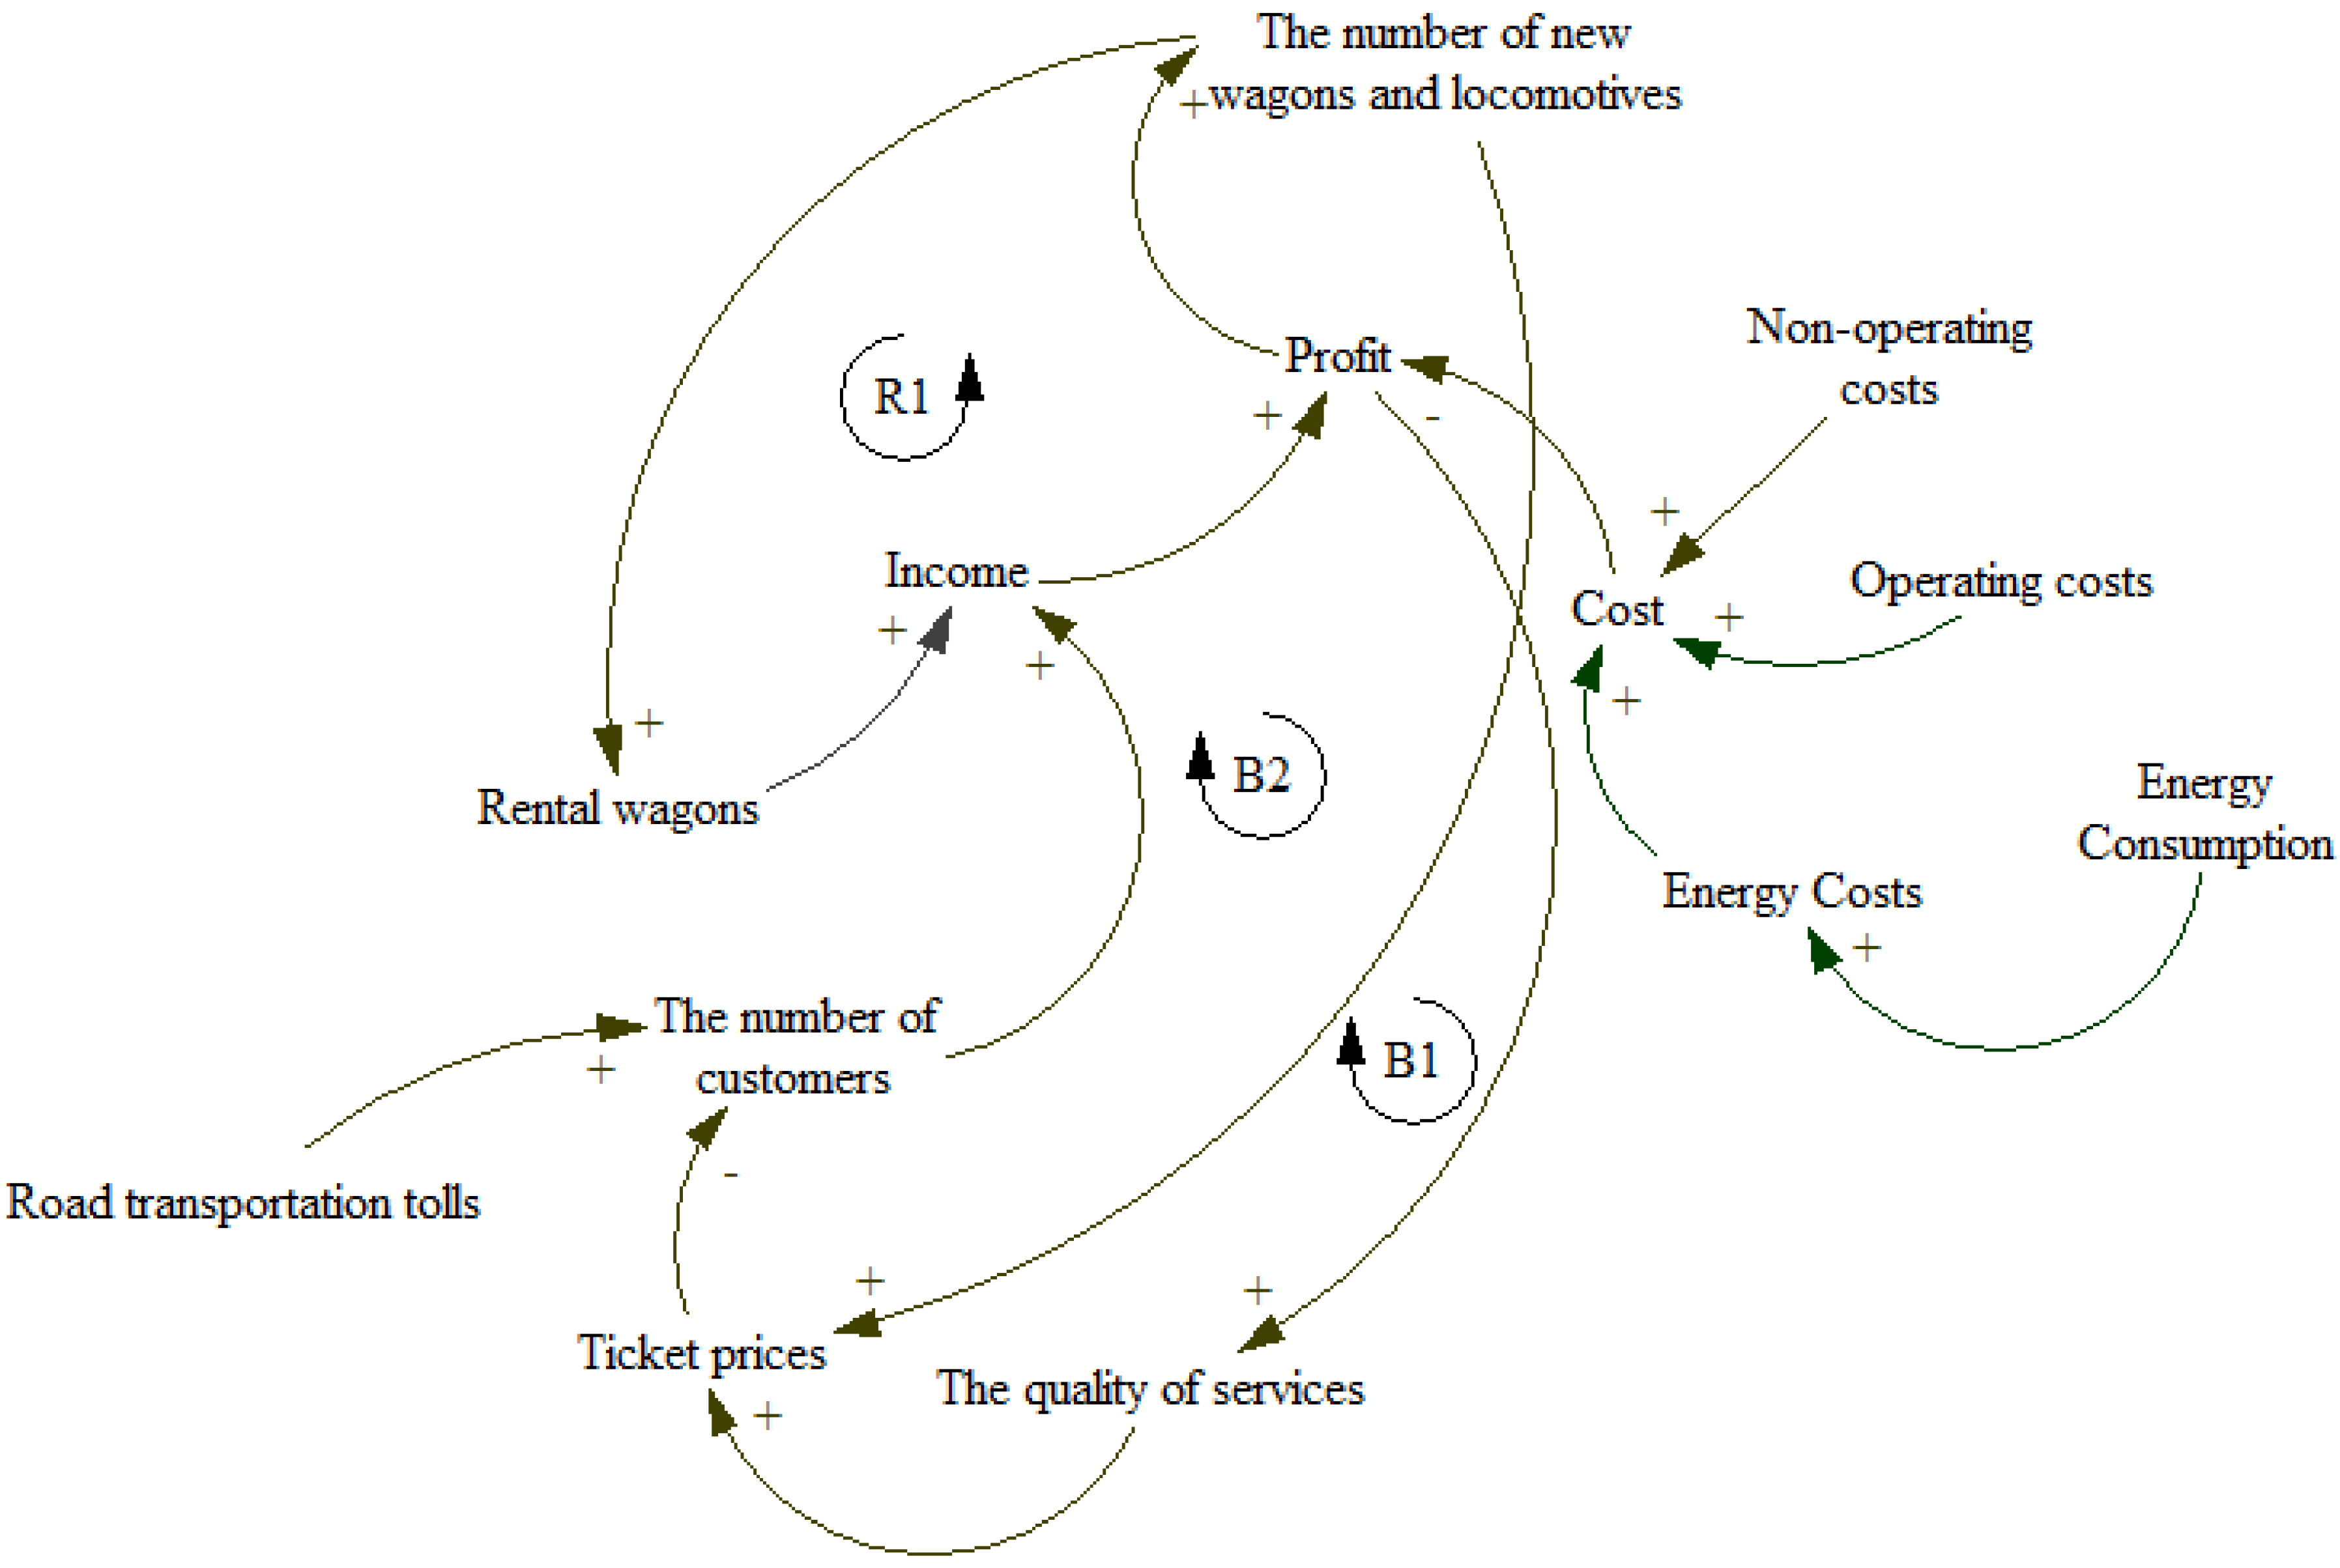
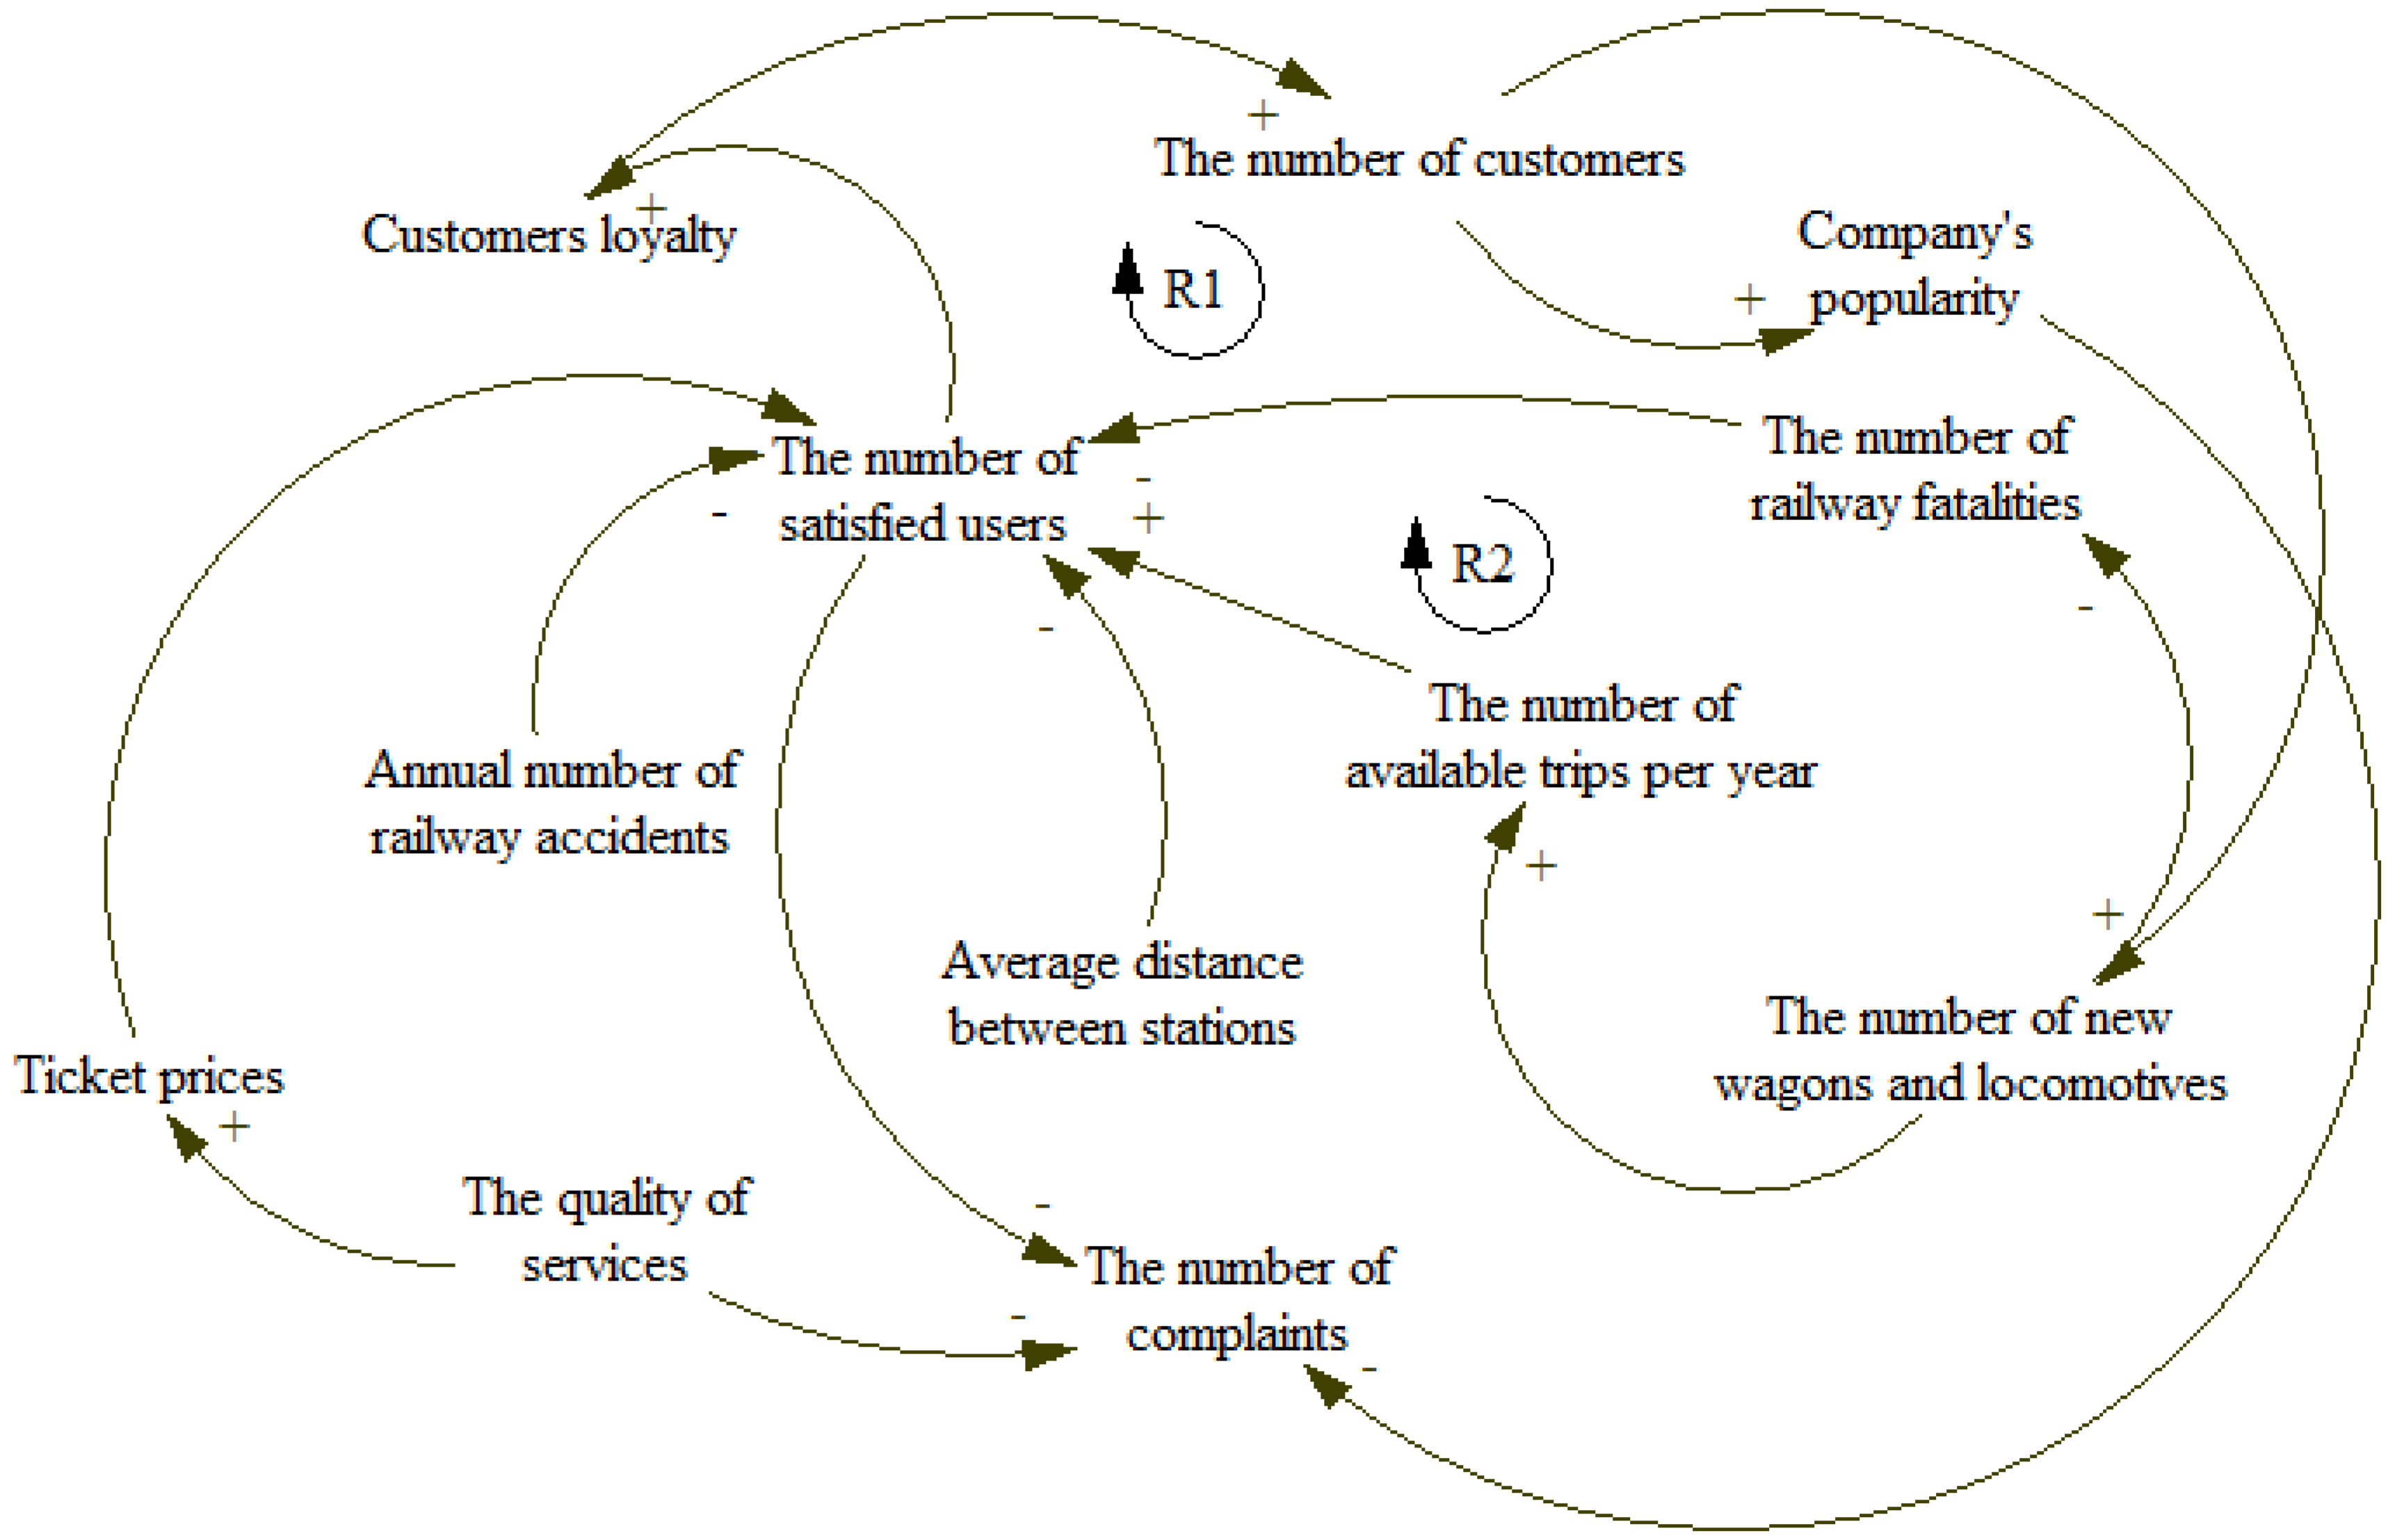
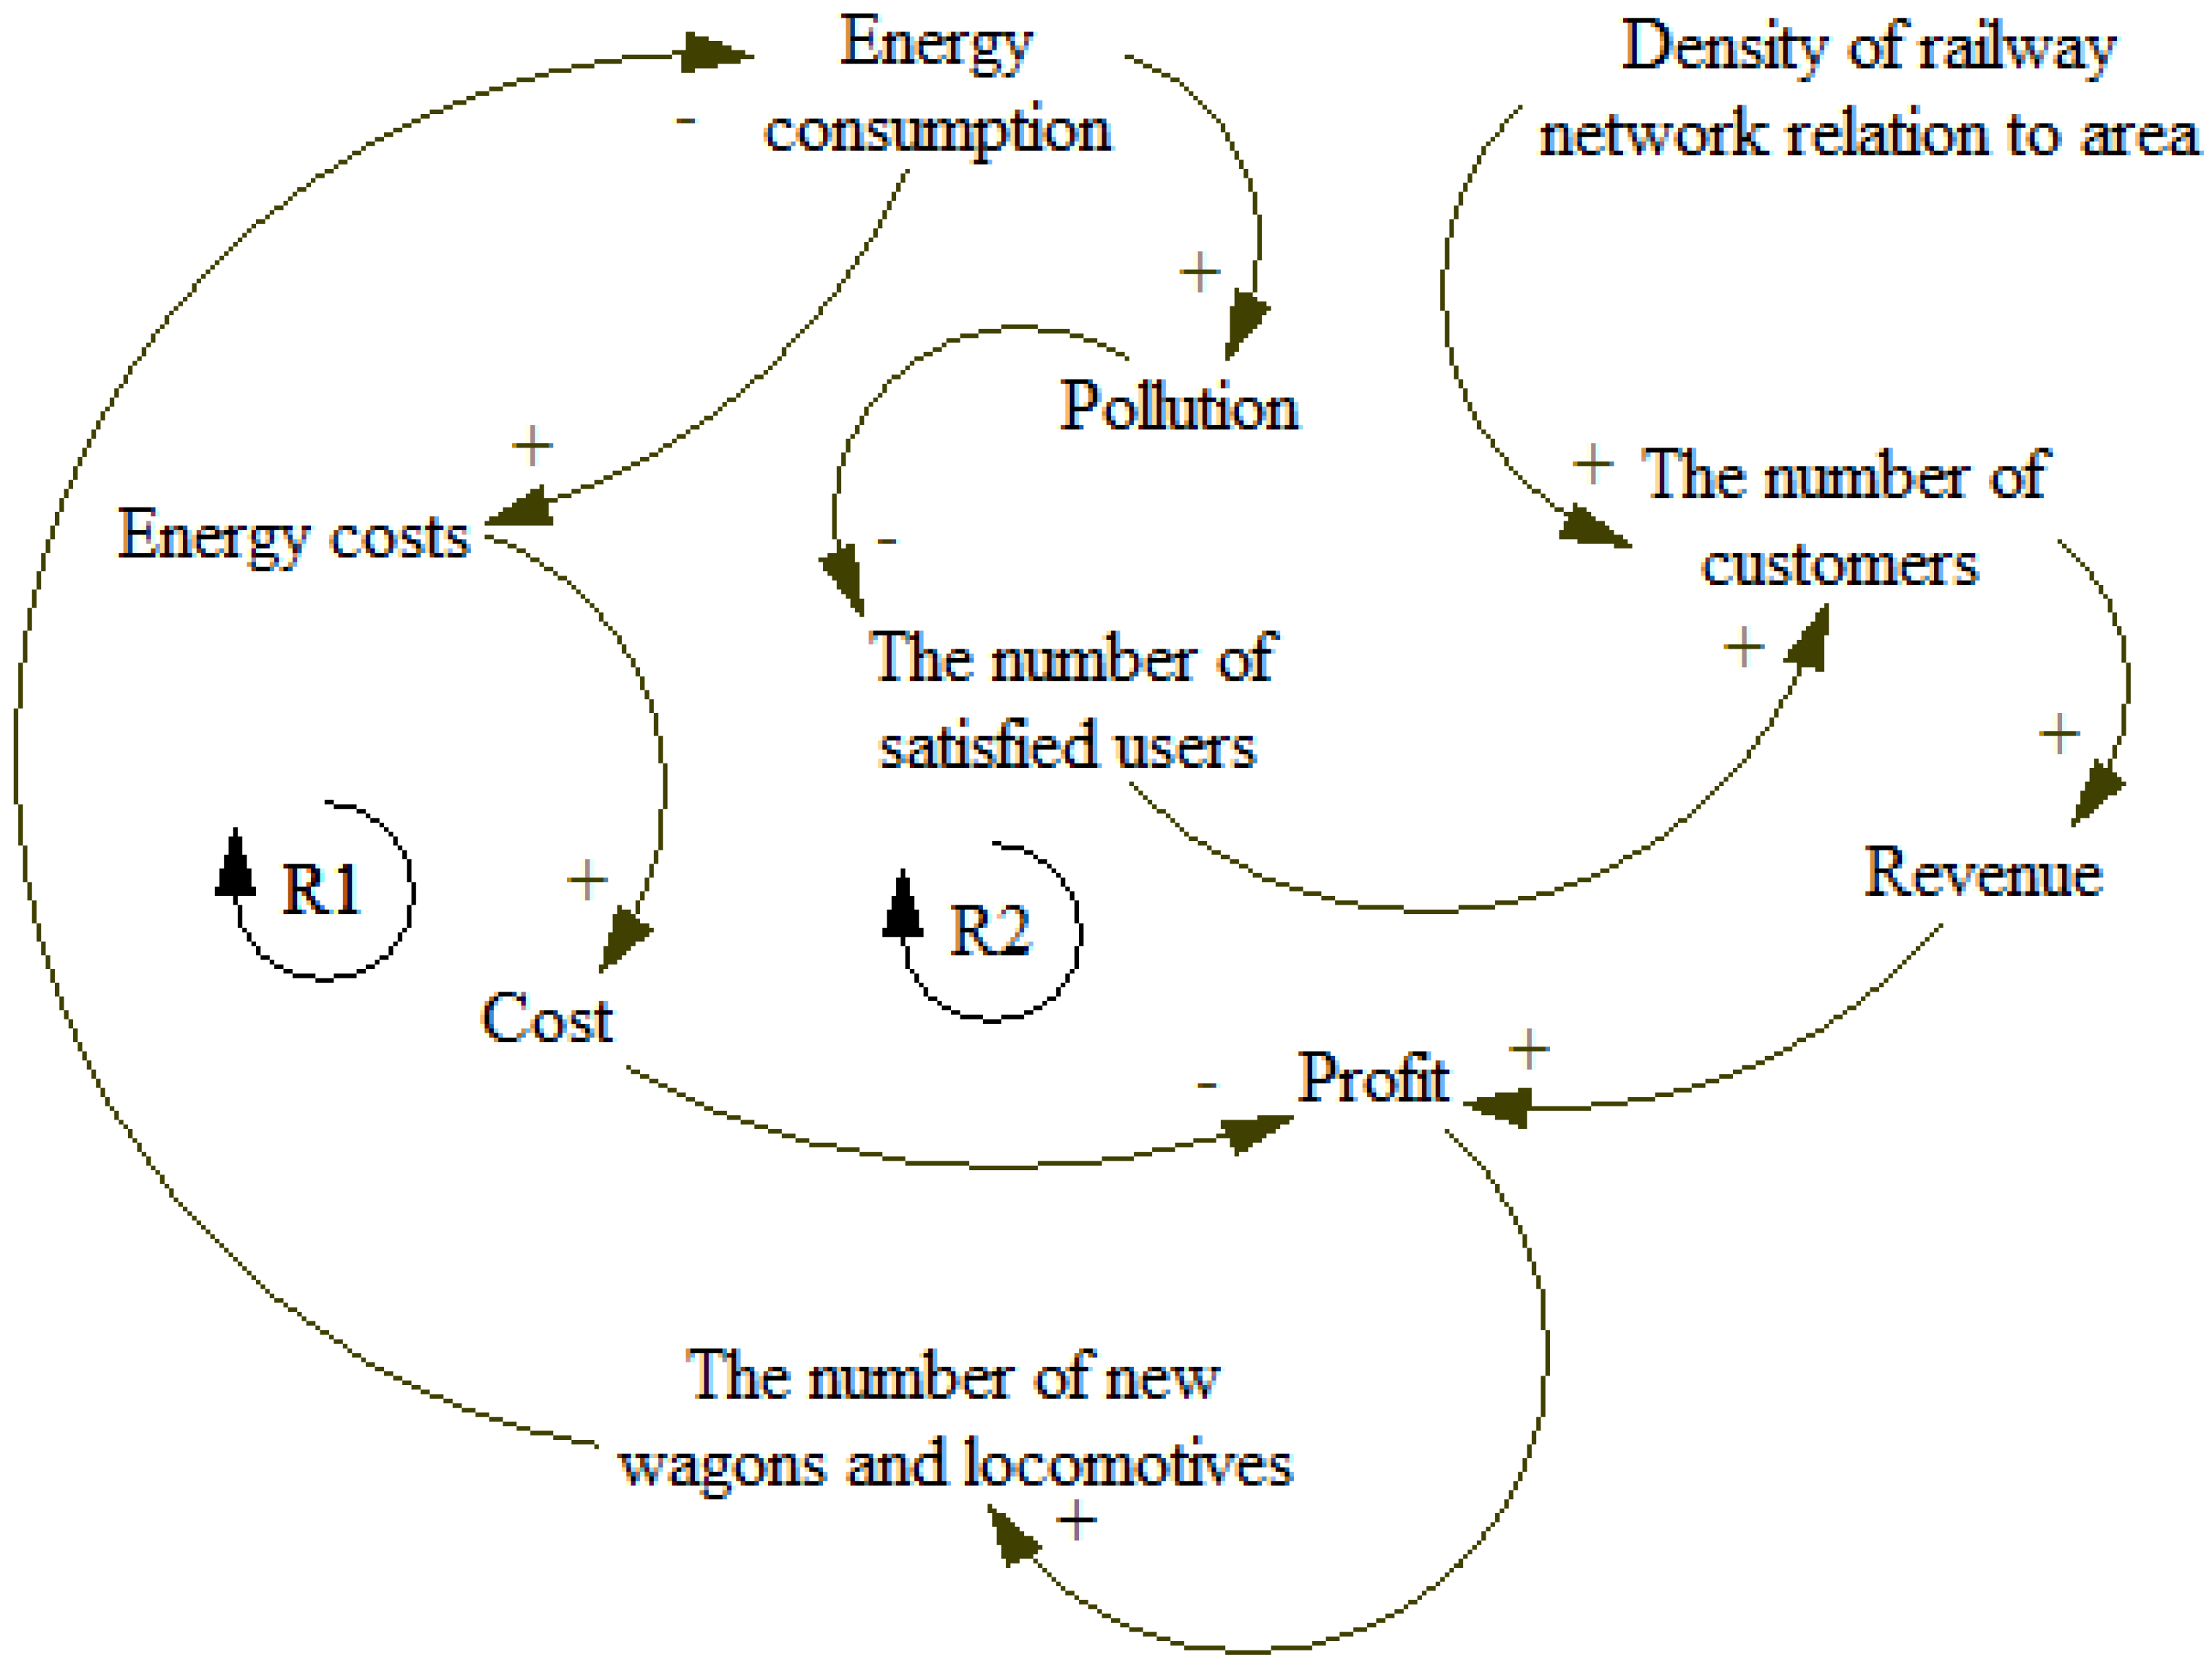
 ). Whenever the railway company decides to purchase new wagons, the wagon rental income shifts in the same direction as the indicator of new wagon purchase. In reality, as the number of new wagons bought rises, so does the number of renting wagons. Furthermore, when the wagon rental income changes, the income of the entire company changes in the same direction as the income from wagon rental, forming a positive arrow between these two indicators. As a final indicator in this loop, the profit of the company changes in the same direction as the income. In general, if income goes up, profit should rise too. As a consequence, the reinforcing loop is completed when the last indicator, i.e., profit, is adjusted and all arrows between indicators become positive.). This means that ticket prices should be determined by considering the types of wagons purchased. The number of consumers falls as ticket prices rise, which is why the number of customers changes in the opposite direction (
  ) of the ticket prices indicator. Additionally, if the number of consumers decreases, the income should drop as well, therefore the income indicator changes in lockstep with the number of customers. Consequently, as income fluctuates, the last indicator, profit, goes up and down in the same direction. As a result of one opposing direction, balancing loop B1 is generated.). B2 is similar to B1 in that the number of consumers falls as ticket prices rise, causing the number of customers to fluctuate in the other manner ( ). As a result, two indicators, income and profit, vary in the same way as the number of customers changes. ), meaning that as the number of new wagons and locomotives grows, the number of railway deaths drops. Following a shift in the number of railway deaths, the number of satisfied users follows suit ( ). When the number of satisfied users changes, two indicators, i.e., customer loyalty and the number of customers, being the last indicators in the loop, shift in the same direction ( ) as the number of satisfied users.), also leading to a higher level of satisfaction among passengers. Once the number of satisfied users has changed, customer loyalty and the number of customers, being the last indications, move in the same direction ( ), as mentioned in R1.), implying that costs have risen in lockstep with changes in the energy consumption indicator. Profits are influenced in the opposite manner ( ) following cost changes. As a result of decreasing profitability, the number of new wagons and locomotives purchased decreases ( ). The last indicator, the change in the number of new wagons and locomotives, causes energy consumption to shift in the opposite direction. As a consequence, the R1 causal loop (reinforcing loop) is formed. ), causing the number of satisfied customers to decrease ( ). Following a change in the number of satisfied users, the total number of customers changes in the same direction as the indicator of satisfied users ( ). Altering revenue and profit indicators is the same as changing the number of customers, therefore if the number of customers falls, revenue and profit fall as well. The number of new wagons and locomotives changes in lockstep with the profit indicator, while the effect of new wagons and locomotives on the energy consumption indication is the inverse ( ).
 3.4. Passenger Railway Transport Flow Chart
3.5. Ranking of Scenarios—Steps of Fuzzy-TOPSIS
4. Case Study
5. Scenarios for the Simulated Model
6. Results and Discussion
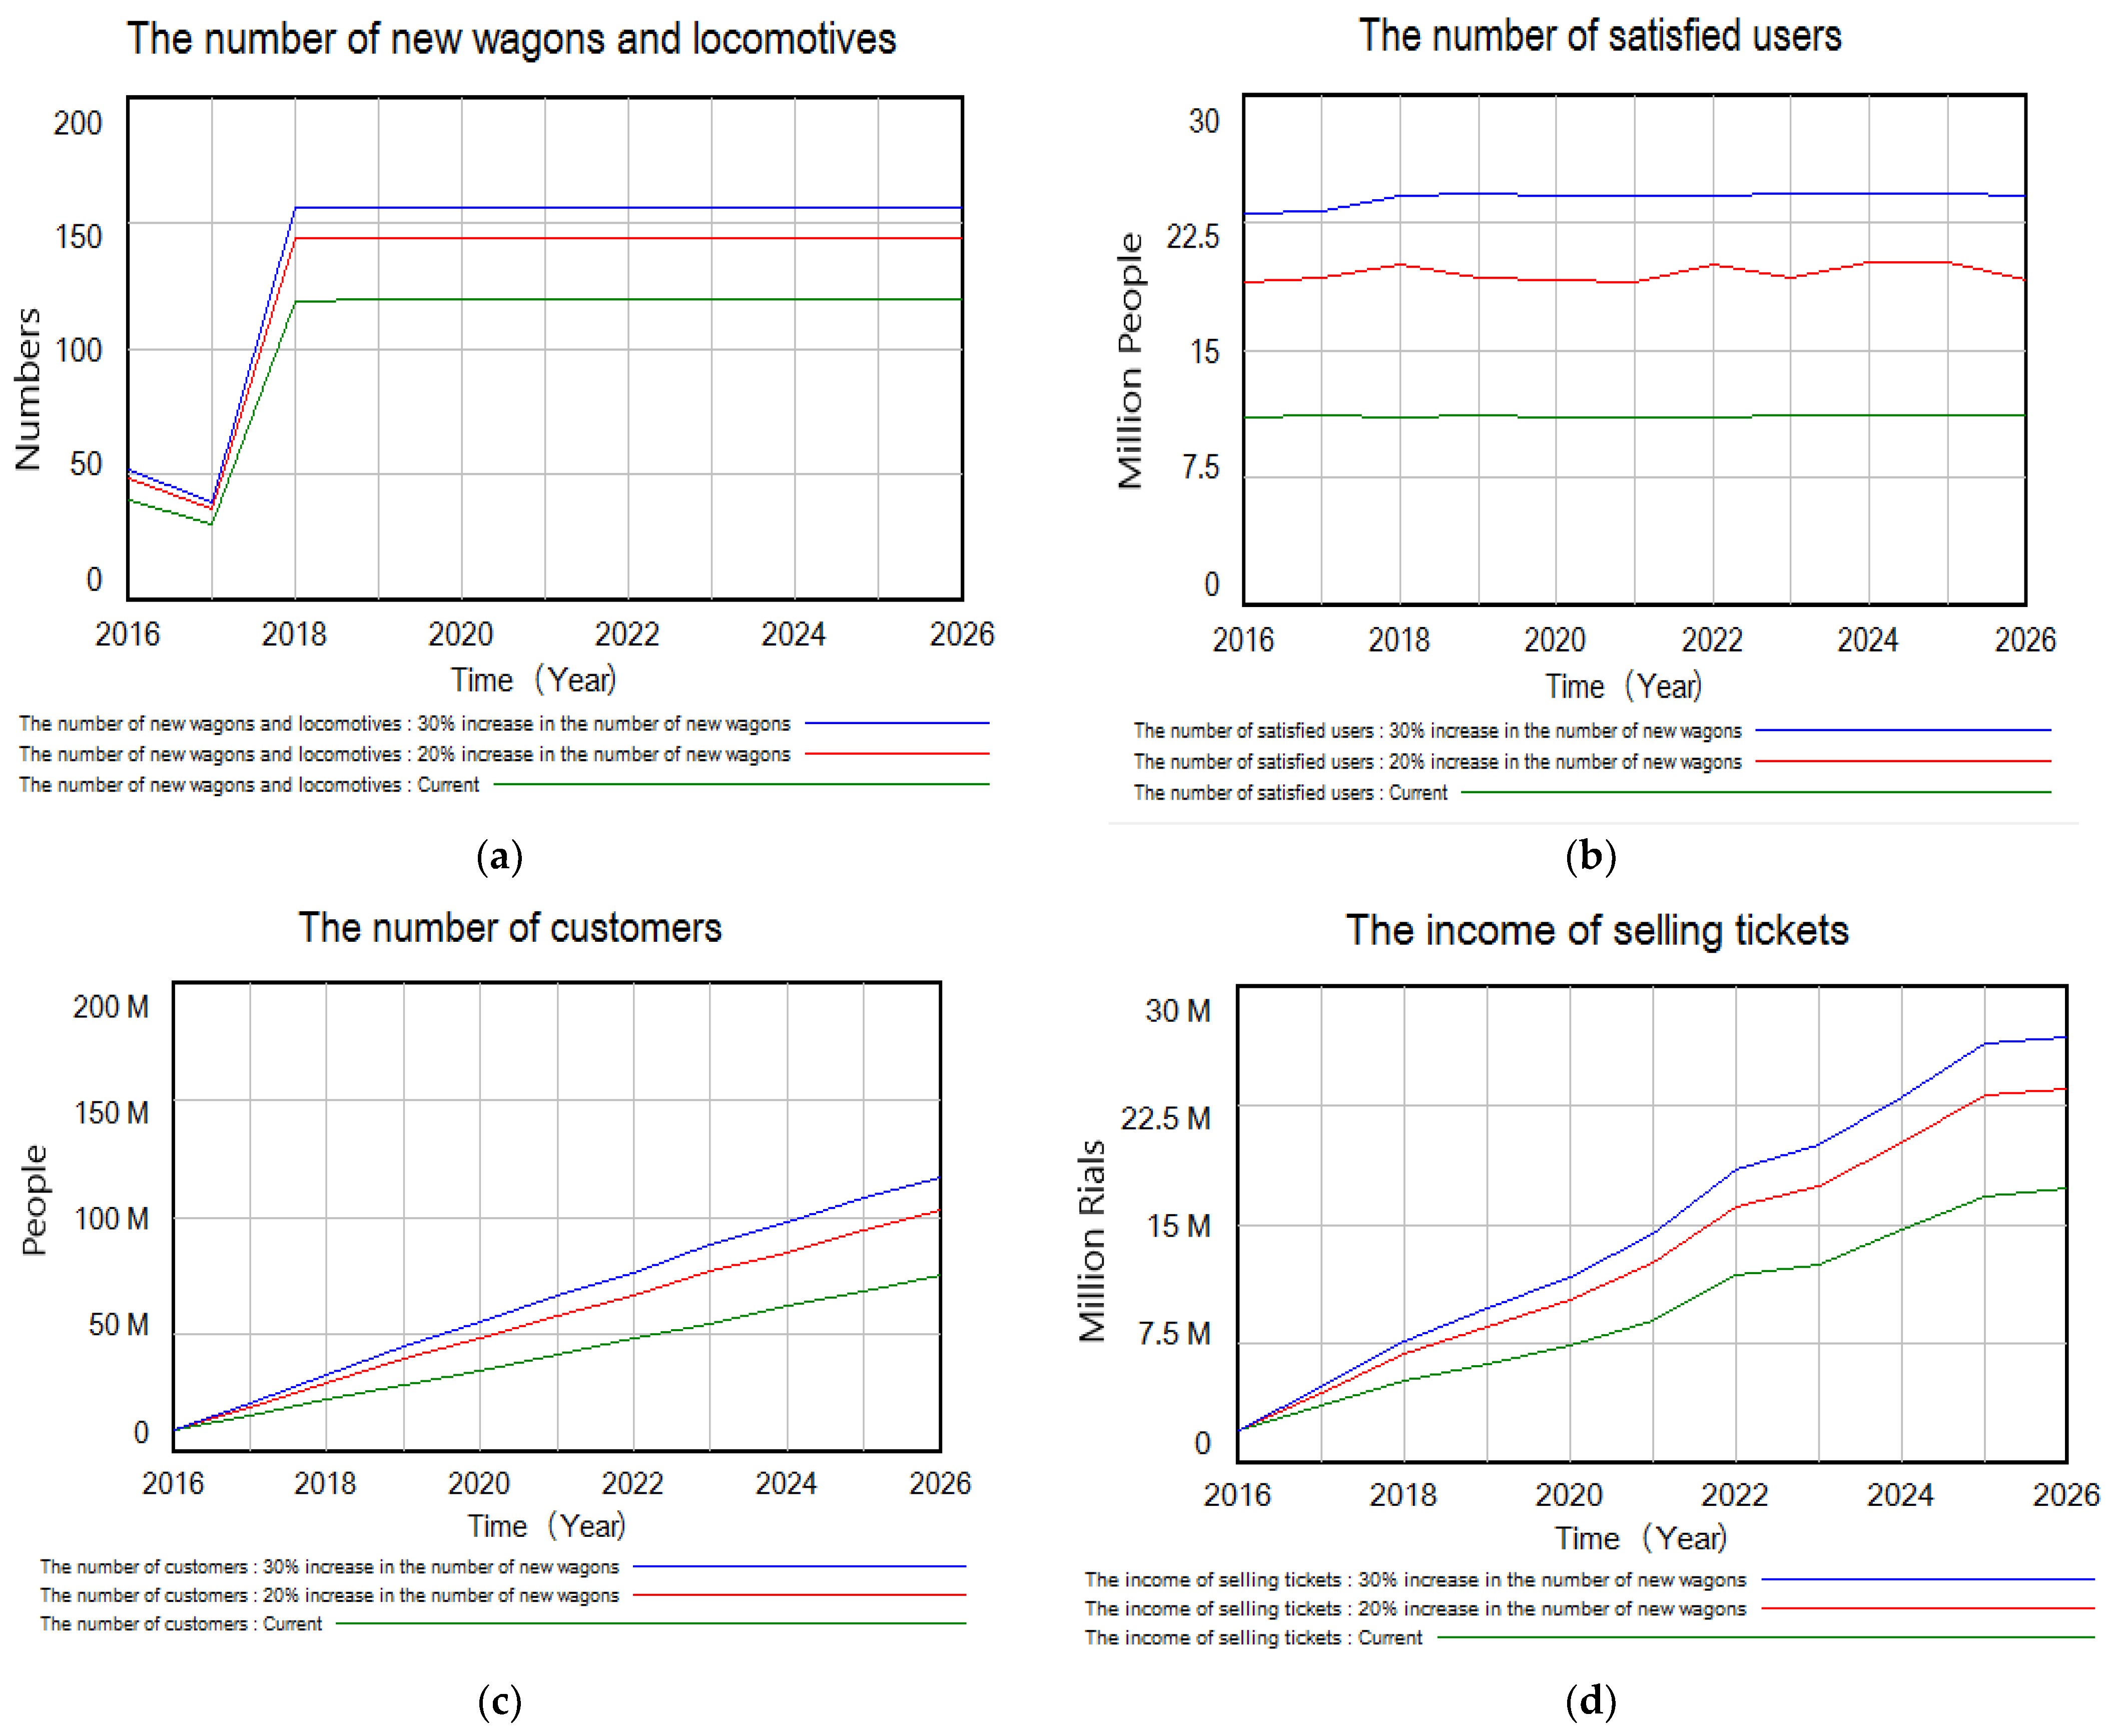
6.1. The First Scenario
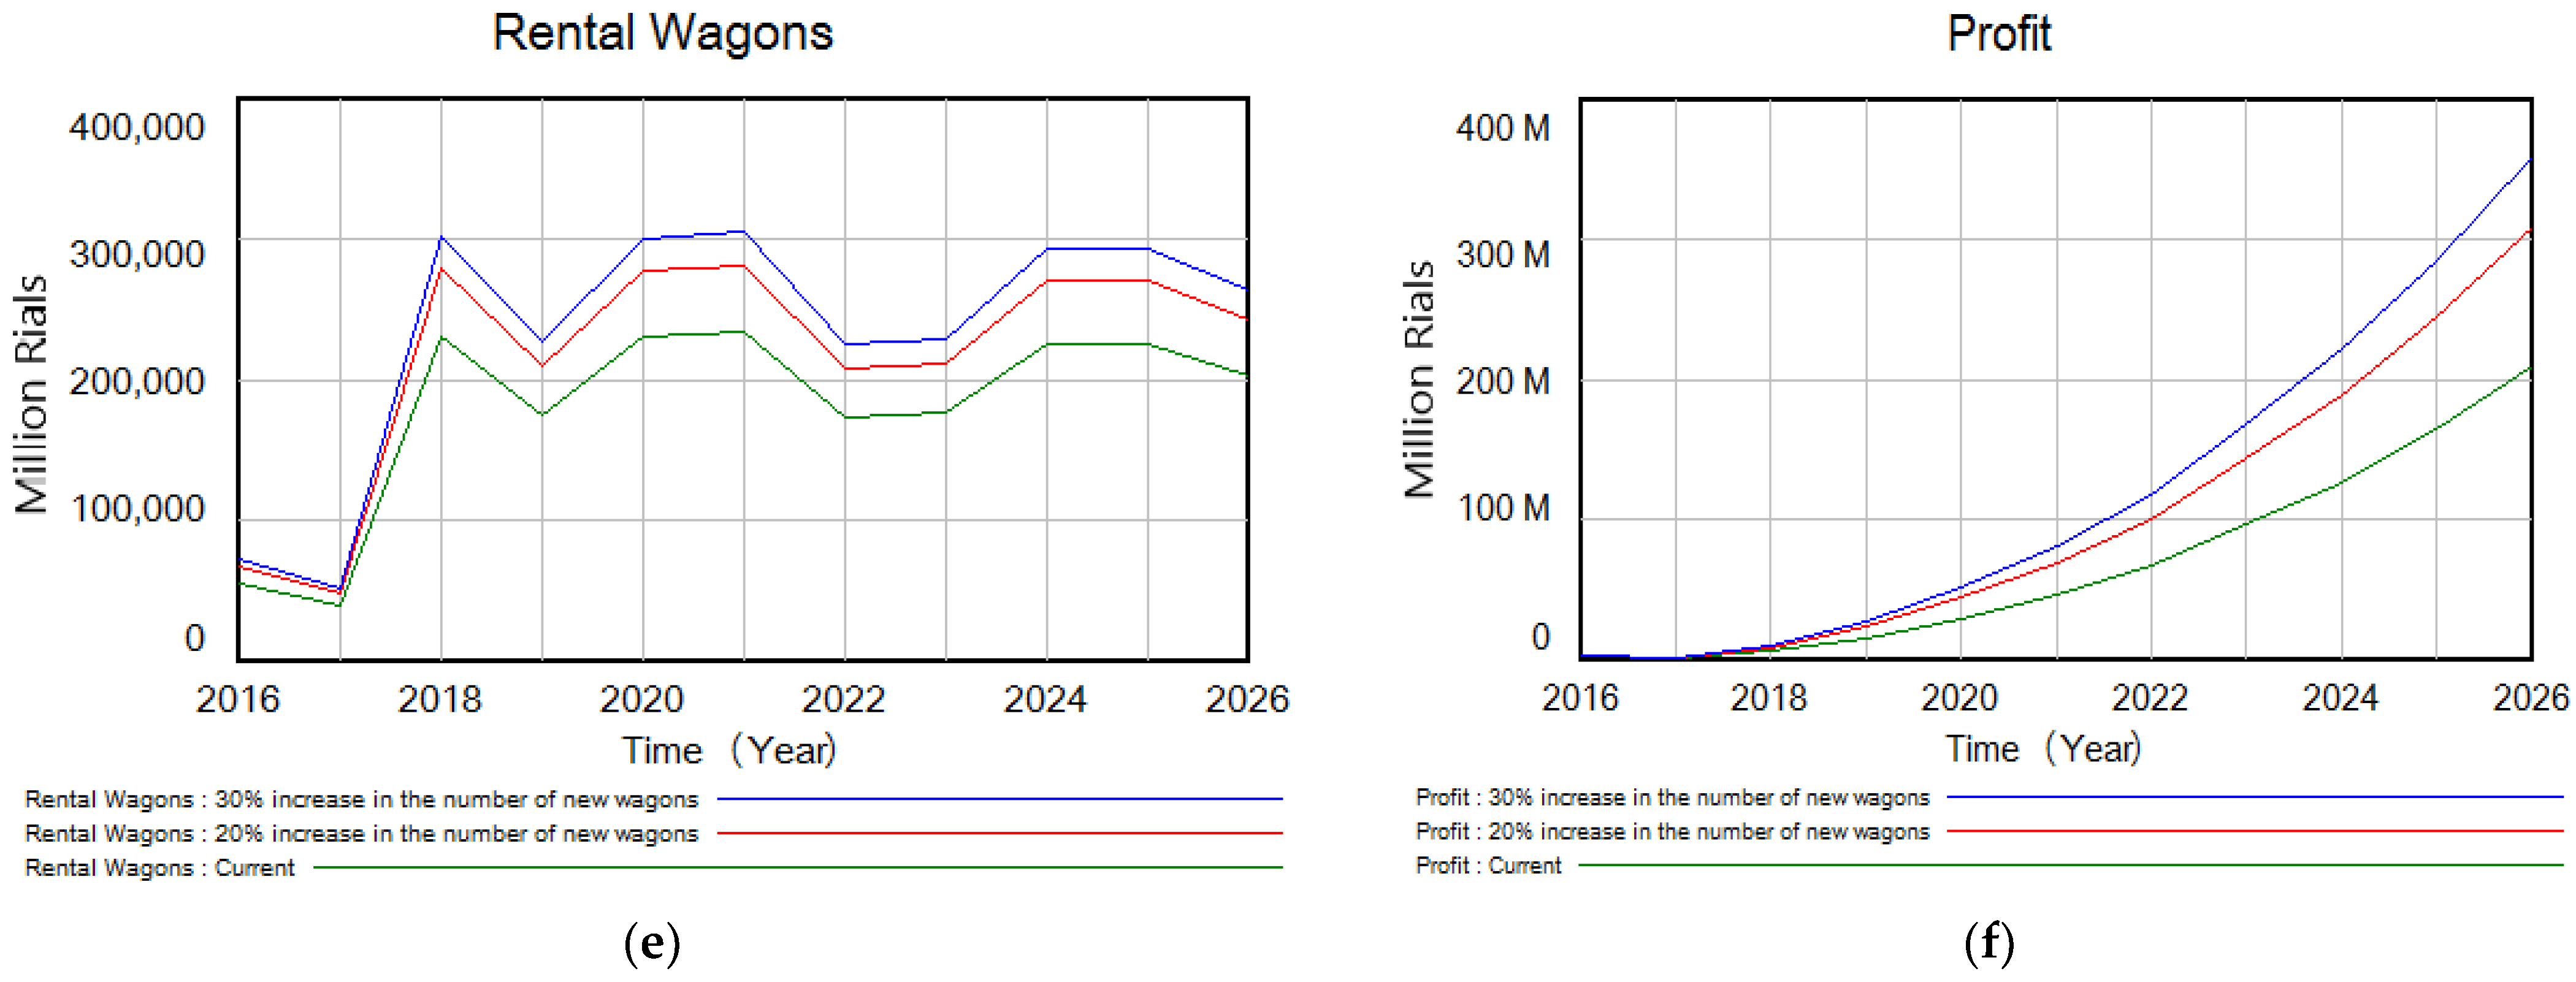
6.2. The Second Scenario
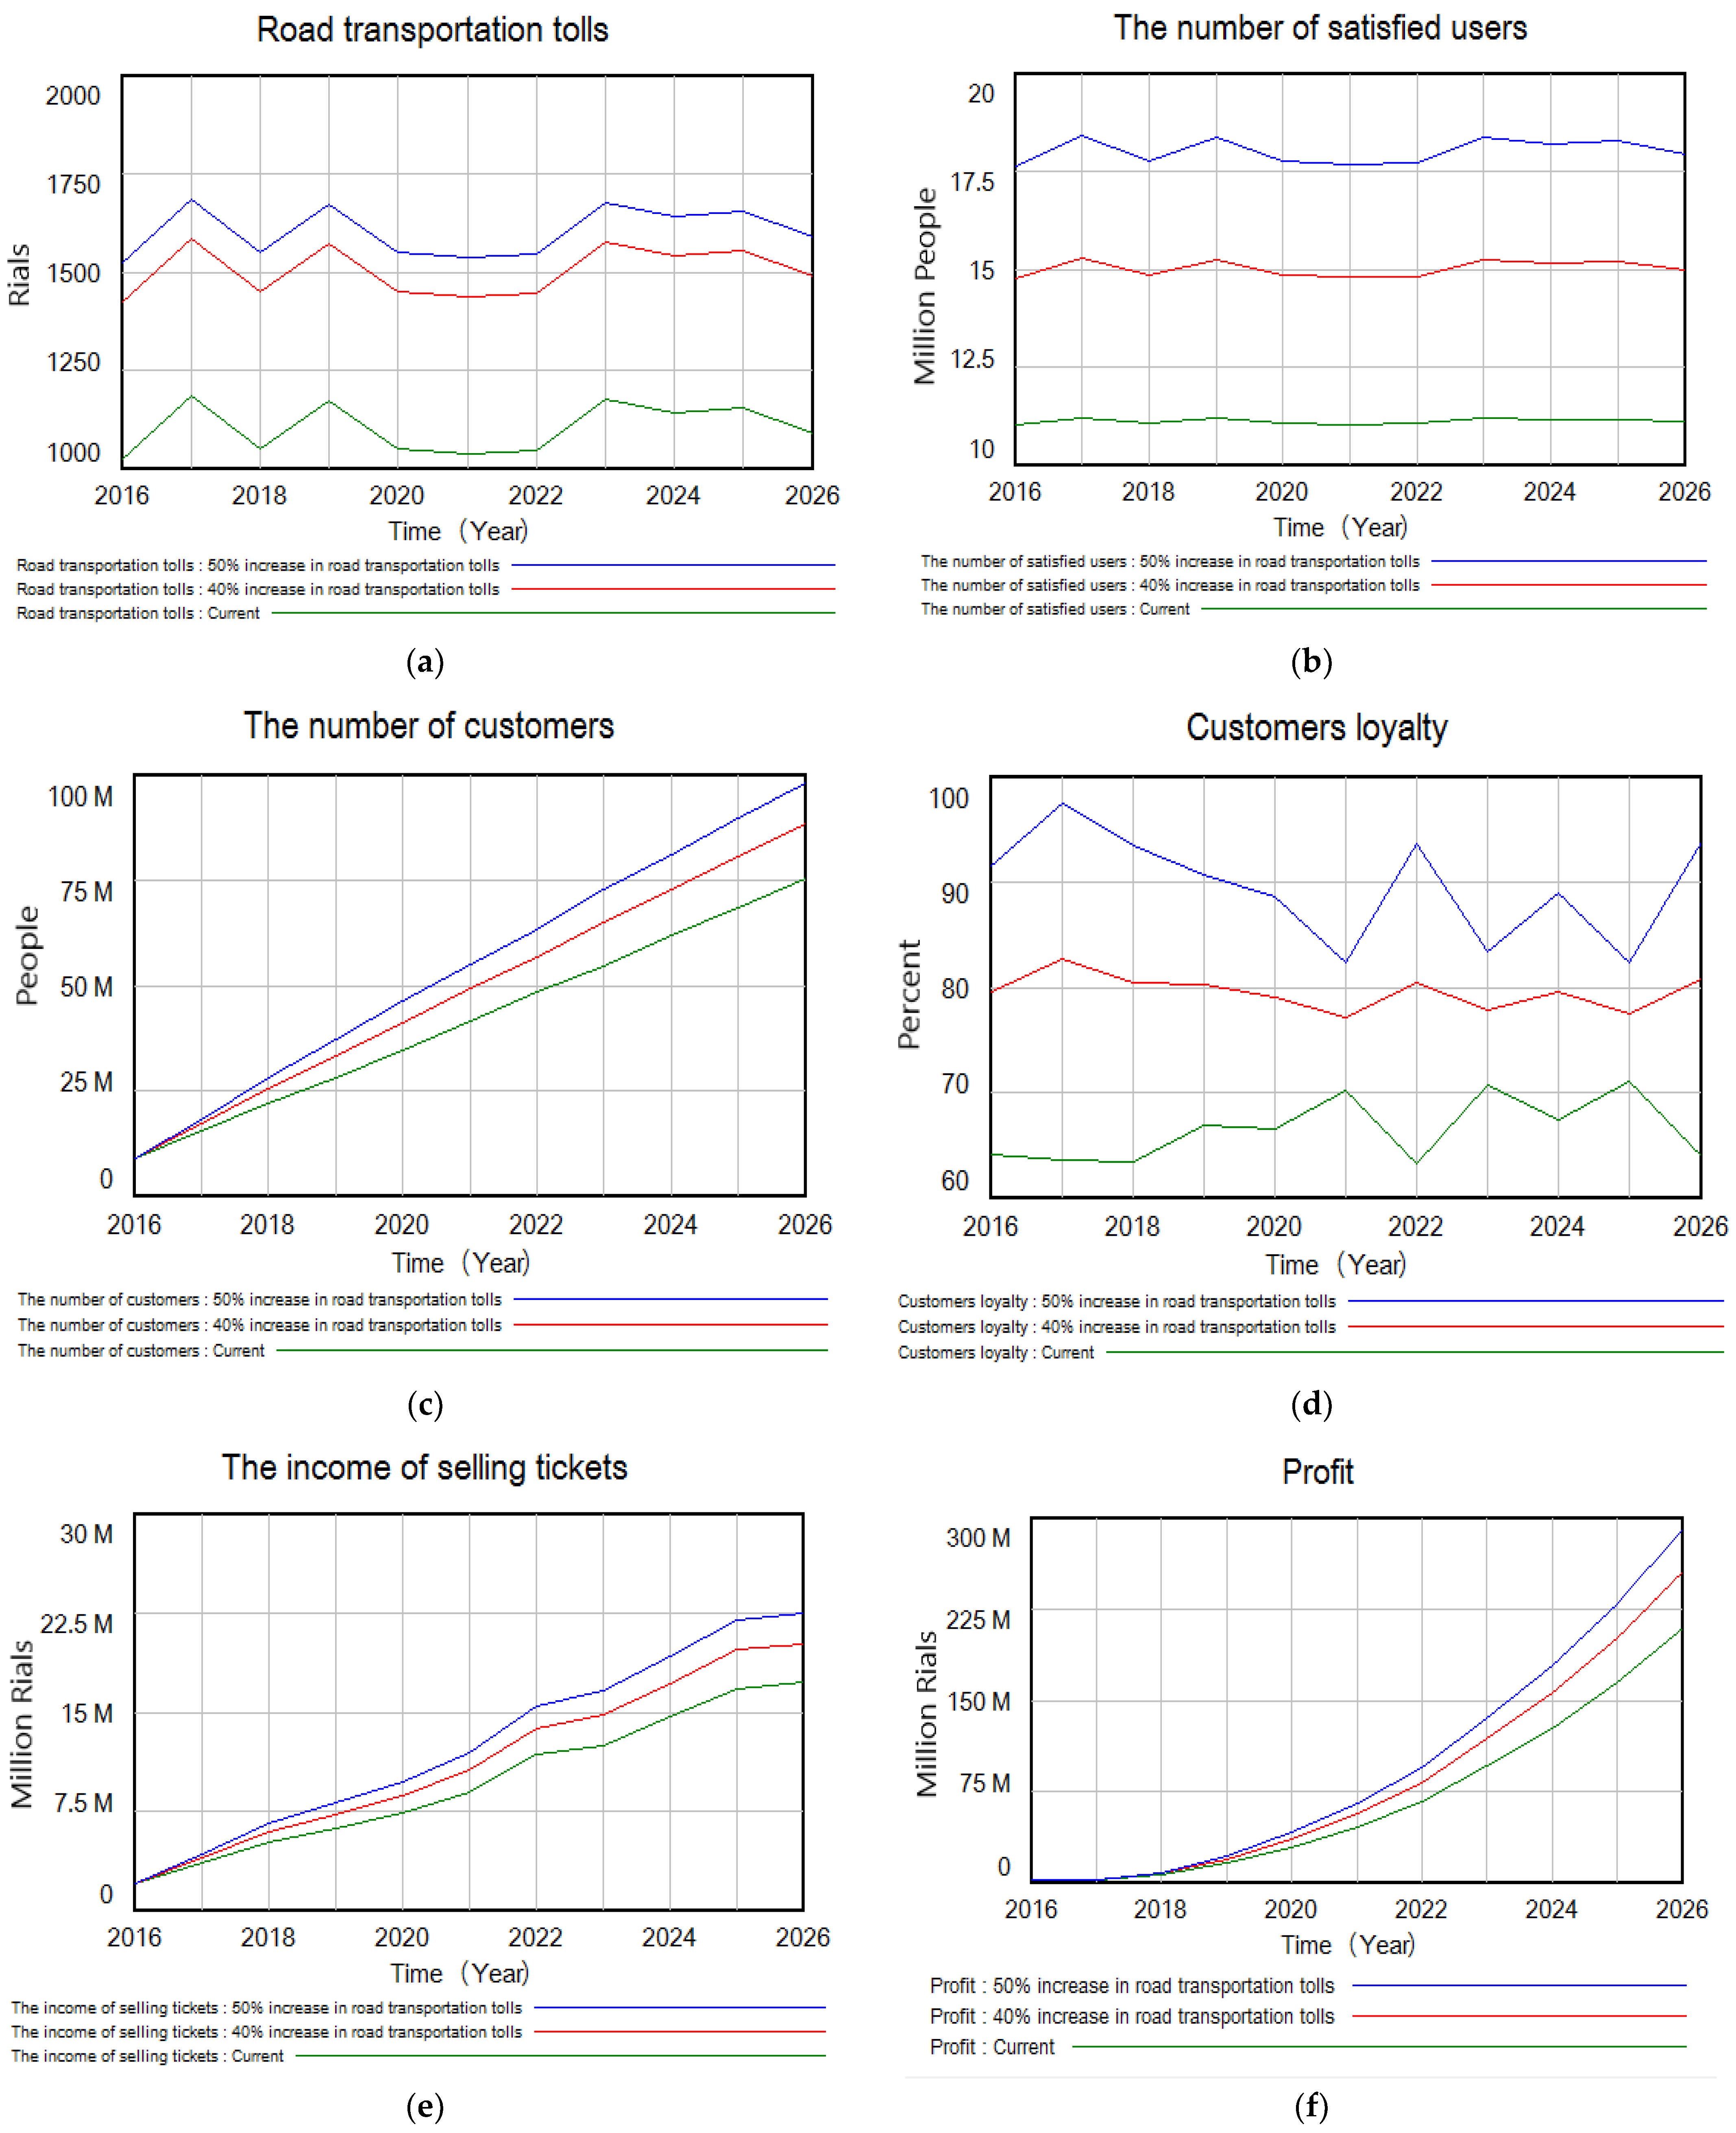
6.3. The Third Scenario
6.4. Summing up Discussion
7. Conclusions and Further Research Directions
- Proposing new indicators for establishing the sustainability of passenger rail transportation management;
- Considering three dimensions of sustainability in passenger rail transport at the same time, despite the fact that the literature on the subject is scarce;
- Applying innovative feedback loops and System Dynamics in passenger rail transportation management;
- Taking road tolls into account as an important and unique indicator in establishing the sustainability of passenger rail transport;
- Applying the Fuzzy-TOPSIS approach to select the optimal scenarios and policies.
Author Contributions
Funding
Institutional Review Board Statement
Informed Consent Statement
Data Availability Statement
Conflicts of Interest
References
- Weinberger, K.; Rankine, H.; Amanuma, N.; Surendra, L.; van Hull, H.V. Integrating the Three Dimensions of Sustainable Development A Framework and Tools; Greening of Economic Growth Series; United Nations: Rome, Italy, 2015. [Google Scholar]
- Rodrigue, J.-P. The Geography of Transport Systems, 5th ed.; Routledge: Abingdon, UK; New York, NY, USA, 2020; ISBN 9780429346323. [Google Scholar]
- United Nations. Transport for Sustainable Development: The Case of Inland Transport; United Nations: New York, NY, USA, 2015; ISBN 9789211170962. [Google Scholar]
- Mobility and Transport—European Commission. Transport in the European Union: Current Trends and Issues; European Commission: Brussels, Belgium, 2019. [Google Scholar]
- Zhao, X.; Ke, Y.; Zuo, J.; Xiong, W.; Wu, P. Evaluation of sustainable transport research in 2000–2019. J. Clean. Prod. 2020, 256, 120404. [Google Scholar] [CrossRef]
- European Commission. A European Green Deal; European Commission: Brussels, Belgium, 2019. [Google Scholar]
- European Commission. Decision of the European Parliament and of the Council on a European Year of Rail; European Commission: Brussels, Belgium, 2020. [Google Scholar]
- International Union of Railways. Sustainable Development: Making Railway Greener, Quieter and More Energy Efficient; International Union of Railways: Paris, France, 2018. [Google Scholar]
- Community of European Railway and Infrastructure Companies. The Voice of European Railways-Activity Report 2019; Community of European Railway and Infrastructure Companies: Brussels, Belgium, 2019. [Google Scholar]
- Braccini, A.; Margherita, E. Exploring Organizational Sustainability of Industry 4.0 under the Triple Bottom Line: The Case of a Manufacturing Company. Sustainability 2019, 11, 36. [Google Scholar] [CrossRef] [Green Version]
- Erjaee, A.; Hendiani, S.; Moradi, S.; Bagherpour, M. Healthcare Sustainability Evaluation Using a Hybrid Fuzzy Multi-Criteria Decision-Making Model. Int. J. Fuzzy Syst. 2022, 24, 1182–1202. [Google Scholar] [CrossRef]
- Barrat, A.; Barthélemy, M.; Vespignani, A. The Architecture of Complex Weighted Networks: Measurements and Models. In Large Scale Structure and Dynamics of Complex Networks; Caldarelli, G., Vespignani, A., Eds.; World Scientific: Singapore, 2007; pp. 67–92. ISBN 978-981-270-664-5. [Google Scholar]
- Wang, W.; Cai, K.; Du, W.; Wu, X.; Tong, L.; Zhu, X.; Cao, X. Analysis of the Chinese railway system as a complex network. Chaos Solitons Fractals 2020, 130, 109408. [Google Scholar] [CrossRef]
- Zairi, M. Measuring Performance for Business Results; Chapman & Hall: London, UK, 1994; ISBN 0-412-57400-4. [Google Scholar]
- Kane, L. Sustainable transport indicators for Cape Town, South Africa: Advocacy, negotiation and partnership in transport planning practice. Nat. Resour. Forum 2010, 34, 289–302. [Google Scholar] [CrossRef]
- Litman, T.; Burwell, D. Issues in sustainable transportation. IJGENVI 2006, 6, 331. [Google Scholar] [CrossRef]
- Nicolas, J.-P.; Pochet, P.; Poimboeuf, H. Towards sustainable mobility indicators: Application to the Lyons conurbation. Transp. Policy 2003, 10, 197–208. [Google Scholar] [CrossRef] [Green Version]
- Litman, T. Developing Indicators for Comprehensive and Sustainable Transport Planning. Transp. Res. Rec. 2007, 2017, 10–15. [Google Scholar] [CrossRef] [Green Version]
- Pregl, M.; Perujo, A.; Dobranskyte-Niskota, A. Indicators to Assess Sustainability of Transport Activities; Publications Office: Luxembourg, 2007; ISBN 978-92-79-07802-6. [Google Scholar]
- Rossi, R.; Gastaldi, M.; Vescovi, R. A methodological approach to evaluating the sustainability level of a transport service. In Sustainable Development and Planning IV; Sustainable Development 2009, Cyprus, 2009-05-13–2009-05-15; Brebbia, C.A., Neophytou, M., Beriatos, E., Ioannou, I., Kungolos, A.G., Eds.; WIT Press: Southampton, UK, 2009; pp. 411–425. [Google Scholar]
- Haghshenas, H.; Vaziri, M. Urban sustainable transportation indicators for global comparison. Ecol. Indic. 2012, 15, 115–121. [Google Scholar] [CrossRef]
- Shiau, T.-A.; Liu, J.-S. Developing an indicator system for local governments to evaluate transport sustainability strategies. Ecol. Indic. 2013, 34, 361–371. [Google Scholar] [CrossRef]
- Alonso, A.; Monzón, A.; Cascajo, R. Comparative analysis of passenger transport sustainability in European cities. Ecol. Indic. 2015, 48, 578–592. [Google Scholar] [CrossRef] [Green Version]
- Stefaniec, A.; Hosseini, K.; Xie, J.; Li, Y. Sustainability assessment of inland transportation in China: A triple bottom line-based network DEA approach. Transp. Res. Part D Transp. Environ. 2020, 80, 102258. [Google Scholar] [CrossRef]
- Janic, M.; Regglani, A.; Nijkamp, P. Sustainability of the European freight transport system: Evaluation of innovative bundling networks. Transp. Plan. Technol. 1999, 23, 129–156. [Google Scholar] [CrossRef] [Green Version]
- Karjalainen, L.; Juhola, S. Framework for Assessing Public Transportation Sustainability in Planning and Policy-Making. Sustainability 2019, 11, 1028. [Google Scholar] [CrossRef] [Green Version]
- Kijewska, K.; Iwan, S.; Małecki, K. Applying Multi-Criteria Analysis of Electrically Powered Vehicles Implementation in Urban Freight Transport. Procedia Comput. Sci. 2019, 159, 1558–1567. [Google Scholar] [CrossRef]
- Bojković, N.; Anić, I.; Pejčić-Tarle, S. One solution for cross-country transport-sustainability evaluation using a modified ELECTRE method. Ecol. Econ. 2010, 69, 1176–1186. [Google Scholar] [CrossRef]
- Buzási, A.; Csete, M. Sustainability Indicators in Assessing Urban Transport Systems. Period. Polytech. Transp. Eng. 2015, 43, 138–145. [Google Scholar] [CrossRef] [Green Version]
- Kłos, M.J.; Sierpiński, G. Building a Model of Integration of Urban Sharing and Public Transport Services. Sustainability 2021, 13, 3086. [Google Scholar] [CrossRef]
- Joumard, R.; Nicolas, J.-P. Transport project assessment methodology within the framework of sustainable development. Ecol. Indic. 2010, 10, 136–142. [Google Scholar] [CrossRef]
- Sierpiński, G.; Staniek, M.; Kłos, M.J. Decision Making Support for Local Authorities Choosing the Method for Siting of In-City EV Charging Stations. Energies 2020, 13, 4682. [Google Scholar] [CrossRef]
- Buenk, R.; Grobbelaar, S.S.; Meyer, I. A Framework for the Sustainability Assessment of (Micro)transit Systems. Sustainability 2019, 11, 5929. [Google Scholar] [CrossRef] [Green Version]
- Wątróbski, J.; Małecki, K.; Kijewska, K.; Iwan, S.; Karczmarczyk, A.; Thompson, R. Multi-Criteria Analysis of Electric Vans for City Logistics. Sustainability 2017, 9, 1453. [Google Scholar] [CrossRef] [Green Version]
- Tian, N.; Tang, S.; Che, A.; Wu, P. Measuring regional transport sustainability using super-efficiency SBM-DEA with weighting preference. J. Clean. Prod. 2020, 242, 118474. [Google Scholar] [CrossRef]
- Marletto, G.; Mameli, F. A participative procedure to select indicators of policies for sustainable urban mobility. Outcomes of a national test. Eur. Transp. Res. Rev. 2012, 4, 79–89. [Google Scholar] [CrossRef] [Green Version]
- Federici, M.; Ulgiati, S.; Verdesca, D.; Basosi, R. Efficiency and sustainability indicators for passenger and commodities transportation systems. Ecol. Indic. 2003, 3, 155–169. [Google Scholar] [CrossRef]
- Chou, J.-S.; Yeh, C.-P. Influential constructs, mediating effects, and moderating effects on operations performance of high speed rail from passenger perspective. Transp. Policy 2013, 30, 207–219. [Google Scholar] [CrossRef]
- Saleem, H.; Jiandong, W.; Zaman, K.; Elsherbini Elashkar, E.; Mohamd Shoukry, A. The impact of air-railways transportation, energy demand, bilateral aid flows, and population density on environmental degradation: Evidence from a panel of next-11 countries. Transp. Res. Part D Transp. Environ. 2018, 62, 152–168. [Google Scholar] [CrossRef]
- Sdoukopoulos, A.; Nikolaidou, A.; Pitsiava-Latinopoulou, M.; Papaioannou, P. Use of social media for assessing sustainable urban mobility indicators. Int. J. SDP 2018, 13, 338–348. [Google Scholar] [CrossRef]
- Lane, D.C.; Oliva, R. The greater whole: Towards a synthesis of system dynamics and soft systems methodology. Eur. J. Oper. Res. 1998, 107, 214–235. [Google Scholar] [CrossRef]
- Kuzior, A.; Staszek, M. Energy Management in the Railway Industry: A Case Study of Rail Freight Carrier in Poland. Energies 2021, 14, 6875. [Google Scholar] [CrossRef]
- Liao, Y.-W.; Wang, Y.-M.; Wang, Y.-S.; Tu, Y.-M. Understanding the dynamics between organizational IT investment strategy and market performance: A system dynamics approach. Comput. Ind. 2015, 71, 46–57. [Google Scholar] [CrossRef]
- Coyle, R.G. System Dynamics Modelling: A Practical Approach. J. Oper. Res. Soc. 1997, 48, 544. [Google Scholar] [CrossRef]
- Misa, T.J. Industrial Dynamics. Digit. State 2015, 48, 189–216. [Google Scholar]
- Arquitt, S.; Johnstone, R. Use of system dynamics modelling in design of an environmental restoration banking institution. Ecol. Econ. 2008, 65, 63–75. [Google Scholar] [CrossRef]
- Ozcan-Deniz, G.; Zhu, Y. A system dynamics model for construction method selection with sustainability considerations. J. Clean. Prod. 2016, 121, 33–44. [Google Scholar] [CrossRef] [Green Version]
- Awasthi, A.; Omrani, H. A hybrid approach based on AHP and belief theory for evaluating sustainable transportation solutions. IJGENVI 2009, 9, 212. [Google Scholar] [CrossRef]
- Kore, N.; Ravi, K.; Patil, S. A simplified description of fuzzy TOPSIS method for multi criteria decision making. Int. Res. J. Eng. Technol. 2017, 4, 2047–2050. [Google Scholar]
- Ziemba, P. Selection of Electric Vehicles for the Needs of Sustainable Transport under Conditions of Uncertainty—A Comparative Study on Fuzzy MCDA Methods. Energies 2021, 14, 7786. [Google Scholar] [CrossRef]
- Broniewicz, E.; Ogrodnik, K. A Comparative Evaluation of Multi-Criteria Analysis Methods for Sustainable Transport. Energies 2021, 14, 5100. [Google Scholar] [CrossRef]
- Wang, Q.; Li, S.; Li, R. Evaluating water resource sustainability in Beijing, China: Combining PSR model and matter-element extension method. J. Clean. Prod. 2019, 206, 171–179. [Google Scholar] [CrossRef]
- Wang, Q.; Zhan, L. Assessing the sustainability of renewable energy: An empirical analysis of selected 18 European countries. Sci. Total Environ. 2019, 692, 529–545. [Google Scholar] [CrossRef]
- Wang, Q.; Yang, X. Investigating the sustainability of renewable energy—An empirical analysis of European Union countries using a hybrid of projection pursuit fuzzy clustering model and accelerated genetic algorithm based on real coding. J. Clean. Prod. 2020, 268, 121940. [Google Scholar] [CrossRef]
- Janic, M. Sustainable Transport in the European Union: A Review of the Past Research and Future Ideas. Transp. Rev. 2006, 26, 81–104. [Google Scholar] [CrossRef]
- Azzouz, L.; Jack, A. Benchmarking the sustainability reporting of high-speed railways (HSRs): Towards a state-of-the-art benchmarking and reporting framework for HSRs. J. Clean. Prod. 2020, 250, 119505. [Google Scholar] [CrossRef]
- Fraszczyk, A.; Lamb, T.; Marinov, M. Are railways really that bad? An evaluation of rail systems performance in Europe with a focus on passenger rail. Transp. Res. Part A Policy Pract. 2016, 94, 573–591. [Google Scholar] [CrossRef]
- International Union of Railways. UIC Reporting Guideline Sustainable Mobility & Transport: Reporting Principles and Indicators for Rail; International Union of Railways: Paris, France, 2012. [Google Scholar]
- Ćwil, M.; Bartnik, W.; Jarzębowski, S. Railway Vehicle Energy Efficiency as a Key Factor in Creating Sustainable Transportation Systems. Energies 2021, 14, 5211. [Google Scholar] [CrossRef]
- Hansen, I.A.; Wiggenraad, P.; Wolff, J. Performance analysis of railway infrastructure and operations. In Proceedings of the 13th World Conference on Transport Research, Rio de Janeiro, Brazil, 15–18 July 2013. [Google Scholar]
- Jabłoński, A.; Jabłoński, M. Social Perspectives in Digital Business Models of Railway Enterprises. Energies 2020, 13, 6445. [Google Scholar] [CrossRef]
- Stopka, O.; Stopkova, M.; Rybicka, I.; Gross, P.; Jeřábek, K. Use of activity-based costing approach for cost management in a railway transport enterprise. Sci. J. Sil. Univ. Technol. Ser. Transp. 2021, 111, 151–160. [Google Scholar] [CrossRef]
- Tian, Z.; Zhang, G.; Zhao, N.; Hillmansen, S.; Tricoli, P.; Roberts, C. Energy Evaluation for DC Railway Systems with Inverting Substations. In Proceedings of the 2018 IEEE International Conference on Electrical Systems for Aircraft, Railway, Ship Propulsion and Road Vehicles & International Transportation Electrification Conference (ESARS-ITEC), Nottingham, UK, 7–9 November 2018; pp. 1–6, ISBN 978-1-5386-4192-7. [Google Scholar]
- Yi, C.; Zhang, Q. Evaluation Model of Sustainable Development for Railway Transportation Based on BP Neural Network. In Proceedings of the 2013 6th International Symposium on Computational Intelligence and Design (ISCID), Hangzhou, China, 28–29 October 2013; pp. 76–79. [Google Scholar]
- Przybyłowski, A. Sustainable transport development indicators. Sci. J. Sil. Univ. Technol. Ser. Transp. 2013, 80, 79–87. [Google Scholar]
- Rotoli, F.; Navajas Cawood, E.; Christidis, P. A Data Envelopment Analysis approach for accessibility measures: Simulating operational enhancement scenarios for railway across Europe. Eur. Transp. Res. Rev. 2015, 7, 18. [Google Scholar] [CrossRef] [Green Version]
- Sterman, J. Simulation Software and Models Including Ithink, Powersim, and Vensim Software: To Accompany Business Dynamics: Systems Thinking and Modeling for a Complex World, Compact disc ed.; McGraw-Hill: Boston, MA, USA; New York, NY, USA, 2000; ISBN 9780072389159. [Google Scholar]
- Struben, J.; Sterman, J.D. Transition Challenges for Alternative Fuel Vehicle and Transportation Systems. Environ. Plann. B Plann. Des. 2008, 35, 1070–1097. [Google Scholar] [CrossRef]
- Chen, C.-T. A fuzzy approach to select the location of the distribution center. Fuzzy Sets Syst. 2001, 118, 65–73. [Google Scholar] [CrossRef]
- Raja Rail Transportation Co. Available online: https://www.raja.ir/menupages?id=RajafaCal (accessed on 4 October 2021).
- Wang, Q.; Su, M. A preliminary assessment of the impact of COVID-19 on environment—A case study of China. Sci. Total Environ. 2020, 728, 138915. [Google Scholar] [CrossRef] [PubMed]
- Kiang, Y.-H. Fuel Property Estimation and Combustion Process Characterization: Conventional Fuels, Biomass, Biocarbon, Waste Fuels, Refuse Derived Fuel, and Other Alternative Fuels; Academic Press: London, UK; San Diego, CA, USA, 2018; ISBN 9780128134733. [Google Scholar]

| Method | Advantages | Disadvantages |
|---|---|---|
| System Dynamics | It can be used to solve issues that are deemed to be data deficient. The database used to conceptualize and formulate the System Dynamics models is substantially larger than the numerical databases used in operations research and statistics modeling. By drawing progressively complex causal loop diagrams, this strategy can help in obtaining insight and comprehension in a confusing scenario. | Although a System Dynamics model may capture a lot of variation in the changing values of its variables, it can only run one version of a situation at a time. Distinct stakeholders or organizations with different cultural or political agendas may bring different assumptions to the table, resulting in a drastically different image. When modeling real-world scenarios with many variables, a system dynamics diagram may get rather complicated. |
| Fuzzy-TOPSIS | It simulates a sensible human’s logical answer, uses a basic computation procedure, rates all possibilities at the same time, and provides alternative performance measurements. | A significant divergence of one indicator from the optimal solution has a significant impact on the outcomes, and the approach is appropriate when the indicators of alternatives do not differ significantly. |
| Financial Dimension | Society Dimension | Environmental Dimension |
|---|---|---|
| Income from renting wagons [56] | Number of satisfied users [30,57] | Energy consumption [58,59] |
| Income from selling tickets [56,60] | Quality of services [57,61] | CO2 emission from railway passenger transport [58] |
| Energy costs [62,63] | Road transport tolls (railway passenger transport experts) | Density of railway network relative to area [58] |
| Operating costs [56,60] | Annual number of railway accidents [57] | - |
| Non-operating costs [62,64] | Number of fatalities [57,65] | - |
| Investment in buying new wagons and locomotives (Raja’s strategy map) | Number of available trips per year [65,66] | - |
| - | Number of complaints (Raja’s strategy map) | - |
| - | Number of customers [57] | - |
| Very Low (VL) | (0, 0, 0.1) |
| Low (L) | (0, 0.1, 0.3) |
| Medium Low (ML) | (0.1, 0.3, 0.5) |
| Medium (M) | (0.3, 0.5, 0.7) |
| Medium High (MH) | (0.5, 0.7, 0.9) |
| High (H) | (0.7, 0.9, 1) |
| Very High (VH) | (0.9, 1, 1) |
| Very Poor (VP) | (0, 0, 1) |
| Poor (P) | (0, 0, 1) |
| Medium Poor (MP) | (1, 3, 5) |
| Fair (F) | (3, 5, 7) |
| Medium Good (MG) | (5, 7, 9) |
| Good (G) | (7, 9, 10) |
| Very Good (VG) | (9, 10, 10) |
| Lower Limit | Variable | Upper Limit |
|---|---|---|
| 30,000 | Energy consumption (thousands of liters) | 35,000 |
| 1000 | Road transport tolls (rials (Iran’s currency)) | 1200 |
| 13,000 | Non-operating costs (million rials) | 60,000 |
| 40 | Annual number of railway accidents (people) | 50 |
| 42 | Quality of services (percent) | 55 |
| 250 | Income from wagon rental (thousands rials) | 400 |
| 60 | Average distance between stations (km) | 70 |
| 0.9 | Density of railway network relative to area (1/km) | 1 |
| Description | Unit | Actual Performance [67] | Predicted Results of the Dynamic Model | Error |(Predicted-Actual)/Actual| |
|---|---|---|---|---|
| Profit (Loss) | Million Rials | 1,795,441 | 2,000,000 | 0.110 |
| Income | Million Rials | 6,027,974 | 6,011,420 | 0.003 |
| Cost | Million Rials | 4,232,533 | 6,499,350 | 0.540 |
| Number of customers | Million People | 10.20 | 9.00 | 0.120 |
| Number of satisfied customers | Million People | 10.80 | 11.23 | 0.040 |
| Customers’ loyalty | Per cent | 68 | 64 | 0.060 |
| Number of railway fatalities | People | 42 | 40 | 0.050 |
| Quality of service | Per cent | 49 | 50 | 0.020 |
| Income from selling tickets | Million Rials | 2,592,540 | 2,010,004 | 0.220 |
| Number of complaints | Number | 870 | 1000 | 0.150 |
| Number of new wagons and locomotives | Number | 38 | 42 | 0.110 |
| Description | Unit | Actual Performance [67] | Predicted Results of the Dynamic Model | Error |(Predicted-Actual)/Actual| |
|---|---|---|---|---|
| Profit (Loss) | Million Rials | 3,770,080 | 1,512,070 | 0.600 |
| Income | Million Rials | 9,867,234 | 10,917,400 | 0.110 |
| Cost | Million Rials | 6,097,154 | 6,466,711 | 0.060 |
| Number of customers | Million People | 14.9 | 15 | 0.010 |
| Number of satisfied customers | Million People | 12.00 | 11.18 | 0.070 |
| Customers’ loyalty | Per cent | 65.00 | 63.48 | 0.020 |
| Number of railway fatalities | People | 44 | 41 | 0.070 |
| Quality of service | Per cent | 53 | 48 | 0.090 |
| Income from selling tickets | Million Rials | 3,791,191 | 3,625,980 | 0.040 |
| Number of complaints | Number | 1004 | 999 | 0.005 |
| Number of new wagons and locomotives | Number | 28 | 30 | 0.07 |
| Description | Unit | Actual Performance [67] | Predicted Results of the Dynamic Model | Error |(Predicted-Actual)/Actual| |
|---|---|---|---|---|
| Profit (Loss) | Million Rials | 7,703,537 | 5,962,741 | 0.230 |
| Income | Million Rials | 14,472,728 | 15,707,004 | 0.090 |
| Cost | Million Rials | 6,769,191 | 6,081,032 | 0.100 |
| Number of customers | Million People | 19.86 | 21.70 | 0.090 |
| Number of satisfied customers | Million People | 11.00 | 11.05 | 0.005 |
| Customers’ loyalty | Per cent | 62 | 63.41 | 0.020 |
| Number of railway fatalities | People | 39 | 42 | 0.080 |
| Quality of service | Per cent | 54 | 53 | 0.020 |
| Income from selling tickets | Million Rials | 5,424,343 | 5,158,810 | 0.050 |
| Number of complaints | Number | 990 | 998 | 0.010 |
| Number of new wagons and locomotives | Number | 110 | 119 | 0.080 |
| Description | Unit | Actual Performance [67] | Predicted Results of the Dynamic Model | Error |(Predicted-Actual)/Actual| |
|---|---|---|---|---|
| Profit (Loss) | Million Rials | 11,162,043 | 15,588,700 | 0.400 |
| Income | Million Rials | 17,193,753 | 18,596,071 | 0.080 |
| Cost | Million Rials | 6,031,710 | 5,356,900 | 0.110 |
| Number of customers | Million People | 25.00 | 28.00 | 0.120 |
| Number of satisfied customers | Million People | 12.50 | 11.17 | 0.110 |
| Customers’ loyalty | Per cent | 68 | 66 | 0.030 |
| Number of railway fatalities | People | 39 | 41 | 0.050 |
| Quality of service | Per cent | 50 | 51.47 | 0.030 |
| Income from selling tickets | Million Rials | 698,615 | 614,046 | 0.120 |
| Number of complaints | Number | 995 | 990 | 0.010 |
| Number of new wagons and locomotives | Number | 121 | 120 | 0.010 |
| Railway Transport Sustainability Dimensions | Raja Sustainability Strategies (Criteria) | Scenarios |
|---|---|---|
| Social Sustainability | Popularity of the corporation (S1) | Increase in road transport tolls (S11) |
| Decrease in the number of complaints (S12) | ||
| Safe travel (S2) | Reduction in the number of railway fatalities (S21) | |
| Reduction in the annual number of railway accidents (S22) | ||
| Financial Sustainability | Financial development (F1) | Increase in ticket prices (F11) |
| Increase in purchase of new wagons and locomotives (F12) | ||
| Reduction in operating costs (F13) | ||
| Environmental Sustainability | Pollution prevention (E1) | Reduction of energy consumption (E11) |
| Reduction of air emissions (E12) |
| Decision-Makers | D1 | D2 | D3 | D4 |
|---|---|---|---|---|
| Criteria | ||||
| S1 | VH | VH | VH | VH |
| S2 | H | VH | MH | H |
| F1 | VH | VH | H | H |
| E1 | MH | MH | H | MH |
| Criteria | Weight | ||
|---|---|---|---|
| S1 | 0.900 | 1.00 | 1.00 |
| S2 | 0.700 | 0.875 | 0.975 |
| F1 | 0.800 | 0.950 | 1.00 |
| E1 | 0.550 | 0.750 | 0.925 |
| S1 | S2 | F1 | E1 | |||||||||||||
|---|---|---|---|---|---|---|---|---|---|---|---|---|---|---|---|---|
| D1 | D2 | D3 | D4 | D1 | D2 | D3 | D4 | D1 | D2 | D3 | D4 | D1 | D2 | D3 | D4 | |
| S11 | VG | VG | VG | VG | MP | F | MP | F | VG | VG | VG | VG | P | P | P | VP |
| S12 | MG | G | MG | MG | G | G | G | G | P | P | VP | VP | P | VP | VP | VP |
| S21 | G | MG | MG | MG | VG | VG | VG | VG | P | P | P | P | VP | VP | VP | VP |
| S22 | G | G | G | G | VG | VG | VG | VG | P | VP | VP | VP | P | P | P | P |
| F11 | F | MP | MP | F | P | P | P | MP | VG | VG | VG | VG | VP | P | VP | P |
| F12 | VG | VG | G | G | VG | G | G | VG | VG | G | G | VG | G | G | VG | VG |
| F13 | P | MP | P | MP | G | G | G | G | G | G | VG | G | F | F | F | G |
| E11 | P | P | MP | MP | P | P | P | P | VP | VP | P | P | VG | VG | VG | G |
| E12 | F | F | P | P | P | VP | VP | P | P | P | P | P | VG | VG | VG | VG |
| S1 | S2 | F1 | E1 | |||||||||
|---|---|---|---|---|---|---|---|---|---|---|---|---|
| L | M | U | L | M | U | L | M | U | L | M | U | |
| S11 | 1.000 | 1.000 | 1.000 | 0.220 | 0.400 | 0.600 | 1.000 | 1.00 | 1.000 | 0.000 | 0.075 | 0.250 |
| S12 | 0.610 | 0.750 | 0.925 | 0.770 | 0.900 | 1.000 | 0.000 | 0.050 | 0.200 | 0.000 | 0.025 | 0.150 |
| S21 | 0.610 | 0.750 | 0.925 | 1.000 | 1.00 | 1.000 | 0.000 | 0.100 | 0.300 | 0.000 | 0.00 | 0.100 |
| S22 | 0.770 | 0.900 | 1.000 | 1.000 | 1.00 | 1.000 | 0.000 | 0.025 | 0.150 | 0.000 | 0.100 | 0.300 |
| F11 | 0.220 | 0.400 | 0.600 | 0.000 | 0.075 | 0.250 | 0.770 | 0.900 | 1.000 | 0.000 | 0.050 | 0.200 |
| F12 | 0.880 | 0.950 | 1.000 | 0.880 | 0.950 | 1.000 | 0.880 | 0.950 | 1.000 | 0.880 | 0.950 | 1.000 |
| F13 | 0.050 | 0.200 | 0.400 | 0.770 | 0.900 | 1.000 | 0.830 | 0.925 | 1.000 | 0.440 | 0.600 | 0.775 |
| E11 | 0.050 | 0.200 | 0.400 | 0.000 | 0.100 | 0.300 | 0.000 | 0.050 | 0.200 | 0.940 | 0.975 | 1.000 |
| E12 | 0.160 | 0.300 | 0.500 | 0.000 | 0.050 | 0.200 | 0.000 | 0.100 | 0.300 | 1.000 | 1.000 | 1.000 |
| S1 | S2 | F1 | E1 | |||||||||
|---|---|---|---|---|---|---|---|---|---|---|---|---|
| L | M | U | L | M | U | L | M | U | L | M | U | |
| S11 | 0.900 | 1.000 | 1.000 | 0.156 | 0.350 | 0.585 | 0.800 | 0.950 | 1.000 | 0.000 | 0.900 | 1.000 |
| S12 | 0.550 | 0.750 | 0.925 | 0.544 | 0.788 | 0.975 | 0.000 | 0.048 | 0.200 | 0.000 | 0.550 | 0.750 |
| S21 | 0.550 | 0.750 | 0.920 | 0.700 | 0.875 | 0.975 | 0.000 | 0.095 | 0.300 | 0.000 | 0.550 | 0.750 |
| S22 | 0.700 | 0.900 | 1.000 | 0.700 | 0.875 | 0.975 | 0.000 | 0.024 | 0.150 | 0.000 | 0.700 | 0.900 |
| F11 | 0.200 | 0.400 | 0.600 | 0.000 | 0.065 | 0.240 | 0.620 | 0.855 | 1.000 | 0.000 | 0.200 | 0.400 |
| F12 | 0.800 | 0.950 | 1.000 | 0.620 | 0.830 | 0.975 | 0.710 | 0.903 | 1.000 | 0.488 | 0.800 | 0.950 |
| F13 | 0.050 | 0.200 | 0.400 | 0.540 | 0.788 | 0.975 | 0.660 | 0.870 | 1.000 | 0.240 | 0.050 | 0.200 |
| E11 | 0.050 | 0.200 | 0.400 | 0.000 | 0.088 | 0.292 | 0.000 | 0.048 | 0.200 | 0.519 | 0.050 | 0.200 |
| E12 | 0.150 | 0.300 | 0.500 | 0.000 | 0.044 | 0.195 | 0.000 | 0.095 | 0.300 | 0.550 | 0.150 | 0.300 |
| FPIS | 0.900 | 1.000 | 1.000 | 0.700 | 0.875 | 0.975 | 0.800 | 0.950 | 1.000 | 0.550 | 0.750 | 0.925 |
| FNIS | 0.050 | 0.200 | 0.400 | 0.000 | 0.043 | 0.195 | 0.000 | 0.023 | 0.150 | 0.000 | 0.000 | 0.092 |
| S11 | S12 | S21 | S22 | F11 | F12 | F13 | E11 | E12 |
|---|---|---|---|---|---|---|---|---|
| 2.250 | 3.720 | 3.470 | 3.190 | 4.180 | 0.420 | 2.410 | 4.610 | 4.380 |
| 3.950 | 2.530 | 2.750 | 3.038 | 2.069 | 5.810 | 3.860 | 1.580 | 1.810 |
| S11 | S12 | S21 | S22 | F11 | F12 | F13 | E11 | E12 |
|---|---|---|---|---|---|---|---|---|
| 0.6373 | 0.4047 | 0.4418 | 0.4877 | 0.3310 | 0.9318 | 0.6156 | 0.2549 | 0.2923 |
| Policy Example | Direct Variables Involved | Covered in This Paper | Comment |
|---|---|---|---|
| Purchasing new wagons and locomotives | Income, Profit, Ticket price, Rental wagon, Number of satisfied users, … | ✓ | The policy may bring huge profit in the near future |
| Road transportation tolls | Number of customers, Income, Profit, Number of satisfied users, Customers loyalty, … | ✓ | The policy may affect the number of customers, resulting in increased profits |
| Operating costs | Profit, Buying new wagons and locomotives, Number of satisfied users, … | ✓ | Might be considered to reduce costs in order to make profits |
Publisher’s Note: MDPI stays neutral with regard to jurisdictional claims in published maps and institutional affiliations. |
© 2022 by the authors. Licensee MDPI, Basel, Switzerland. This article is an open access article distributed under the terms and conditions of the Creative Commons Attribution (CC BY) license (https://creativecommons.org/licenses/by/4.0/).
Share and Cite
Moradi, S.; Sierpiński, G.; Masoumi, H. System Dynamics Modeling and Fuzzy MCDM Approach as Support for Assessment of Sustainability Management on the Example of Transport Sector Company. Energies 2022, 15, 4917. https://doi.org/10.3390/en15134917
Moradi S, Sierpiński G, Masoumi H. System Dynamics Modeling and Fuzzy MCDM Approach as Support for Assessment of Sustainability Management on the Example of Transport Sector Company. Energies. 2022; 15(13):4917. https://doi.org/10.3390/en15134917
Chicago/Turabian StyleMoradi, Shohreh, Grzegorz Sierpiński, and Houshmand Masoumi. 2022. "System Dynamics Modeling and Fuzzy MCDM Approach as Support for Assessment of Sustainability Management on the Example of Transport Sector Company" Energies 15, no. 13: 4917. https://doi.org/10.3390/en15134917
APA StyleMoradi, S., Sierpiński, G., & Masoumi, H. (2022). System Dynamics Modeling and Fuzzy MCDM Approach as Support for Assessment of Sustainability Management on the Example of Transport Sector Company. Energies, 15(13), 4917. https://doi.org/10.3390/en15134917