Article

Optimal Allocation Method of Source and Storage Capacity of PV-Hydrogen Zero Carbon Emission Microgrid Considering the Usage Cost of Energy Storage Equipment

Department of Electrical Engineering, North China Electric Power University, Baoding 071003, China
*
Author to whom correspondence should be addressed.
Energies 2022, 15(13), 4916; https://doi.org/10.3390/en15134916
Submission received: 15 May 2022 / Revised: 18 June 2022 / Accepted: 30 June 2022 / Published: 5 July 2022
(This article belongs to the Section A1: Smart Grids and Microgrids)

Abstract

:
Aiming to meet the low-carbon demands of power generation in the process of carbon peaking and carbon neutralization, this paper proposes an optimal PV-hydrogen zero carbon emission microgrid. The light–electricity–hydrogen coupling utilization mode is adopted. The hydrogen-based energy system replaces the carbon-based energy system to realize zero carbon emissions. Firstly, the mathematical models of photovoltaic, hydrogen and electric energy storage systems in a microgrid are built. Then, the optimal allocation model of the microgrid source storage capacity is established, and a scheduling strategy considering the minimum operational cost of energy storage equipment is proposed. The priority of equipment output is determined by comparing the operational costs of the hydrogen energy storage system and the electric energy storage system. Finally, the proposed scheme is compared with the scheduling scheme of the battery priority and the hydrogen energy system priority in an actual microgrid. It is verified that the scheme can ensure stable power-generating, zero carbon operation of a microgrid system while reducing the total annual power costs by 9.8% and 25.1%, respectively.

1. Introduction

The strategic goals of carbon peak before 2030 and carbon neutralization before 2060 are China’s solemn declaration and great commitment to the world in response to climate change and environmental protection [1]. With the accelerated implementation of the promotion policy of photovoltaic in the whole country, the construction of renewable energy microgrids with photovoltaic arrays as the main energy source is urgent. However, the randomness and fluctuation of photovoltaic output determines that it must be equipped with reasonable energy storage. As a clean energy to promote the transformation from traditional fossil energy to green energy, hydrogen energy has the characteristics of high energy density by unit of mass compared with other energy storage methods and is regarded as the technical direction of the future energy revolution [2,3,4]. To practice the strategy of “carbon peaking and carbon neutralization”, the zero carbon emission power supply mode of renewable energy coupled with hydrogen energy storage has replaced fossil energy in the traditional microgrid. The PV-hydrogen zero carbon emission microgrid proposed in this paper is an important idea in this approach.
At present, scholars at home and abroad have conducted a lot of research on the optimal power capacity allocation of a microgrid with renewable energy coupled with hydrogen energy, but few studies have completely used renewable energy as the power supply. In the configuration scheme of [5,6,7,8,9], when the energy storage is insufficient, a diesel engine or a gas turbine is used to make up for the power shortage, which greatly increases the carbon emissions of the system. In the dispatching scheme of [10,11], power is purchased from the grid when needs exceed supply, but this strategy does not guarantee 100% renewable energy. For the modeling method of optimal capacity allocation, the existing research mostly adopts a double-layer optimization model [6,12,13]. The outer layer uses an artificial intelligence algorithm to generate the initial capacity allocation scheme, and the inner layer, called CPLEX commercial solver, is used to solve the optimal operation scheme under the corresponding configuration. Such a solution is very random in scheduling and easily leads to local optimal solution power generation issues. To reduce the blindness in scheduling, when faced with a shortage or a surplus of system power, ref. [14] puts forward and compares two scheduling schemes of battery priority and hydrogen energy storage priority, while [15] directly adopts the scheme of battery priority, to regularize the operation scheduling process However, these two scheduling schemes only artificially and simply specify the priority of battery and hydrogen energy storage output and do not consider costs. In addition, when planning a small-scale renewable energy microgrid in the city, such as industrial parks, commercial parks, office parks and residential areas, wind turbines are difficult to use due to the disadvantages of large floor area and noise disturbing residents. However, at present, most microgrid configuration schemes [5,6,7,8,14,16,17] contain wind turbines. As a result, they are difficult to implement in major cities.
The strategy of storing energy will not only affect the performance and life of equipment, but also directly affect the economy, reliability and environmental challenges of the whole system. A strategy for the operation of the power grid is the key factor in determining capacity configuration. In [18], the authors propose a system that relies on wind–solar complementation and diesel generators to supply power, but it only uses batteries for storage, resulting in a single structure and low reliability. Reference [19] uses battery and a super capacitor as hybrid energy storage device. The power distribution between battery and super capacitor is realize by boundary frequency. However, a super capacitor is expensive, making the scheme prohibitively expensive to implement.
In view of the deficiencies in the above research, the PV-hydrogen zero carbon emission power supply microgrid proposed in this paper adopts a light–hydrogen–electricity coupling utilization mode with hydrogen energy storage and power generation as the core, and the hydrogen-based energy system replaces the carbon-based energy system to realize zero carbon emissions. This paper further considers the operational cost of the energy storage equipment and puts forward a scheduling strategy considering the minimum operational cost of the energy storage equipment. Finally, through the simulation comparison in an actual microgrid, it verifies that this method not only ensures the stable zero carbon operation of a microgrid system, but also takes into account the economy of the configuration scheme.
The following are the main contributions of the paper:
  • Put forward the concept of a PV-hydrogen zero carbon emission microgrid and realize zero carbon emissions by replacing a carbon-based energy system with a hydrogen-based energy system.
  • An optimal scheduling strategy considering the minimum operation cost of energy storage equipment is proposed to minimize the investment and operation cost of the whole system.
  • The model and algorithm are highly systematic, widely applicable to small and medium-sized microgrids in cities and can be widely promoted.
The paper is organized as follows. Section 2 establishes the system structure and mathematical model of a zero-carbon emission microgrid. Section 3 demonstrates the optimal allocation model of source and storage capacity of a zero-carbon emission microgrid. Section 4 explains the microgrid dispatching strategy and model solving method. Section 5 demonstrates the effectiveness of the proposed models through a case study of an actual industrial park. Section 6 briefly describes the conclusions of this paper.

2. Structure and Mathematical Model of a Zero Carbon Emission Microgrid System

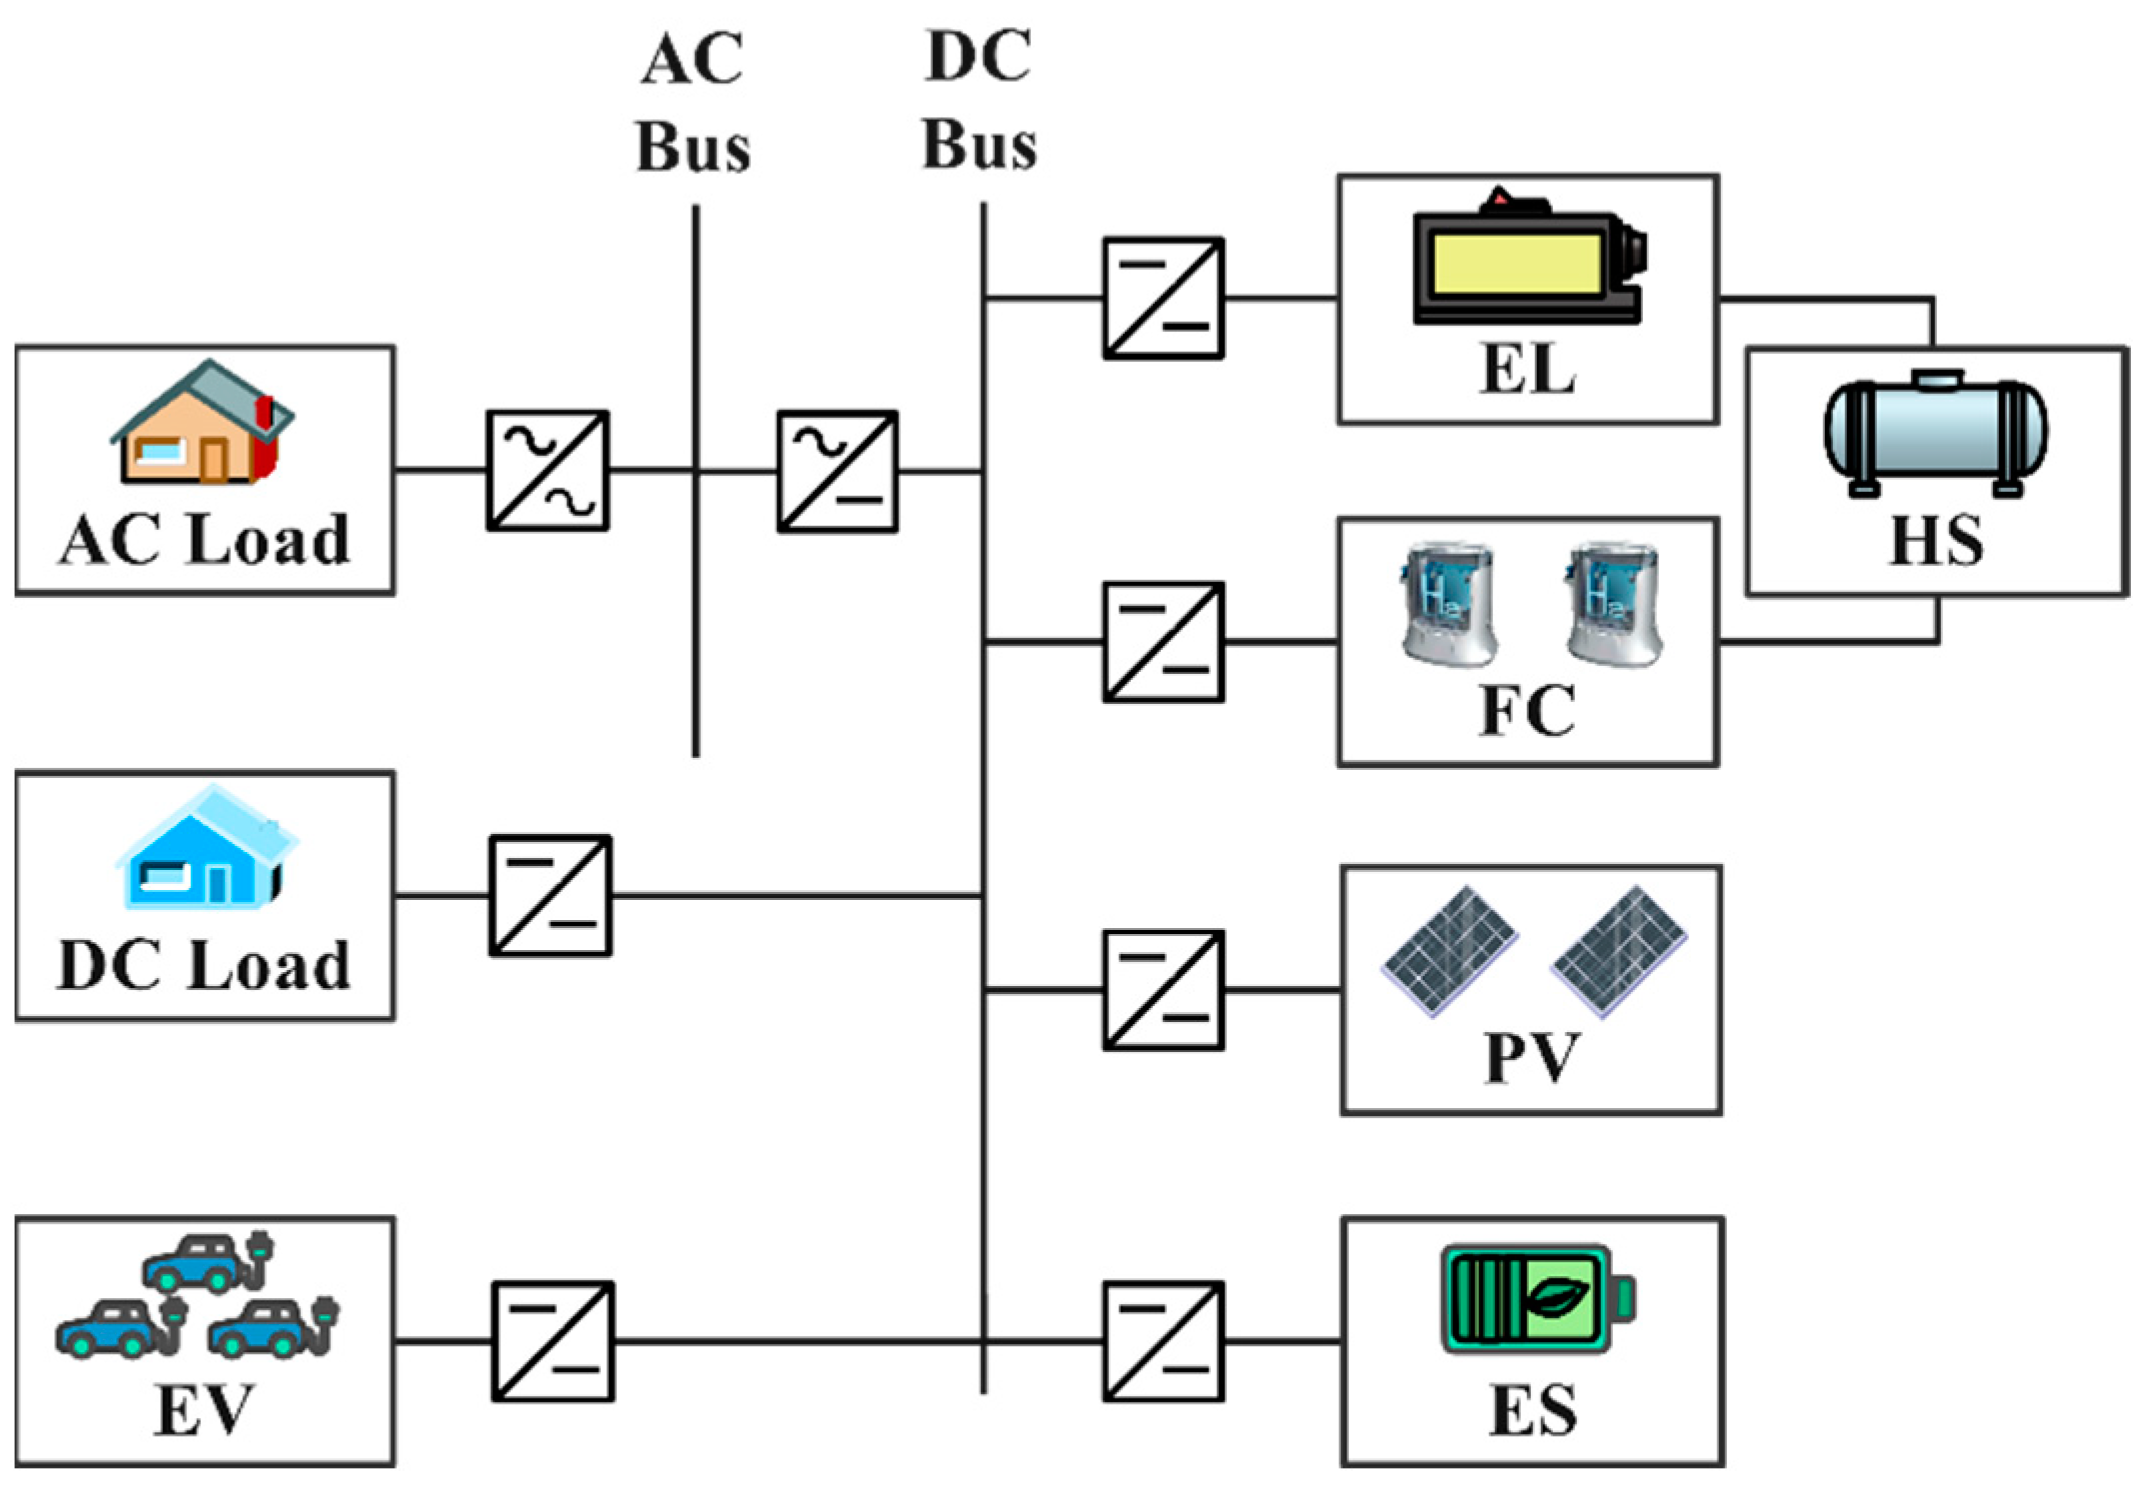
2.1. System Structure and Operation Mode

The system structure of a PV-hydrogen zero carbon emission microgrid, which is composed of distributed power generation (photovoltaic), an energy storage system (hydrogen energy storage unit, lithium battery energy storage unit), electric vehicle and load is shown in Figure 1. Each part is connected to a multi-port power electronic transformer, and the flexible control of the power flow is realized through a flexible substation. The hydrogen energy storage system provides a long-term solution to the problem of power imbalance. A lithium battery is used to stabilize the short-term fluctuation of power and avoid the frequent start and stop of the fuel cell and the electrolytic machine. The zero-carbon emission operation mode in the microgrid is as follows: first, the photovoltaic array is used to capture solar radiation to generate power. While meeting the current load requirements, the excess electric energy is converted to hydrogen by electrolyzing water in the electrolytic cell or charged by the battery for storage. At night or when the photovoltaic output is insufficient, the hydrogen fuel cell uses the stored hydrogen to generate electricity or discharge the battery to realize the continuous supply of zero carbon power in the park. In this way, the hydrogen-based energy system replaces the carbon-based energy system to achieve zero carbon emissions of the energy supply. This paper does not consider power interaction with a large power grid.

2.2. Mathematical Model

2.2.1. Photovoltaic Model

The output of the photovoltaic module is mainly related to solar irradiation intensity and temperature, and its output power [20] can be expressed as
P PV ( t ) = P PV rate S S ref 1 + K t T c T ref
where P PV ( t ) is the photovoltaic output power at time t, P PV rate is the maximum test power of the photovoltaic module under standard test conditions, S is the actual solar radiation intensity, S ref is the solar radiation intensity of the photovoltaic modules under a standard test, T ref is the temperature of the component under a standard test, K t is the temperature coefficient, and T c is the photovoltaic cell temperature, which can be calculated by the following formula:
T c = T a + S N O C T 20 800
where: T a is the actual ambient temperature, and NOCT is the nominal cell operating temperature of photovoltaic module.

2.2.2. Alkaline Electrolyzer Model

The electrolytic cell is used to convert excess power into hydrogen, and its model [21] can be described as
U EL ( t ) = N EL Δ G 2 F k rev T EL 298.15 + r 1 + r 2 T EL A EL I EL ( t ) + s 1 + s 2 T EL + s 3 T EL 2 log t 1 + t 2 / T EL + t 3 / T EL 2 A EL I EL ( t ) + 1
where Δ G is the standard free energy of liquid water, F is the Faraday constant, T EL is the working temperature of the electrolytic cell, k rev is the empirical temperature coefficient, I EL ( t ) is the running current of the electrolytic cell at time t, N EL is the number of single slot series, r 1 and r 2 are the ohmic resistance parameters of electrolyte, s 1 , s 2 , s 3 and t 1 , t 2 , t 3 are the overvoltage parameters of the electrode.
The power of the electrolytic cell P EL ( t ) at time t can be calculated as:
P EL ( t ) = U EL ( t ) I EL ( t )
The hydrogen production rate n EL H 2 ( t ) of the electrolytic cell at time t can be calculated as:
n EL H 2 ( t ) = η F N EL I EL ( t ) 2 F
η F ( t ) = I el ( t ) / A el 2 f 1 + I el ( t ) / A el 2 f 2
where η F is Faraday efficiency, and f 1 , f 2 is the empirical coefficient.

2.2.3. Fuel Cell Model

A hydrogen fuel cell generates electricity by consuming hydrogen and oxygen, and its simplified electrical model [20] can be described as
U FC ( t ) = E OC r FC I FC ( t ) a ln I FC ( t ) m e s I FC ( t ) N FC
where U FC ( t ) is the output voltage of the hydrogen fuel cell, E OC is the open circuit voltage of a single cell, I FC ( t ) is the current density of a single cell, N FC is the number of cells in series, and r FC , s , a , m are the empirical coefficient.
The hydrogen consumption rate is
n FC H 2 ( t ) = N FC I FC ( t ) 2 F η FC H 2
where η FC H 2 is the utilization efficiency of hydrogen by the fuel cell.
The output power of fuel cell P FC ( t ) at time t is
P FC ( t ) = U FC ( t ) I FC ( t )
To simplify the model, the impacts of auxiliary parts are taken into account in terms of the efficiencies of a fuel cell and electrolyzers.

2.2.4. Hydrogen Storage Tank Model

Considering the actual working situation, the medium pressure hydrogen storage tank (3.2 MPa) is adopted in this paper. The gas pressure in the hydrogen storage tank P HS ( t ) at time t is related to the hydrogen storage capacity n HS ( t ) , which is calculated by the ideal gas equation:
P HS ( t ) = n HS ( t ) R T H 2 V HS n HS ( t ) = n HS ( t 1 ) + n EL ( t ) n FC ( t ) Δ t
where T H 2 is the hydrogen temperature, V HS is the volume of the hydrogen storage tank, and n HS ( t 1 ) is the hydrogen gas volume in the tank at time t − 1. Hydrogen level is defined as the ratio of current hydrogen storage capacity to the maximum hydrogen storage capacity, expressed as
S O H S ( t ) = P HS ( t ) P N × 100 %
where P N is the maximum pressure of the hydrogen storage tank.

2.2.5. Battery Model

In electrochemical energy storage, a battery is the most widely used energy storage type in a microgrid. In this paper, a lithium battery was selected as the energy storage device of the microgrid. A lithium battery has significant advantages such as high working voltage, high energy density, high power bearing capacity, low self-discharge rate, strong adaptability to high and low temperature, long service life, no memory effect, environment friendly and so on. The mathematical model of the battery state of charge is
S O C ( t ) = S O C ( t Δ t ) ( 1 σ ) P dh ( t ) Δ t E rated η ES dh + P ch ( t ) Δ t η ES ch E rated
where P dh ( t ) and P ch ( t ) are the discharging and charging power of the battery, respectively, σ is the self-discharge rate of the battery, S O C ( t ) is the charge state of the battery at time t, which is determined by the charge state S O C ( t Δ t ) at time t Δ t , the charge and discharge power at time t and the self-discharge rate at time t, η ES dh and η ES ch are the discharge and charging efficiency of the battery, respectively, and E rated is the rated capacity of the battery.

2.2.6. Load Model

There are two types of loads in a microgrid: AC load P L ac t and DC load P L dc t . To simplify analysis, the AC load is converted to the DC side through a converter, and the equivalent load of the whole microgrid is:
P L t = P L ac t E f f INV + P L dc t
where E f f INV is the efficiency of the converter, which is taken as 95% in this paper.

3. Optimal Allocation Model of Source and Storage Capacity of the Microgrid

3.1. Objective Function

The microgrid system mainly includes a photovoltaic array, a hydrogen energy storage system, an electric energy storage system and load. Therefore, the capacity configuration and the optimization variable depend on the capacity of the photovoltaic array, the fuel cell, the electrolytic cell, the hydrogen storage tank and the battery. The configuration focuses on the three subobjectives of a microgrid system: economy, power supply reliability and power supply environmental protection. The power supply reliability is characterized by load loss probability, and environmental protection is characterized by the renewable energy utilization rate. The total objective function can be expressed as follows:
F = min C inv & om + C loss + C waste
C inv & om = C PV inv & om + C FC inv & om + C ES inv & om + C EL inv & om
C K inv & om = C K inv , u M K f K cr + C K om , u M K , K PV , FC , ES , EL
C loss = k loss t = 1 T P loss t Δ t
C waste = k waste t = 1 T P waste t Δ t
f K cr = r ( 1 + r ) T K L ( 1 + r ) T K L 1
where C inv & om is the annual equipment investment cost and operation and maintenance cost, C loss is the power shortage penalty, C waste is the renewable energy waste penalty, C K inv , u , C K om , u are the unit photovoltaic or energy storage equipment investment cost and operation and maintenance cost, respectively, M K is the number or capacity of the corresponding equipment, P loss t and P waste t are the load loss power and renewable energy waste power, respectively, k loss and k waste are the power shortage penalty coefficient and energy waste penalty coefficient, respectively, f K cr is the fund recovery coefficient of the corresponding equipment, r is the loan interest rate, and T K L is the service life of the equipment.

3.2. Constraint Condition

3.2.1. System Power Balance Constraint

The power balance constraints of the microgrid system are as follows
P PV t + P FC t + P ES t + P EL t + P loss t = P L t + P waste t
where when the system power is insufficient, P EL t , P waste t = 0 . When the system has a power surplus, P FC t , P loss t = 0 .

3.2.2. Photovoltaic, Hydrogen Energy System and Battery Output Constraints

The output constraints of photovoltaic, hydrogen energy system and battery are as follows
P PV min P PV t P PV max P FC min P FC t P FC max P EL min P EL t P EL max 0 P ES dh t P ES dh . max 0 P ES ch t P ES ch . max
where P FC max and P EL max are the rated power of the hydrogen fuel cell and the electrolytic cell, respectively.

3.2.3. Hydrogen Energy System, Battery Capacity Constraints

The capacity constraints of hydrogen energy system and battery are as follows
0.2 S O C max S O C t 0.8 S O C max
0.1 S O H S max S O H S t 0.9 S O H S max

3.2.4. Start Stop Constraint

Define ‘or not’ operator “$” (A = B $ C, if and only if both B and C take 0, A takes 1, otherwise A takes 0), conditional statement i f Q (when Q is true, the statement takes 1, otherwise it takes 0). So
δ FC on t = δ FC on t 1   $   i f P net t < P dh eq t 1 δ FC off t = δ FC off t 1   $   i f P net t > P dh eq t 1
δ EL on t = δ EL on t 1   $   i f P net t < P ch eq t 1 δ EL off t = δ EL off t 1   $   i f P net t > P ch eq t 1
where δ FC on t and δ FC on t are the startup and shutdown variables of the hydrogen fuel cell (0–1 variable), and δ EL on t and δ EL on t are the startup and shutdown variables of the alkaline electrolytic cell (0–1 variable).
Specified initial time t = 0 :
δ FC 0 = 1 δ EL 0 = 0 δ FC on 0 , δ FC off 0 , δ EL on 0 , δ EL off 0 = 0

3.3. Evaluating Indicator

3.3.1. Load Loss Probability

The expression of load loss probability is as follows
L LP = t = 1 T P loss t Δ t t = 1 T P L t Δ t

3.3.2. Renewable Energy Utilization

The expression of renewable energy utilization rate is as follows
R u = 1 t = 1 T P waste t Δ t t = 1 T P PV t Δ t

3.3.3. Renewable Energy Penetration

The expression of renewable energy penetration is as follows
R p = t = 1 T P PV ( t ) P waste ( t ) Δ t t = 1 T P PV ( t ) + P Grid ( t ) P waste ( t ) Δ t
where P Grid ( t ) is the power exchanged with the power grid. In this paper, the power exchange with the large power grid is not considered. Therefore, P Grid ( t ) = 0 , and the penetration rate of renewable energy is 1.

4. Microgrid Dispatching Strategy and Model Solving Method

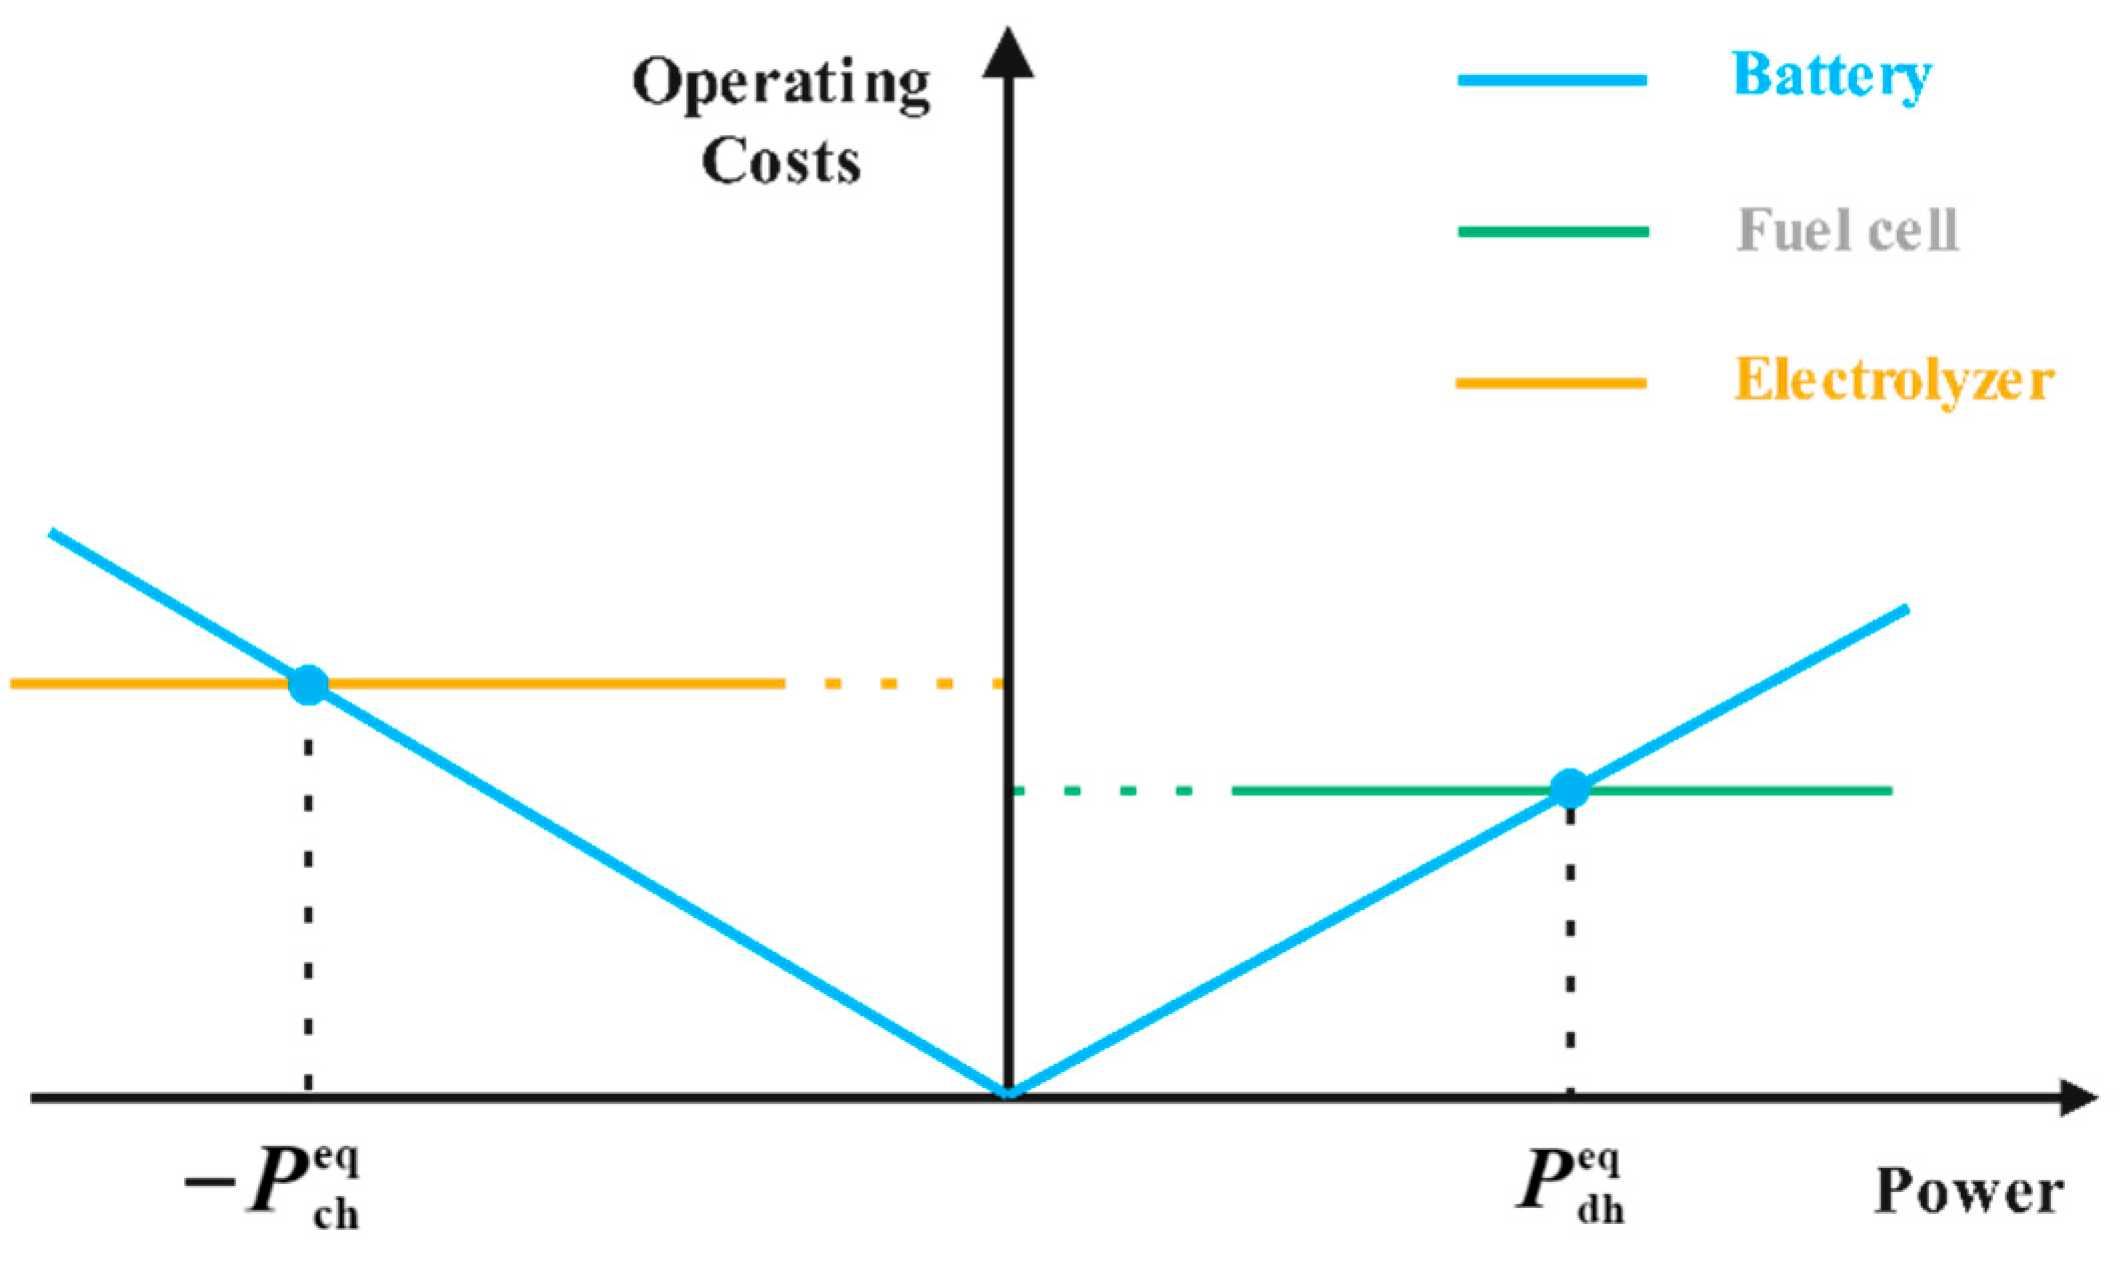
4.1. Usage Cost Modeling of Energy Storage Equipment

4.1.1. Usage Cost Model of the Hydrogen Fuel Cell

The operating cost model of hydrogen fuel cell is as follows
C FC t = δ FC t C FC fix + δ FC on t C FC on + δ FC off t C FC off C FC fix = C FC P + C FC O T FC L
where C FC t is the usage cost of the hydrogen fuel cell at the time t, C FC fix is the usage cost of the hydrogen fuel cell per unit time, δ FC t is the operating variable of the hydrogen fuel cell (0–1 variable), δ FC on t and δ FC on t are the startup and shutdown variables of the hydrogen fuel cell (0–1 variable), C FC on is the startup cost of the hydrogen fuel cell, C FC off is the shutdown cost of the hydrogen fuel cell, C FC P is the cost of the hydrogen fuel cell, C FC O is the operation and maintenance cost of the hydrogen fuel cell, and T FC L is the operating life of hydrogen fuel cell.

4.1.2. Usage Cost Model of the Alkaline Electrolyzer

Considering the energy stored in hydrogen by electrolyzing water in the electrolytic cell will also be converted into electric energy in the form of fuel cell power generation, the usage cost of absorbing excess energy in the electrolytic cell can be expressed as:
C EL t = δ EL t C EL fix + δ FC t C FC fix η EL η FC + δ EL on t C EL on + δ EL off t C EL off C EL fix = C EL P + C EL O T EL L
where C EL t is the usage cost of the alkaline electrolytic cell at the time t, C EL fix is the usage cost of the alkaline electrolytic cell per unit time, δ EL t is the operation variable of the alkaline electrolytic cell (0–1 variable), δ EL on t and δ EL on t are the startup and shutdown variables of the alkaline electrolytic cell (0–1 variable), C EL on is the startup cost of the alkaline electrolytic cell, C EL off is the shutdown cost of the alkaline electrolytic cell, C EL P is the cost of the alkaline electrolytic cell, C EL O is the operation and maintenance cost of the alkaline electrolytic cell, and T EL L is the operation life of the alkaline electrolytic cell.

4.1.3. Battery Usage Cost Model

The operating cost model of battery is as follows
C ES dh t = δ ES dh t ζ ES P ES dh t η ES dh C ES ch t = δ ES ch t ζ ES P ES ch t η ES ch η ES dh ζ ES = C ES P + C ES O B CAP N Y D O D
where C ES dh t is the usage cost of the battery discharging with P ES dh t at time t, C ES ch t is the usage cost of the battery charging with P ES ch t at time t, δ ES t is the operating variable of the battery (0–1 variable), ζ BAT is the kWh cost of the battery, P ES t is the output of the battery during the period, C ES P is the cost of a single battery, C ES O is the operation and maintenance cost of a single battery, B CAP is the capacity of a single battery, N Y is the number of cycles within the service life of a single battery, and DOD is the discharge depth of the battery.

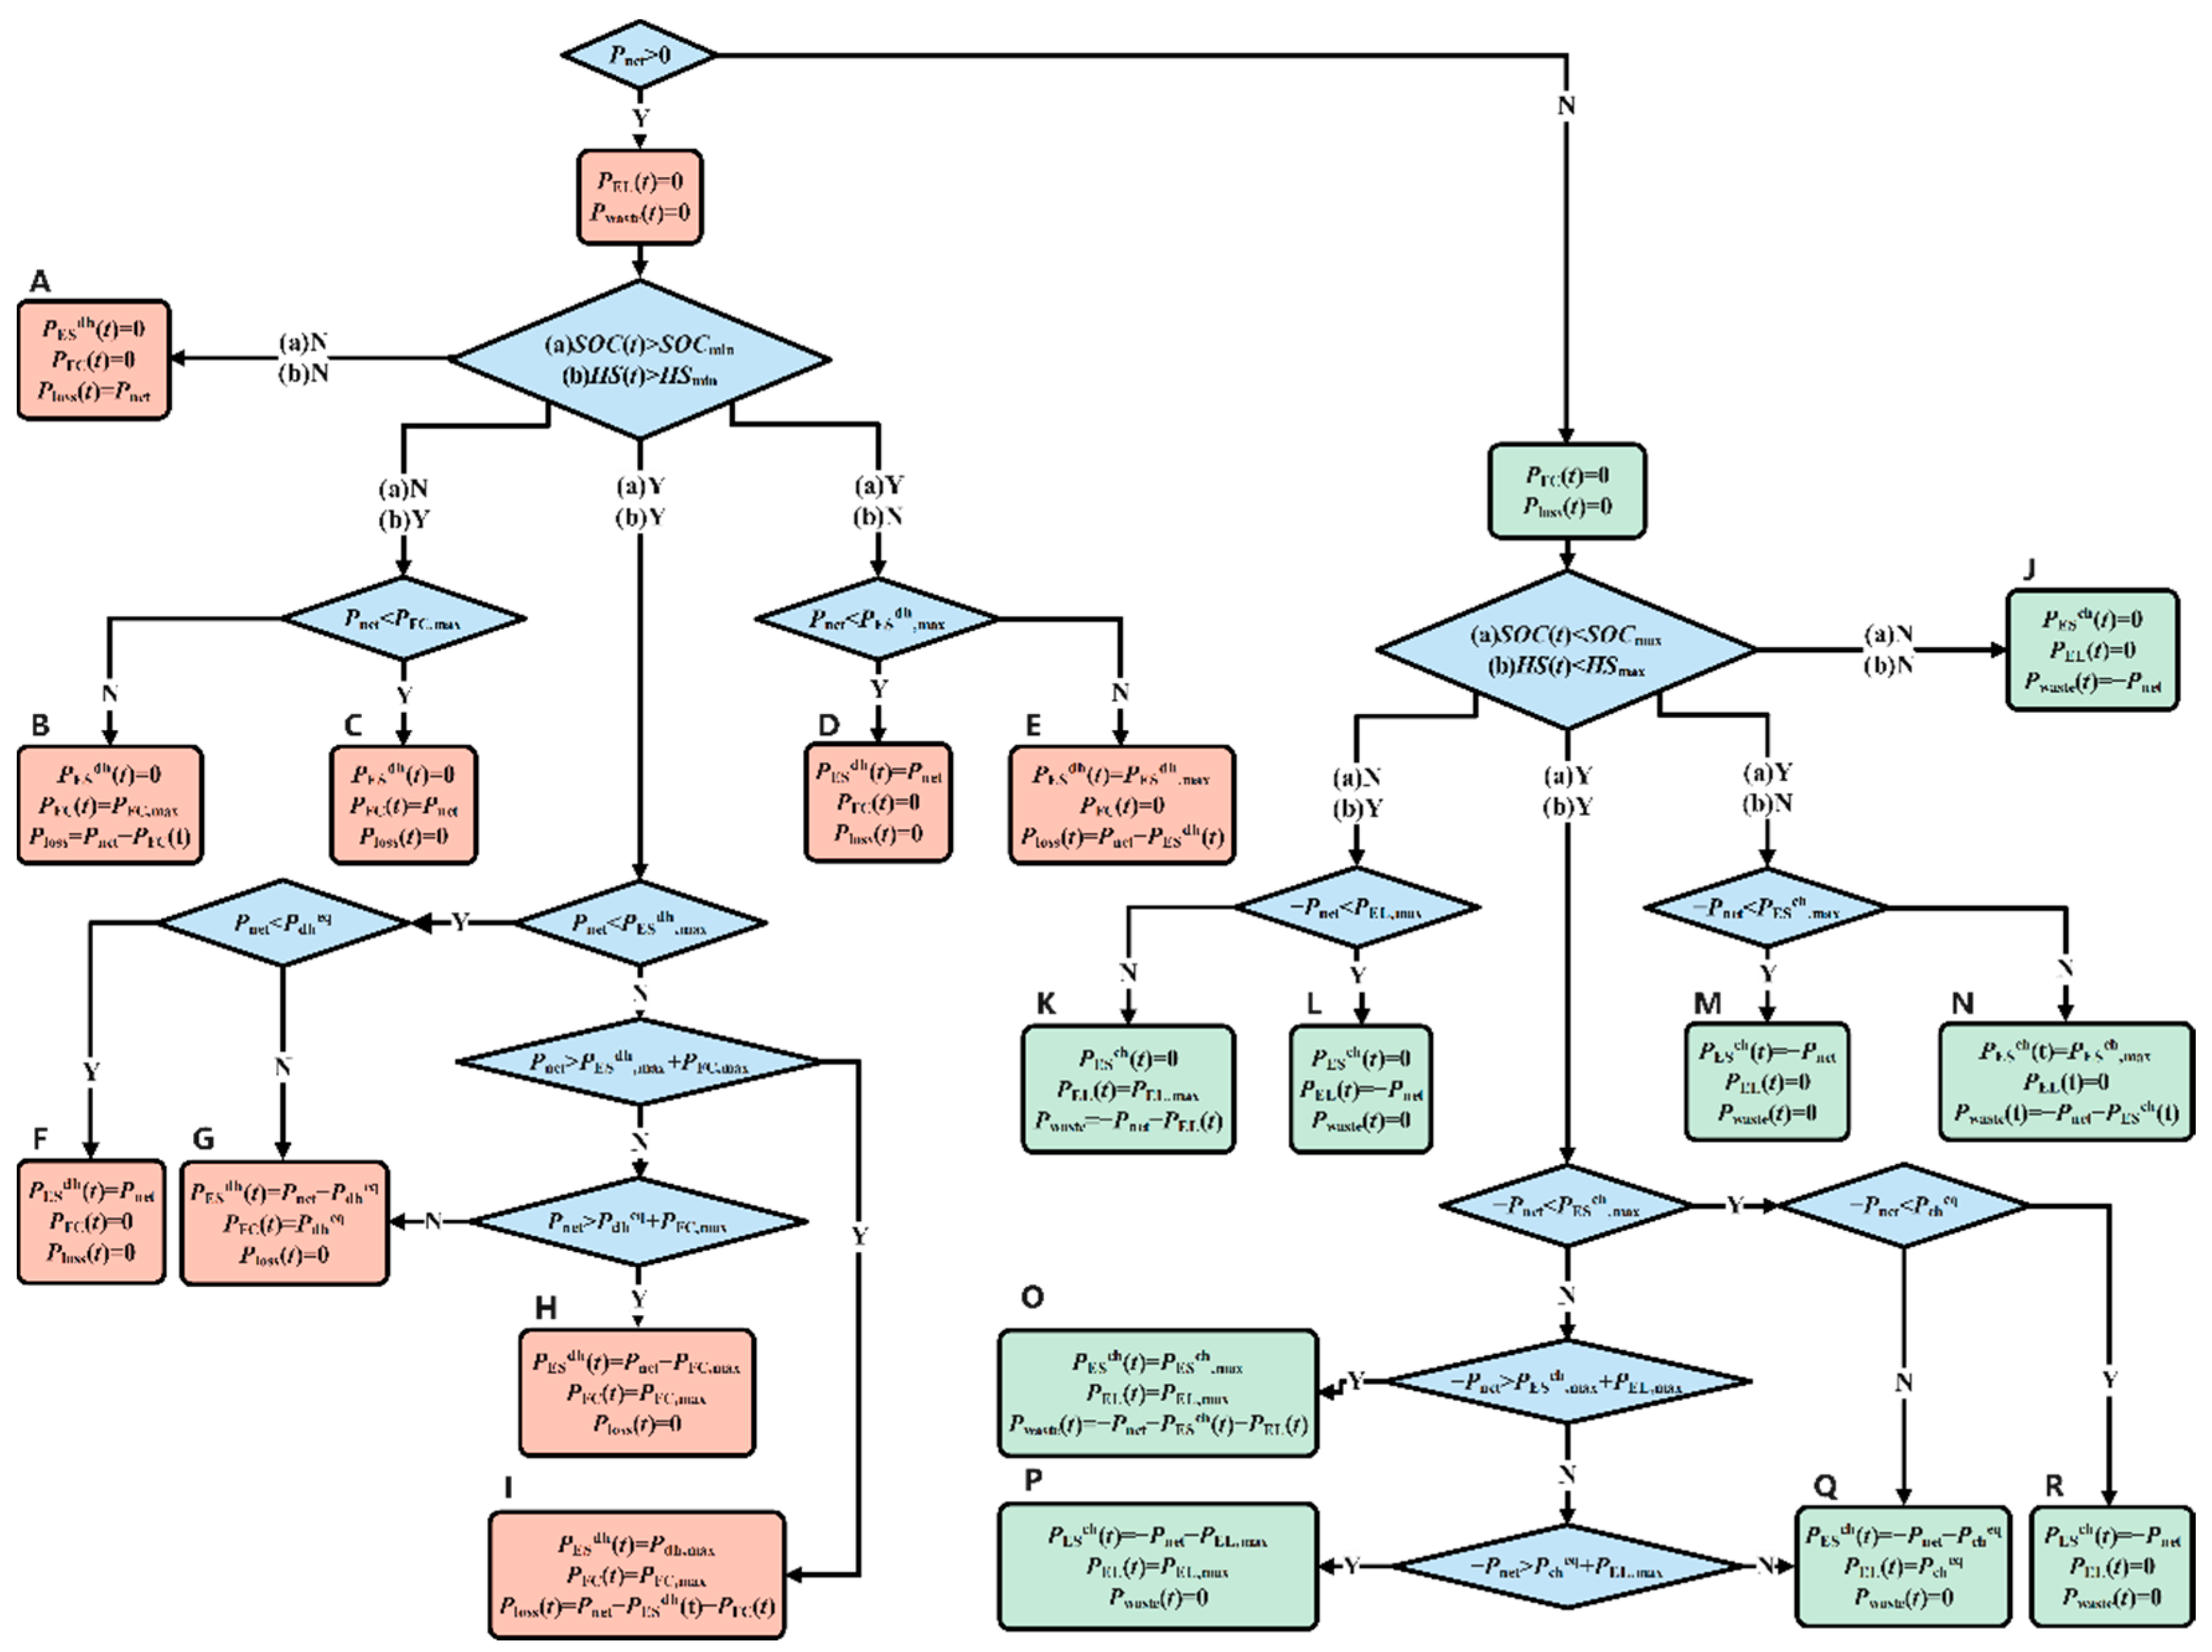
4.2. Scheduling Strategy of the Battery and the Hydrogen Energy System

The strategy for operating the microgrid determines how each element of the energy storage equipment will be prioritized during system operation. The operation control strategy of energy storage equipment will directly affect the optimization results of microgrid capacity. To coordinate the output of all the energy storage equipment and improve the efficiency and the benefit of the microgrid while meeting power supply demand, it is necessary to formulate appropriate scheduling strategies for the hydrogen energy system and the battery.
The difference between the actual load demand and the theoretical photovoltaic output power is defined as the net power P net t , expressed as:
P net t = P L t P PV t
In the previous section, the operational cost models of the battery, the hydrogen fuel cell and the alkaline electrolyzer were established, respectively. It can be seen from Equations (30) and (31) that the cost of operating the hydrogen fuel cell and the alkaline electrolyzer does not change within the rated power range. From Equation (32), we see that the operation cost of the battery is linearly related to its output power; therefore, the relationship between the operational cost and the power of the hydrogen energy system and the battery in the instantaneous state can be shown in Figure 2 [21].
In the first quadrant, the abscissa corresponding to the intersection of the battery operation (discharge) cost curve and the hydrogen fuel cell operation cost curve P dh eq is the equal discharge cost operation power of both. If the battery and hydrogen fuel cell have enough energy storage in the next period of time, when the net power Pnet (t) is greater than the equal discharge cost operating power P dh eq , the hydrogen fuel cell will give priority to output (block G, H, I), because the cost of using the hydrogen fuel cell for power supply is lower than that of the battery. If the required net power is greater than the maximum operating power P FC max of the hydrogen fuel cell, the insufficient power is supplemented by the battery. In contrast, when P net P dh eq , the battery gives priority to output (block F). Similarly, in the second quadrant, the abscissa corresponding to the intersection of the battery operation (charging) cost curve and the alkaline electrolytic cell operation cost curve P ch eq is the equal charge cost operation power of both. If the battery and the hydrogen storage tank have sufficient capacity in the next period of time, when the absolute value of net power P net is greater than the absolute value of equal charge cost operating power P ch eq , the alkaline electrolytic cell will give priority to output (block O, P, Q), because the cost of absorbing the excess power by the alkaline electrolytic cell is lower than that of the battery. If the absolute value of required net power is greater than the maximum operating power P EL max of the alkaline electrolytic cell, the excess power is absorbed by the battery. In contrast, when P net P ch eq , the battery gives priority to charge (block R). The detailed scheduling process is shown in Figure 3.

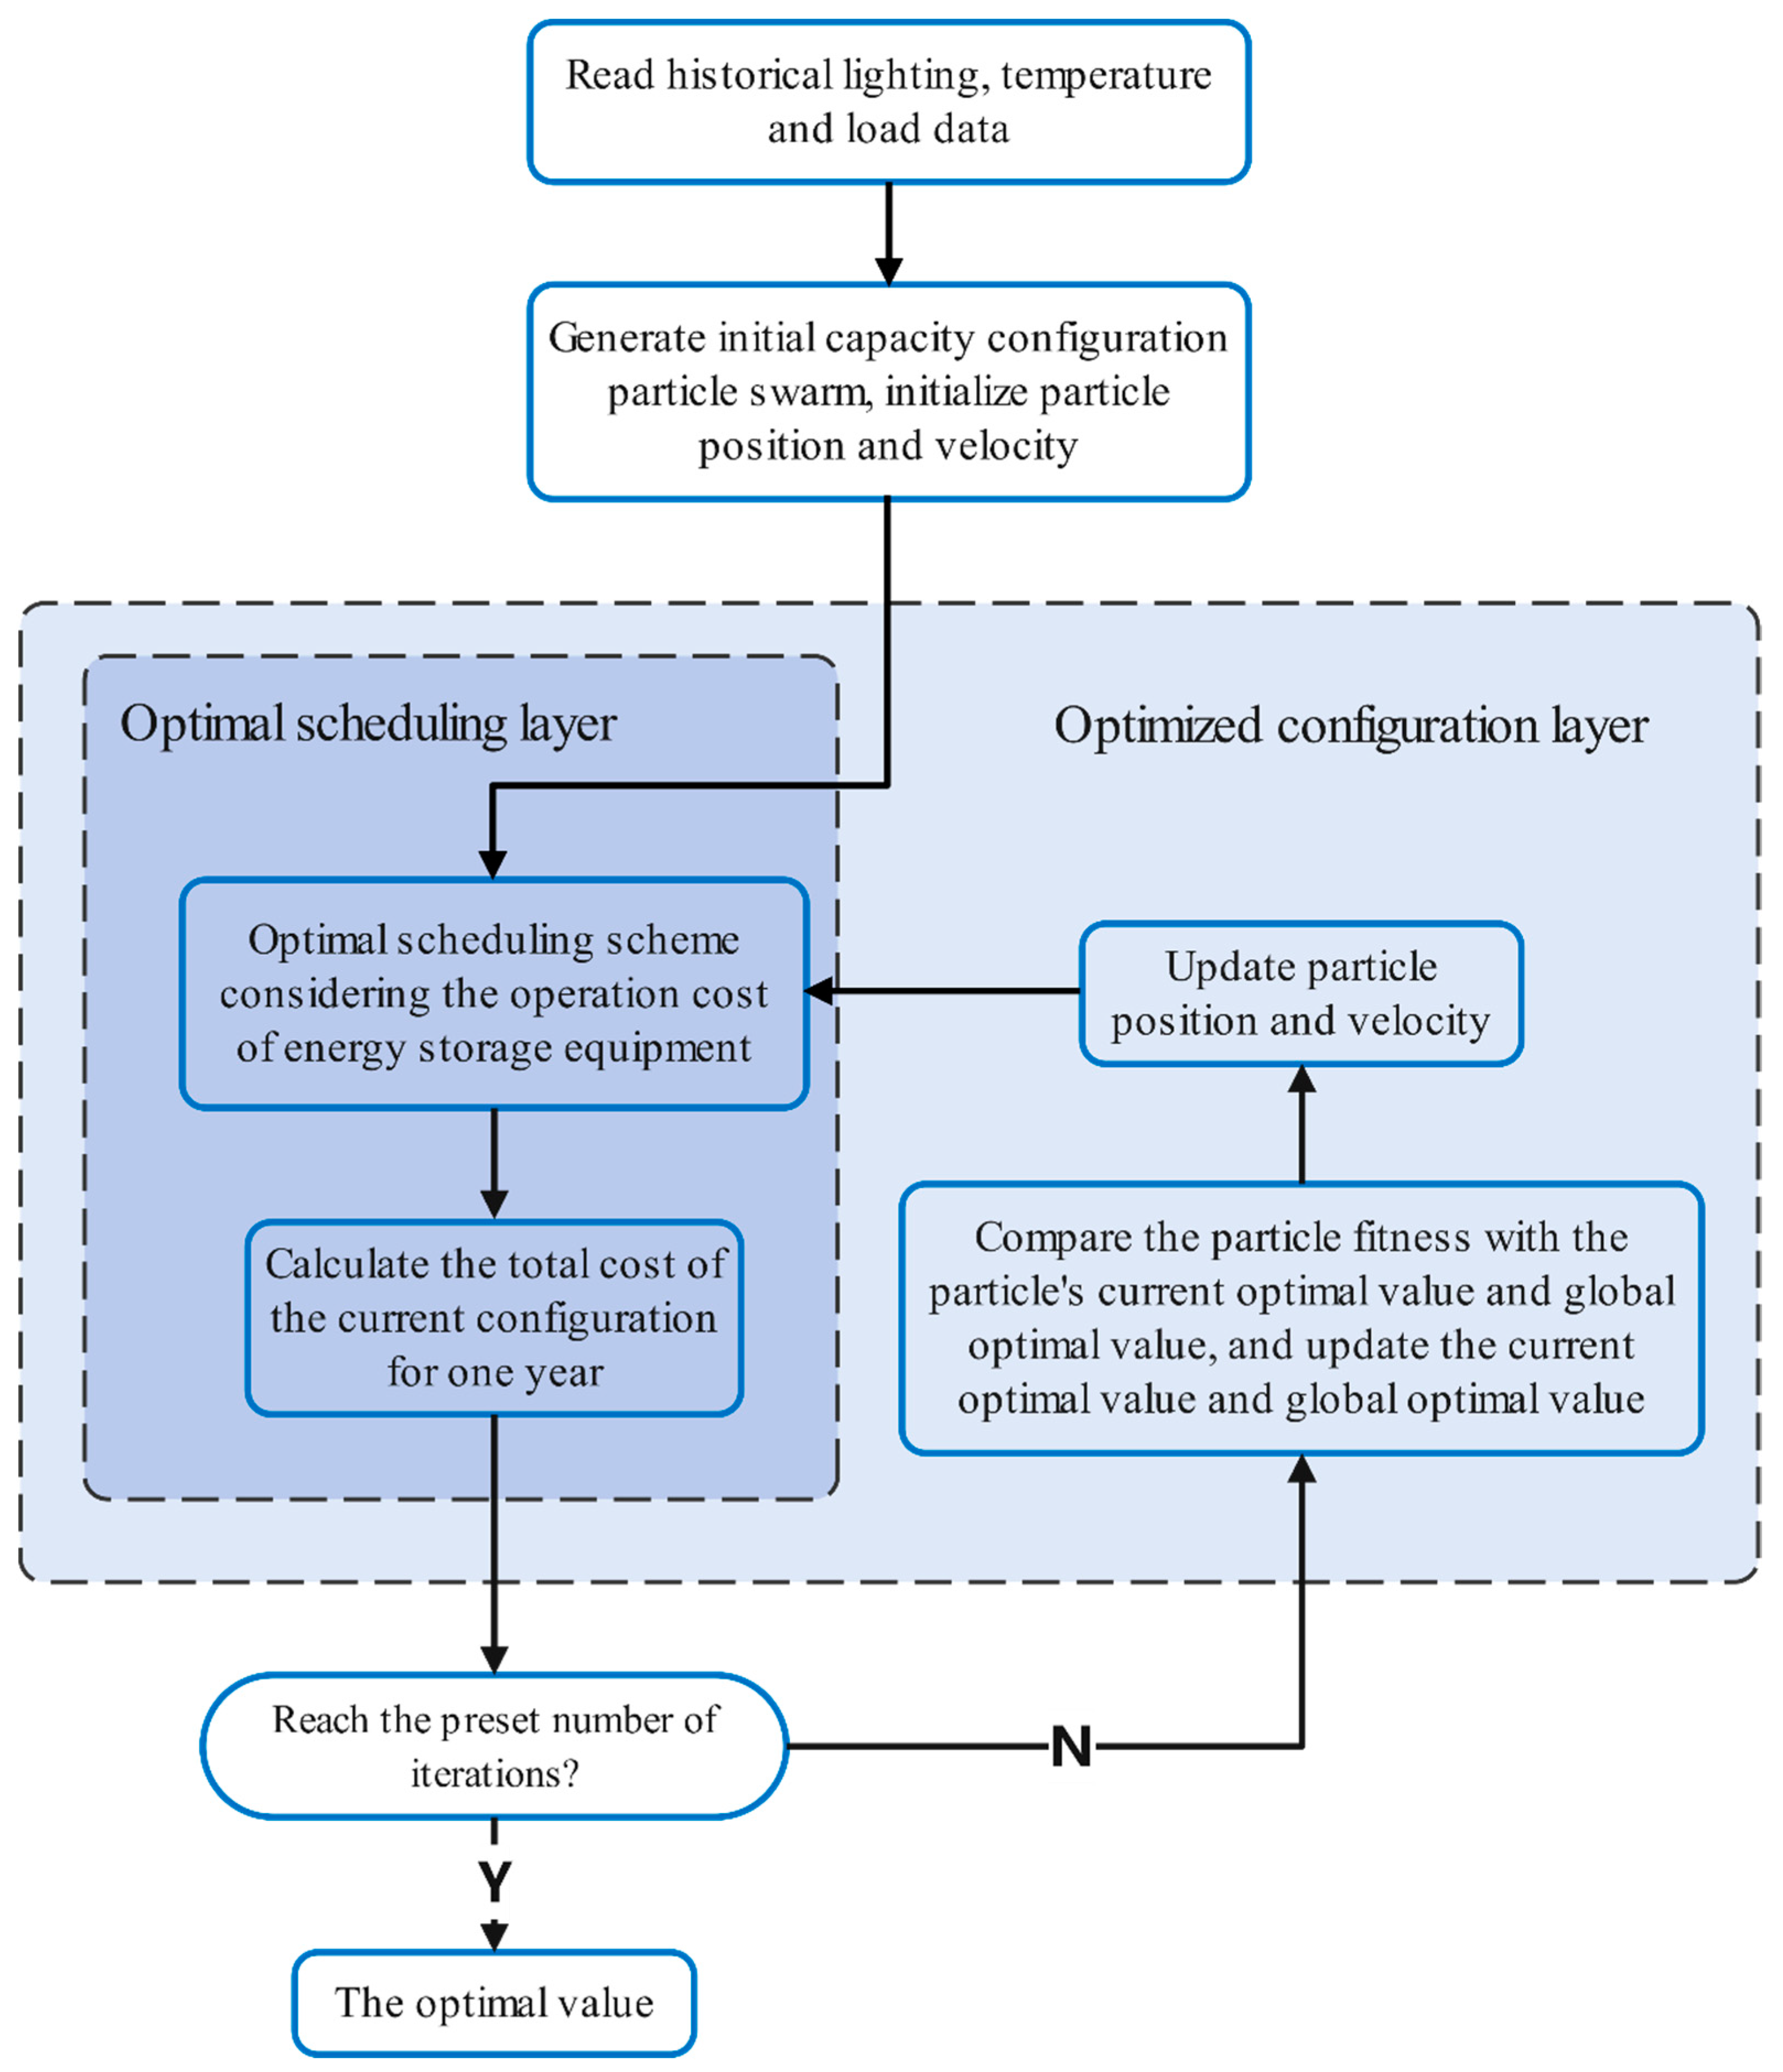
4.3. Optimal Allocation Algorithm for Source and Storage Capacity of Microgrid

The optimal configuration method process of the photovoltaic hydrogen zero carbon emission power supply microgrid is shown in Figure 4. The specific steps are as follows:
  • Read the light radiation intensity, temperature, load, simulation time and other data.
  • Generate the initial capacity configuration particle swarm. Each particle contains the capacity information of the photovoltaic, the battery and the hydrogen energy system; initialize the particle position and velocity.
  • Using the scheduling scheme shown in Figure 3, calculate the annual investment cost and annual operation cost of each particle.
  • Compare the particle fitness with the current optimal value and global optimal value of the particle and update the current optimal value and global optimal value. Update particle position and velocity.
  • Repeat steps 3–4 until the preset number of iterations is reached to obtain the final capacity optimization result.

5. Case Analysis

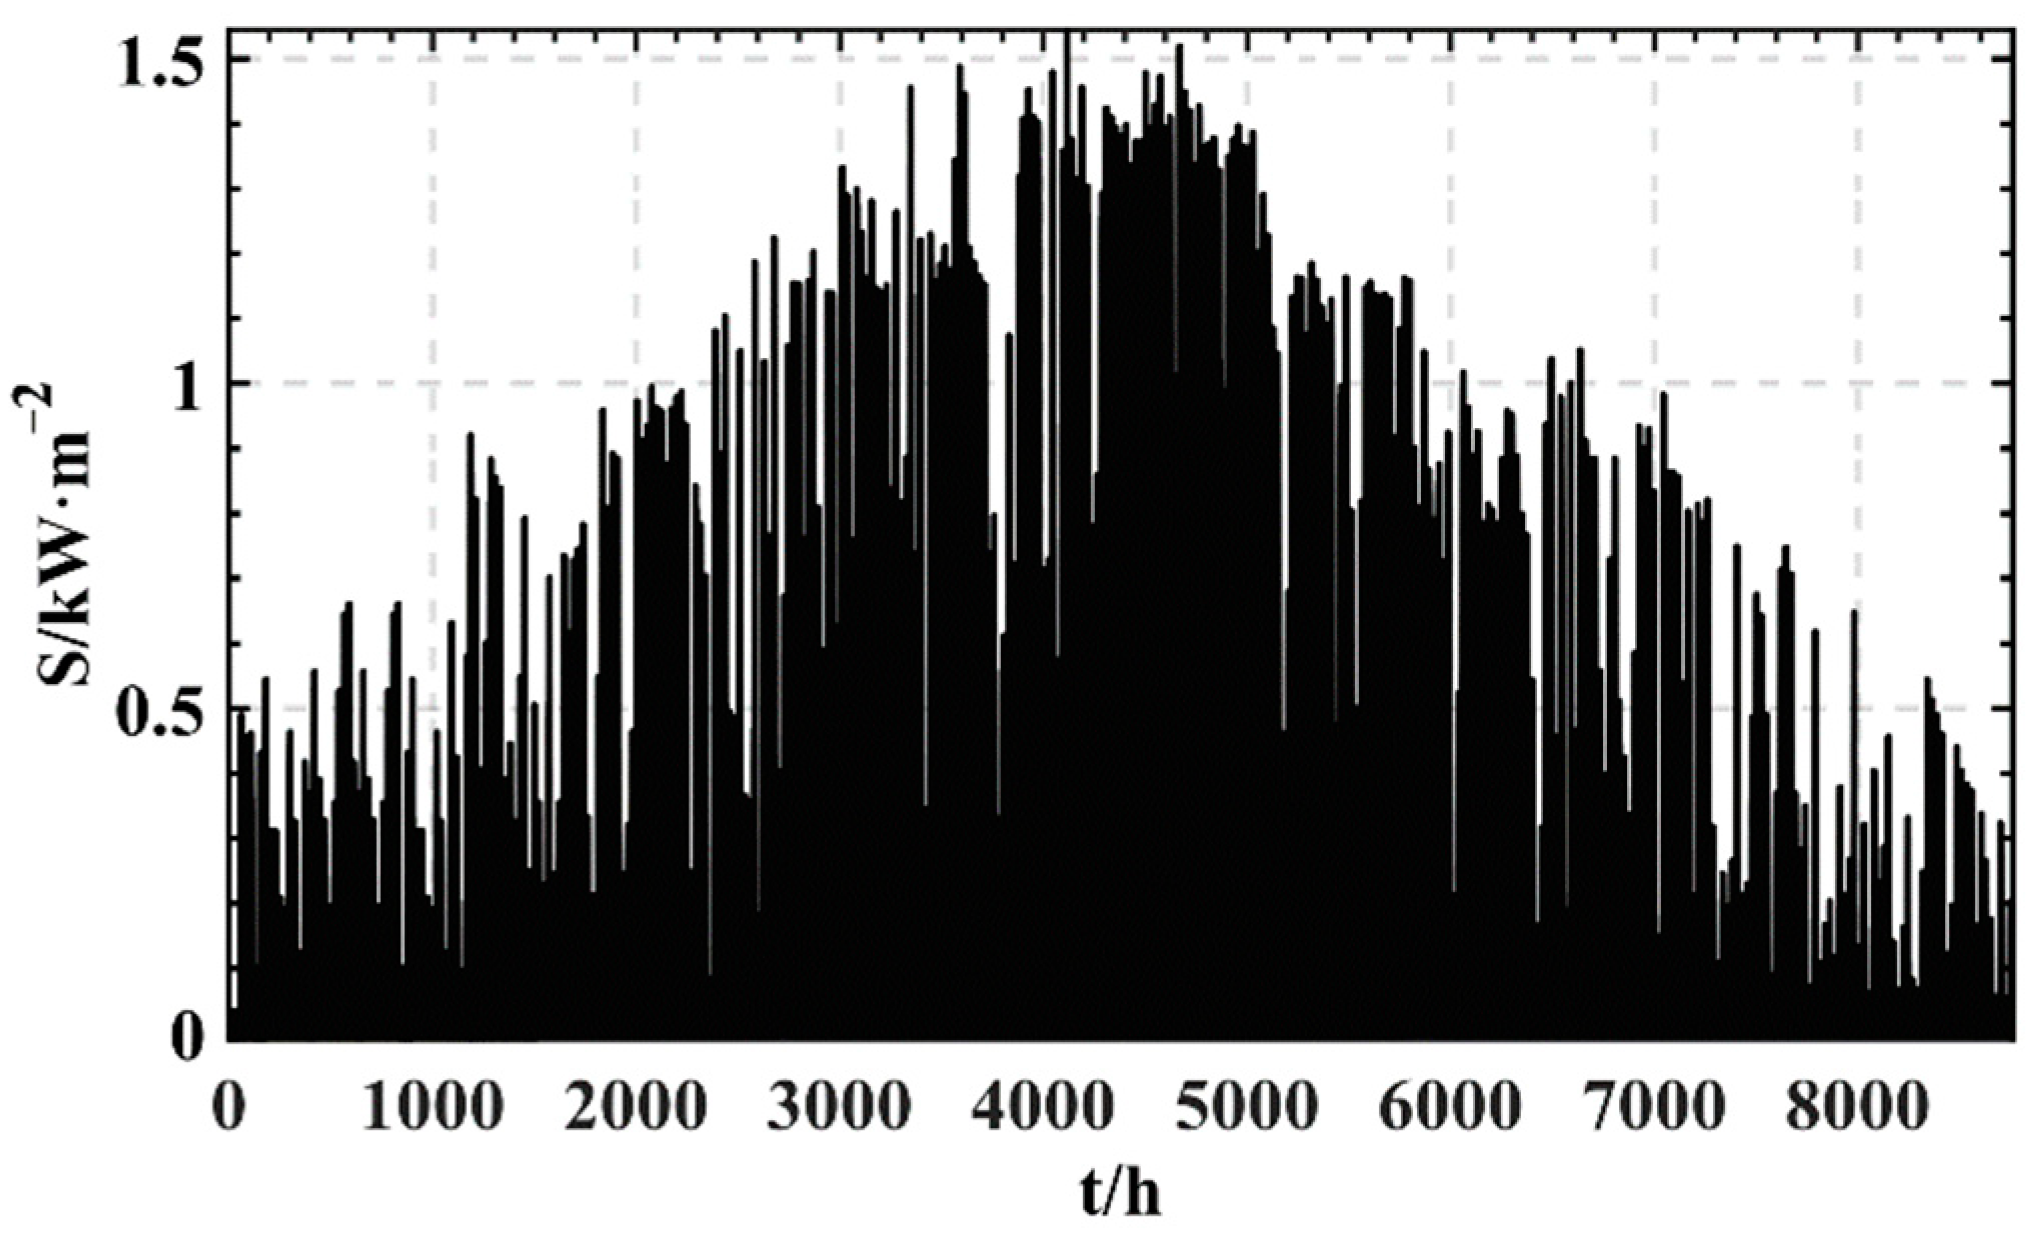
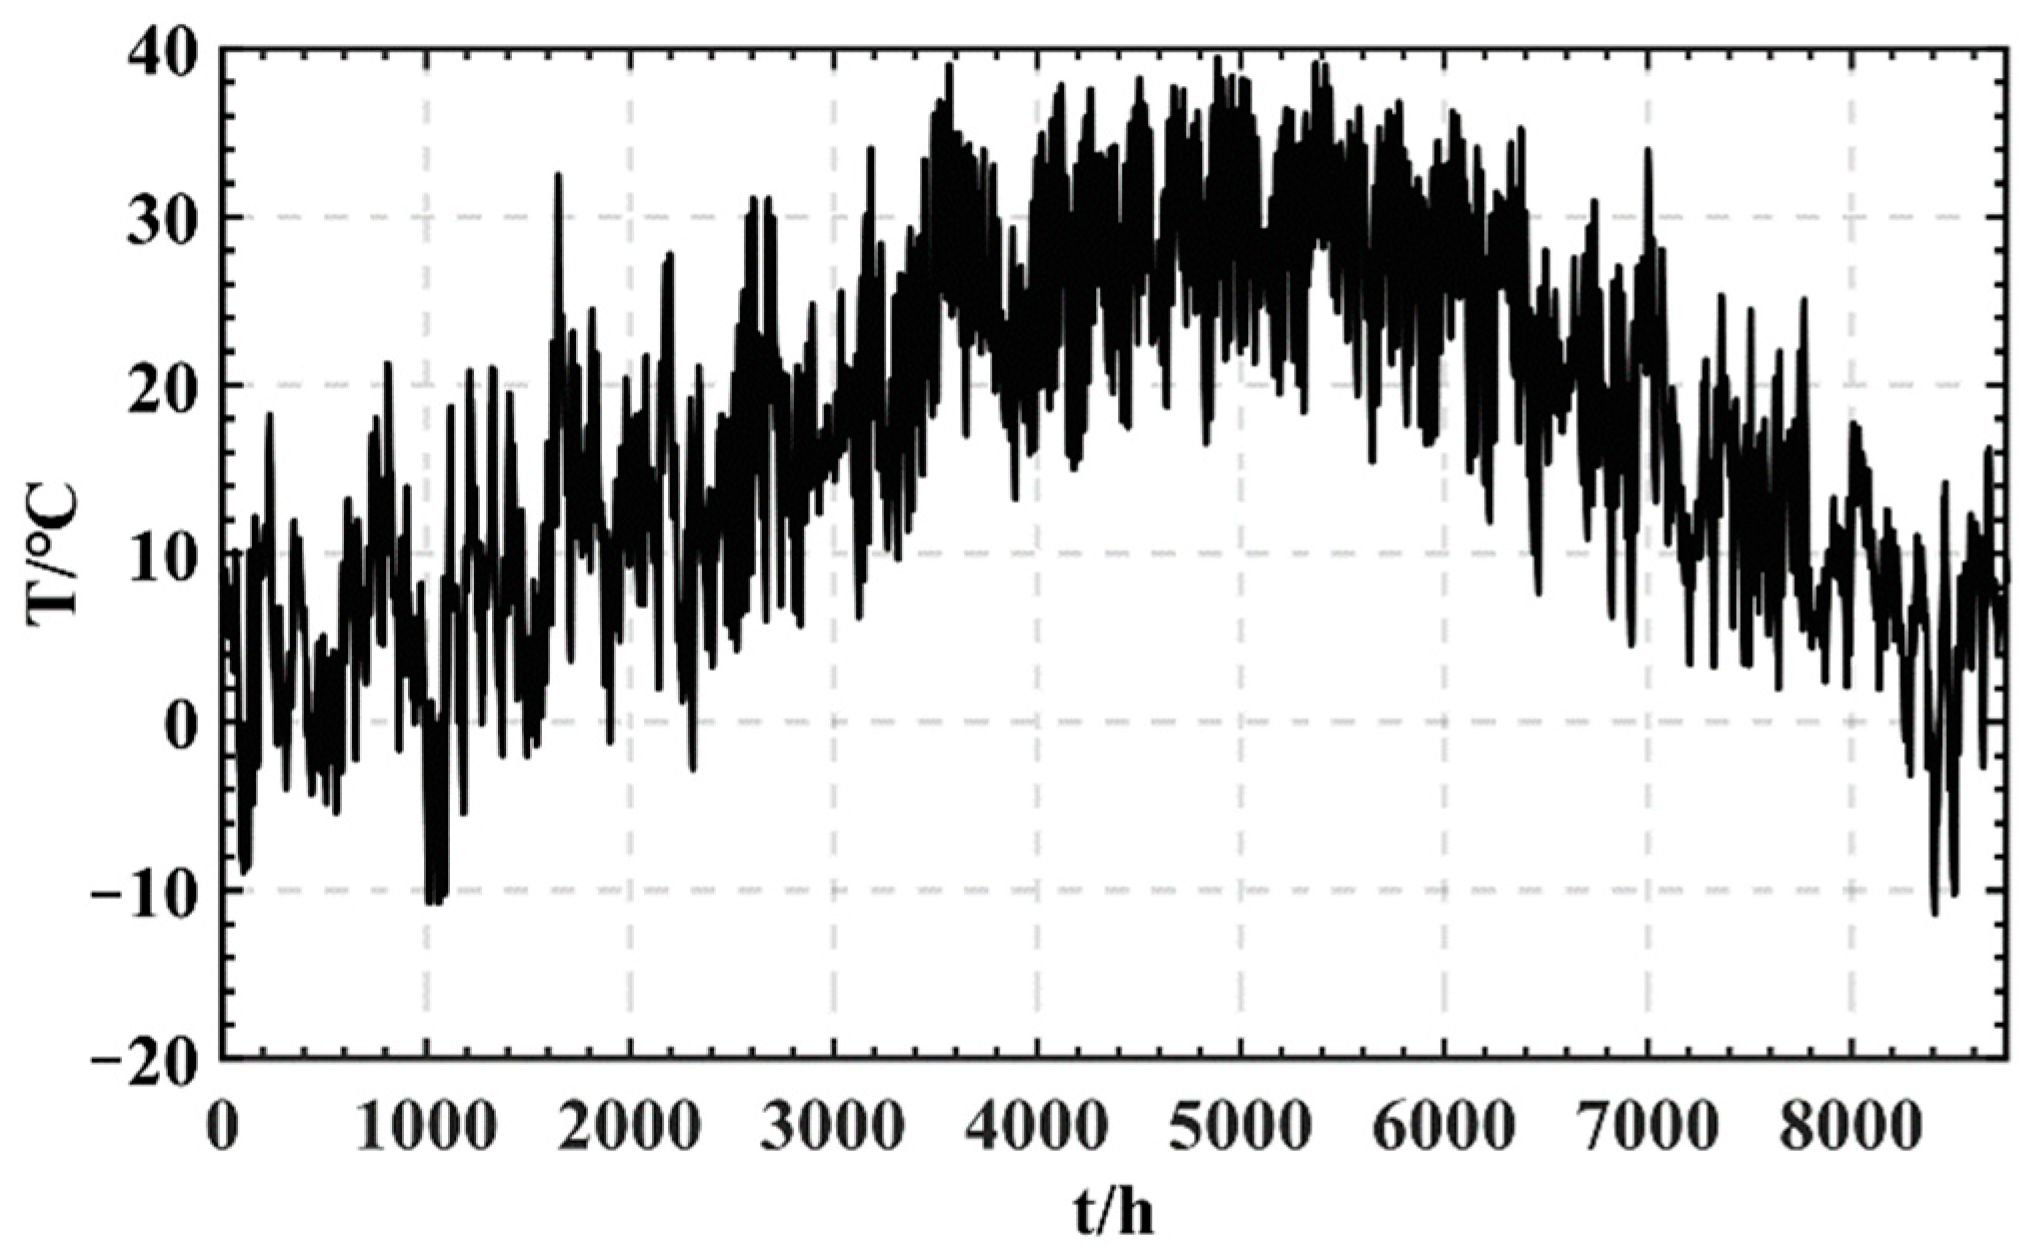
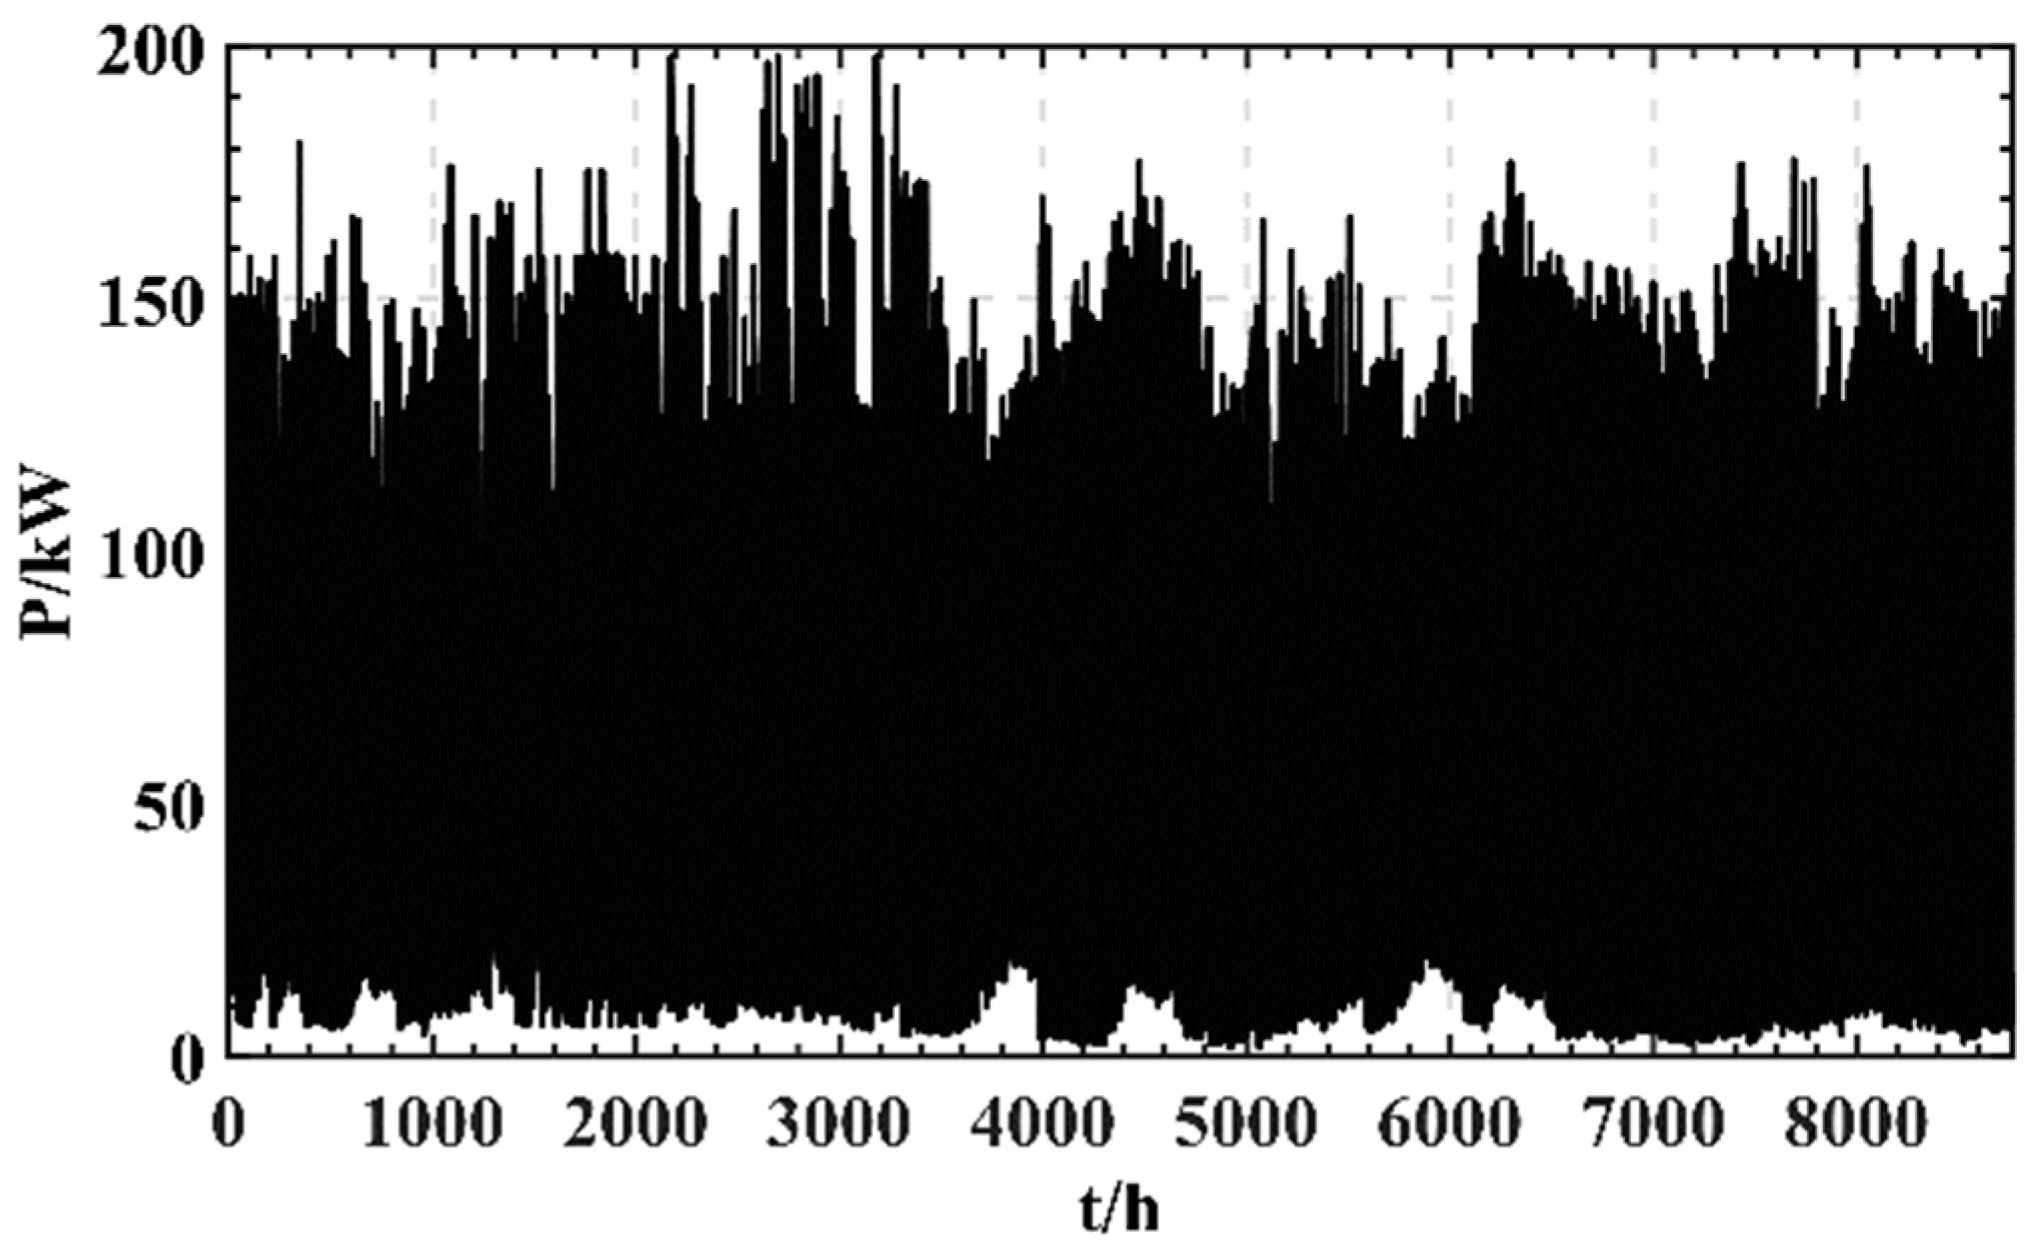
5.1. Simulation Scenario

This paper selects an actual industrial park in a region in Central China (30° N, 114° E) as the research object. The historical data of light radiation intensity, temperature and load in the past year are shown in Figure 5, Figure 6 and Figure 7.

5.2. Related Parameters

The unit cost parameters of relevant equipment are shown in Table 1.

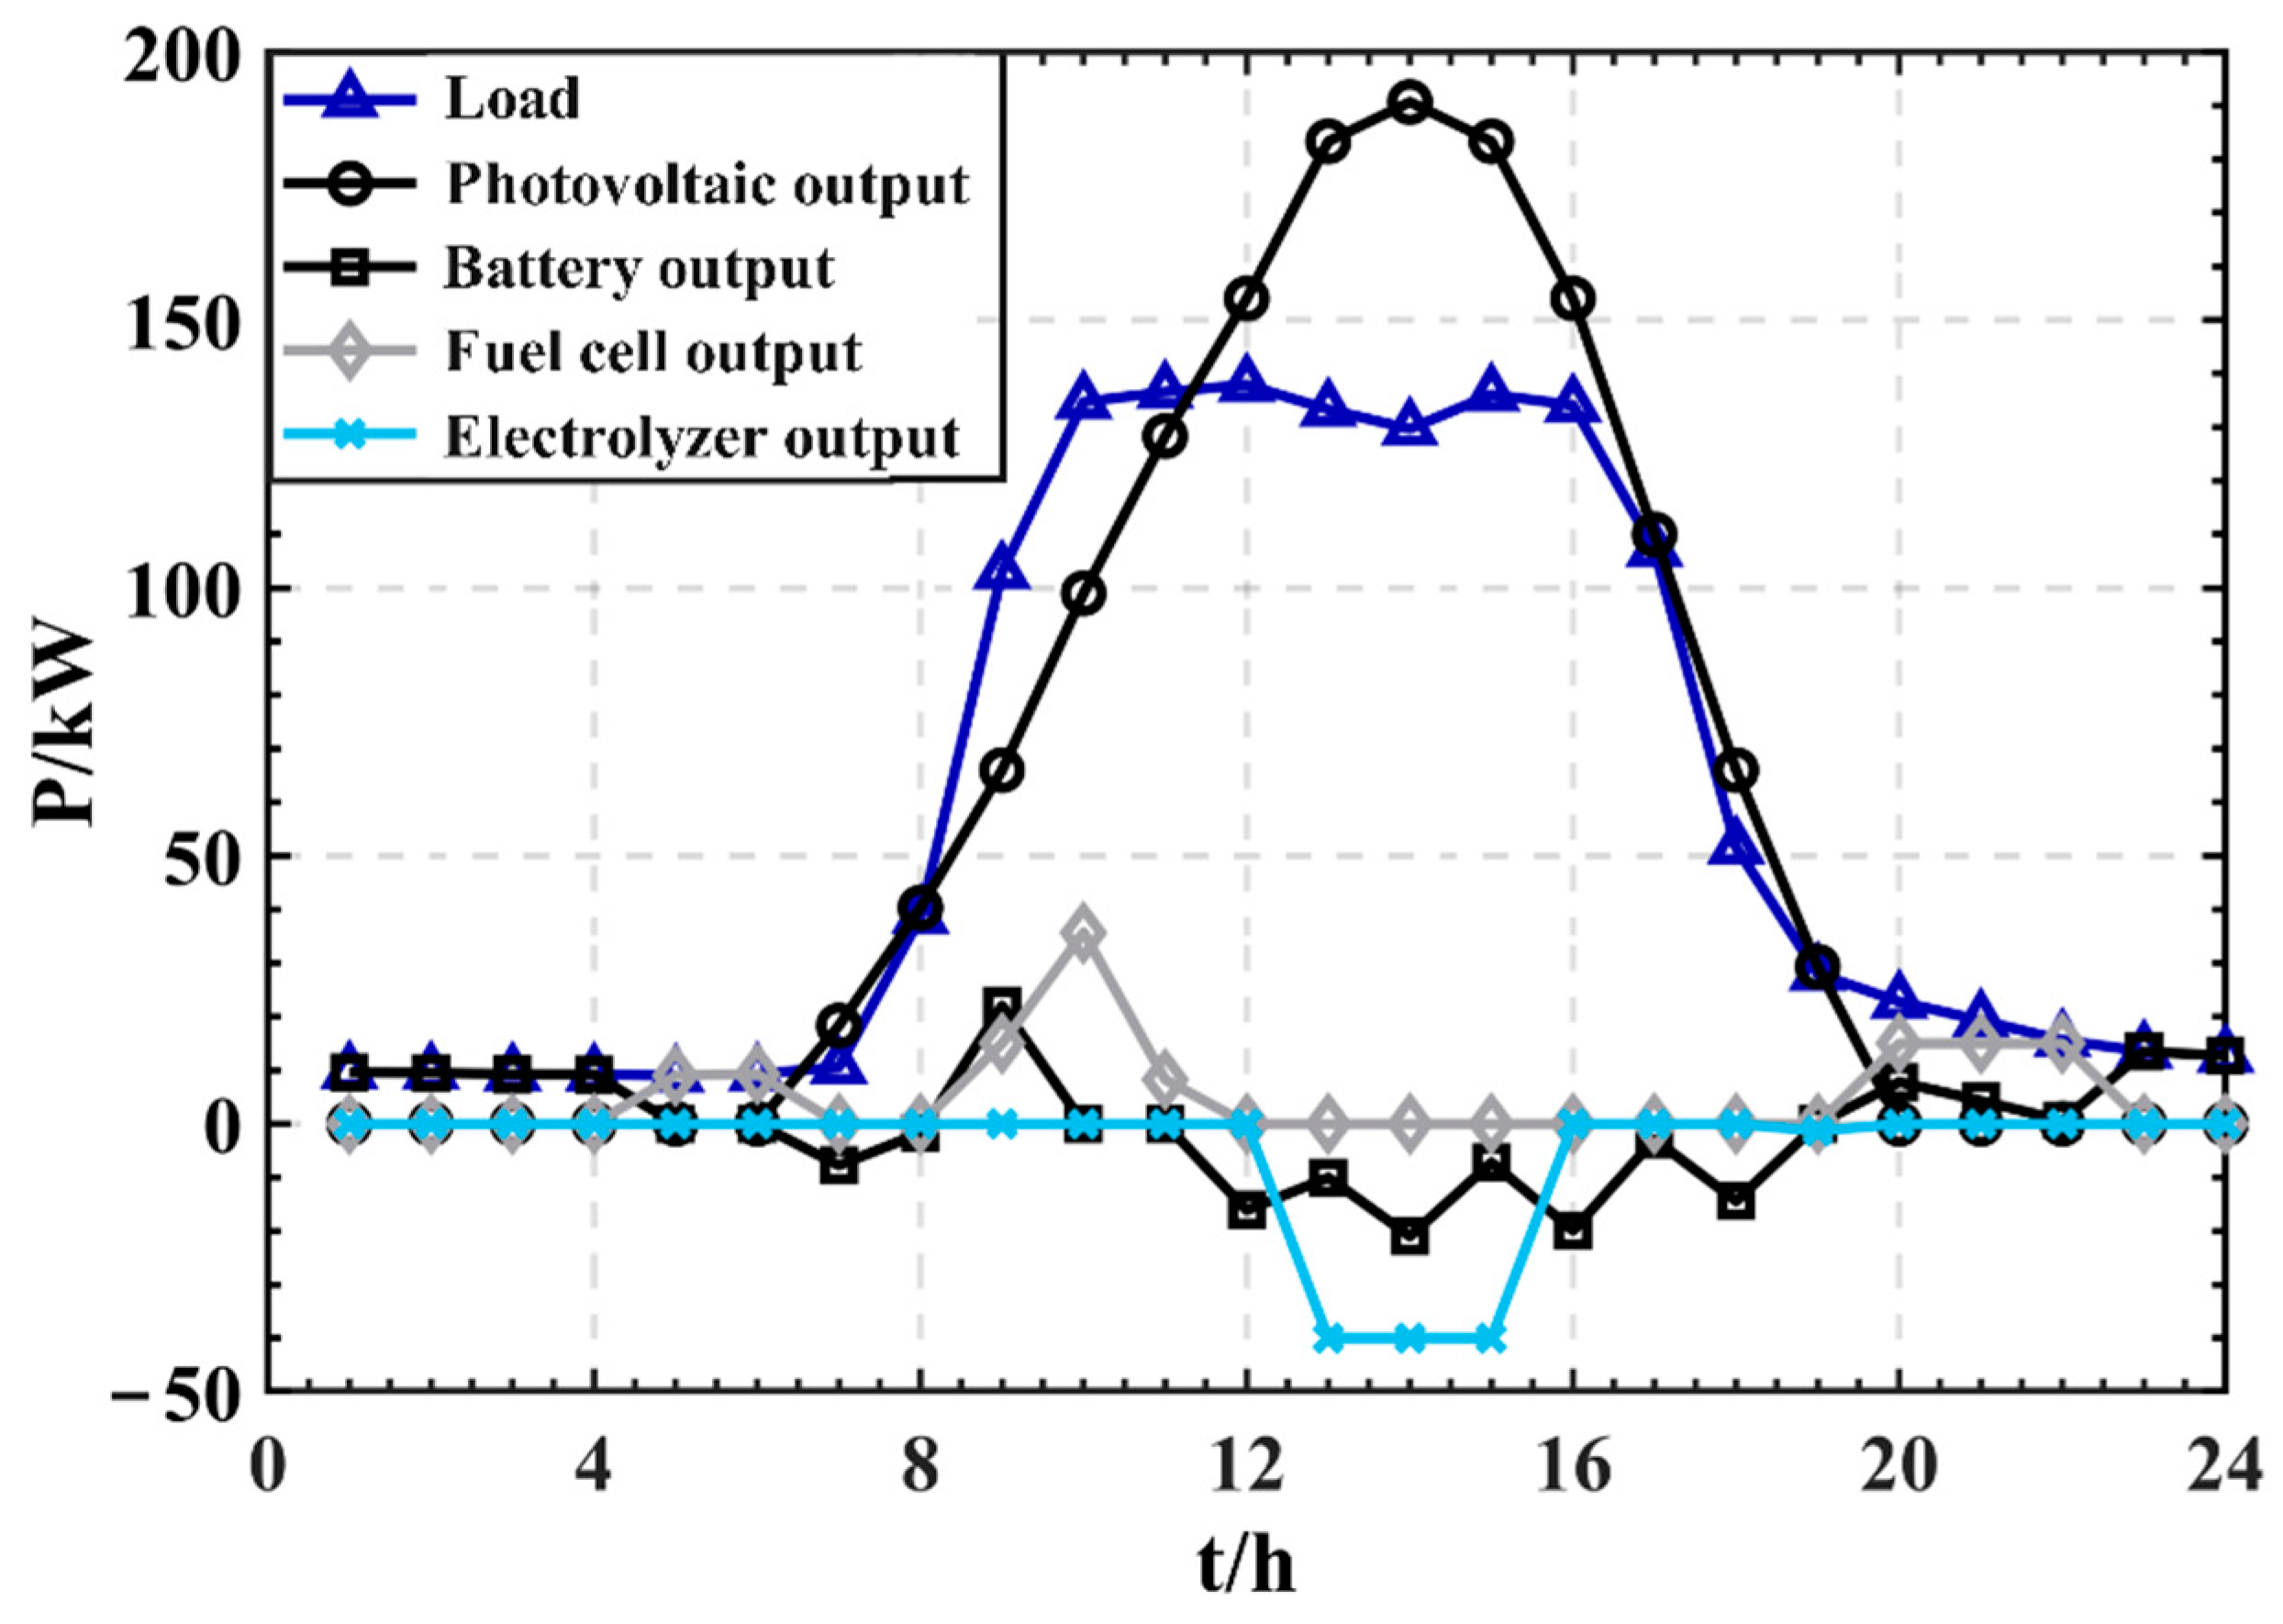
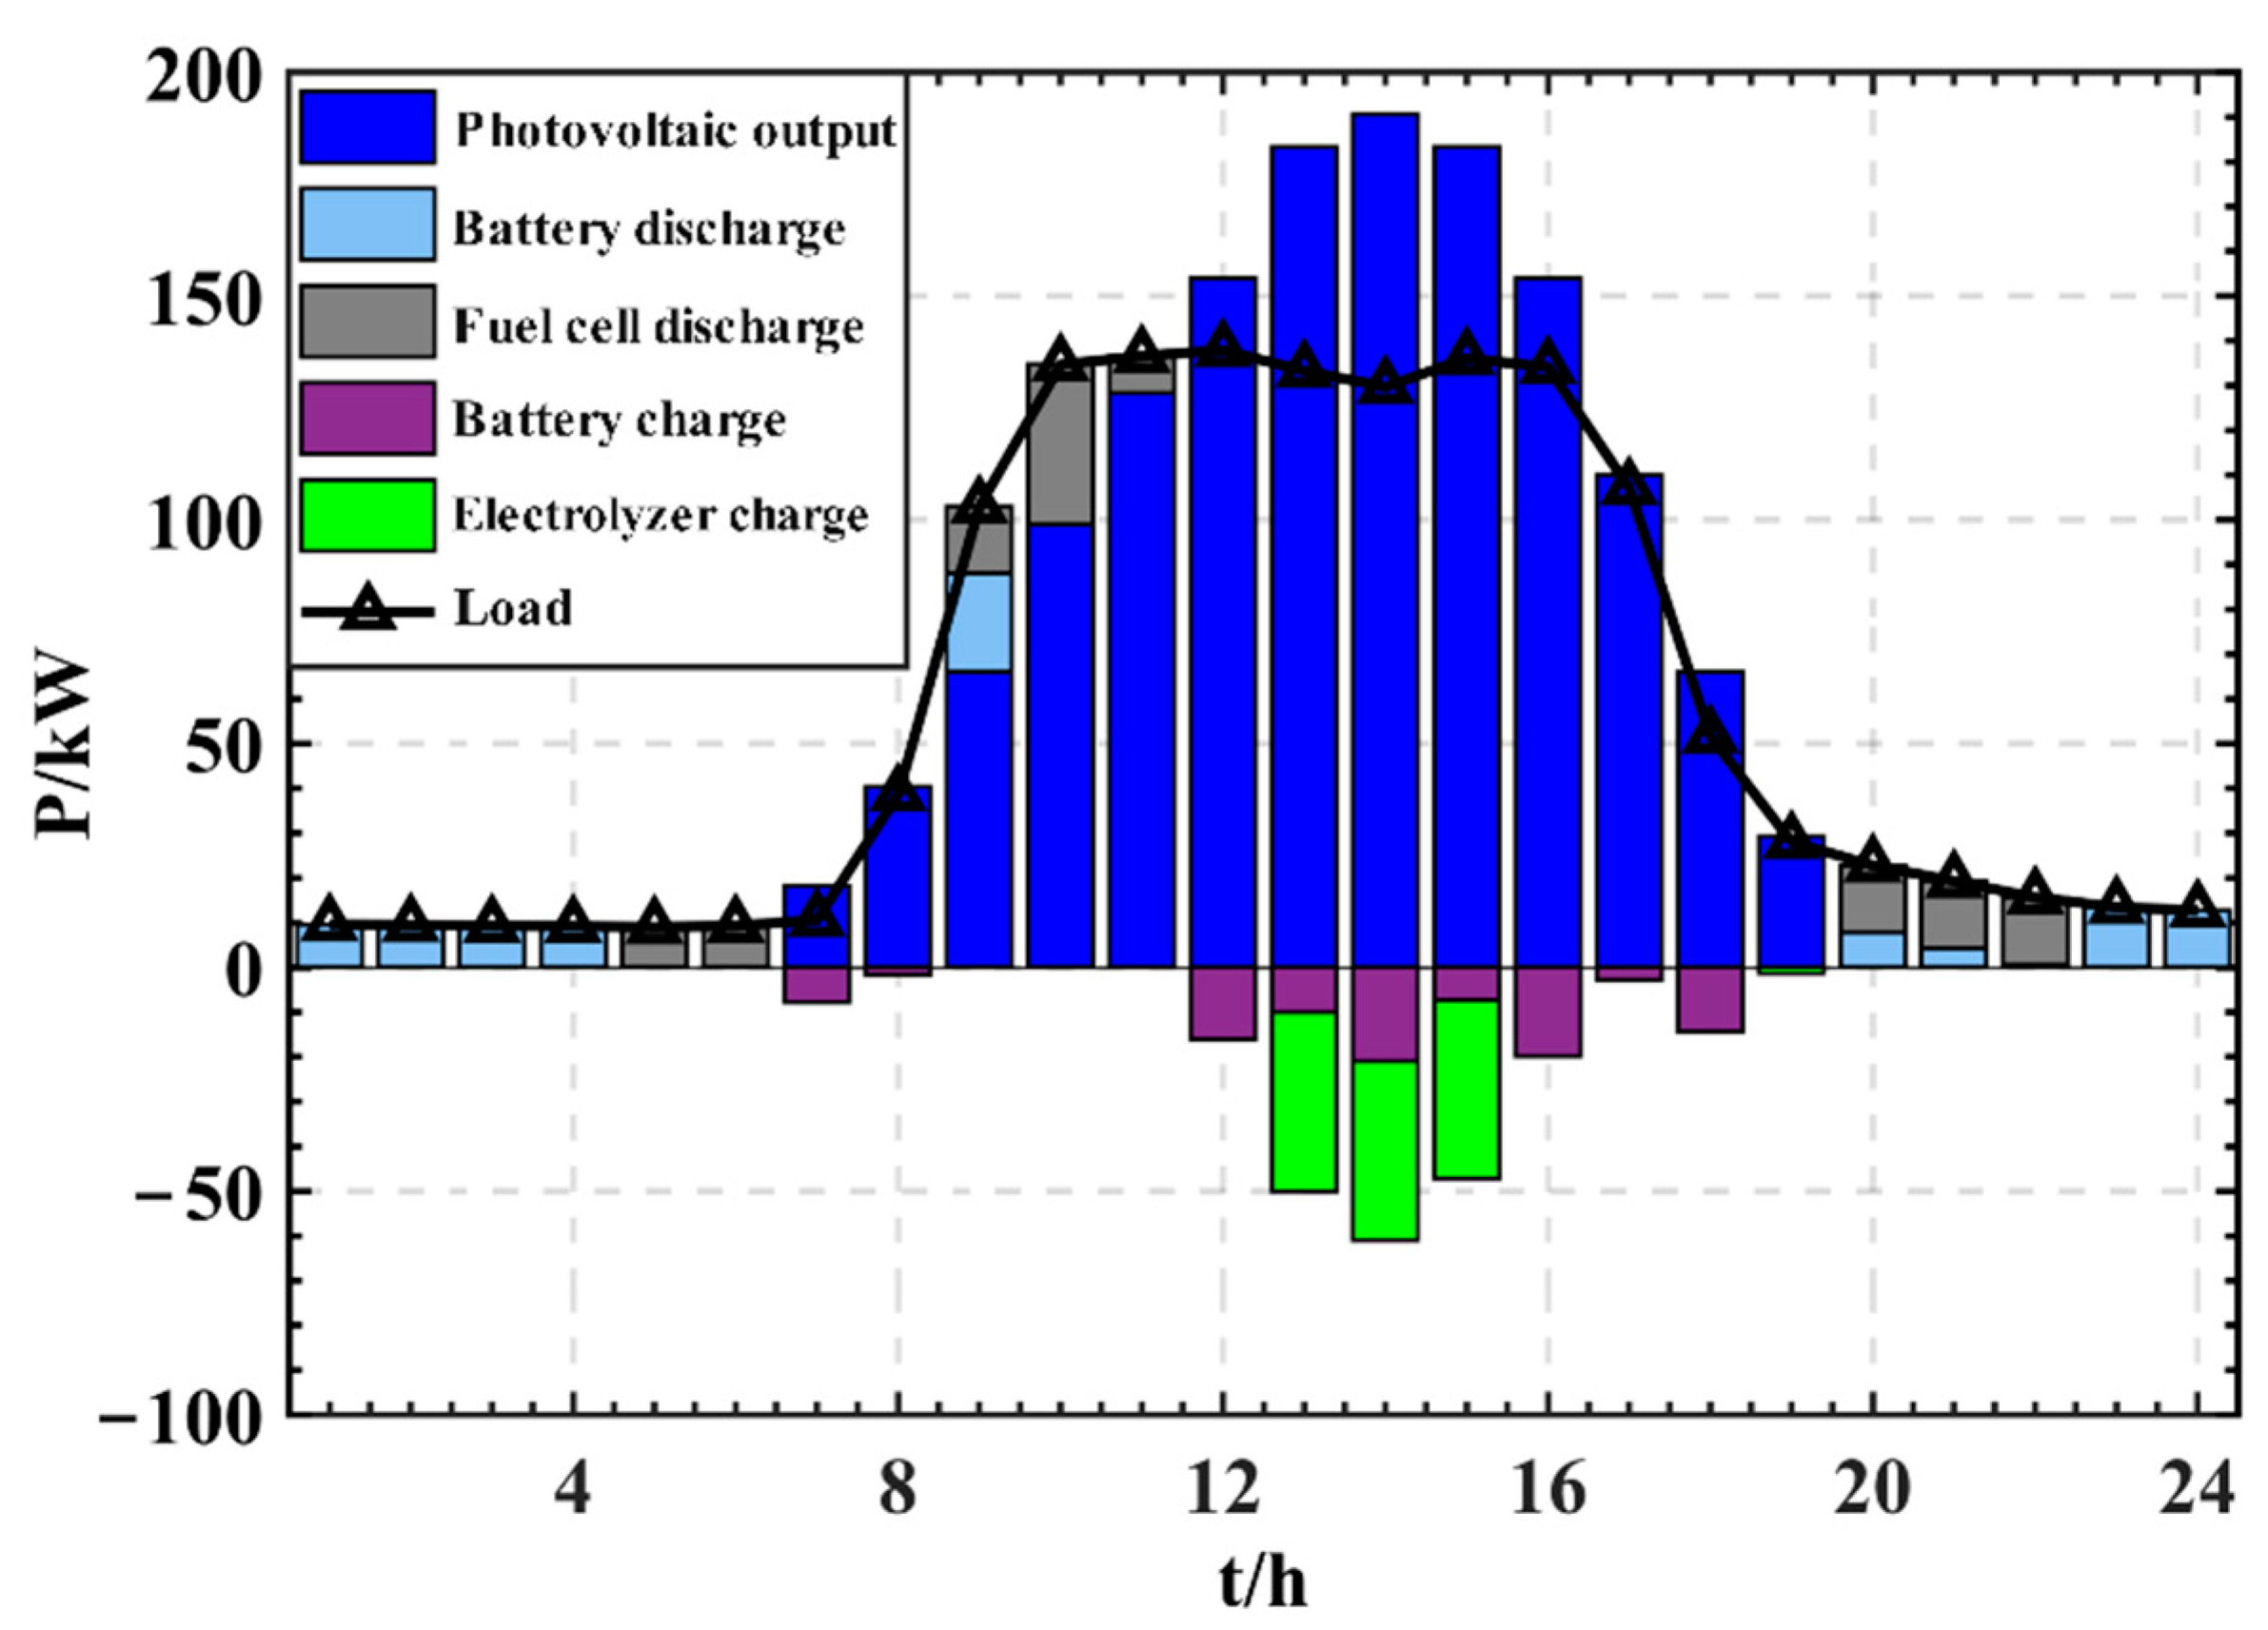
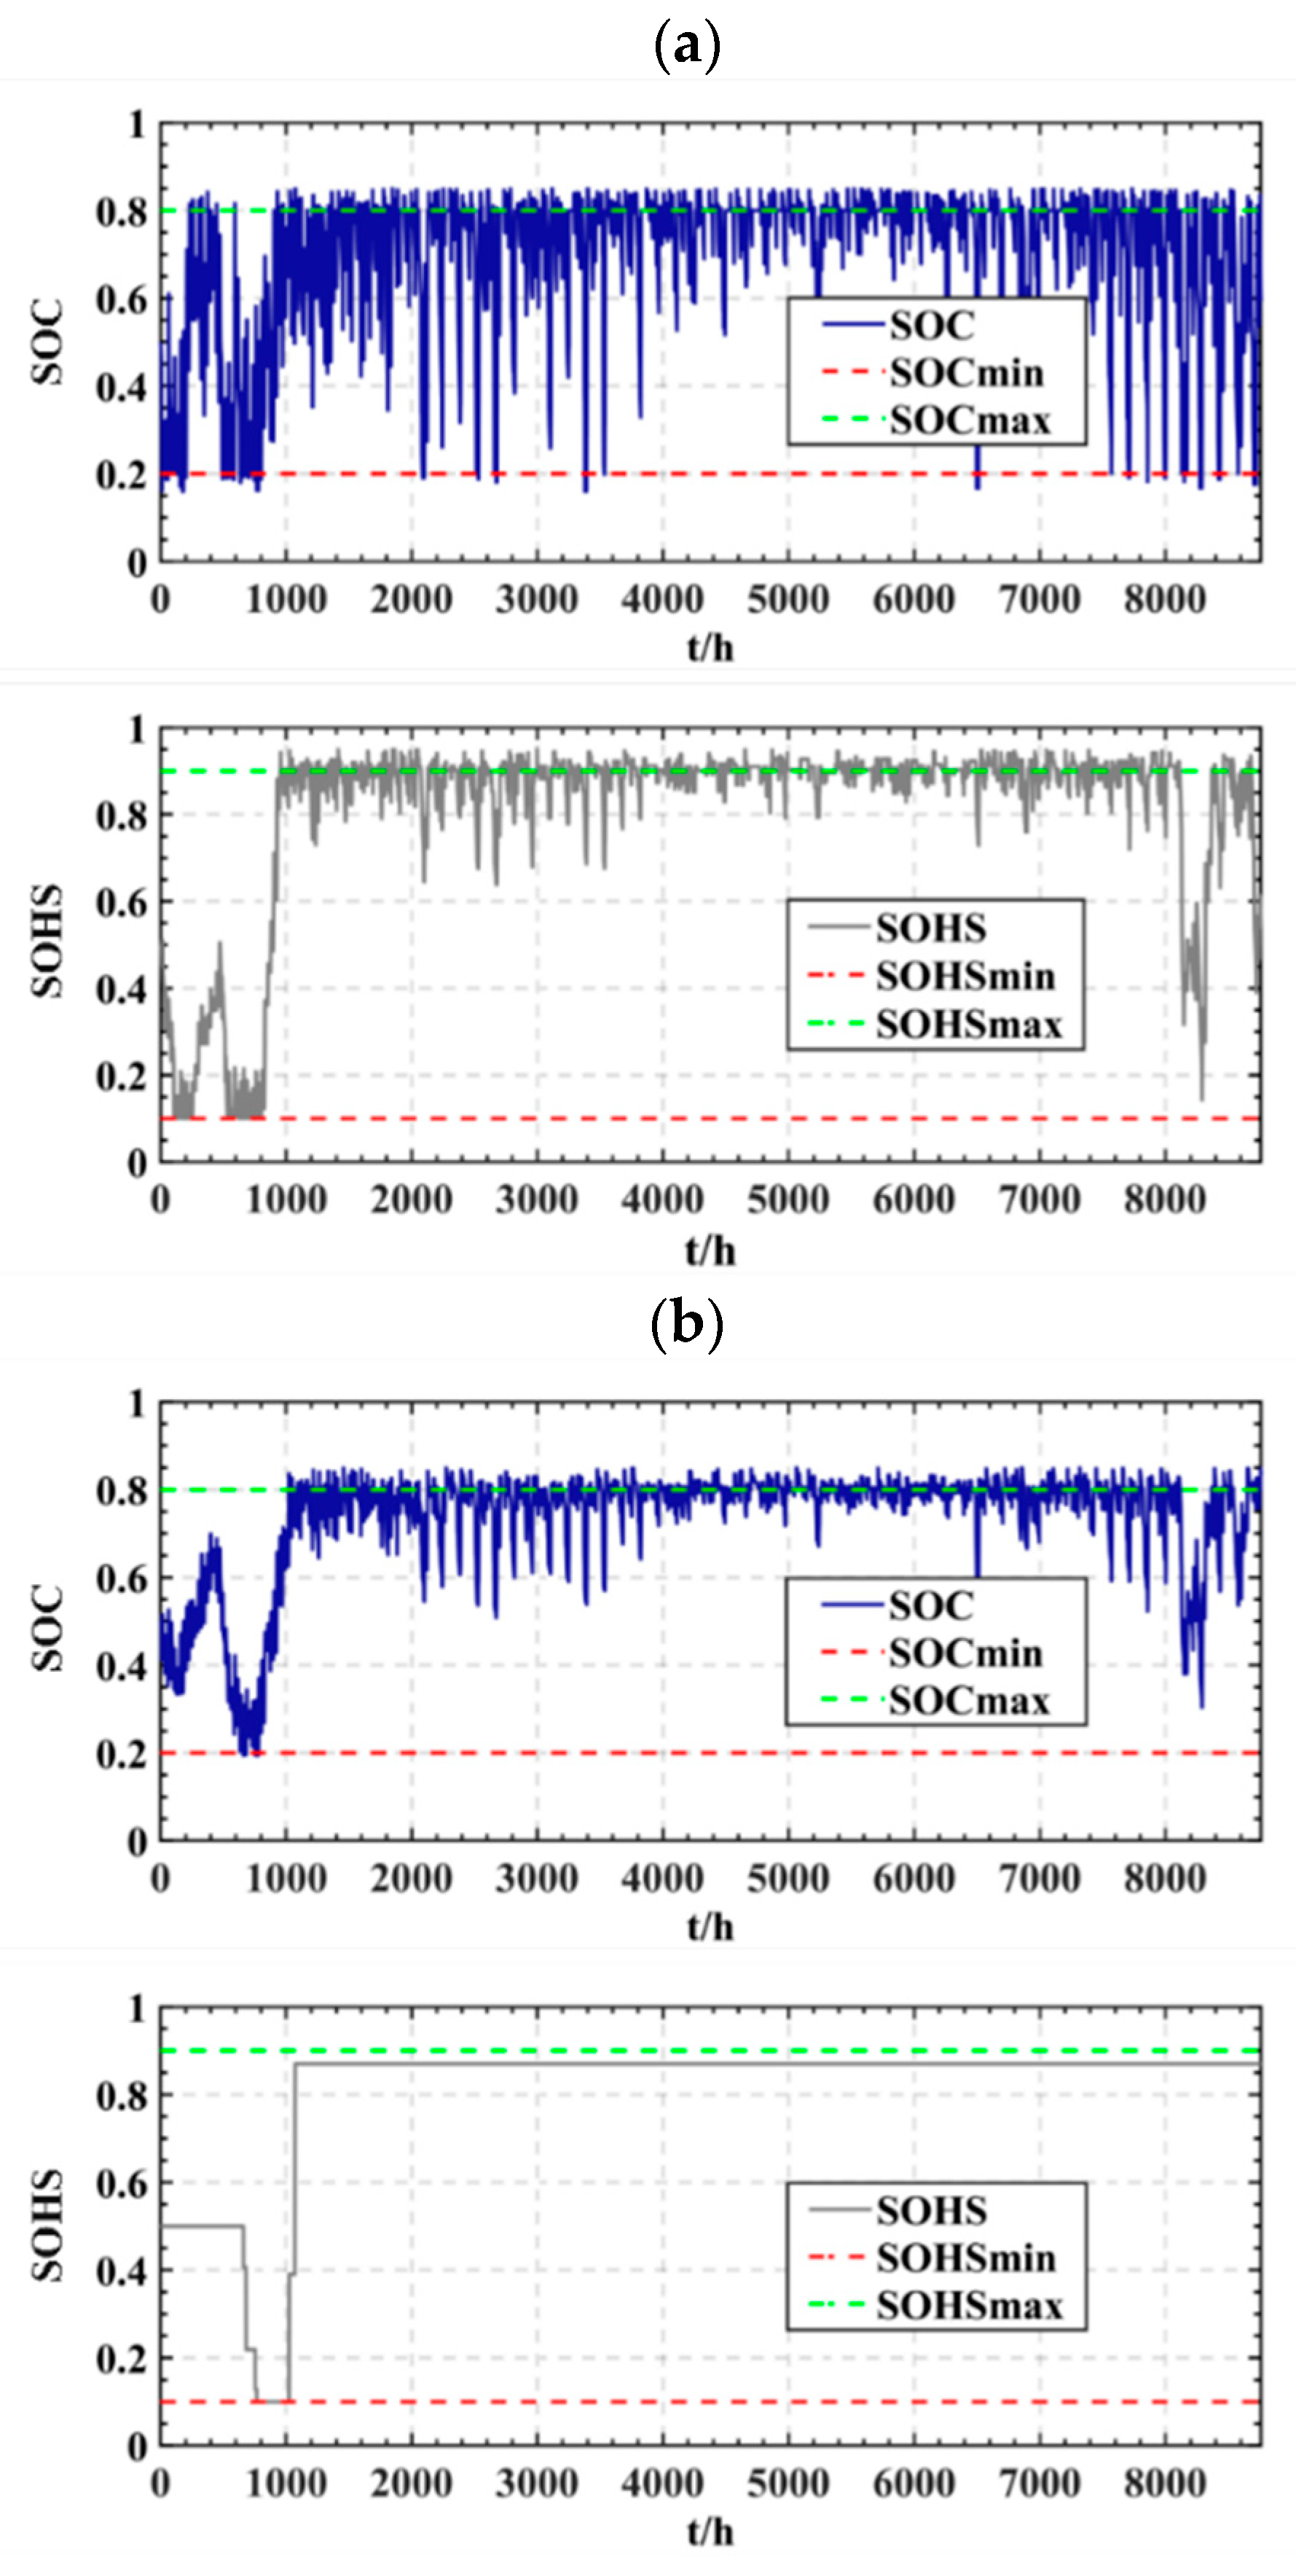
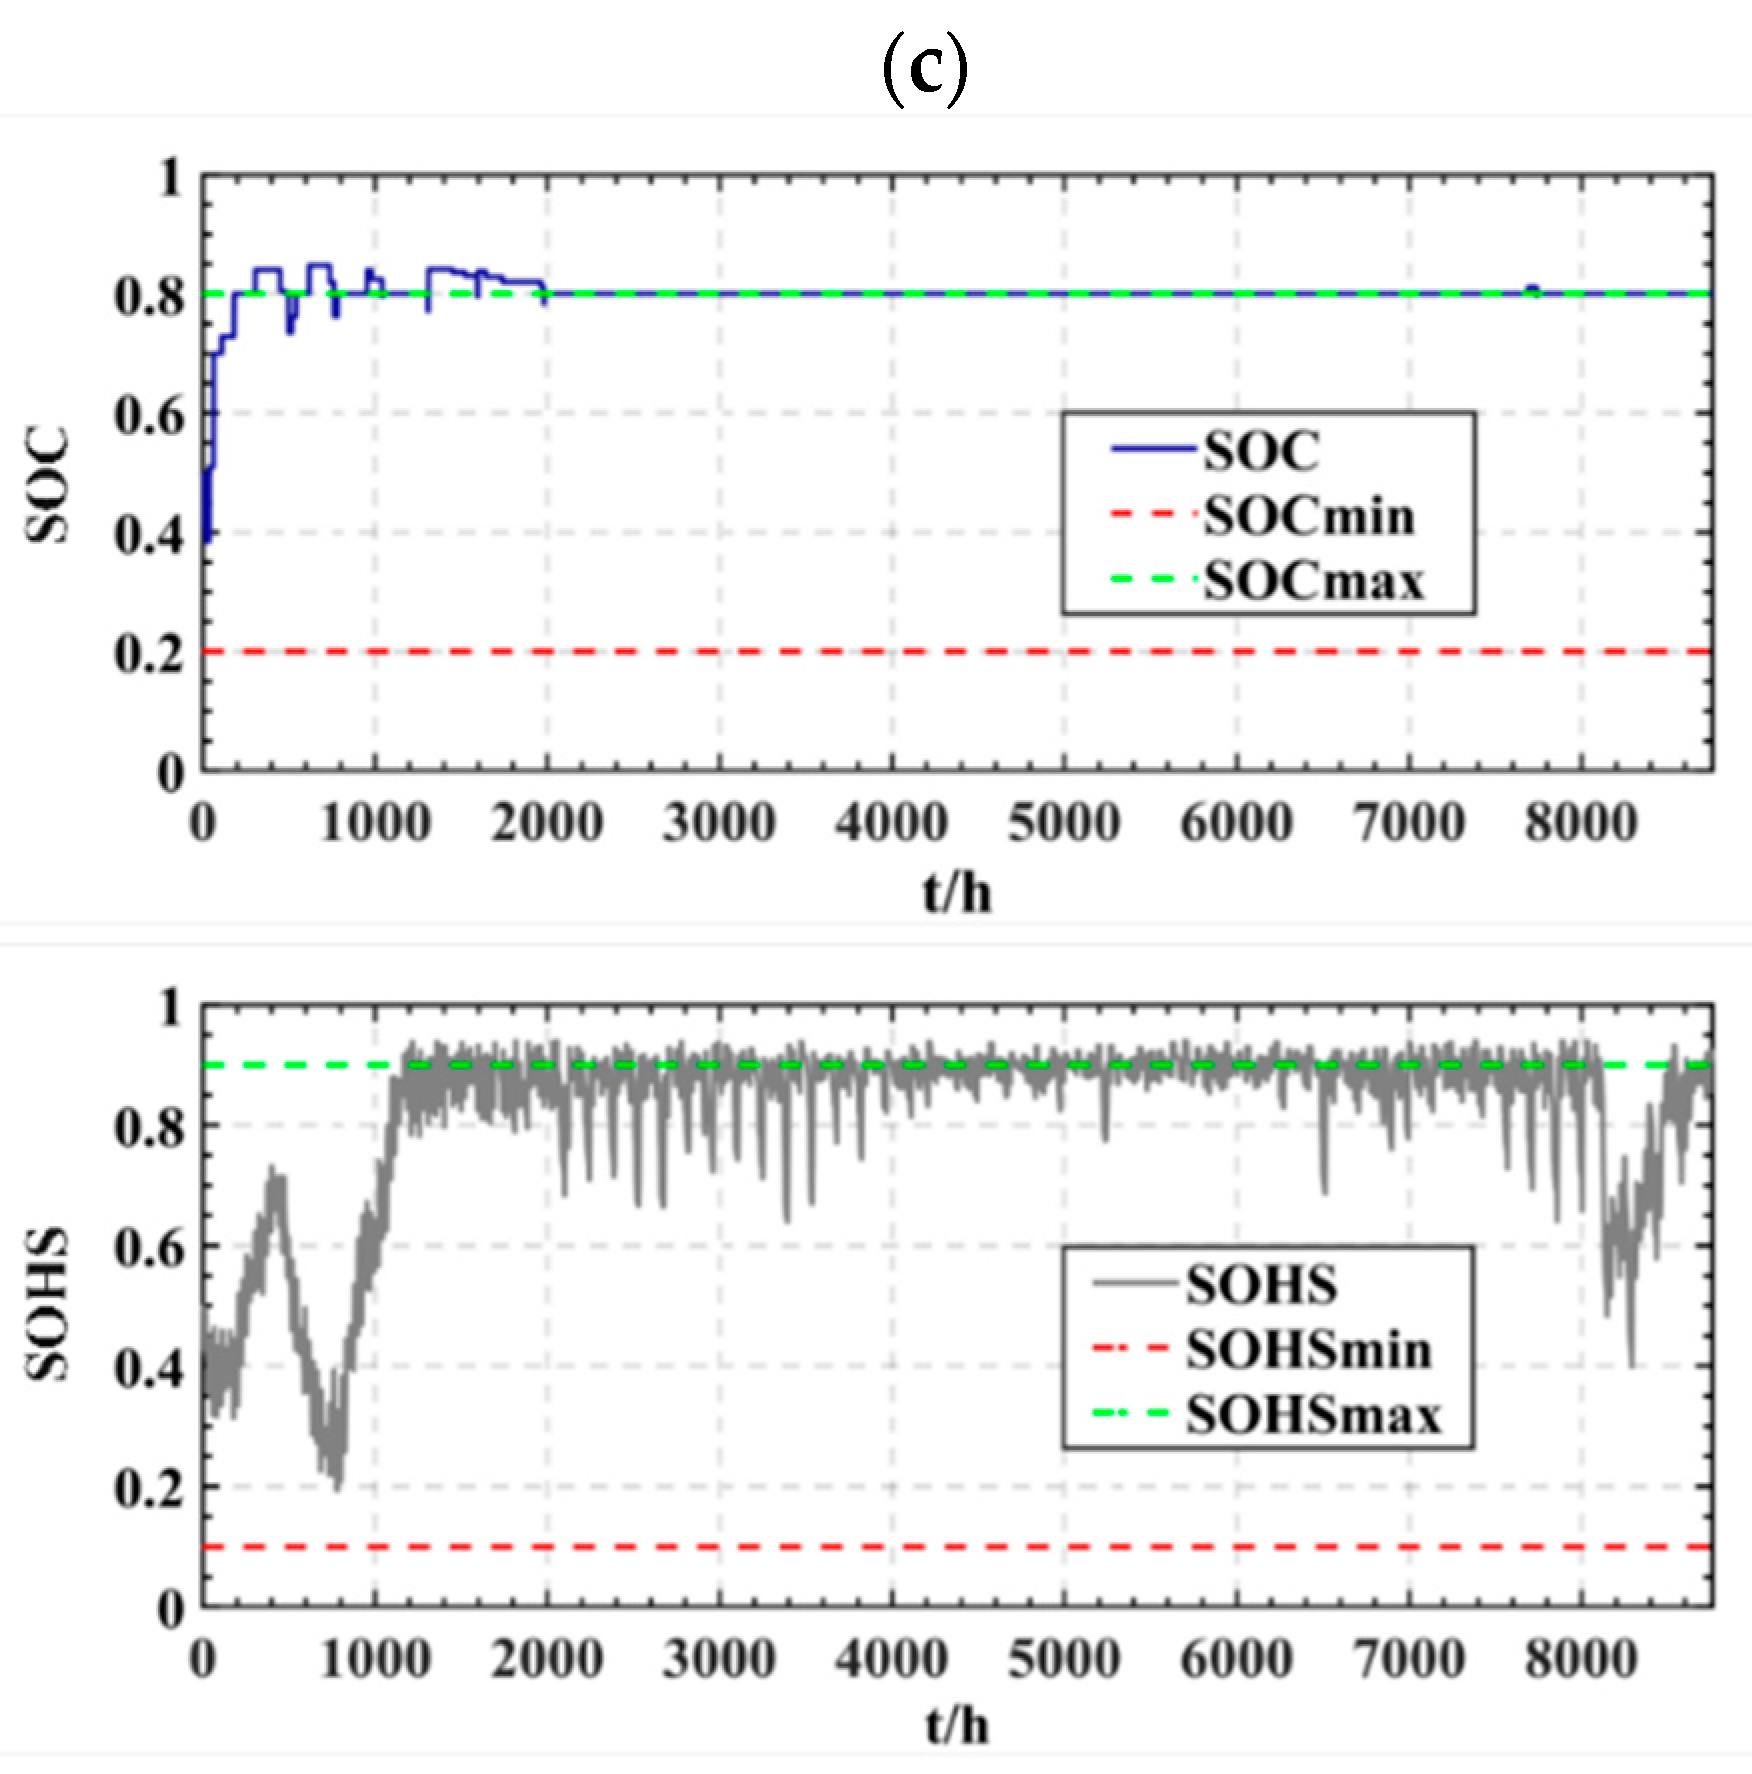
5.3. Result Analysis

According to the capacity optimization configuration algorithm proposed in this paper, we set the population particle number as 500, the number of iterations as 200, the simulation duration as 8760 h and the simulation step size as 1 h. The source storage configuration capacity results and objective function values are shown in Table 2. In addition to the scheduling strategy that considers the minimum operation cost of energy storage equipment proposed in this paper as Scheme 1, the scheduling strategies of battery priority and hydrogen energy system priority are selected as Scheme 2 and Scheme 3 for comparison. In Scheme 2, in the case of a power shortage or a power surplus, as long as the state of charge of the battery meets the conditional Equation (22), the battery will be discharged to fill the power shortage or charged to absorb the excess power. In the case of a power shortage or excess power in Scheme 3, as long as the hydrogen level of the hydrogen storage tank meets the conditional Equation (23), the fuel cell will generate electricity to fill the power shortage, or the electrolytic cell will work to absorb the excess power.
It can be seen from the results in the table that the capacity of the battery is larger in the battery priority scheduling scheme, while the capacity of the fuel cell and the alkaline electrolyzer is larger in the hydrogen energy storage system priority scheduling scheme. Comparing Schemes 1 to 3, it can be seen that the total cost of Scheme 1 is reduced by 9.8% and 25.1%, respectively, compared with Scheme 2 and Scheme 3. The optimal allocation scheme obtained by optimizing the scheduling mode of energy storage units brings significant economic benefits.
From the evaluation indexes, the load loss probability of this scheme is 0, which is better than 0.017% and 0.026% of the other two dispatching schemes; The renewable energy utilization rates of the three dispatching schemes are 68.1%, 62.4% and 59.3%, respectively. The reason is that the power interaction with the large power grid is not set in this paper. Therefore, during the peak period of photovoltaic output in summer, the hydrogen storage and battery energy storage are maintained at the maximum capacity, and excess energy can no longer be stored. In the future, when excess energy is considered, it can be converted into hydrogen and sold to the market to improve the utilization rate of renewable energy. Because the energy of the three schemes comes from the photovoltaic array, the penetration rate of renewable energy is 100%.
Figure 8a–c show the annual energy storage changes of the storage battery and the hydrogen storage tank in Schemes 1 to 3, respectively. It can be seen that the hydrogen energy system and batteries in the dispatching scheme of this paper are used throughout the year. The battery priority scheduling scheme only uses the fuel cell when the storage capacity of the battery is insufficient from winter to spring, while the battery supplies power alone most of the time. Similarly, in the scheduling scheme with priority of the hydrogen energy system, the hydrogen energy system works in summer and autumn when photovoltaic energy is sufficient, and the utilization rate of the equipment is low.
To better analyze the output of each element and verify the effectiveness of the scheduling method proposed in this paper, we selected a certain day in August to make the output curve of each element and the system power balance during the day, as shown in Figure 9 and Figure 10.
It can be seen that at night, the small load is met by the output of the battery. The load surged after 8 a.m. when the photovoltaic output was not enough to meet the load demand, so the hydrogen fuel cell was put into use. At noon, the photovoltaic output exceeded the load demand. At this time, the electrolysis started to work to absorb the excess power, store it in the form of hydrogen energy, and charge the battery at the same time; From 4 p.m. to 10 p.m., the photovoltaic array no longer provides electric energy, and relatively large loads are powered by the hydrogen fuel cells. From 11 p.m. to 7 a.m. the next day, relatively small loads are powered by batteries.

6. Conclusions

To effectively deal with the problem of high carbon emissions from power generation in the process of carbon peak and carbon neutralization, this paper proposes an optimal method of source and storage capacity of a PV-hydrogen zero carbon emission microgrid and verifies the effectiveness of this method through a simulation.
The method uses a PV-hydrogen zero carbon emission microgrid that includes a photovoltaic array, a hydrogen fuel cell, an electrolytic cell, a hydrogen storage tank and a battery. This proposed method adopts the light, hydrogen and electricity coupling utilization mode with hydrogen energy storage and power generation as the core. The hydrogen-based energy system replaces the carbon-based energy system to realize zero carbon emissions and can be widely used in small and medium-sized micro grids in cities.
The optimal scheduling strategy that considers the minimum cost of operating the energy storage equipment compares the net power required by the system with the cost of energy storage to determine the priority of using the hydrogen energy system and the battery to minimize the investment and operational costs of the system. The example results verify that this method can ensure the stable zero-carbon operation of a microgrid system, taking into account the costs of implementing the configuration scheme.
However, this paper only considers the independent hydrogen storage inside the microgrid. Future work will focus on the hydrogen market. The microgrid can interact with the outside world through the pipeline to further improve the utilization rate of renewable energy while ensuring zero-carbon emissions.

Author Contributions

Conceptualization, H.Z.; Methodology, J.X.; Data curation, J.X. and K.X.; Software, J.X. and J.S.; Writing—original draft, J.X.; Writing—review & editing, K.X., Y.W. and J.S. All authors have read and agreed to the published version of the manuscript.

Funding

This research received no external funding.

Institutional Review Board Statement

Not applicable.

Informed Consent Statement

Not applicable.

Data Availability Statement

Not applicable.

Conflicts of Interest

The authors declare no conflict of interest.

References

  1. Xi, J. Speech at the General Debate of the 75th United Nations General Assembly; The Bulletin of the State Council of the People’s Republic of China: Beijing, China, 2020; p. 3.
  2. Pan, G.; Gu, W.; Zhang, H.; Qiu, Y. Electric hydrogen energy system for high proportion of renewable energy consumption. Autom. Electr. Power Syst. 2020, 44, 1–10. [Google Scholar]
  3. Li, Z.; Zhang, R.; Sun, H.; Zhang, W.; Mei, C. Review on key technologies of multi energy complementary hydrogen production, storage and transportation of renewable energy. Trans. China Electrotech. Soc. 2021, 36, 446–462. [Google Scholar]
  4. Kong, L.; Wang, S.; Cai, G.; Liu, C.; Guo, X. Optimal regulation method of electric hydrogen thermal double-layer energy in zero energy consumption buildings. Chin. J. Electr. Eng. 2021; to be published. [Google Scholar] [CrossRef]
  5. Abo-Elyousr, F.K.; Guerrero, J.M.; Ramadan, H.S. Prospective hydrogen-based microgrid systems for optimal leverage via metaheuristic approaches. Appl. Energy 2021, 300, 117384. [Google Scholar] [CrossRef]
  6. Sun, C.; Li, Q.; Qiu, Y.; Ai, Y.; Li, R.; Huang, L.; Chen, W. Life cycle economic evaluation of microgrid system under residual power grid/hydrogen production mode. Power Syst. Technol. 2021, 45, 1–12. [Google Scholar]
  7. Abdelshafy, A.M.; Hassan, H.; Jurasz, J. Optimal design of a grid- connected desalination plant powered by renewable energy resources using a hybrid pso–gwo approach. Energy Convers. Manag. 2018, 173, 331–347. [Google Scholar] [CrossRef]
  8. Elnozahy, A.; Ramadan, H.; Abo-Elyousr, F.K. Efficient metaheuristic utopia-based multi-objective solutions of optimal battery-mix storage for microgrids. J. Clean. Prod. 2021, 303, 127038. [Google Scholar] [CrossRef]
  9. Shao, Z.; Zhao, Q.; Zhang, Y. Source Side and Load Side Coordinated Configuration Optimization for Stand-alone Micro-grid. Power Syst. Technol. 2021, 45, 3935–3946. [Google Scholar]
  10. Nguyen, T.H.T.; Nakayama, T.; Ishida, M. Optimal capacity design of battery and hydrogen system for the dc grid with photovoltaic power generation based on the rapid estimation of grid dependency. Int. J. Electr. Power Energy Syst. 2017, 89, 27–39. [Google Scholar] [CrossRef]
  11. Papari, B.; Edrington, C.S.; Bhattacharya, I.; Radman, G. Effective energy management of hybrid ac–dc microgrids with storage devices. IEEE Trans. Smart Grid 2017, 10, 193–203. [Google Scholar] [CrossRef]
  12. Yang, D.F.; Jiang, C.; Cai, G.W.; Huang, N.; Liu, X.; Huang, Z. Multi objective optimal configuration of ac / dc microgrid considering electrothermal coupling. Autom. Electr. Power Syst. 2020, 44, 124–132. [Google Scholar]
  13. Zhao, B.; Wang, X.; Zhang, X.; Zhou, J. Double layer optimal configuration method of microgrid considering demand side response and uncertainty. J. Electrotech. 2018, 33, 3284–3295. [Google Scholar]
  14. Ferrario, A.M.; Bartolini, A.; Manzano, F.S.; Vivas, F.J.; Comodi, G.; McPhail, S.J.; Andujar, J.M. A model-based parametric and optimal sizing of a battery/hydrogen storage of a real hybrid microgrid supplying a residential load: Towards island operation. Adv. Appl. Energy 2021, 3, 100048. [Google Scholar] [CrossRef]
  15. Li, Q.; Zhao, S.; Pu, Y.; Chen, W.; Yu, J. Capacity allocation optimization of hybrid energy storage microgrid considering electric hydrogen coupling. Trans. China Electrotech. Soc. 2021, 36, 486–495. [Google Scholar]
  16. Khiareddine, A.; Salah, C.B.; Rekioua, D.; Mimouni, M.F. Sizing methodology for hybrid photovoltaic/wind/hydrogen/battery integrated to energy management strategy for pumping system. Energy 2018, 153, 743–762. [Google Scholar] [CrossRef]
  17. Zhang, W.; Maleki, A.; Rosen, M.A.; Liu, J. Optimization with a simulated annealing algorithm of a hybrid system for renewable energy including battery and hydrogen storage. Energy 2018, 163, 191–207. [Google Scholar] [CrossRef]
  18. Hu, L.; Liu, T.; Hou, M. Optimal Allocation of Wind /Photovoltaic /Diesel /Storage Capacity Based on Immune Particle Swarm Optimization. Sci. Technol. Eng. 2020, 20, 14967–14973. [Google Scholar]
  19. Xiao, J.; Zhang, Z.; Zhang, P.; Liang, H.; Wang, C. A Capacity Optimization Method of Hybrid Energy Storage System for Optimizing Tie-line Power in Microgrids. Autom. Electr. Power Syst. 2014, 38, 19–26. [Google Scholar]
  20. Li, B.; Roche, R.; Miraoui, A. Microgrid sizing with combined evolutionary algorithm and milp unit commitment. Appl. Energy 2017, 188, 547–562. [Google Scholar] [CrossRef] [Green Version]
  21. Pu, Y.; Li, Q.; Chen, W.; Huang, W.; Hu, B.; Han, Y.; Wang, X. Energy management for islanded dc microgrid with hybrid electric-hydrogen energy storage system based on minimum utilization cost and energy storage state balance. Power Syst. Technol. 2019, 43, 918–927. [Google Scholar]
  22. Mohseni, S.; Brent, A.C. Economic viability assessment of sustainable hydrogen production, storage, and utilisation technologies integrated into on-and off-grid micro- grids: A performance comparison of different meta-heuristics. Int. J. Hydrog. Energy 2020, 45, 34412–34436. [Google Scholar] [CrossRef]
  23. Garcia-Torres, F.; Bordons, C. Optimal economical schedule of hydrogen-based microgrids with hybrid storage using model predictive control. IEEE Trans. Ind. Electron. 2015, 62, 5195–5207. [Google Scholar] [CrossRef]
Figure 1. Structure of PV-hydrogen zero carbon emission microgrid system.
Energies 15 04916 g001
Figure 2. Relationship between cost and power demand.
Energies 15 04916 g002
Figure 3. Optimal scheduling strategy considering the minimum operating cost of energy storage equipment.
Energies 15 04916 g003
Figure 4. Optimal configuration process of microgrid source storage capacity.
Energies 15 04916 g004
Figure 5. Annual distribution of light radiation intensity.
Energies 15 04916 g005
Figure 6. Annual distribution of temperature.
Energies 15 04916 g006
Figure 7. Annual distribution of load power demand.
Energies 15 04916 g007
Figure 8. Annual energy storage changes of the storage battery and the hydrogen storage tank: (a) scheduling strategy in this paper; (b) battery priority scheduling strategy; (c) hydrogen energy system priority scheduling strategy.
Energies 15 04916 g008aEnergies 15 04916 g008b
Figure 9. Output curve of each element.
Energies 15 04916 g009
Figure 10. Power balance of the system.
Energies 15 04916 g010
Table 1. Parameters of simulation.
ComponentsParameterValue
PhotovoltaicUnit purchase cost
Unit operation and maintenance cost
Life
USD 1140/kW
USD 7/(kW·year−1)
20 years
BatteryUnit purchase cost
Unit operation and maintenance cost
Maximum number of cycles
Charge/discharge efficiency
USD 110/kWh
USD 1.2/(kW·year−1)
4000
0.95
Fuel cellUnit purchase cost
Unit operation and maintenance cost
Fuel cell startup cost
Fuel cell shutdown cost
Life
Operating efficiency
USD 2400/kW [22]
USD 48/(kW·year−1) [22]
USD 0.002 3/kW [23]
USD 0.001 6/kW [23]
30,000 h
60%
ElectrolyzerUnit purchase cost
Unit operation and maintenance cost
Electrolyzer startup cost
Electrolyzer shutdown cost
Life
Operating efficiency
USD 1000/kW [22]
USD 20/(kW·year−1) [22]
USD 0.072 2/kW [23]
USD 0.003 6/kW [23]
30,000 h
60%
Hydrogen storage tankUnit purchase cost
Unit operation and maintenance cost
Life
USD 143/m3
USD 10/(m3·year−1)
20 years
Table 2. Optimized configuration results of source and storage capacity.
StrategyScheduling MethodInstalled Capacity L LP / % R u / % R p / % Total Cost ($/Year)
PV/kW ES/kWh FC/kW EL/kW HS/kWh
1Scheduling strategy in this paper589865861681540068.1100189,896
2Battery priority scheduling strategy [17]618396824642560.01762.4100199,418
3Hydrogen energy system priority scheduling strategy [14]62452711517237820.02659.3100240,300
Publisher’s Note: MDPI stays neutral with regard to jurisdictional claims in published maps and institutional affiliations.

