Abstract
This paper investigates the prospect of permanent magnet vernier machine (PMVM) technology for wind power applications. Two types of PMVMs are defined based on the winding arrangements and resultant gear ratio ranges. A comprehensive design study of the selected PMVM topologies is conducted at 1 and 3 MW power levels. The optimized candidate designs of the PMVMs are then evaluated and also compared against the equivalent permanent magnet synchronous machine (PMSM) in terms of performance, costs, size and mass. While the existing research publications mainly focused on the PMVM designs of (), this study reveals that the pole/slot combinations of PMVMs with () are more appealing as there is a good trade-off between a reasonable power factor and high power density in these designs. It shows, in this paper, that the PMVM is a promising alternative to common PMSM technology for utility-scale wind-turbine drive-train applications.
1. Introduction
Wind energy is one of the most important renewable energy sources. The worldwide wind power generation capacity has been growing at a substantial rate over the past decades. Research in wind turbine systems has indicated a crucial need to develop high-performance and cost-effective electrical machine technologies, as they are an integral part of wind turbine power-trains and play a significant role in wind energy conversion. Doubly-fed induction generator (DFIG) with a partial-scale power electronic converter (PEC) and a single or three-stage gearbox has been the most dominant wind turbine power-train technology since the early 2000s. Another common wind turbine power-train technology involves a permanent magnet (PM) synchronous generator with a full-scale PEC and a single or multi-stage gearbox [1,2]. Owing to gearbox issues and related system reliability concerns, there has been a paradigm shift towards the use of direct-drive (DD) generators with full-scale PECs, especially for offshore wind power applications. However, since the direct-drive generators run at a low turbine speed, they are inherently heavier and larger due to high torque handling requirements in wind turbine systems.
In the past decade, there has been much interest in magnetically geared electrical machine technologies [3]. Amongst others, permanent magnet vernier machines (PMVM) received a lot of attention [4,5,6]. The inherent magnetic gearing effect enables the PMVM to have high torque density, potential for less weight and more compactness than conventional permanent magnet synchronous machines (PMSM), while also keeping the same structural simplicity. Despite these distinct advantages, the PMVMs are notably characterized by poor power factor, which increases the PEC rating requirement. In an attempt to improve the power factor of PMVMs, some researchers proposed more complex machine topologies such as double-stator [7] and double-rotor [8] PMVMs, while others studied special PM arrangements like Halbach [9] or spoke-type [10].
Some early comparison studies between PMVMs and conventional PMSMs can be found in the literature. However, they mainly focused on electric vehicles (EV) and general low-speed industrial drive applications [4,11,12,13]. A systematic method for designing direct-drive PM vernier wind generators is presented in [14] and validated based on a designed 5 kW prototype [15]. The work reported in [16,17] is probably the first attempt at the design, practical evaluation and comparison of a surface-mounted PMVM with a benchmark conventional PMSM for wind power applications.
More recently, the quantitative analysis of the applicability and potential of PMVM technology for utility-scale wind power applications has been conducted in [18,19,20,21]. The general conclusion drawn from these studies is that systems involving PMVM designs are not yet competitive in comparison to those of conventional PMSMs with several-megawatt (MW) power levels. This is because the only benefit that seems to be guaranteed from PMVM is the significant reduction in machine volume, while the advantage of lower active mass is discounted by the fact the total machine mass in direct-drive generator systems is heavily dominated by the structural mass.
Furthermore, other benefits such as higher efficiency and lower cost obtained at the PMVM level seem to be overturned when the whole system is considered, mainly due to the increased power converter costs and losses associated with the PMVM system. Moreover, it was further revealed that when observed from the slot-pitch-ratio (SPR) point of view, the design of PMVM seems to be a trade-off between the improved performance and demagnetization risk [18]. Interestingly, the majority of the available PMVM designs at multi-MW output level are limited to only a pole-ratio () of five (5), including the studies in [18,19]. Hence, this paper will extend the current knowledge gap by further looking into other pole-ratios greater and/or less than five. This will provide a wider picture of what could lead to the optimal design at this power level.
An interesting aspect of the PMVM technology is that a standard PMVM (with a single-stator and a single-rotor) has the same mechanical simplicity and gear-less layout as that of a conventional DD-PMSM, which suggests that the PMVM is simply another DD-PMSM. On the other hand, a PMVM usually operates at a slightly higher frequency due to its inherent magnetic gearing features, which are closer to that of the medium-speed (MS) geared PMSMs. A more intuitive view can be gained by putting the PMVM technology alongside current mainstream wind generator technologies, as shown in Figure 1, which clearly shows that the PMVM technology shares some advantages and unique characteristic properties with both the direct-drive (high torque capability and low maintenance) and medium-speed (lower mass) PMSMs.
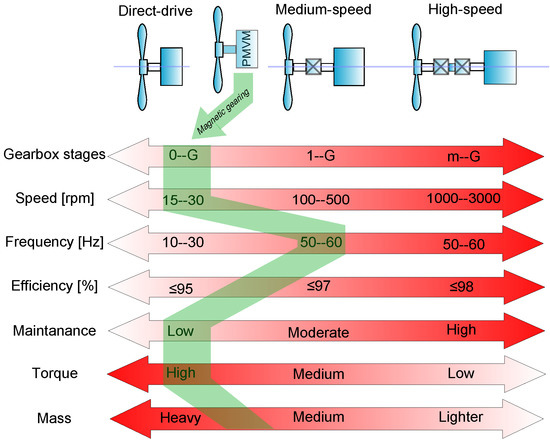
Figure 1.
PMVM vs. DD-PMSM and MS-PMSM characteristics at utility power levels (© [2020] IEEE. Reprinted, with permission from [20]).
This paper is the extended version of [20], which aims at studying the feasibility of implementing the PMVM technology for high-power wind generator systems. To achieve this goal, a detailed design optimization study using the finite element method (FEM) is conducted for a number of selected PMVM topologies/design choices at utility power levels. The realized PMVM designs are then evaluated against a conventional PMSM of corresponding power rating. With the ever-increasing power capacity and size of turbines in the wind energy industry, it becomes more challenging to mount a nacelle on the top of a tower. A lighter and lower-cost wind generator is always preferred in the wind power industry. Thus, the main design objective in this study is to minimize the total mass and cost of active electromagnetic material of a PMVM, while subjecting it to the overall dimensional constraints and design specifications.
In this updated paper, for the sake of completeness, the fundamental working principle of the PMVM is given in Section 2, the basic winding configurations of PMVMs are described in Section 3, and this will be followed by a brief description of the field-circuit model of PMVMs in Section 4 and the explanation of the implemented optimization strategy and specifications in Section 5. Then, the obtained results are presented and discussed in Section 6. In comparison with [20], the validation of the formulated PMVM design optimization approach is also included in Section 7, after which relevant conclusions are drawn in Section 8.
2. Fundamental Working Principle
The basic operation of PM Vernier machines relies on the Magnetic Gearing principle [22,23]. In this concept, a high-speed low-order space harmonic field is generated by the stator windings, whereas the low-speed high-order space harmonic field originates from the rotor PMs. The two field harmonics are magnetically coupled through modulation by the ferromagnetic pole-pieces (flux modulator), which are normally situated in-between their respective exciting components. Flux modulator can be in the form of a separate component or a split stator tooth or even the stator teeth themselves. For the magnetic gearing principle to be effectively realized in PMVMs, the number of winding pole-pairs (), rotor pole-pairs () and flux-modulator pole-pieces () is strictly related by [22,24]:
In addition, it has been proven that a pole/slot combination given by enables a better performing PMVM design as opposed to the other combination with [25]. The number of stator teeth/slots () can then be separately selected according to the applicable rules to achieve stable field generation with balanced phase flux linkages at the chosen frequency. However, in the case of the PMVM type where the stator teeth also perform the modulation function, it means the stator-slots number is the same as that of the modulating pieces; hence, can be replaced by in (1).
With regards to the surface-mounted PMVM, a linearized and simplified geometrical structure of which is presented in Figure 2, the modulated air-gap flux density can be approximated as:
where is the PMs magneto-motive force (MMF) distribution, the term reflects the nth order PM pitch factor, and is the air-gap permeance function, with its average and higher-order harmonic components represented as [22,26]:
where and are the average and the specific magnitude of the vth harmonic permeance coefficients obtained from a conformal mapping method, the parameters, and are respectively the slot pitch and slot opening, as illustrated in Figure 2. Furthermore, the coefficient is determined by the relation [23,26]:
where in Equations (3) and (4) is the equivalent magnetic air-gap length. Both the average () and vth () harmonic magnitudes depend on the value of , which in turn is a function of the slot-opening to air-gap ratio (). That is, Equation (2) shows that in addition to the fundamental field harmonic (), the no-load air-gap flux density is composed of the two other harmonic components generated as a result of the modulation effect, namely: () and (). Therefore, when the stator winding pole-pair number is selected as , the no-load induced voltage of the machine is:
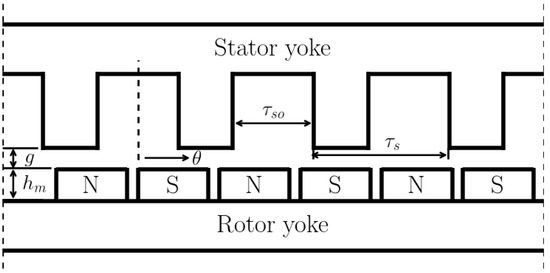
Figure 2.
Linearized and simplified typical geometry of a PMVM.
Continuing on the similar analogy to that of the back-EMF, and with the assumption that the machine is running at a steady-state speed with pure sinusoidal currents, the air-gap electromagnetic torque for a three-phase PMVM is then formulated as shown below:
where is the linear current density in .
The presence of three constituent terms is now evident in both the developed open circuit voltage and torque expressions. The first term is equivalent to the component found in classical PMSMs, while the second and the third terms are due to the vernier effect. A further inspection of Equation (5) reveals that K and K are the two terms playing key roles in PMVM’s operation, and they can greatly be affected by the variables , , and the slot opening ratio (), as also evident from (3) and (4). The characteristics of K and K with various values of PM thickness and slot opening ratio are, respectively, provided in Figure 3 for a small PMV machine with 10 rotor PM pole-pairs and 12 stator slots. In Figure 3a, it can be seen that decreases with an increase in slot opening ratio , whereas it increases with PM thickness for each specific . As shown in Figure 3b, displays a somewhat different tendency, i.e., rapidly increases with an increment of PM thickness and reaches its peak point at a specific value, after which it keeps on becoming smaller with larger PM thickness. Moreover, the similar increasing and decreasing tendencies of are also observed with respect to increasing the slot opening ratio.
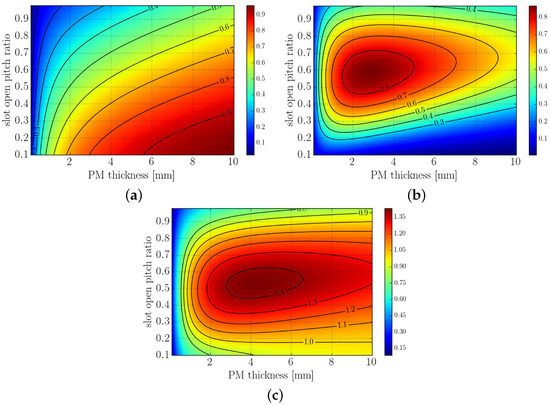
Figure 3.
Variation of Equation (5) components as a function of PM thickness and slot opening ratio: (a) , (b) , (c) .
Consequently, the sum of and gives the term, which reflects the combination characteristics of its constituent terms, as shown in Figure 3c. It can be clearly seen that also reaches its maximum value at a specific but saturates at a slightly lower value with further increasing . This can be expected as thicker PMs lead to a larger effective air-gap rendering a weakened modulation effect of the air-gap flux density. This implies that the optimal PM thickness of PMVMs tends to be smaller than that of conventional PMSMs for the same output performance. Thus, the PMVM has the potential for a comparatively lower PM material usage.
3. Basic PMVM Configurations
In single air-gap PMVMs, various PM rotor structures such as surface-mounted, inset, interior and Halbach arrays can all be used. However, judicious selection of slot-pole combinations and winding arrangements can result in different types of PMVM designs. In this paper, the most common types of PMVMs are classified into two major groups based on the winding arrangements and resultant range of gear ratios, namely, Type-A and Type-B PMVMs.
3.1. Type-A PMVMs
These types of machines encompass both the conventional overlap winding PMVMs (OW-PMVM) and the split-tooth concentrated winding PMVMs (Split-tooth PMVM). The common feature between these two machine types is that their ratio of rotor to stator pole-pairs (i.e., ) has a minimum value of five (5) for the three-phase machines. That is, considering Equation (1):
and with equal to for OW-PMVM and being the number of modulating pieces or total teeth splits in the case of Split-tooth PMVMs, can further be expressed in terms of the number of slots/pole/phase (q) as:
It must be kept in mind that in the case of the Split-tooth PMVMs, q is calculated based on the number of stator tooth-splits (instead of stator teeth) for Equation (8). Hence, the minimum possible in this type of PMVMs is five (5).
The cross-sectional views of some typical PMVM structures in this group are presented in Figure 4. The first structure (Figure 4a) can be seen as a simple derivation from traditional PMSMs through adjustment of their electromagnetic pole/slot combinations to conform with Equation (1). Since there is usually a bigger numerical difference between its stator slots and stator pole-pairs, the distributed overlapping-winding is normally used. In addition, the stator teeth perform both the roles of major flux paths and modulating pieces. Therefore, open stator slots are very common in this configuration as they enhance the flux modulation effect. Relatively longer end-winding length is an obvious drawback for this machine.
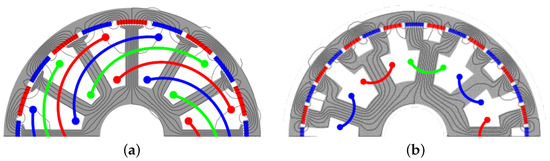
Figure 4.
Typical structures of Type-A PMVMs with (a) conventional overlap-winding, (b) tooth concentrated, split tooth (© [2020] IEEE. Reprinted, with permission from [20]).
On the other hand, the tooth-concentrated, split-tooth PMVM (Figure 4b) directly implements ferromagnetic pieces to modulate fields from either side of the air-gap to realize field coupling. This allows the armature windings to be wound around each of the main stator teeth, giving the possibility of shorter end-winding lengths and fault tolerance capability between the phases. Consequently, this increases the machine’s reliability and results in fewer winding losses. Some of the drawbacks of this structure include increased magnetic reluctance due to longer magnetic paths, relatively high torque ripple and significant frequency-dependent losses as a result of the rich harmonic content of the tooth-concentrated winding arrangement.
3.2. Type-B PMVMs
A fairly clear approach to calculating the winding factors of the tooth-concentrated fractional slot pitch winding is available from the winding theory. According to Skaar and Nilssen [27], a feasible region of reasonable winding factors exists for . Furthermore, the same study showed that all other pole/slot combinations have a balanced air-gap magnetic radial forces except those with = 21. To reduce the unbalanced force magnitudes in pole/slot combinations utilizing this winding arrangement, one technique is to double the number of slots while retaining the same number of poles.
Based on this observation, the two-slot pitch windings were developed (Figure 5), and their implementation on PMVMs was demonstrated by several researchers [28]. For the PMVM development, this type of winding is obtained by just doubling the number of slots from the one slot-pitch winding conventional PM machines, including those with balanced magnetic forces. In this case, the purpose of doubling the slot number without changing the original armature poles is to create a bigger numerical difference between them, and this gives more design flexibility which can easily satisfy (1). This then results in a new range of q values with no negative impact on winding factor, i.e., , and other advantages from their original one slot-pitch are retained. Most of the single slot-pitch combinations give acceptable two-slot pitch windings except those with the basic ratio =. Considering all the applicable conditions in developing this type of winding, the corresponding gear ratios of PMVM are defined by (9). It can be clearly seen from Figure 6 that is confined within a range of , and converges to three (3) as the stator pole-pairs increase.
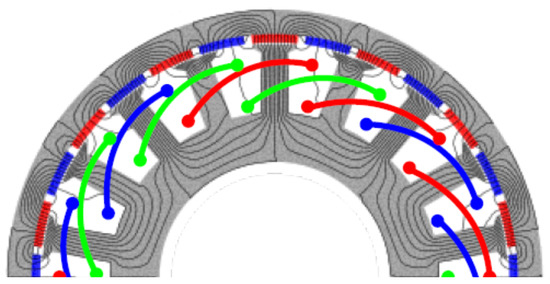
Figure 5.
A typical structure of Type-B PMVMs (© [2020] IEEE. Reprinted, with permission from [20]).
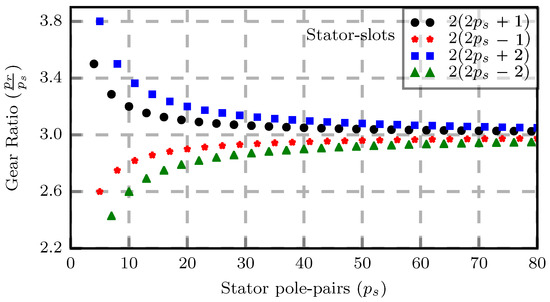
Figure 6.
Gear ratios of Type-B PMVMs (© [2020] IEEE. Reprinted, with permission from [20]).
4. Steady-State Field-Circuit Model of PMVM
The design analysis and performance evaluation of the PMVMs in their steady-state mode of operation is realized by employing a coupled field-circuit model. Thus, the output performance is calculated through the equations derived from the fundamental per-phase equivalent circuit shown in Figure 7. As displayed on this generator mode circuit, is the induced electromotive force (EMF), , and are the phase resistance, phase voltage and phase current, respectively. In order to account for the core and magnet eddy-current losses, a shunt resistance is also included. Since the electromagnetic analysis is performed in 2D-FEM, the synchronous inductance is split into and , which represents the main and end-winding inductances, respectively. All the equivalent circuit parameters enclosed by the dashed lines in Figure 7 are readily obtained from the 2D FE model. Other remaining parameters are deduced from analytical calculations.
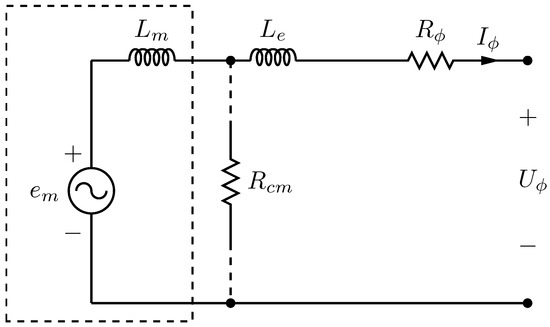
Figure 7.
Per-phase equivalent circuit of the PMVM.
One of such parameters is the core-loss, which is a function of flux density magnitude, volume of magnetic conducting material within a machine and mainly the rate of change of flux density. In addition, the considered component’s material magnetic properties also play a huge role in the resultant core losses. Thus, by using the multi-step static FE analysis, the core losses are approximated by employing the Steinmetz-based Equation (10). Since this model equation uses flux variation and magnitude deduced from several independent static solutions, it gives satisfactory accuracy, albeit much faster compared to transient FEM simulations.
where T is the period, is the peak-to-peak flux density, , and are the lamination material loss model coefficients.
In order to simplify the machine performance computations, the instantaneous 3-phase output quantities are projected onto the -axis reference frame through the use of the transformation matrix. The -axis steady-state circuits fixed to the rotor reference frame corresponding to the phase circuit in Figure 7 are provided in Figure 8. From these circuits, the steady-state dq-axis voltage equations can be expressed as:
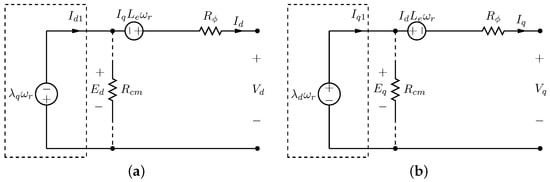
Figure 8.
Rotor reference frame equivalent circuits: (a) d-axis and (b) q-axis.
Furthermore, the -axis current components are also deduced from the circuits in Figure 8 as follows:
With the equivalent circuit and other associated parameters known, the air-gap electromagnetic power and developed average electromagnetic torque (for surface-mounted PM rotor) can also be computed from the general equations:
where is the speed in revolutions per minute.
In the generator mode of operation, the difference between the air-gap electromagnetic power and mechanical power at the machine shaft is due to rotational losses and shunt core losses. On the other hand, the air-gap electromagnetic power differs from the output electric power at the machine terminals by the armature copper losses. That is, numerical addition of the developed air-gap power and the sum of rotational and shunt core losses will yield the shaft mechanical input power, while subtraction of armature losses from it gives the generator output power. The output electrical power consists of useful active power and reactive power, both of which can be approximated from the phase circuits in Figure 8:
Subsequently, the efficiency and power factor (PF), which is a function of the phase angle difference between the output voltage and current, may also be obtained from the preceding equations. It must be noted that during the early design optimization stage, the windage and frictional losses, which constitute mechanical losses, are ignored in order to simplify the problem.
5. Design Optimization Process
For the design and performance evaluation of PMVMs, the corresponding ranges of specifications and parameters of PMSMs, such as input speed, operating frequency, total outer diameter and stack length, etc., are used as a benchmark and reference guide. Therefore, a highlight of PMSMs’ performance and characteristic properties is first given as a preset to the PMVM’s specifications. In addition, the design constraints, procedure and strategy are also described in this section. For the wind generator designs, it is desirable to consider a range of operating speeds of a wind turbine by optimizing the generator at several operating points of the wind turbine [29,30,31]. Given the scope of this work, the design optimization study in this paper is conducted based on the rated operating conditions of a generator.
5.1. Specifications
Since the optimization objectives are primarily concerned with the active material weight and volume, a presentation of these characteristic parameters for a PMSM is given in Figure 9 as obtained from the literature. This is performed for 1–5 MW machine output levels to indicate their characteristic relationship against rating up-scaling as well. As these machines were optimized by different researchers based on various specifications, constraints and algorithms, there is a bit of variance in their performance at each rated level. Hence, the ranges in the figure indicate the dispersion of active weight and volume, highlighting the minimum and maximum values as obtained from the relevant literature.
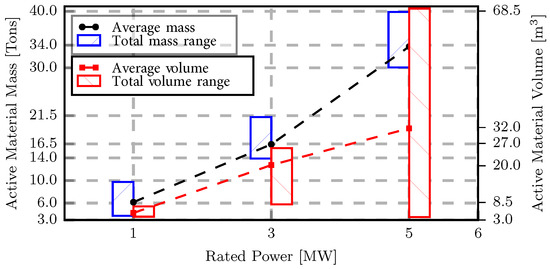
Figure 9.
Active mass and volume of PMSM as a function of power rating found in the literature (© [2020] IEEE. Reprinted, with permission from [20]).
By considering their averages, both the active material weight and volume show a somewhat linear trend against the machine power rating. Furthermore, it appears from Figure 9 that a mass of about 16.5 tons and volume of 20 m are deemed reasonable for a 3 MW DD-PMSM generator.
A breakdown of different material types contributing to the machines’ active weights provided in Figure 9 is also shown by Figure 10. As seen in the figure, the lamination mass is always the most dominant since it takes at least of the total mass while the PM material contributes the lowest percentage.
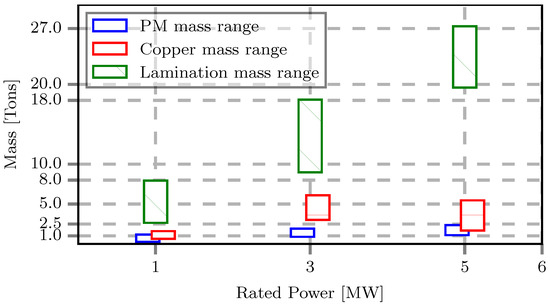
Figure 10.
Different active material weight distribution vs. power rating of PMSM (© [2020] IEEE. Reprinted, with permission from [20]).
Based on the above information, the main design specifications are summarized in Table 1. A minimum efficiency of is specified for 300 kW machines or less, while is required for 1 MW machines and above. As the output capacity of the machine is increased to the mega-Watt level, the available wind speed distribution, physical generator size and that of turbine blades dictate the rated speed to be decreased accordingly, and the frequency should follow a similar trend to limit the core losses. Theoretically, a larger air-gap radius would also be needed to accommodate a high number of poles and handle large input torque from the blades. However, factors such as available nacelle size, manufacturing and logistic constraints create the upper limits as to how large a machine can be. Therefore, the total outer diameter (D) of active volume is considered in this case to give an approximate size of the machine, and the air-gap radius will be determined by the optimization variables. It is assumed that no special cooling methods will be implemented for the machines; hence, an armature current density of 5 A/mm is set to be the upper limit for a natural air-cooled machine. Considering the strong magnetic attraction forces and manufacturability of the machine, a reasonable air-gap length corresponding to machine size should be selected, which is taken to be roughly 0.1% of the total diameter in this study.

Table 1.
Main design specifications of machines at different power levels [1,32,33,34,35,36,37].
5.2. Methodology
Although gradient-based algorithms are time efficient for electrical machine design with many design variables, they are susceptible to becoming trapped into a local optimum and numerical noise [38]. On the other hand, non-gradient-based algorithms are proven to have capabilities of locating the global optimum point, but they are computationally very expensive. In this study, a hybrid optimization approach was implemented in an attempt to leverage their respective advantages, whereby stochastic and a gradient-based algorithms, i.e., Non-dominated Sorting Genetic Algorithm II (NSGA-II) and Method of Modified Feasible Directions (MMFD), respectively, were used in two sequential steps to obtain one best final solution. The NSGA-II is initially used to determine the search region that contains the global optimum within it. Once in this general vicinity of the global optimum, the MMFD is used with the NSGA-II’s results as the starting point to quickly locate the precise optimum point by further zooming into the solution area. In this way, the two algorithms are combined and efficiently employed to find a true optimum point within a very reasonable time. That is because, since the MMFD started from an already improved point, it will quickly converge with fewer evaluation iterations than what would be required if NSGA-II was used alone to find the very best point. Figure 11 illustrates the workflow of this optimization technique.
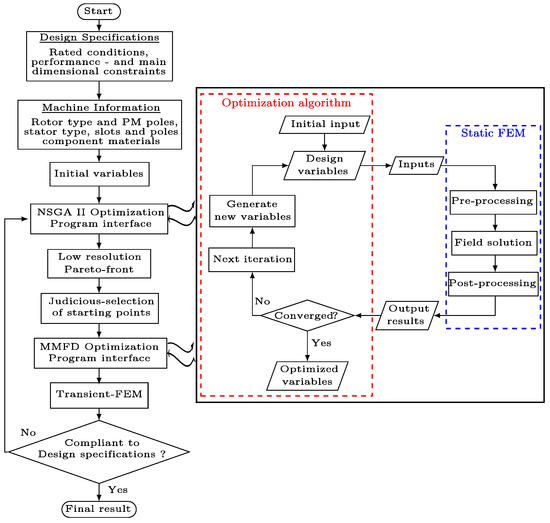
Figure 11.
Hybrid optimization technique workflow.
In NSGA-II, a number of user-adjustable operators have to be fine-tuned based on the characteristics of the optimization problem in order to enhance the algorithm’s efficiency and reliability. The settings of these specific parameters are given in Table 2 for the optimization of all machines (1 and 3 MW).
Table 2.
NSGA-II user adjustable parameters’ set values.
A fixed initial population size of 60 was also used for all optimization trials, which is five times the number of optimization variables and deemed reasonable according to the NSGA-II theory as a larger population size would drastically increase the number of solver evaluations and optimization time. The maximum number of generations was set to 600 for 1 MW machines and increased to 1200 for 3 MW machines because the purpose of the NSGA-II in this case was just to identify the zone of the global optimum. The mutation probability was set to 0.0833, which is the reciprocal of the variables number (i.e., 12) as per the relevant theory of NSGA-II as well [39].
The formulated optimization problem has more than one objectives and several design constraints, as follows:
where X represents the vector of geometric variables illustrated in Figure 12 with angle ratios defined in (15), including the axial stack length of the machine, and Y is a set of selected objective functions such as the minimization of mass and cost. The minimum powers and efficiencies are as indicated in Table 1 for each power rating. It should also be noted that the temperature and material characteristics were kept constant throughout the optimization process.
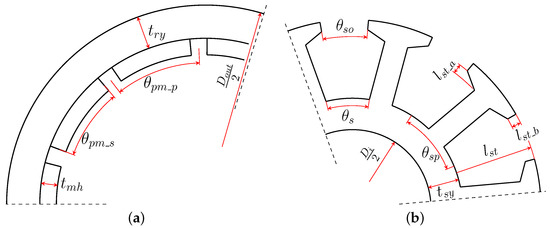
Figure 12.
Machine geometric optimization variables of (a) rotor and (b) stator (© [2020] IEEE. Reprinted, with permission from [20]).
6. Optimization Results and Discussions
As a preliminary design exercise, the PMVMs are designed and optimized for a rated power of 1 MW. The considered slot/pole combinations of the PMVM are detailed in Table 3. The pole-slots are selected based on the input speed and the expected rated frequency. As indicated in the table, the combinations are further grouped into two frequencies. The lower frequency (≈30 Hz) corresponds to that of a conventional DD-PMSM, while the other one matches that of the medium-speed PMSM with a single-stage gearbox (≈60 Hz). The basic idea behind this is to evaluate the performance of the PMVM when it is operated at the direct-drive and medium-speed PMSM frequency conditions, with similar input speed and gear ratio. This is because a PMVM looks rather similar to a conventional DD-PMSM structurally, but it incorporates a magnetic gearing principle in its operation. This inherent feature makes it look closer to the medium-speed machines from the operational frequency point of view, as illustrated in Figure 1. Thus, it is important to assess the performance characteristics, total active mass, volume and cost of PMVMs for both operating frequencies.
Table 3.
Investigated slot/pole combinations for 1 MW PMVMs.
To investigate the relations between the gear ratios and the design objectives of large power PMVMs, a comparison is made of the power factor and the active weights at a number of different gear ratios. As shown in Figure 13, in Type-A PMVMs (), lower gear ratio designs are preferred (for both frequencies) as they tend to have higher power factor and lighter mass. Further, these Pareto fronts clearly reveal the competing relationship between the active mass and power factor in PMVMs. It is also evident that PMVMs operating at higher frequency have less total mass and better power factor.
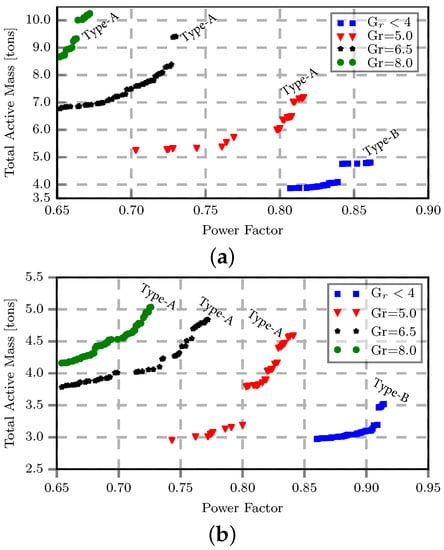
Figure 13.
A 1 MW PMVM’s active mass vs. power factor: (a) 30 Hz (b) 60 Hz (© [2020] IEEE. Reprinted, with permission from [20]).
Figure 14 shows the optimum designs of PMVMs with both Type-A (distributed overlapping winding) and Type-B (2-slot pitch concentrated winding) configurations. The graphs illustrate the trend of active mass and power factor as a function of gear ratios at two different frequencies. It can be clearly seen that the mass increases with the gear ratio while the power factor decreases. It should be remembered that the minimum constraint on power factor was set to 0.65 during the optimization, and higher gear ratio designs appear to be testing this threshold, giving an impression that it would likely go lower than that if the constraint was relaxed. It is at this rated power level that the Type-B PMVMs ( 5) appear to be more attractive in terms of power factor and lighter in weight than the Type-A PMVMs.
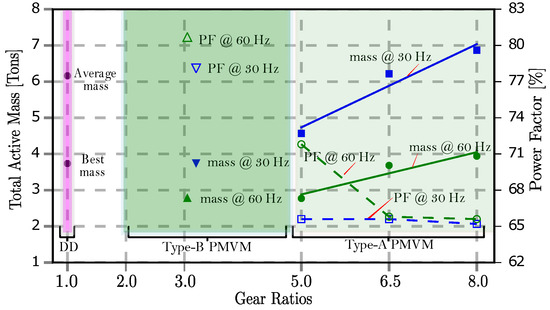
Figure 14.
Total active mass and power factor vs. gear ratios for 1 MW machines (© [2020] IEEE. Reprinted, with permission from [20]).
As a benchmark, the average DD-PMSM weight is also added in Figure 14 for comparison. Although not shown on the graph, PMSM is known to have a near unity power factor. Thus, all the PMVM designs here have poor power factor compared with the PMSM. However, the Type-A PMVMs with = 5 and the Type-B PMVMs are much lighter than the DD-PMSM. There is clearly a trade-off between the light weight and poor power factor in PMVMs.
It can be observed from the results of 1 MW machines that PMVM designs with operating frequency similar to that of their conventional DD-PMSM counterparts offer no benefits. Therefore, for the 3 MW design, the decision was made to go for slot/pole combinations that operate at medium-speed frequency (≈50 Hz) but with equivalent turbine input speed to the DD-PMSM. That is, in addition to the gearing ratio, the generators’ rated speed and output frequency were also the main factors considered in the selection of the slot/pole combinations, as presented in Table 4.
Table 4.
Investigated slot/pole combinations for 3 MW PMVMs.
For the PMVM, the power factor is one of the performance indexes that always need special attention as it can come out to be detrimental if not properly designed. With that said, Figure 15 shows the Pareto-front between the total active mass and power factor for the five 3 MW PMVM slot/pole combinations with different gear ratios. During the optimizations, the upper limit to the PM material usage was set to be equal to the maximum PM mass requirement of the reference PMSMs indicated in Figure 10, and the minimum efficiency was set to be 95%. Since the PMVMs have similar input speeds to those of the PMSMs, this means a fairly similar ground is created for comparison purposes in these two machine types. From the figure, the higher gear ratios invariably lead to lower power factors and heavier total masses. Furthermore, it is realized that some of the PMVM slot/pole combinations can lead to poor power factors with values less than 0.4. This further asserts the point that at output power capacities larger than 1 MW, it is always better to go for a lower gear ratio in PMVM designs.
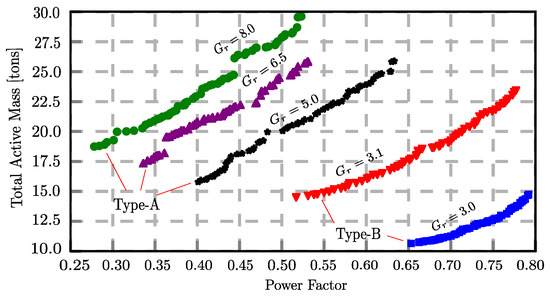
Figure 15.
Total active mass vs. power factor for 3 MW PMVMs (© [2020] IEEE. Reprinted, with permission from [20]).
In order to estimate the cost of the active materials in a machine, the specific cost of each material has to be known. Table 5 gives the material prices used in this study, which may be slightly different to the market values. Based on the literature [1] and the market trend, 35 was assumed to be the cost of the converter. It should be noted that in industry, the actual converter prices usually follow a stepped profile instead of this kind of linearized costing model.
Table 5.
Approximate costs of different materials for PMSM components [40].
In order to compare the PMVMs with the PMSM, one design point for each slot/pole combination was taken from the Pareto-fronts given in Figure 15 and further optimized. The objective in this case was to have a lighter and low-cost PMVM with the best possible power factor. The results are presented in Figure 16a,b, and in Table 6, with the indicative costs of materials also included.
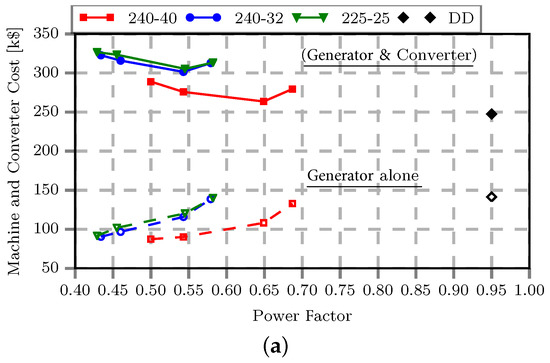
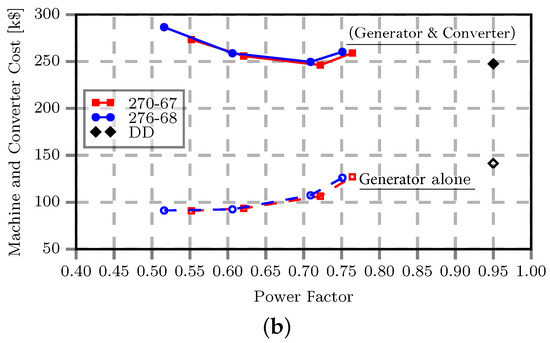
Figure 16.
Comparison of 3 MW PMVMs and system costs: (a) Type-A PMVM (b) Type-B PMVM. Note that the solid markers represent the system (generator and converter) costs while the corresponding hollow markers show the generator cost (© [2020] IEEE. Reprinted, with permission from [20]).
Table 6.
Mass and cost comparisons of different 3 MW PMSM [32,35] and PMVMs.
Even though Silicon steel used for machine cores has a slightly lower mass density than winding copper, it has the largest impact on the total active mass because of its larger volume content. The machines’ efficiencies are always higher than the minimum constraint of 95%, even though the operating frequency is relatively high. Increasing the PM mass has relatively little effect on total active mass, but it can significantly increase the cost of the machine and slightly improve the power factor. Figure 16a,b shows that a low-cost generator with low power factor still leads to an expensive system when the power converter costs are included. Thus, to select a good design, a best compromise has to be found between the generator cost and required converter cost.
Figure 17 shows the mass distribution of the chosen designs and compares them to the benchmark PMSM. It can be seen that PMVMs with lower gear ratios have a good advantage in terms of total active weight. It shows that designing for a lighter machine with a reasonable power factor at this power rating favors pole/slot combinations with lower G. This is a somewhat different trend to the small power PMVMs where the lowest G values are not necessarily the best.
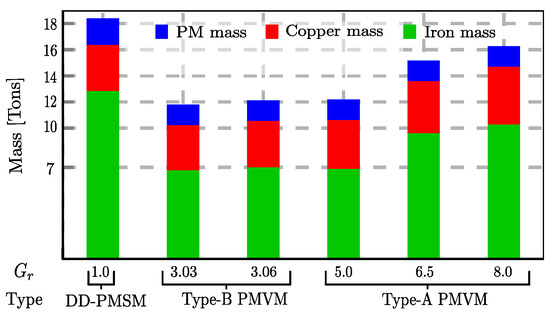
Figure 17.
Comparison of active material weights of 3 MW PMSM and PMVMs (© [2020] IEEE. Reprinted, with permission from [20]).
The results in Table 6 reveal that the PMVM on its own can be lighter and cheaper than the PMSM. However, when the power converter costs are considered, the overall system costs of PMVMs become similar to those of DD-PMSMs because of their high converter rating requirement. It should be noted that a linear converter costing model was assumed in this study, which may not necessarily reflect the true costs in the industry. In the case that the power converter costs follow a stepped increasing pattern with regard to their MVA rating, the cost of PM vernier generator systems may become more competitive for certain power levels.
The cross-sections of these optimized PMVMs are provided in Figure 18 and Figure 19. It can be observed that these PMVMs have thin teeth, wide and shallow slots, which also explains why they have less active iron content than PMSMs. Furthermore, the slot-pitch to air-gap length ratios from these machines are invariably less than 16 (ranges from 11.5 to 13.8), and this means that they have less risk of irreversible demagnetization [18].
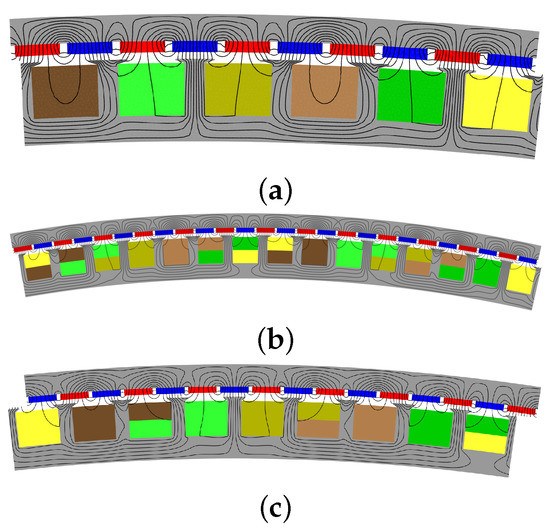
Figure 18.
Cross sections of optimized 3 MW Type-A PMVMs: (a) (1/40th) of Type-A PMVM with Qs/ps/pr = 240/40/200, (b) (1/16th) of Type-A PMVM with Qs/ps/pr = 240/32/208, (c) (1/25th) of Type-A PMVM with Qs/ps/pr = 225/25/200.
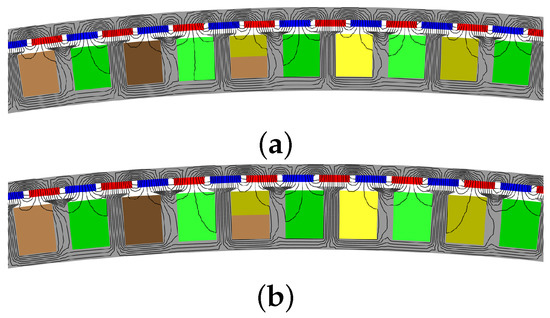
Figure 19.
Cross sections of optimized 3 MW Type-B PMVMs: (a) (1/27th) of Type-B PMVM with Qs/ps/pr = 270/67/203, (b) (1/28th) of Type-B PMVM with Qs/ps/pr = 276/68/208.
As illustrated in Figure 20, the color-coded bar charts indicate the normalized mass scales of the investigated designs for different power ratings together with their respective gear ratios. Although the lightest designs are invariably associated with a low gear ratio of 5 for power rating up to 1 MW, the relationship between the mass and gear ratios is not very distinctive. However, at 3 MW output capacity, it becomes clear that the lowest G has the lightest mass and the highest G has the heaviest mass. This is in stark contrast to smaller output machines (15 kW or less), which seem to be heavier at low gear ratios.
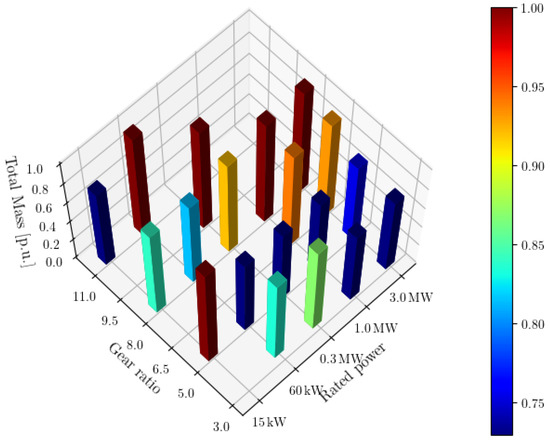
Figure 20.
Total mass indications as a function of power ratings and gear ratios.
It should be reiterated that the PMVM designs in this work are subject to a minimum power factor constraint, which is a holistic approach for comparing the PMVM power-train with that of conventional DD-PMSM’s. From a system cost (both generator and PE converter) perspective, judicious selection of gear ratios is very important for effective exploitation of the performance benefits of PMVMs. Based on the study, some specific design guidance of PMVMs for wind power applications can be given for different power levels, as shown in Figure 21. Type-A PMVMs with high gear ratios () are particularly advantageous for small wind power (sub 50-kW) applications, while low gear ratio () Type-A and Type-B PMVMs are better suited for medium (sub 1-MW) to high (1–10 MW) power wind applications.
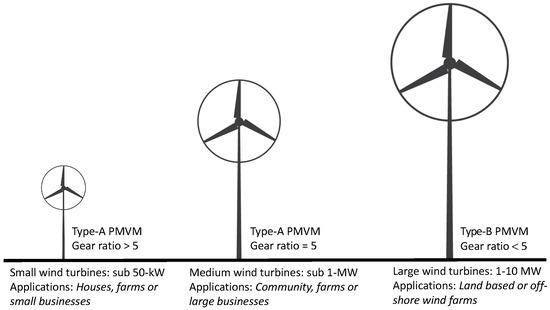
Figure 21.
Recommended PMVM gear ratios for different wind power applications.
7. Prototype Validation
In order to practically verify the theoretical operating principle and validate the formulated FE-based optimal design approach, a 15 kW PMVM prototype was developed. The key dimensions that describe the constructed PMVM are provided in Table 7. Figure 22 shows the machine’s no-load flux plot, no-load and full-load flux density distributions. The stator and rotor yokes have maximum flux density magnitudes of approximately 1.5 and 1.7 T, respectively, while the over-saturated regions appear on the edges of the teeth base.
Table 7.
Prototype machines’ dimensional parameters.
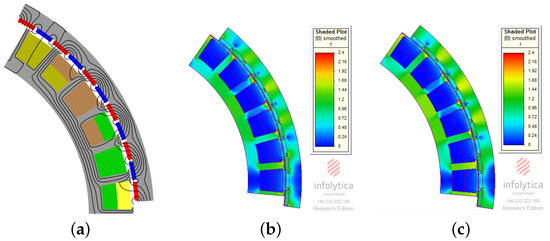
Figure 22.
Prototype PMVM (th) FEM simulation results: (a) no-load flux lines, (b) no-load flux density distribution, and (c) full-load flux density distribution.
The full machine’s structural layout, rotor and stator components are shown in Figure 23 and Figure 24, respectively. Both the stator and rotor are made of M400-50 electrical steel laminations. The grade of NdFeB magnets used is N48H.
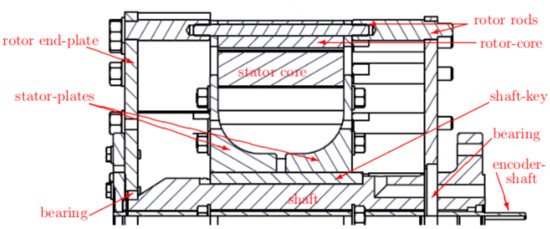
Figure 23.
Longitudinal cross section of PMVM prototype structure (winding not shown).
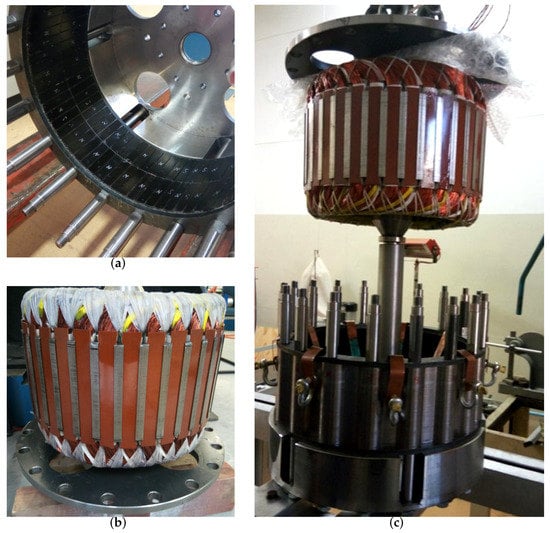
Figure 24.
Machine construction: (a) all sets of PMs are mounted onto the rotor core, (b) side view of wound stator with distributed overlapping windings, and (c) assembling of the PMVM prototype.
A photo of a laboratory test setup is shown in Figure 25. A geared induction motor (prime mover) is used to drive the prototype machine such that its performance is evaluated in the generator mode. A back-to-back converter is implemented for power conditioning and circulation, while the field-oriented technique is used for the machine’s torque control.
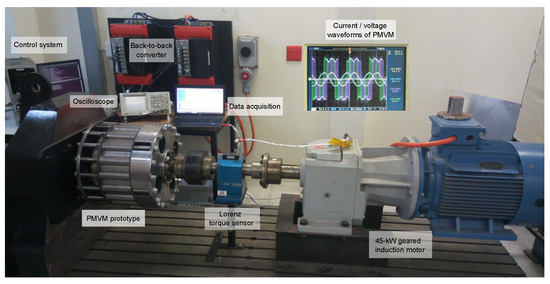
Figure 25.
The laboratory test setup for the PMVM prototype machine.
Both measured and predicted no-load RMS phase voltages of the PMVM prototype as a function of input rotor speed are depicted in Figure 26, which shows a linear relationship of voltage to rotor speed with a good correlation between the two results. Figure 27 displays the no-load phase back-EMF waveform of the PMVM at a rated speed of 150 rpm. An excellent agreement between the measured and FEM simulated results is evident.
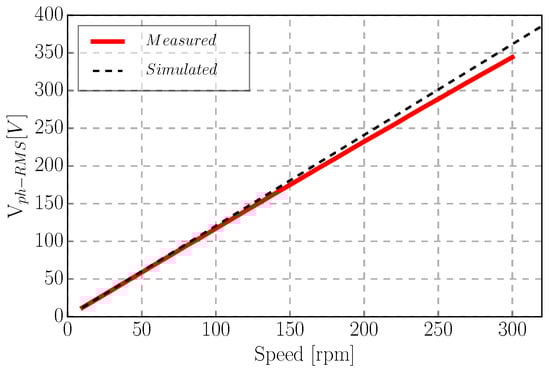
Figure 26.
Measured and predicted no-load phase voltage versus rotor speed.
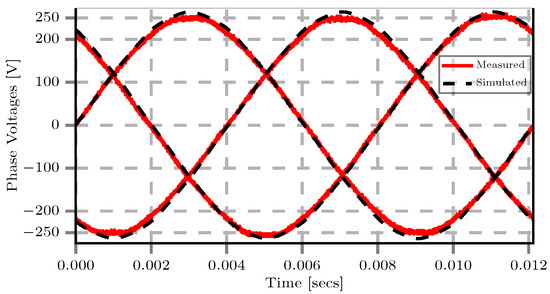
Figure 27.
Open-circuit phase voltage waveforms at rated speed.
The prototype’s no-load power losses, which include the mechanical losses, eddy-current and hysteresis losses in both the electromagnetically active and non-active components at various speeds are provided in Figure 28a. The total loss graph rapidly increases at higher speeds because of the excessive core loss that is frequency-dependent. The measured total losses correlate reasonably well with the sum of the measured bearing loss and simulated frequency-dependent losses up to the rated frequency. However, at higher frequencies, the discrepancy between the measured and predicted total losses becomes more significant.
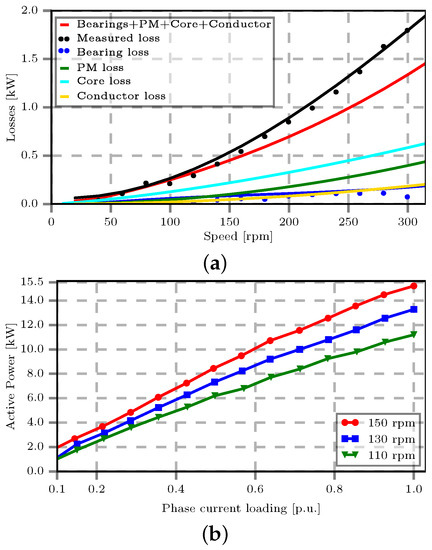
Figure 28.
Prototype PMVM performance at constant rotational speeds: (a) no-load losses as a function of rotor speed, (b) active power as a function of phase current.
As shown in Figure 28a, the PM losses and eddy current losses in the stator conductors located in open slots have also been accounted for in the predicted total loss. The remaining discrepancy between the measured and total approximated losses is likely due to (i) the inaccuracy of the implemented core loss model at higher frequency [41,42], (ii) underestimated mechanical losses, and (iii) the leakage flux-induced losses in the supporting structure since the simulations were only calculated for the active part of the machine.
Figure 28b presents the active output power at various operating speeds, proving that a power of 15 kW is achieved at the rated load current and speed. This result serves as the confirmation that a designed machine is able to practically deliver the expected output power at rated operating conditions, which validates the implemented design optimization approach.
On the one hand, the obtained practical power factor shown in Figure 29a slightly deviates from the FEM predicted result. However, the trend demonstrated by this result also verifies the fact that the PM Vernier machine’s power factor varies a lot with its torque loading at the maximum torque angle. Due to the overwhelming practical no-load losses indicated in Figure 28a, the PMVM’s efficiency is also reduced from 94% to just above 93%, as shown in Figure 29b. The difference is due to the constructional imperfections and inaccurate approximations of certain parameters during the FE modeling. These include the end-winding leakage inductance, temperature and harmonic effects on the losses.
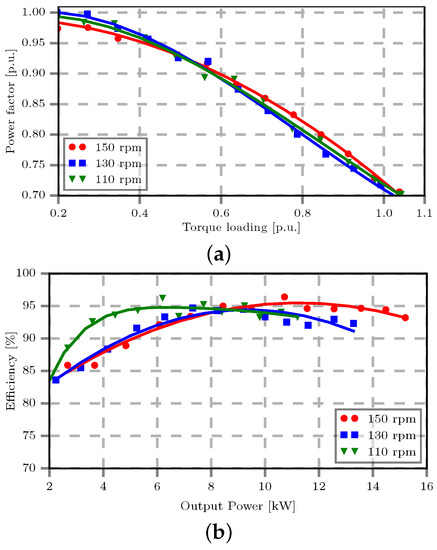
Figure 29.
Prototype PMVM performance at constant rotational speeds: (a) power factor vs. torque loading, (b) efficiency at increasing power.
Table 8 presents the machine’s steady-state performance comparison between the experimental and FEM-based results. It can be observed that there is a generally good correlation between them. In addition to confirming the PMVM’s operational principle, the experimental results presented in Figure 26, Figure 27, Figure 28 and Figure 29 and Table 8 prove the validity of the implemented design procedure and performance analysis methods. Consequently, it may be inferred that the accuracy of the design and modeling approach for the utility-scale PMVMs is acceptable, and the deduced predictions from FEM will be in reasonable agreement with actual manufactured high-power PMVMs.
Table 8.
FEA results comparison with the measurements.
8. Conclusions
This paper presents an investigation study on the design and potential implementation of PMVM for large power wind generator applications. Although high gear ratios are usually preferred for small power PMVMs to realize dense torque designs, it is found that lower gear ratios are more attractive to achieve optimum machine designs with reasonable total mass and power factor for utility-scale PMVMs. This is partly attributed to larger equivalent air-gaps and increased leakage flux experienced by large-sized PMVMs.
The study shows that optimum PMVM designs at utility-scale usually push for the lowest gear ratio of five in Type-A machines. This tendency unveiled the competency of Type-B machines with a gear ratio of around three.
The lower PM material usage in a PMVM is advantageous as this translates to a low-cost design (about 20% cheaper than an equivalent PMSM at 3 MW level), but this advantage is offset by the cost of bigger converter capacity needed for a PMVM, which at the end causes the total cost of the two systems to level up. Although this study was based on a relatively conservative PM price, the conclusions drawn here are still legitimate even with higher PM prices (e.g., 60–70% increase in PM prices).
Even though the PMVM is designed to operate at a direct-drive generator input speeds, its operating frequency may need to be in the same range as that of medium-speed generators in order to enhance its best potential. This implies that its inherent soft gearing effects make it an intermediate alternative between the direct-drive and medium-speed concepts. The study predicts that it is feasible and economically viable to develop high-power PM vernier generators for the wind power applications.
Author Contributions
Conceptualization, P.T. and R.-J.W.; methodology, P.T. and R.-J.W.; software, P.T.; formal analysis, P.T.; investigation, P.T.; data curation, P.T.; writing—original draft preparation, P.T.; writing—review and editing, P.T. and R.-J.W.; supervision, R.-J.W. All authors have read and agreed to the published version of the manuscript.
Funding
This work was supported by ABB Corporate Research in Sweden.
Institutional Review Board Statement
Not applicable.
Informed Consent Statement
Not applicable.
Data Availability Statement
Not applicable.
Conflicts of Interest
The authors declare no conflict of interest.
References
- Polinder, H.; Van der Pijl, F.F.; De Vilder, G.J.; Tavner, P.J. Comparison of direct-drive and geared generator concepts for wind turbines. IEEE Trans. Energy Convers. 2006, 21, 725–733. [Google Scholar] [CrossRef] [Green Version]
- Wang, R.-J.; Gerber, S. Magnetically geared wind generator technologies: Opportunities and challenges. Appl. Energy 2014, 136, 817–826. [Google Scholar] [CrossRef]
- Tlali, P.M.; Wang, R.-J.; Gerber, S. Magnetic gear technologies: A review. In Proceedings of the 2014 International Conference on Electrical Machines (ICEM), Berlin, Germany, 2–5 September 2014; pp. 544–550. [Google Scholar]
- Gerber, S.; Wang, R.-J. Design and evaluation of a PM vernier machine. In Proceedings of the 2015 IEEE Energy Conversion Congress and Exposition (ECCE), Montreal, QC, Canada, 20–24 September 2015; pp. 5188–5194. [Google Scholar]
- Li, J.; Chau, K.T.; Jiang, J.Z.; Liu, C.; Li, W. A new efficient permanent-magnet vernier machine for wind power generation. IEEE Trans. Magn. 2010, 46, 1475–1478. [Google Scholar] [CrossRef] [Green Version]
- Liu, G.; Jiang, S.; Zhao, W.; Chen, Q. A new modeling approach for permanent magnet vernier machine with modulation effect consideration. IEEE Trans. Magn. 2017, 53, 1–12. [Google Scholar] [CrossRef]
- Liu, C.; Chau, K.T.; Zhang, Z. Novel design of double-stator single-rotor magnetic-geared machines. IEEE Trans. Magn. 2012, 48, 4180–4183. [Google Scholar] [CrossRef]
- Niu, S.; Ho, S.L.; Fu, W.N.; Wang, L.L. Quantitative comparison of novel vernier permanent magnet machines. IEEE Trans. Magn. 2010, 46, 2032–2035. [Google Scholar] [CrossRef]
- Li, D.; Qu, R.; Zhu, Z. Comparison of halbach and dual-side vernier permanent magnet machines. IEEE Trans. Magn. 2014, 50, 801–804. [Google Scholar] [CrossRef]
- Liu, W.; Lipo, T.A. Analysis of consequent pole spoke type vernier permanent magnet machine with alternating flux barrier design. IEEE Trans. Ind. Appl. 2018, 54, 5918–5929. [Google Scholar] [CrossRef]
- Fu, W.; Ho, S. A quantitative comparative analysis of a novel flux-modulated permanent-magnet motor for low-speed drive. IEEE Trans. Magn. 2010, 46, 127–134. [Google Scholar] [CrossRef]
- Liu, C.; Lee, C.H.; Chen, M. Comparison of outer-rotor permanent magnet machines for in-wheel drives. In Proceedings of the 2013 IEEE International Symposium on Industrial Electronics, Taipei, Taiwan, 28–31 May 2013; pp. 1–6. [Google Scholar]
- Du, Z.S.; Lipo, T.A. Torque performance comparison between a ferrite magnet vernier motor and an industrial interior permanent magnet machine. IEEE Trans. Ind. Appl. 2017, 53, 2088–2097. [Google Scholar] [CrossRef]
- Kim, B. Design of a direct drive permanent magnet vernier generator for a wind turbine system. In Proceedings of the 2018 IEEE Energy Conversion Congress and Exposition (ECCE), Portland, OR, USA, 23–27 September 2018; pp. 4275–4282. [Google Scholar]
- Kim, B. Design method of a direct-drive permanent magnet vernier generator for a wind turbine system. IEEE Trans. Ind. Appl. 2019, 55, 4665–4675. [Google Scholar] [CrossRef]
- Tlali, P.M.; Wang, R.-J.; Gerber, S. Comparison of PM vernier and conventional synchronous 15 kW wind generators. In Proceedings of the 2018 XIII International Conference on Electrical Machines, Alexandroupoli, Greece, 3–6 September 2018; pp. 2065–2071. [Google Scholar]
- Tlali, P.M.; Wang, R.-J.; Gerber, S.; Botha, C.D.; Kamper, M.J. Design and performance comparison of vernier and conventional PM synchronous wind generators. IEEE Trans. Ind. Appl. 2020, 56, 2570–2579. [Google Scholar] [CrossRef]
- Kumar, D.K.P.; Li, G.J.; Zhu, Z.Q.; Foster, M.P.; Stone, D.A.; Griffo, A.; Odavic, M.; Clark, L.; Thomas, A. Influence of demagnetization on selecting the optimum slot/pole number combination for 3MW surface mounted permanent magnet vernier machine. In Proceedings of the 22nd International Conference on Electrical Machines and Systems (ICEMS), Harbin, China, 11–14 August 2019; pp. 1–6. [Google Scholar]
- Padinharu, D.K.K.; Li, G.J.; Zhu, Z.Q.; Clark, R.; Thomas, A.S.; Azar, Z. System-level investigation of multi-MW direct-drive wind power PM vernier generators. IEEE Access 2020, 8, 191433–191446. [Google Scholar] [CrossRef]
- Tlali, P.M.; Wang, R.-J. PM Vernier machine for utility scale wind generator applications: Design and evaluation. In Proceedings of the 2020 International Conference on Electrical Machines (ICEM), Gothenburg, Sweden, 23–26 August 2020; pp. 2637–2643. [Google Scholar]
- Padinharu, D.K.K.; Li, G.J.; Zhu, Z.Q.; Clark, R.; Thomas, A.; Azar, Z.; Duke, A. Permanent magnet vernier machines for direct-drive offshore wind power: Benefits and challenges. IEEE Access 2022, 10, 20652–20668. [Google Scholar] [CrossRef]
- Kim, B.; Lipo, T.A. Operation and design principles of a PM vernier motor. IEEE Trans. Ind. Appl. 2014, 50, 3656–3663. [Google Scholar] [CrossRef]
- Li, D.; Qu, R.; Li, J.; Xiao, L.; Wu, L.; Xu, W. Analysis of torque capability and quality in vernier permanent-magnet machines. IEEE Trans. Ind. Appl. 2016, 52, 125–135. [Google Scholar] [CrossRef]
- Kim, B.; Lipo, T.A. Design of a surface PM vernier motor for a practical variable speed application. In Proceedings of the 2015 IEEE Energy Conversion Congress and Exposition (ECCE), Montreal, Canada, 20–24 September 2015; pp. 776–783. [Google Scholar]
- Toba, A.; Lipo, T.A. Generic torque-maximizing design methodology of surface permanent-magnet vernier machine. IEEE Trans. Ind. Appl. 2000, 36, 1539–1546. [Google Scholar]
- Heller, B.; Hamata, V. Harmonic Field Effects in Induction Machines; Elsevier Scientific Pub. Co.: Amsterdam, The Netherlands; New York, NY, USA, 1977; 330p. [Google Scholar]
- Skaar, S.E.; Krøvel, O.; Nilssen, R. Distribution, coil-span and winding factors for PM machines with concentrated windings. In Proceedings of the ICEM 2006, Crete Island, Greece, 2–5 September 2006. [Google Scholar]
- Wang, K.; Zhu, Z.Q.; Ombach, G. Synthesis of high performance fractional-slot permanent-magnet machines with coil-pitch of two slot-pitches. IEEE Trans. Energy Convers. 2014, 29, 758–770. [Google Scholar] [CrossRef]
- Jung, S.-Y.; Jung, H.; Hahn, S.-C.; Jung, H.-K.; Lee, C.-G. Optimal design of direct-driven PM wind generator for maximum annual energy production. IEEE Trans. Magn. 2008, 44, 1062–1065. [Google Scholar] [CrossRef]
- Isfahani, A.H.; Boroujerdi, A.H.S.; Hasanzadeh, S. Multi-objective design optimization of a large-scale direct-drive permanent magnet generator for wind energy conversion systems. Front. Energy 2014, 8, 182–191. [Google Scholar] [CrossRef]
- Dmitrievskii, V.; Prakht, V.; Kazakbaev, V. Design optimization of a permanent-magnet flux-switching generator for direct-drive wind turbines. Energies 2019, 12, 3636. [Google Scholar] [CrossRef] [Green Version]
- Potgieter, J.H.J.; Kamper, M.J. Double PM-rotor, toothed, toroidal-winding wind generator: A comparison with conventional winding direct-drive PM wind generators over a wide power range. IEEE Trans. Ind. Appl. 2016, 52, 2881–2891. [Google Scholar] [CrossRef]
- Grauers, A. Design of Direct Driven Permanent Magnet Generators for Wind Turbines. Ph.D. Thesis, School of Electrical and Computer Engineering, Chalmers University of Technology, Göteborg, Sweden, 1996. [Google Scholar]
- Strous, T.D.; Shipurkar, U.; Polinder, H.; Ferreira, J. Comparing the brushless DFIM to other generator systems for wind turbine drive-trains. J. Phys. Conf. Ser. 2019, 753, 112014. [Google Scholar] [CrossRef]
- Li, H.; Chen, Z.; Polinder, H. Optimization of multibrid permanent-magnet wind generator systems. IEEE Trans. Energy Convers. 2009, 24, 82–92. [Google Scholar] [CrossRef]
- Yang, X.; Patterson, D.; Hudgins, J. Permanent magnet generator design and control for large wind turbines. In Proceedings of the 2012 IEEE Power Electronics and Machines in Wind Applications, Denver, CO, USA, 16–18 July 2012; pp. 1–5. [Google Scholar]
- Tsai, W.-C. Robust design of a 5 MW permanent magnet synchronous generator using Taguchi method. In Proceedings of the 2012 7th International Conference on Computing and Convergence Technology, Seoul, Korea, 3–5 December 2012; pp. 1328–1334. [Google Scholar]
- Pastellides, S.G.; Gerber, S.; Wang, R.-J.; Kamper, M.J. Evaluation of drive cycle-based traction motor design strategies using gradient optimisation. Energies 2022, 15, 1095. [Google Scholar] [CrossRef]
- Deb, K.; Pratap, A.; Agarwal, S.; Meyarivan, T. A fast and elitist multiobjective genetic algorithm: NSGA-II. IEEE Trans. Evol. Comput. 2002, 6, 182–197. [Google Scholar] [CrossRef] [Green Version]
- Johnson, M.; Gardner, M.C.; Toliyat, H.A.; Englebretson, S.; Ouyang, W.; Tschida, C. Design, construction, and analysis of a large-scale inner stator radial flux magnetically geared generator for wave energy conversion. IEEE Trans. Ind. Appl. 2018, 54, 3305–3314. [Google Scholar] [CrossRef]
- Mthombeni, T.L.; Pillay, P. Physical Basis for the variation of lamination core loss coefficients as a function of frequency and flux density. In Proceedings of the 32nd Annual Conference on IEEE Industrial Electronics (IECON), Paris, France, 6–11 November 2006; pp. 1381–1387. [Google Scholar]
- Ionel, D.M.; Popescu, M.; Dellinger, S.J.; Miller, T.J.E.; Heideman, R.J.; McGilp, M.I. On the variation with flux and frequency of the core loss coefficients in electrical machines. IEEE Trans. Ind. Appl. 2006, 42, 658–667. [Google Scholar] [CrossRef] [Green Version]
Publisher’s Note: MDPI stays neutral with regard to jurisdictional claims in published maps and institutional affiliations. |
© 2022 by the authors. Licensee MDPI, Basel, Switzerland. This article is an open access article distributed under the terms and conditions of the Creative Commons Attribution (CC BY) license (https://creativecommons.org/licenses/by/4.0/).