Article

Effects of Coating on the Electrochemical Performance of a Nickel-Rich Cathode Active Material

1
Advanced Energy and Manufacturing Laboratory, Department of Mechanical Engineering, University of Akron, Akron, OH 44325, USA
2
Schaeffler Group, Wooster, OH 44691, USA
*
Authors to whom correspondence should be addressed.
Energies 2022, 15(13), 4886; https://doi.org/10.3390/en15134886
Submission received: 8 June 2022 / Revised: 27 June 2022 / Accepted: 28 June 2022 / Published: 3 July 2022
(This article belongs to the Special Issue Lithium-Ion Batteries: Latest Advances, Challenges and Prospects)

Abstract

:
Due to their safety and high power density, one of the most promising types of all-solid-state lithium batteries is the one made with the argyrodite solid electrolyte (ASE). Although substantial efforts have been made toward the commercialization of this battery, it is still challenged by some technical issues. One of these issues is to prevent the side reactions at the interface of the ASE and the cathode active material (CAM). A solution to address this issue is to coat the CAM particles with a material that is compatible with both ASE and CAM. Prior studies show that the lithium niobate, LiNbO3, (LNO) is a promising material for coating CAM particles to reduce the interfacial side reactions. However, no systematic study is available in the literature to show the effect of coating LNO on CAM performance. This paper aims to quantify the effect of LNO coating on the electrochemical performance of a nickel-rich CAM. The electrochemical performance parameters that are studied are the capacity, cycling performance, and rate performance of the coated-CAM; and the effectiveness of the coating to prevent the side reactions at the ASE and CAM interface is out of the scope of this study. To eliminate the effect of side reactions at the ASE and CAM interface, we conduct all tests in the organic liquid electrolyte (OLE) cells to solely present the effect of coating on the CAM performance. For this purpose, 0.5 wt.% and 1 wt.% LNO are used to coat the LiNi0.6Mn0.2Co0.2O2 (NMC-60) CAM through two synthesizing methods. Consequently, the effects of the synthesizing method and the coating weight percentage on the NMC-60 performance are presented.

1. Introduction

In traditional commercial lithium-ion batteries (LIBs), the use of liquid electrolytes containing flammable organic solvents creates potential safety issues [1]. All-solid-state lithium batteries (ASSLB), on the other hand, utilize intrinsically safe solid-state electrolytes [2,3]. Hence, they are considered safe next-generation battery systems, especially for applications in electric vehicles (EVs). There are several types of ASSLBs, depending on the type of solid-state electrolyte used to make the battery. Among all types of solid-state electrolytes, the argyrodite electrolyte (ASE), for example, Li6PS5Cl0.5Br0.5 (LPSCB), is considered one of the most promising electrolytes due to its high ionic conductivity and special mechanical properties [4]. The high ionic conductivity makes this solid electrolyte suitable for applications where high power density is required, for example, in hybrid electric vehicles (HEVs).
Significant efforts have been devoted toward the development of ASE-type ASSLBs by researchers. However, some technical issues still need to be addressed before the commercialization of these batteries. Some of these issues are (1) the interfacial resistance between the ASE and the cathode active material (CAM) in the cathode that causes an increase in the cathode ohmic resistance, consequently, the battery capacity decreases and the heat generation in the battery increases, (2) the side-reactions at the interface of the ASE and CAM that causes fast battery degradation, and (3) the scalability for large-scale manufacturing [4,5]. As proposed by Divakaran et al. [6] and other researchers, one practical method to suppress side reactions at the interface of the ASE, such as LPSCB, and CAM, such as lithium nickel manganese cobalt oxide (NMC) or lithium nickel cobalt aluminum oxide (NCA), is to coat them with a material that is not only ionically conductive and acts as a second electrolyte, but also it is compatible with ASE, CAM, conductive material, and cathode current collector [6,7]. The interface between the coating material and each of these materials is schematically shown in Figure 1.
Several coating materials and procedures have been developed by researchers to suppress the interfacial side reactions between the electrolyte and electrode active materials. However, the addition of a surface coating layer can negatively impact ionic conductivity and decrease the cathode capacity and the rate performance [8]. Accordingly, researchers have reported compounds containing lithium as viable candidates for the coating of nickel-rich metal oxides because of their low impedance, increased ionic conductivity, and increased chemical stability [9,10]. Some compounds that have shown promise in resolving these issues are Li2ZrO3, LiAlO2, Li2TiO3, and LiNbO3 [11,12,13,14]. Lithium niobate, LiNbO3, (LNO) has been suggested as a suitable coating material in several studies [3,14,15]. Due to its low detriment to conductivity [16,17], LNO has recently proven to be a viable transition metal oxide contender for coating as it increases Li+ mobility at the cathode surface. Additionally, due to its high thermal stability, LNO allows for operation at high temperatures for long periods of time without negative levels of dissolution. Despite the above-mentioned benefits, the effects of coating this material, along with its synthesis methods and coating thicknesses, on the performance of CAM still need to be systematically investigated.
Various methods can be employed to deposit coatings on the surface of cathode active material particles. Examples of methods that have been utilized by researchers for this purpose are dry coating, atomic layer deposition (ALD), and wet mixing [18,19,20,21]. Among these processes to coat NMC with LNO, the application of a relatively simple wet process followed by heat treatment has shown merits, while ALD is also promising. The procedure for this method is simple enough that issues of scalability for mass manufacturing can be resolved. The initial step of the wet process method involves the dissolution of LNO precursors in a solvent. Mereacre et al. [22] have shown that along with this solvent the addition of hydrogen peroxide might improve the LNO coating through surface activation [22]. Li et al. [20] investigated the effect of LNO coating on nickel-rich NMC using a wet mixing method followed by heat treatment. Their study into NMC structure and particle morphology showed that LNO-coated NMC was very stable and presented a uniform coating on NMC particles. By evaluating the effects of LNO coating on the chemical, structural, and thermal stability of nickel-rich NMC, it was proven that LNO coating can improve the electrochemical performance of the cathode, especially at elevated temperatures [20]. Furthermore, there is much flexibility regarding heat treatment of the coated NMC. As shown by Kim et al. [21], the development of the LNO surface coating is contingent upon the sintering temperature. Kim et al. [21] sought several benefits from coating NMC with LNO, which were namely chemical, structural, and thermal stability. For their study, when LNO coating was heated at 450 °C, it was amorphously present on the surface of NMC. However, it showed crystallinity when heated at 800 °C. They found that desirable properties were provided by both the crystalline and amorphous structures. However, these valuable properties were found to a larger degree in the crystalline coating than in the amorphous coating [21].
There is not any systematic study in the literature to show the effect of coating LNO material on the CAM performance. This paper aims to quantify the effect of LNO coating on the electrochemical performance of the nickel-rich LiNi0.6Mn0.2Co0.2O2 (NMC-60) cathode active material. The electrochemical performance parameters that are studied are the capacity, cycling performance, and rate performance of the LNO-coated NMC-60. It is noted that the study on the effectiveness of the coating to prevent side reactions at the ASE and CAM interface is out of the scope of this paper. To eliminate the effect of the ASE and CAM side reactions, we conduct all tests in the organic liquid electrolyte (OLE) environment to solely study the effect of coating on the NMC-60 material performance. It is also noted that the reason for coating the CAM is to use them in the ASE-type ASSLBs, rather than increasing the CAM performance to use it in conventional OLE-type LIBs. The only reason that we choose testing cells in the OLE environment is to separate the effect of side reactions at the interface of the ASE and CAM from the effect of the LNO coating layer on the NMC-60 material performance. For this purpose, we (a) compare two methods of synthesizing and coating LNO on nickel-rich NMC-60 cathode active material, and (b) evaluate the effects of coating thickness on the capacity, cycling performance, and rate performance of the coated-NMC-60. This study not only helps to fabricate high-performance solid-state lithium batteries, but it also aids several other studies such as modeling solid-state lithium batteries for investigation of cell operating voltage and capacity [23], microstructure heterogeneity [24], battery energy efficiency [25], and designing an appropriate cooling system for the battery [26].

2. Materials and Methods

To synthesize the LNO coating, the following chemical reaction was utilized.
1   CH 3 CH 2 OLi + 1   Nb ( CH 3 CH 2 O ) 5 + 3 H 2 O 1   LiNbO 3 + 6   CH 3 CH 2 OH
The synthesizing and coating methods of LNO that we used in this study are briefly explained below.
Method-I: For coating NMC-60 using Method-I, appropriate amounts of lithium ethoxide (CH3CH2OLi, 95%, Sigma-Aldrich, St. Louis, MO, USA) and niobium ethoxide (Nb(CH3CH2O)5, 99%, Sigma-Aldrich) are dissolved in dry isopropanol (99%, Sigma-Aldrich) and continuously stirred at room temperature for 10 min. Then, NMC-60 is added to the solution and mixed at 80 °C until evaporation.
Method-II: In this method, lithium ethoxide (CH3CH2OLi, 95%, Sigma-Aldrich) and niobium ethoxide (Nb(CH3CH2O)5, 99%, Sigma-Aldrich) are mixed in dry ethanol (99%, Sigma-Aldrich) and hydrogen peroxide (H2O2, 30%, Sigma-Aldrich). After dissolution of precursors under stirring for 10 min, NMC-60 is added to the solution and mixed at 100 °C until evaporation.
For both methods, the resulting dried powders are placed in zirconia combustion boats (AdValue Technology) and sealed in a quartz tube furnace (GSL-1100X, MTI Corporation). Powders are then annealed under flowing O2 atmosphere at 450 °C for 1 h with a ramp of 5 °C/min. The coated powders are collected, ground, and kept overnight at 100 °C in a vacuum oven before making electrodes.

3. Coating Formulations

The entire mass of coating material does not participate in forming a solid and dense coating layer on the surface of CAM particles and remains as loosely connected LNO to CAM particles or agglomerated LNO as impurities in the obtained coated-CAM. Hence, we define the coating efficiency as the ratio of the mass of the dense coating layer to the total mass of the coating material as stated in Equation (1).
η c o a t i n g = m D C L m C A M
where, η c o a t i n g is the coating efficiency and m is the mass. The subscripts of DCL and CAM denote the dense coating layer and cathode active material, respectively. For one of the samples of 1 wt.% of LNO coating on NMC-60, we did the transmission electron microscopy (TEM) characterization at Argonne National Laboratory, Center for Nanoscale Materials (CNM). Based on the TEM image in Figure 2, the thickness of the dense coating layer on the NMC-60 is about 14 nm, while the 1 wt.% LNO is enough to make a 21 nm coating layer. Therefore, about two-thirds of the theoretical LNO thickness is formed as a dense coating layer. The other one-third of LNO material remains as loosely connected to NMC-60, or agglomerated LNO as impurities in the obtained coated-NMC-60. If required, the loosely connected LNO and the LNO impurities may be removed by rinsing the coated-NMC after the coating process is done. Therefore, we assume a coating efficiency of 66% for the calculation of the LNO coating layer thickness, which may be only valid for our lab with its available equipment and technology. It is also noted that the thickness of the LNO coating on the NMC-60 may not be uniform. This may affect the value of the coating efficiency.
The mass fraction ratio (MFR) of the coating material (LNO in this study) and the uncoated active material (NMC-60 in this study) is defined in Equation (2).
M F R   =   M F C M M F C A M   =   m C M / m t o t m C A M / m t o t   =   m C M m C A M   =   1 η c o a t i n g   ×   m D C L m C A M   =   1 η c o a t i n g   ×       ρ C M N p , i V D C L , i   ρ C A M N p , i   V a m , i   =   1 η c o a t i n g   ×   ρ C M ρ C A M   ×     N p , i π D C A M , i 2 δ D C L   N p , i   π 6 D C A M , i 3   =   1 η c o a t i n g   ×   ( 6 ρ C M ρ C A M   ×     N p , i D C A M , i 2   N p , i   D C A M , i 3 ) δ D C L   =   1 η c o a t i n g   ×   ( 6 ρ C M ρ C A M   ×   D s , C A M 2 D v , C A M 3 ) δ D C L
where, MF is the mass fraction, ρ is the density, Np is the number of CAM particles, V is the volume, and δDCL is the dense coating thickness on the active material. The subscripts of s and v denote the diameter of uncoated CAM, the surface mean diameter of particles, and the volume mean diameter of particles, respectively. The density of the LNO and NMC are approximately 4.65 g/cm3 and 4.76 g/cm3, respectively.
To calculate the MFR, we need to determine the surface mean and volume mean diameters of uncoated CAM particles. For this purpose, the morphology of the NMC-60 was determined using Tescan Lyra 3 XMU scanning electron microscopy (SEM) at an operating voltage of 15 kV with an EDAX Element energy-dispersive X-ray spectroscopy (EDX) detector. The SEM image of the uncoated NMC-60 is taken as shown in Figure 3a. As seen, the shape of particles is close to a sphere. Thus, to obtain the sizes of particles, we assumed that the particles are spherical, and using the ImageJ software, we measured the diameter of more than 300 particles of NMC-60. Then, the measured particles are divided into several intervals and the histogram of the particle size distribution is plotted. Based on the obtained histogram, it was determined that a log-normal distribution is the best fit to the size distribution of NMC-60 particles, as shown in Figure 3b.
The surface mean and volume mean diameters for the log-normal distribution are determined from Equations (3) and (4), respectively. For details, the readers are referred to the authors’ other publications in Ref. [27].
D s = (   N p i D i 2 N p ) 1 / 2 = D 50 e x p ( ( l n ( D 84.13 D 50 ) ) 2 )
D v = (   N p i D i 3 N p ) 1 / 3 = D 50 [ e x p ( ( l n ( D 84.13 D 50 ) ) 2 ) ] 1.5
where, Ds is the surface mean diameter, Dv is the volume mean diameter, D50 is the median diameter, and D84.15 is the diameter that 84.15% of particles are smaller than. The D50 and D84.15 are determined by analyzing SEM images of NMC-60 particles using ImageJ software. For NMC-60, we obtained D50 and D84.15 are 10.9 μm and 13.7 μm, respectively. Finally, we calculated that the Ds and Dv are 11.5 μm, and 11.8 μm, respectively.
For preparation of the LNO coated NMC-60 with the desired coating thickness, whether using Method-I or Method-II, the mass fraction of initial materials for CH3CH2OLi, Nb(CH3CH2O)5, and uncoated NMC-60 are obtained from Equations (5)–(7).
M F CH 3 CH 2 OLi = M W CH 3 CH 2 OLi M W LNO × ( 1 + 1 M F R ) 1
M F Nb ( CH 3 CH 2 O ) 5 = M W Nb ( CH 3 CH 2 O ) 5 M W LNO × ( 1 + 1 M F R ) 1
M F NMC _ 60 = 1 1 + M F R
The molecular weights of CH3CH2Oli, Nb(CH3CH2O)5, and LNO are 52.0 g/mol, 318.21 g/mol, and 147.85 g/mol, respectively.

4. Electrode and Cell Fabrication and Testing

Several OLE-type half-cell cathodes with mass loading of ~7 mg/cm2 were made to evaluate and compare the performance of the coated and uncoated NMC-60. The cathodes were made from four types of coated NMC-60: 0.5% LNO coated NMC-60 using Method-I (Method-I-0.5%), 1% LNO coated NMC-60 using Method-I (Method-I-1%), 0.5% LNO coated NMC-60 using Method-II (Method-II-0.5%), and 1% LNO coated NMC-60 using Method-II (Method-II-1%). First, a 6 wt.% PVDF (Sigma-Aldrich) solution is made by dissolution in NMP (99.5%, Sigma-Aldrich) and allowed to mix. A cathode slurry comprising of 90 wt.% active material, 5 wt.% conductive material and 5 wt.% binder was then made. The appropriate amounts of acetylene black (MTI corporation) and the PVDF solution were mixed in a planetary centrifugal mixer. One-third of the coated active material is then mixed with the acetylene black and PVDF solution. This step is repeated until the total amount of active material has been added and mixed. Then, several coin type half cells were fabricated using the OLE (LiPF6), coated NMC-60 as the cathode, and the lithium metal as anode (reference electrode) with a separator in between.
Before testing the half-cells, a formation process was completed. For the rate performance test, we cycled the cathode half-cells at c-rates of C/10, C/5, C/3, 1C, 2C, and C/10, with five cycles at each C-rate (CC C/25 CV Charge; Discharge: No CV mode). The C-rate is defined as the rate at which a cell completely discharges its maximum capacity. To test half-cells using NMC-60 as cathode, a theoretical maximum capacity of 178 mAhg−1 is assumed.

5. Results and Discussion

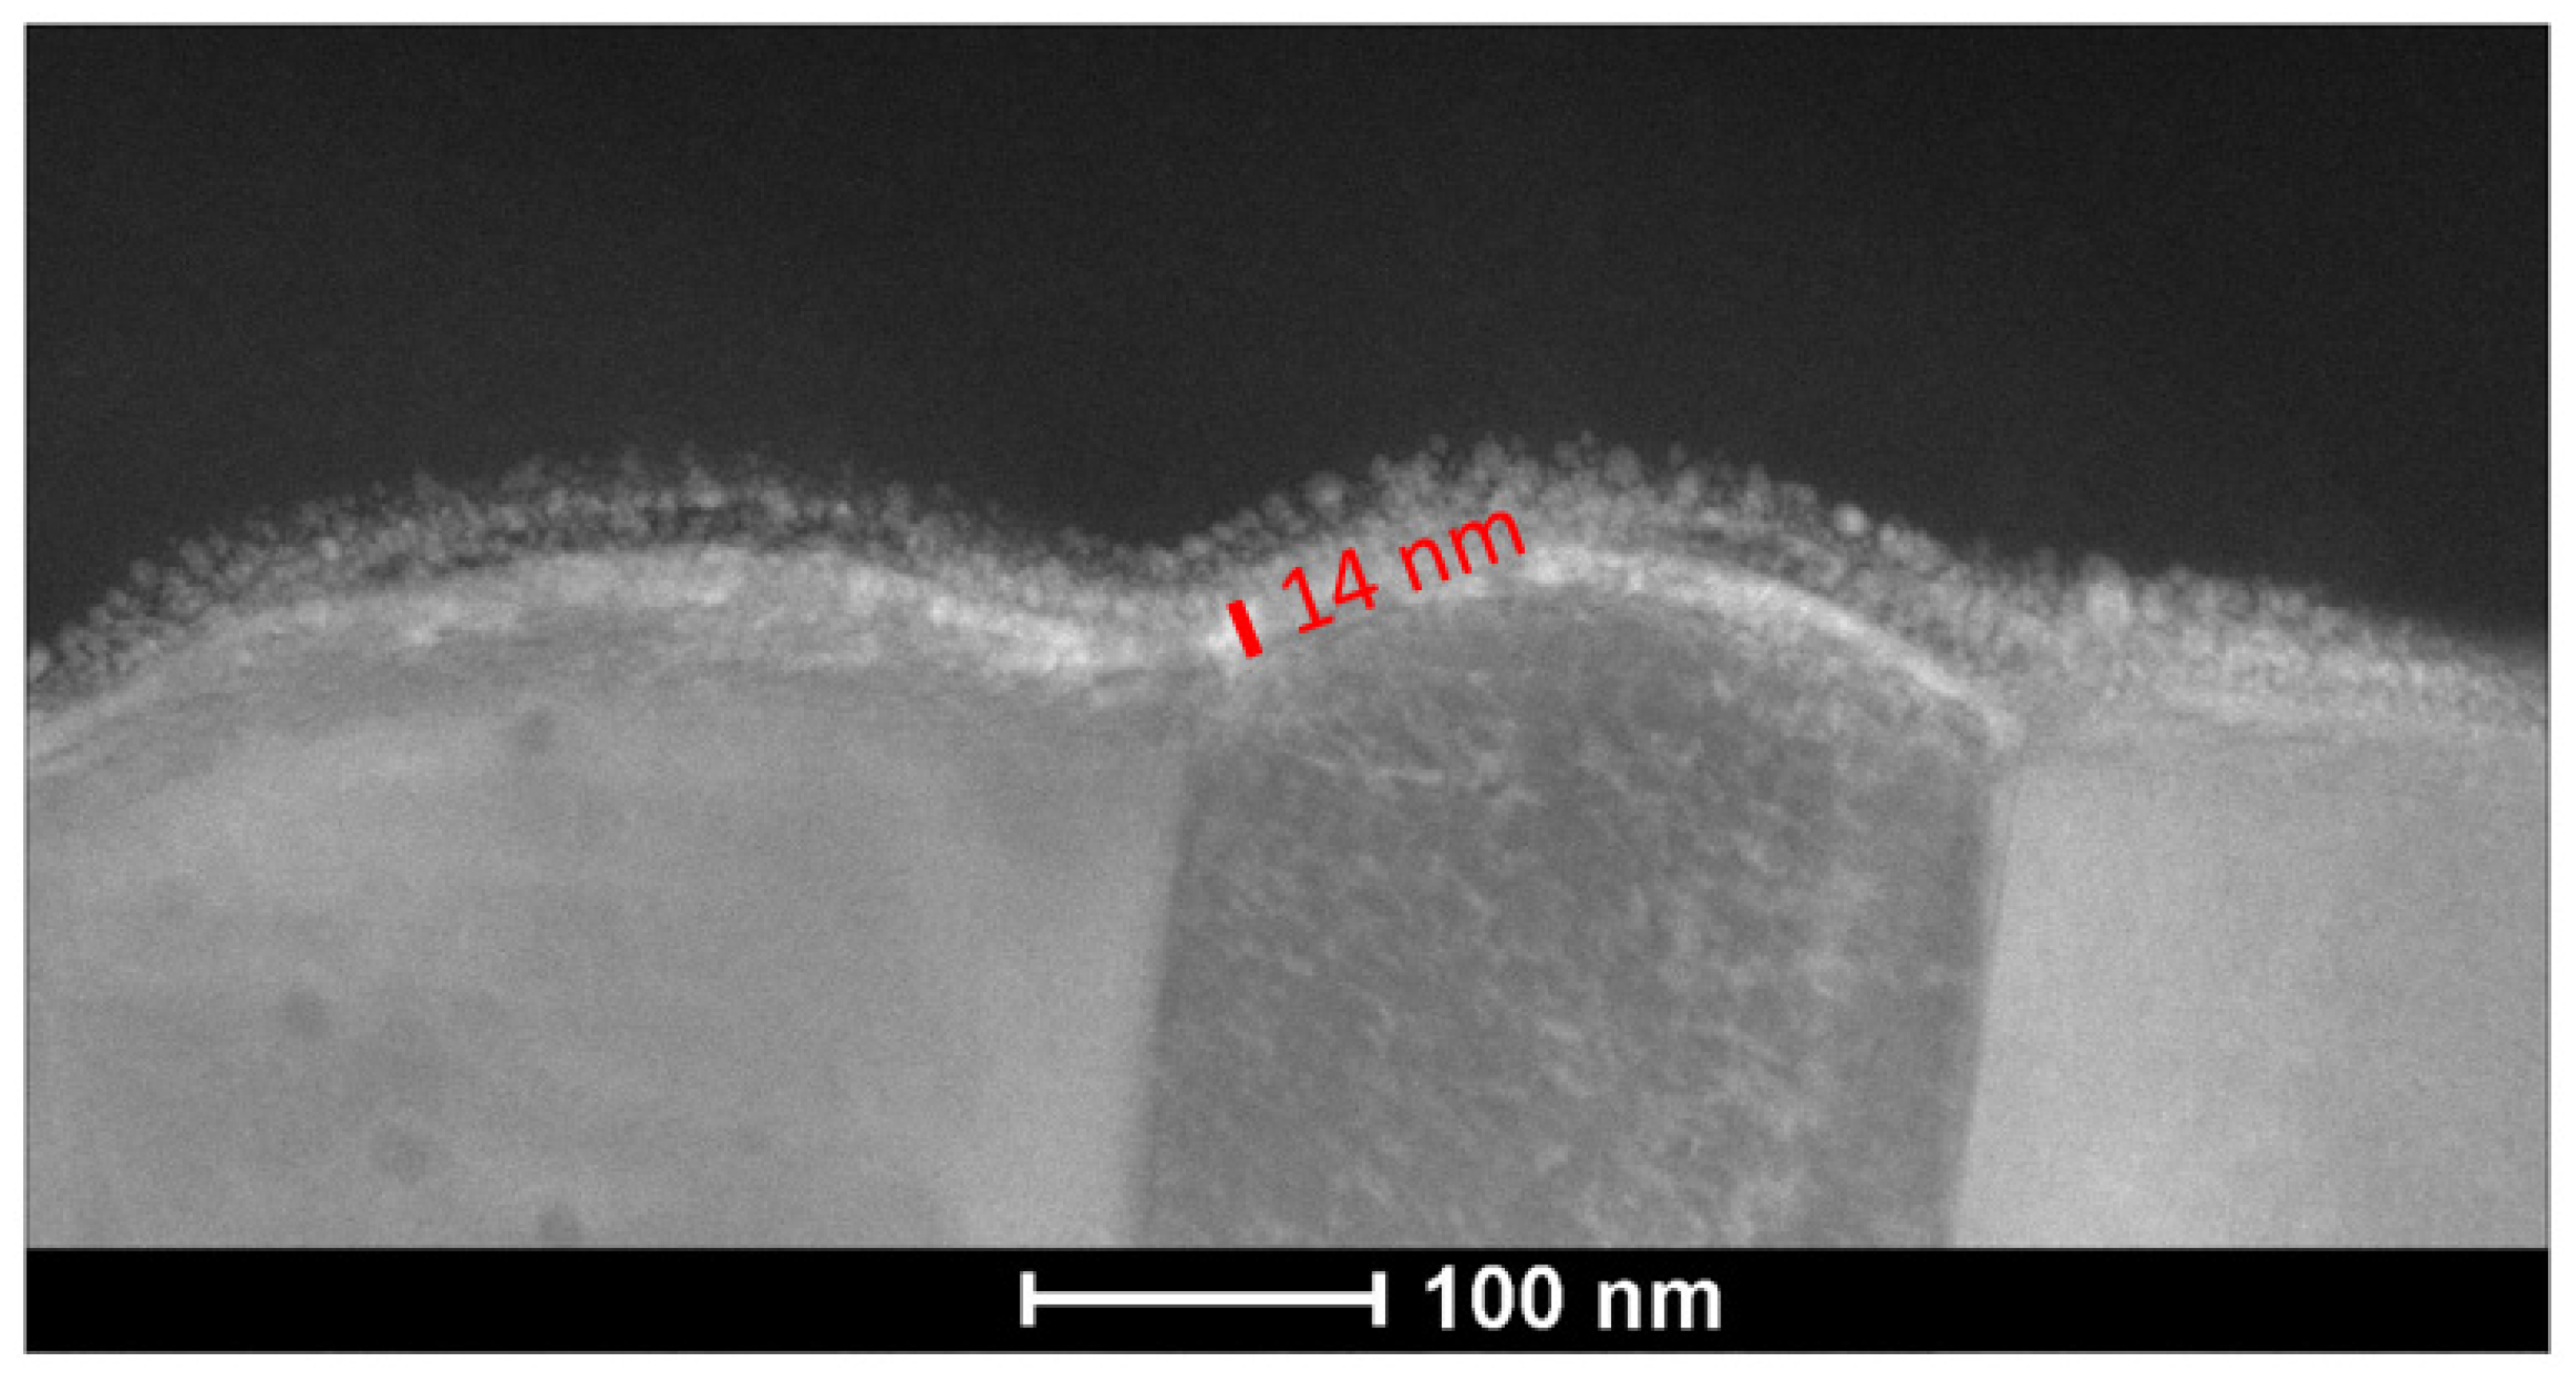
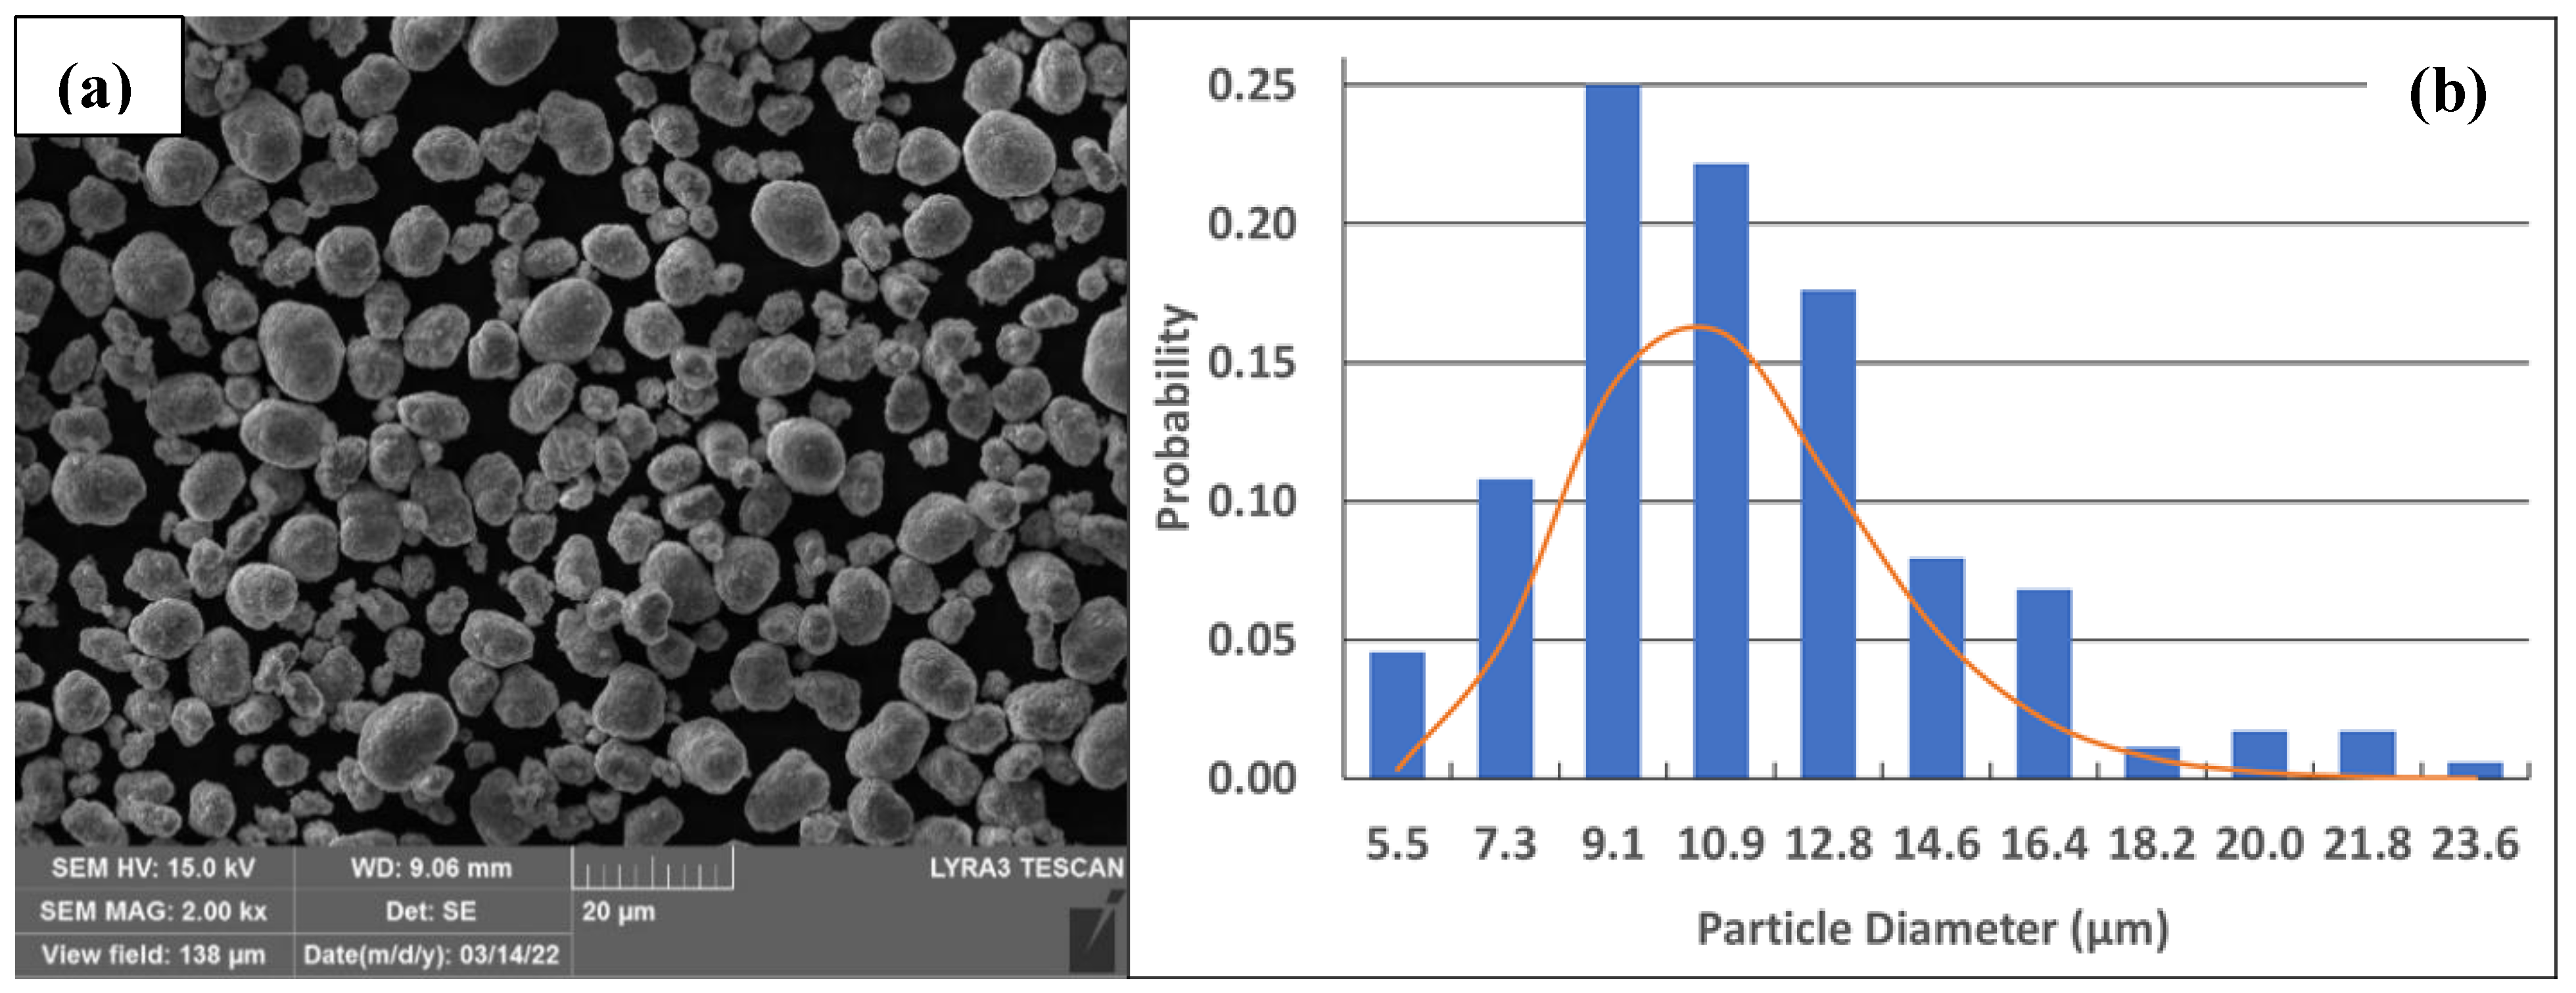
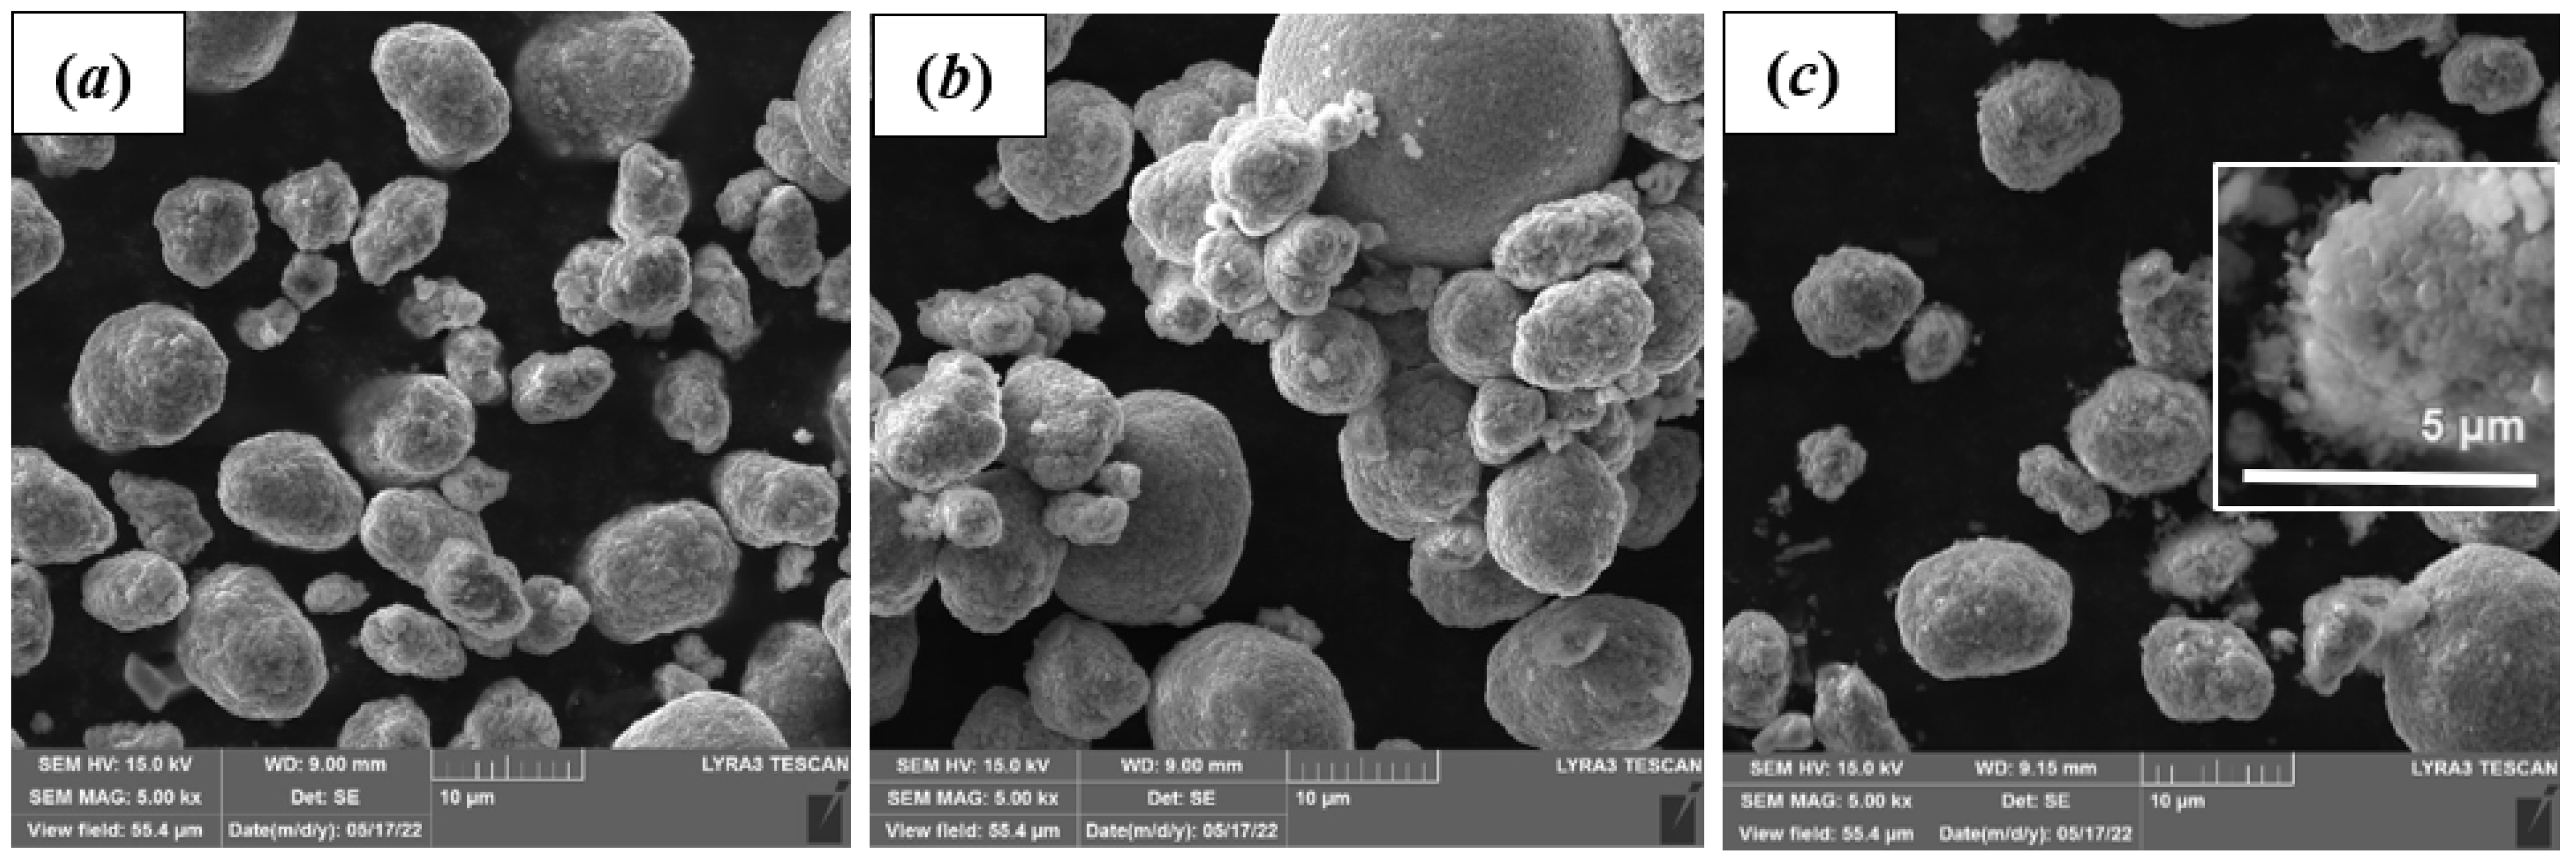
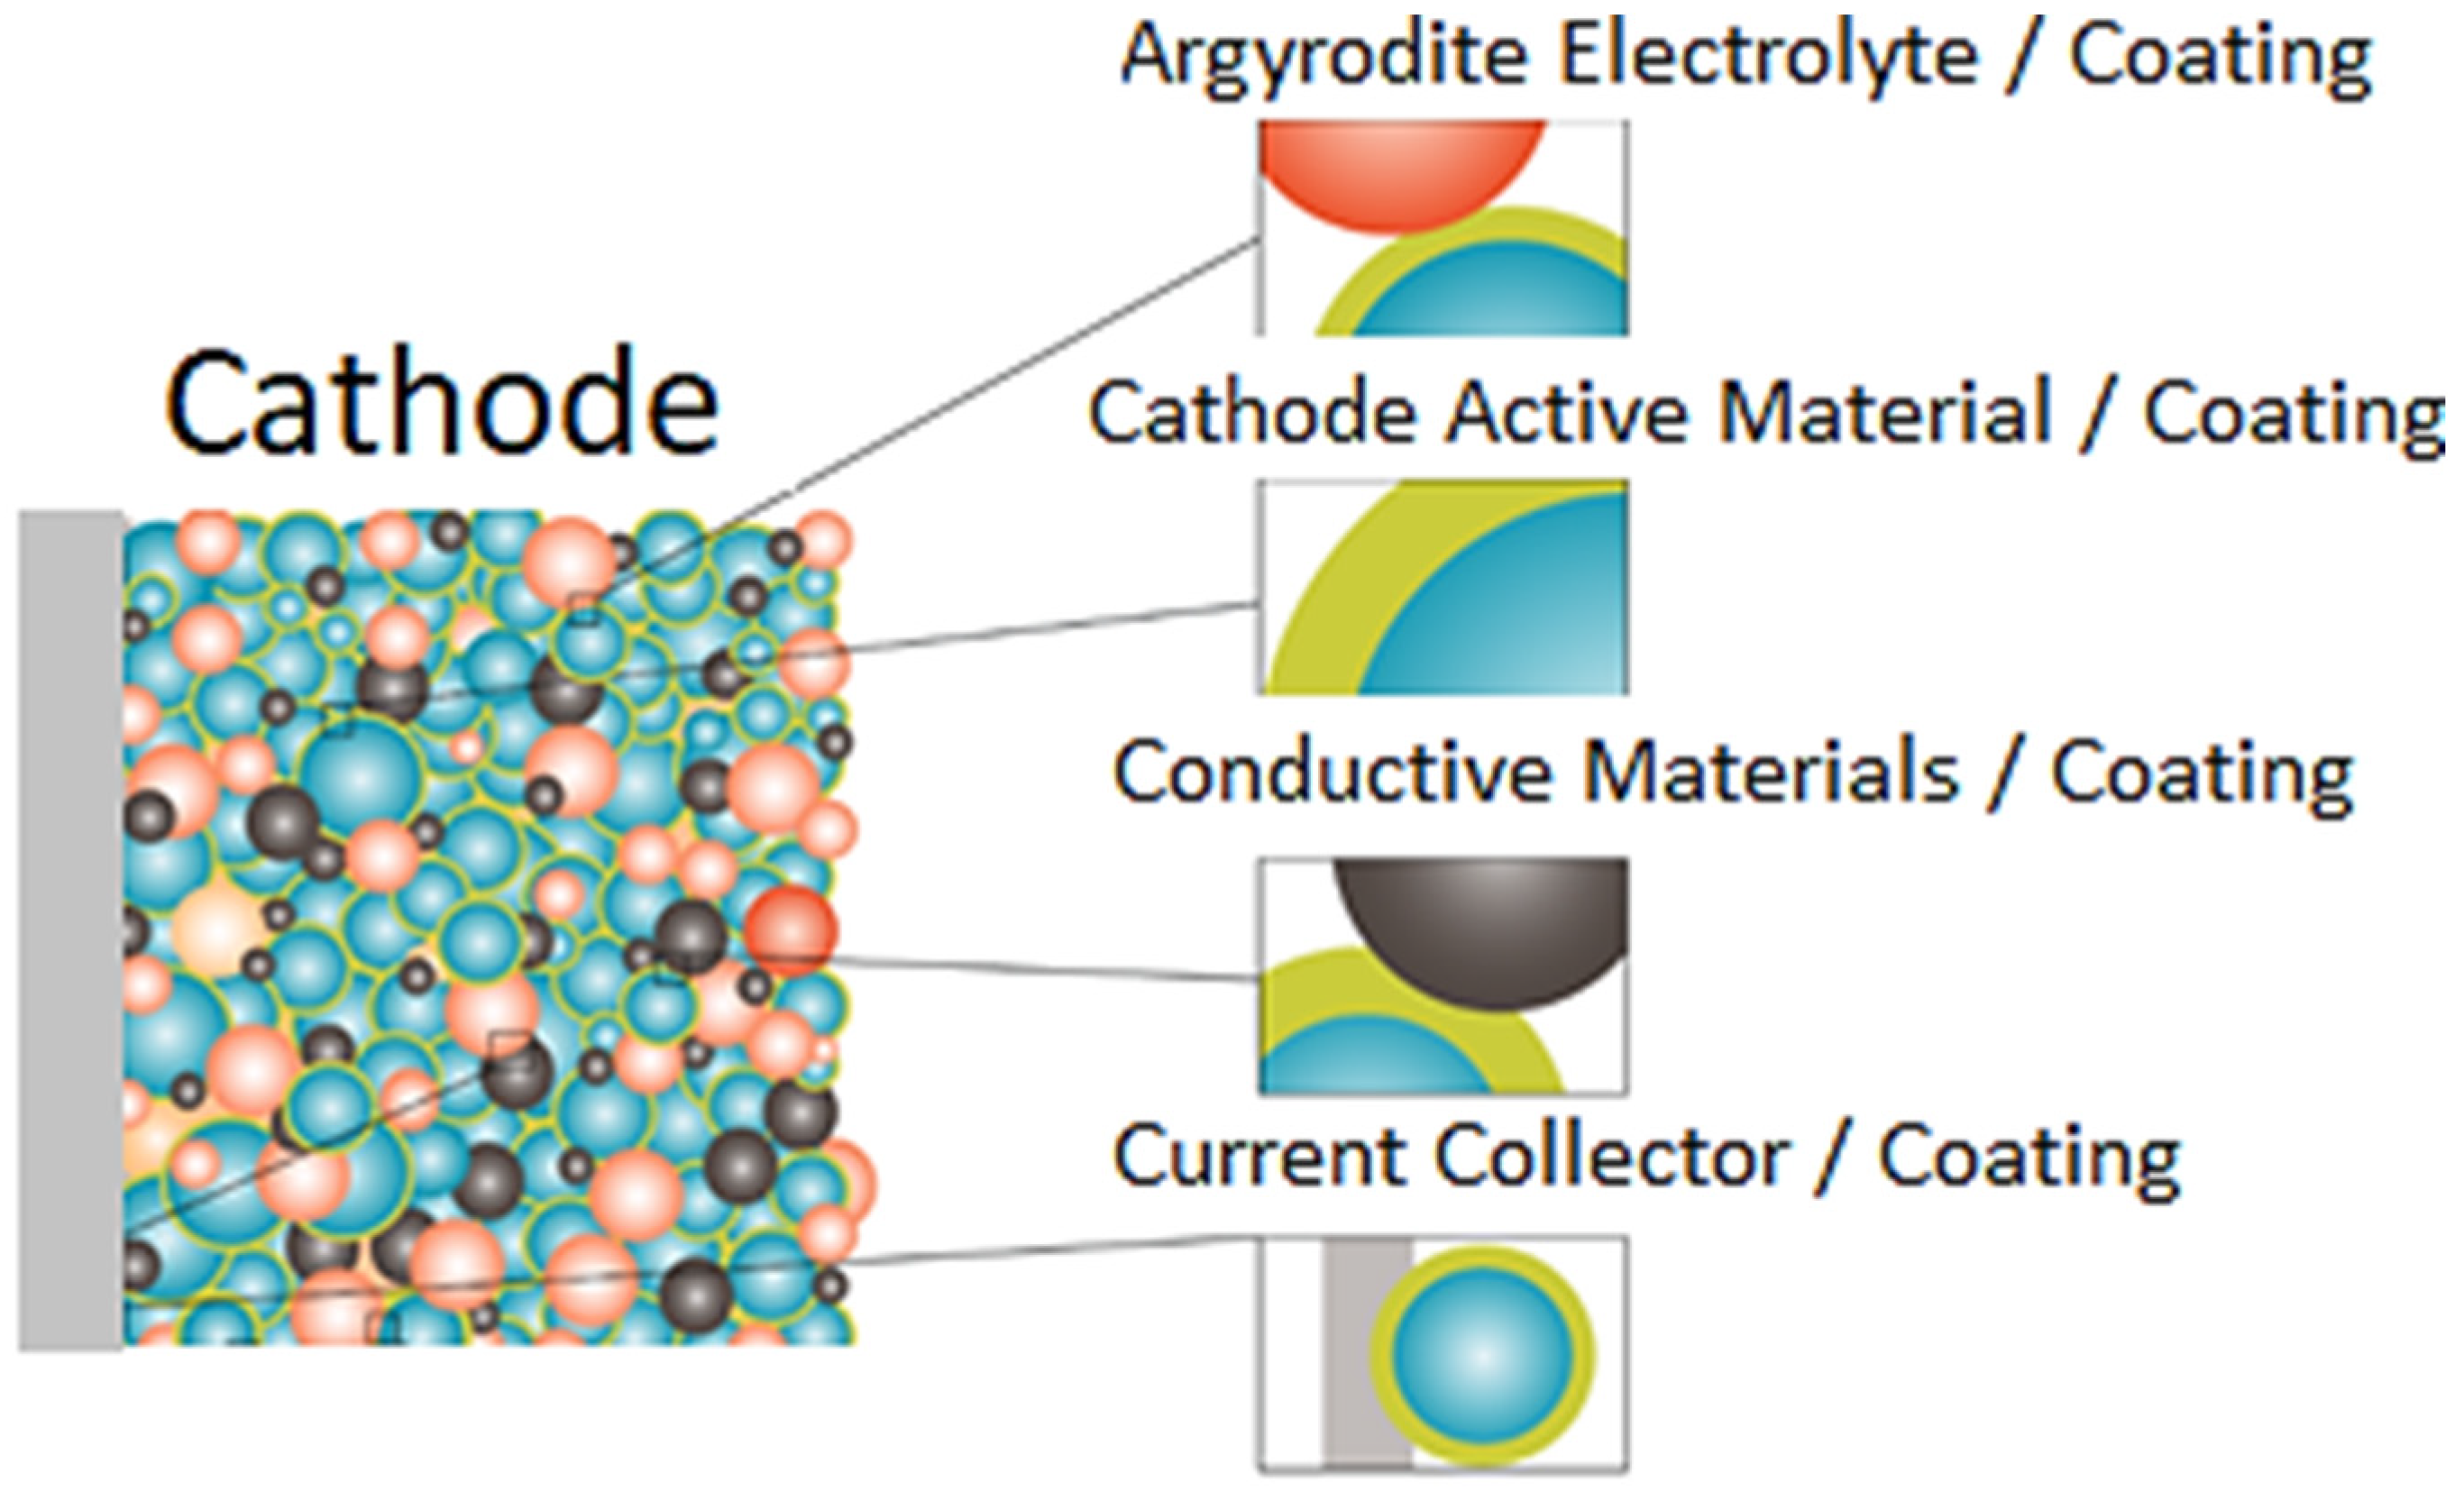
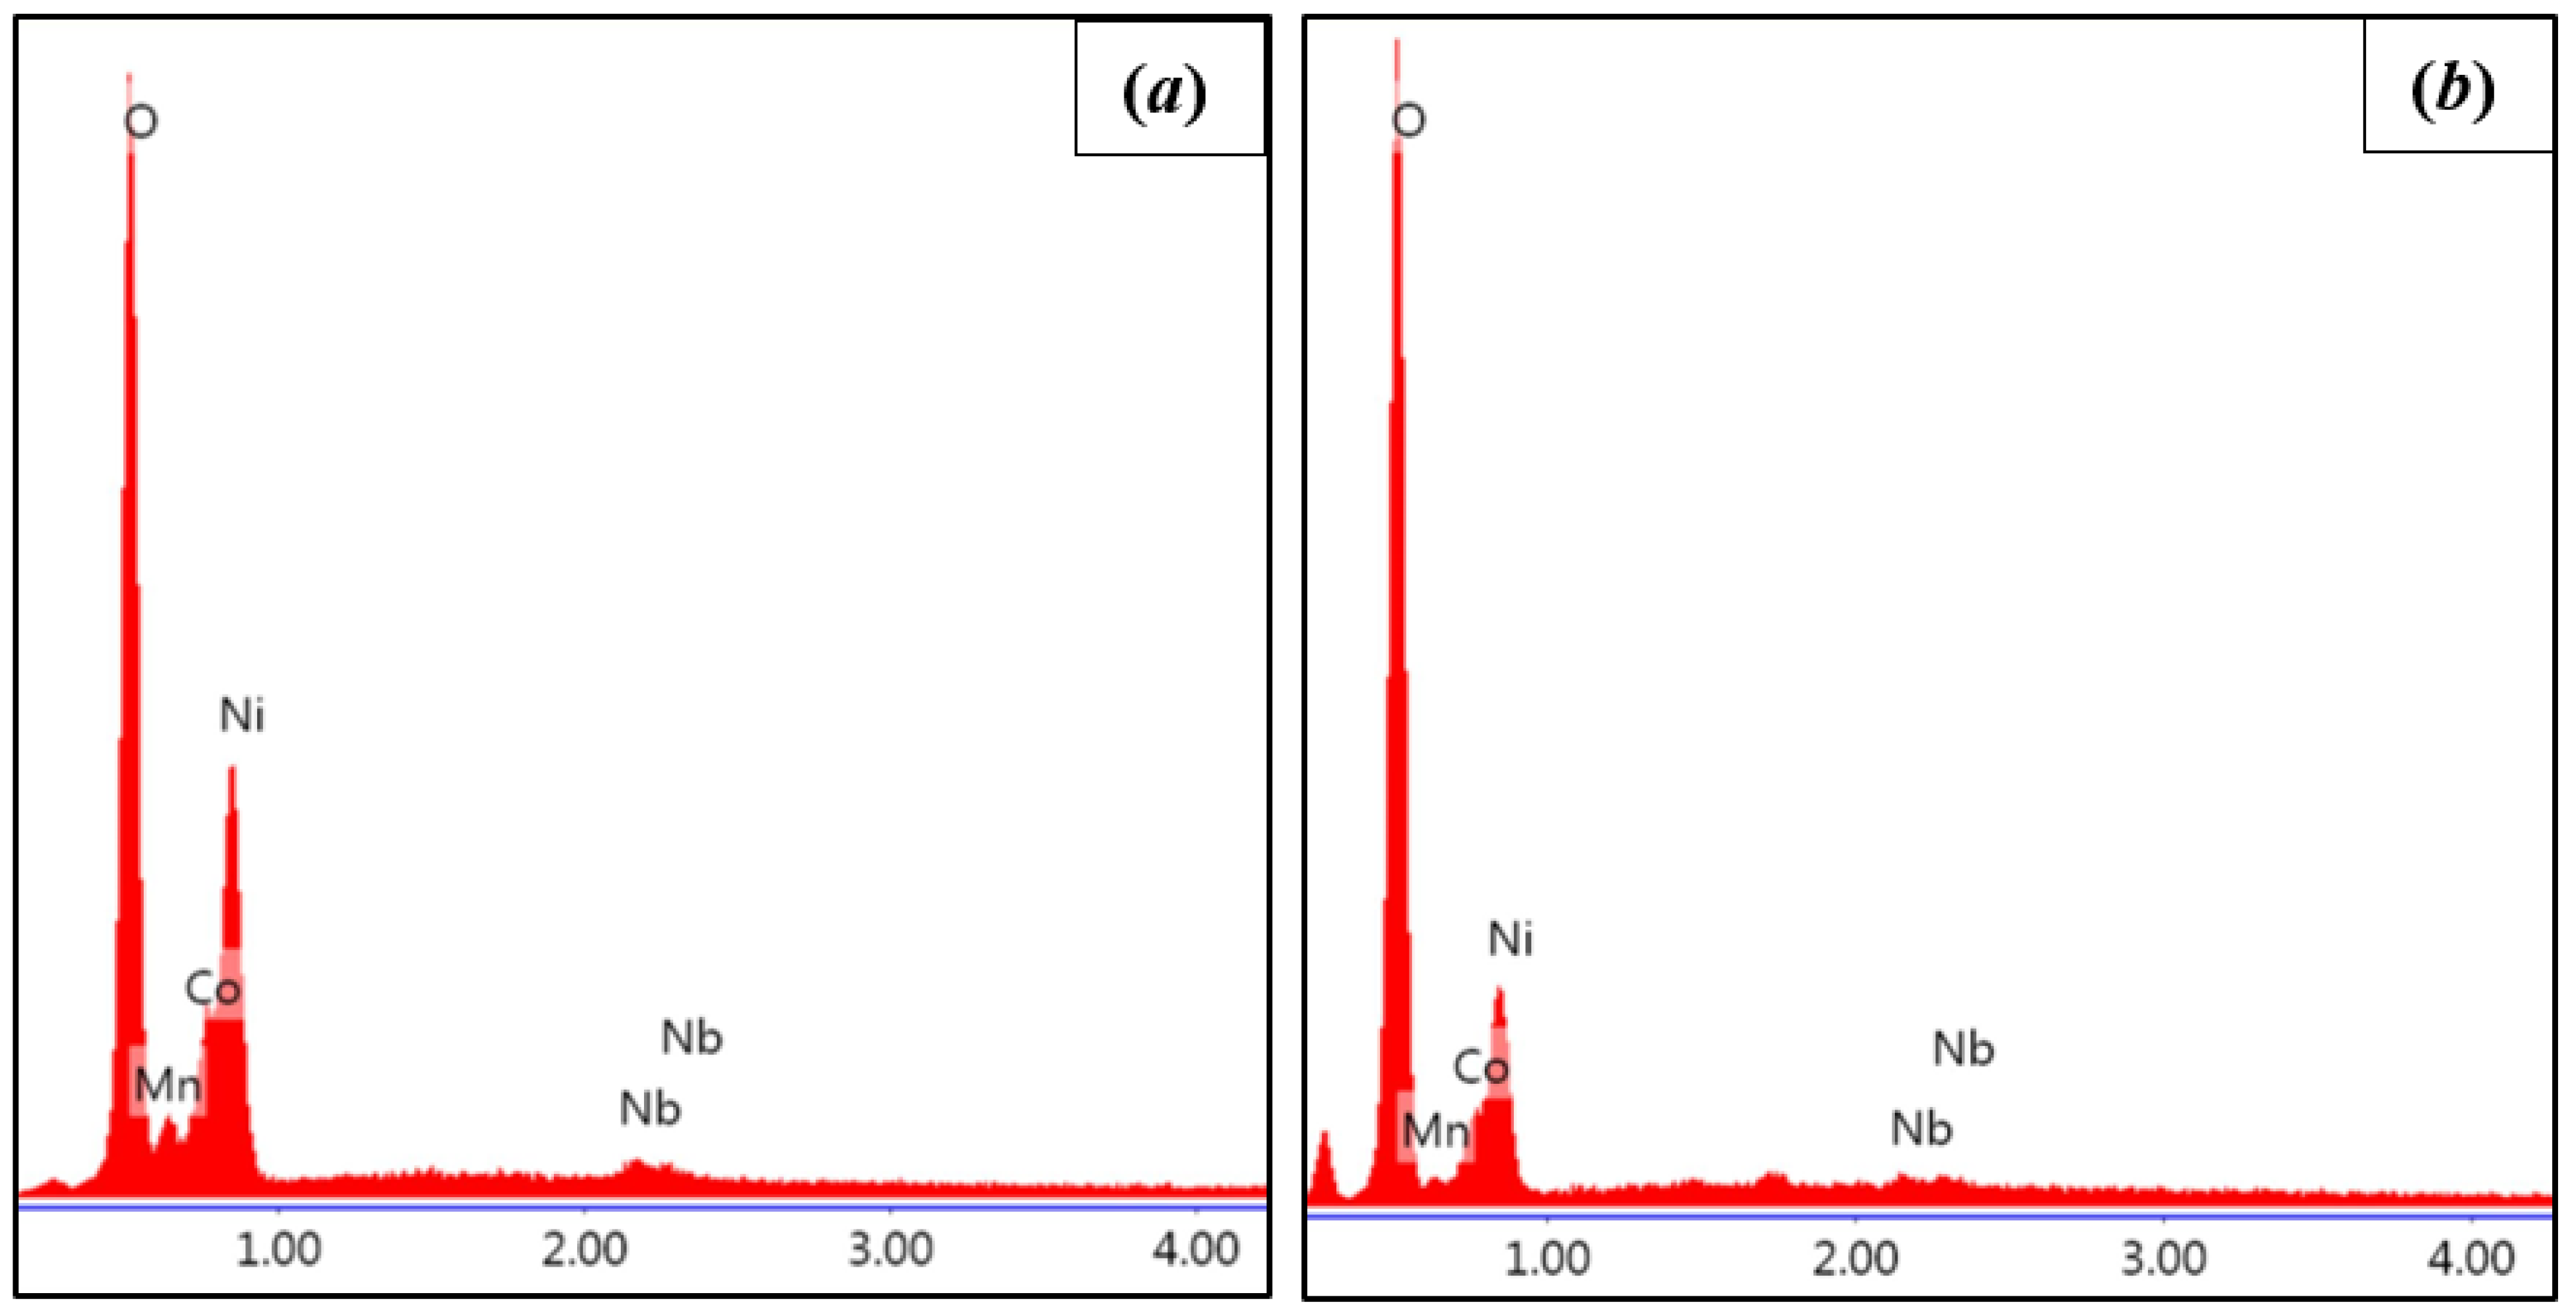
5.1. Coating Formation

The mass fractions of initial materials for coating NMC-60 were calculated from the desired coating thickness and shown in Figure 4. The red and orange lines in this figure represent the mass fractions of lithium ethoxide and niobium ethoxide in the synthesizing process, respectively. The green line indicates the mass fraction of the total LNO coating material synthesized, while the blue line indicates the mass fraction of LNO participated to form the dense coating layer on NMC-60 particles. The LNO that has not participated in formation of the dense coating layer remains as loosely connected LNO to NMC-60 particles, or agglomerated LNO as impurities in the obtained coated- NMC-60, as demonstrated in red circles in Figure 5.
The SEM images was used to evaluate the morphology of LNO coating on NMC-60 using Method-I and Method-II. A comparison of changes in morphology between uncoated NMC-60, Method-I-1%, and Method-II-1% can be seen through the SEM images in Figure 6a–c, respectively. As shown in Figure 6a, the uncoated NMC-60 appears to have particles that are mostly spherical with some irregular edges. On the other hand, images of the coated NMC-60 show, in appearance, a white material sitting on the surface of particles. This is most clearly seen on the large particles of Method-I coated NMC-60 in Figure 6b. Method-I also showed agglomeration of secondary particles, which is not present in uncoated NMC-60 nor Method-II-1%. It is essential to note how the primary and secondary particles become less defined for the coated powders when compared to uncoated NMC-60. For instance, in the Method-II coating, the white material appearing in the images of the coated NMC-60 takes on a feathery appearance, which covers the entirety of some NMC particles. An enlarged image of a particle which exhibits this phenomenon is inset in Figure 6c. Figure 7 shows the corresponding EDX analysis for SEM imaging of the coated particles. Formation of LNO coating on NMC-60 particles is indicated through the presence of niobium elemental peaks for Method-I and Method-II, respectively.
The powder XRD measurements were taken using Rietveld analysis to compare the effect of LNO coating on NMC-60. Patterns of uncoated and 1% LNO coated NMC-60 using Method-I and Method-II are shown in Figure 8a–c. The XRD patterns of the three materials can be indexed to a hexagonal α-NaFeO2 structure [20]. Moreover, there are no extra peaks on the coated NMC-60 materials indicating that no structural changes occurred as a result of the LNO coating or annealing procedure. It is noted that the LNO peaks are not visible in the XRD patterns due to the very small composition in the overall material being analyzed.

5.2. Electrochemical Performance

Electrochemical performance study of uncoated NMC-60, coated using Method-I, and coated using Method-II, with 0.5 wt.% and 1 wt.% LNO content for both methods, was performed in the voltage range of 2.7 V to 4.3 V using coin half-cells. Two tests were performed. The cycling performance was the first test which was used to evaluate the stability and capacity retention of the cathode half-cells over time. The CAM capacity was also determined during this test. The rate performance was the second test used to evaluate the power performance under different current loadings.

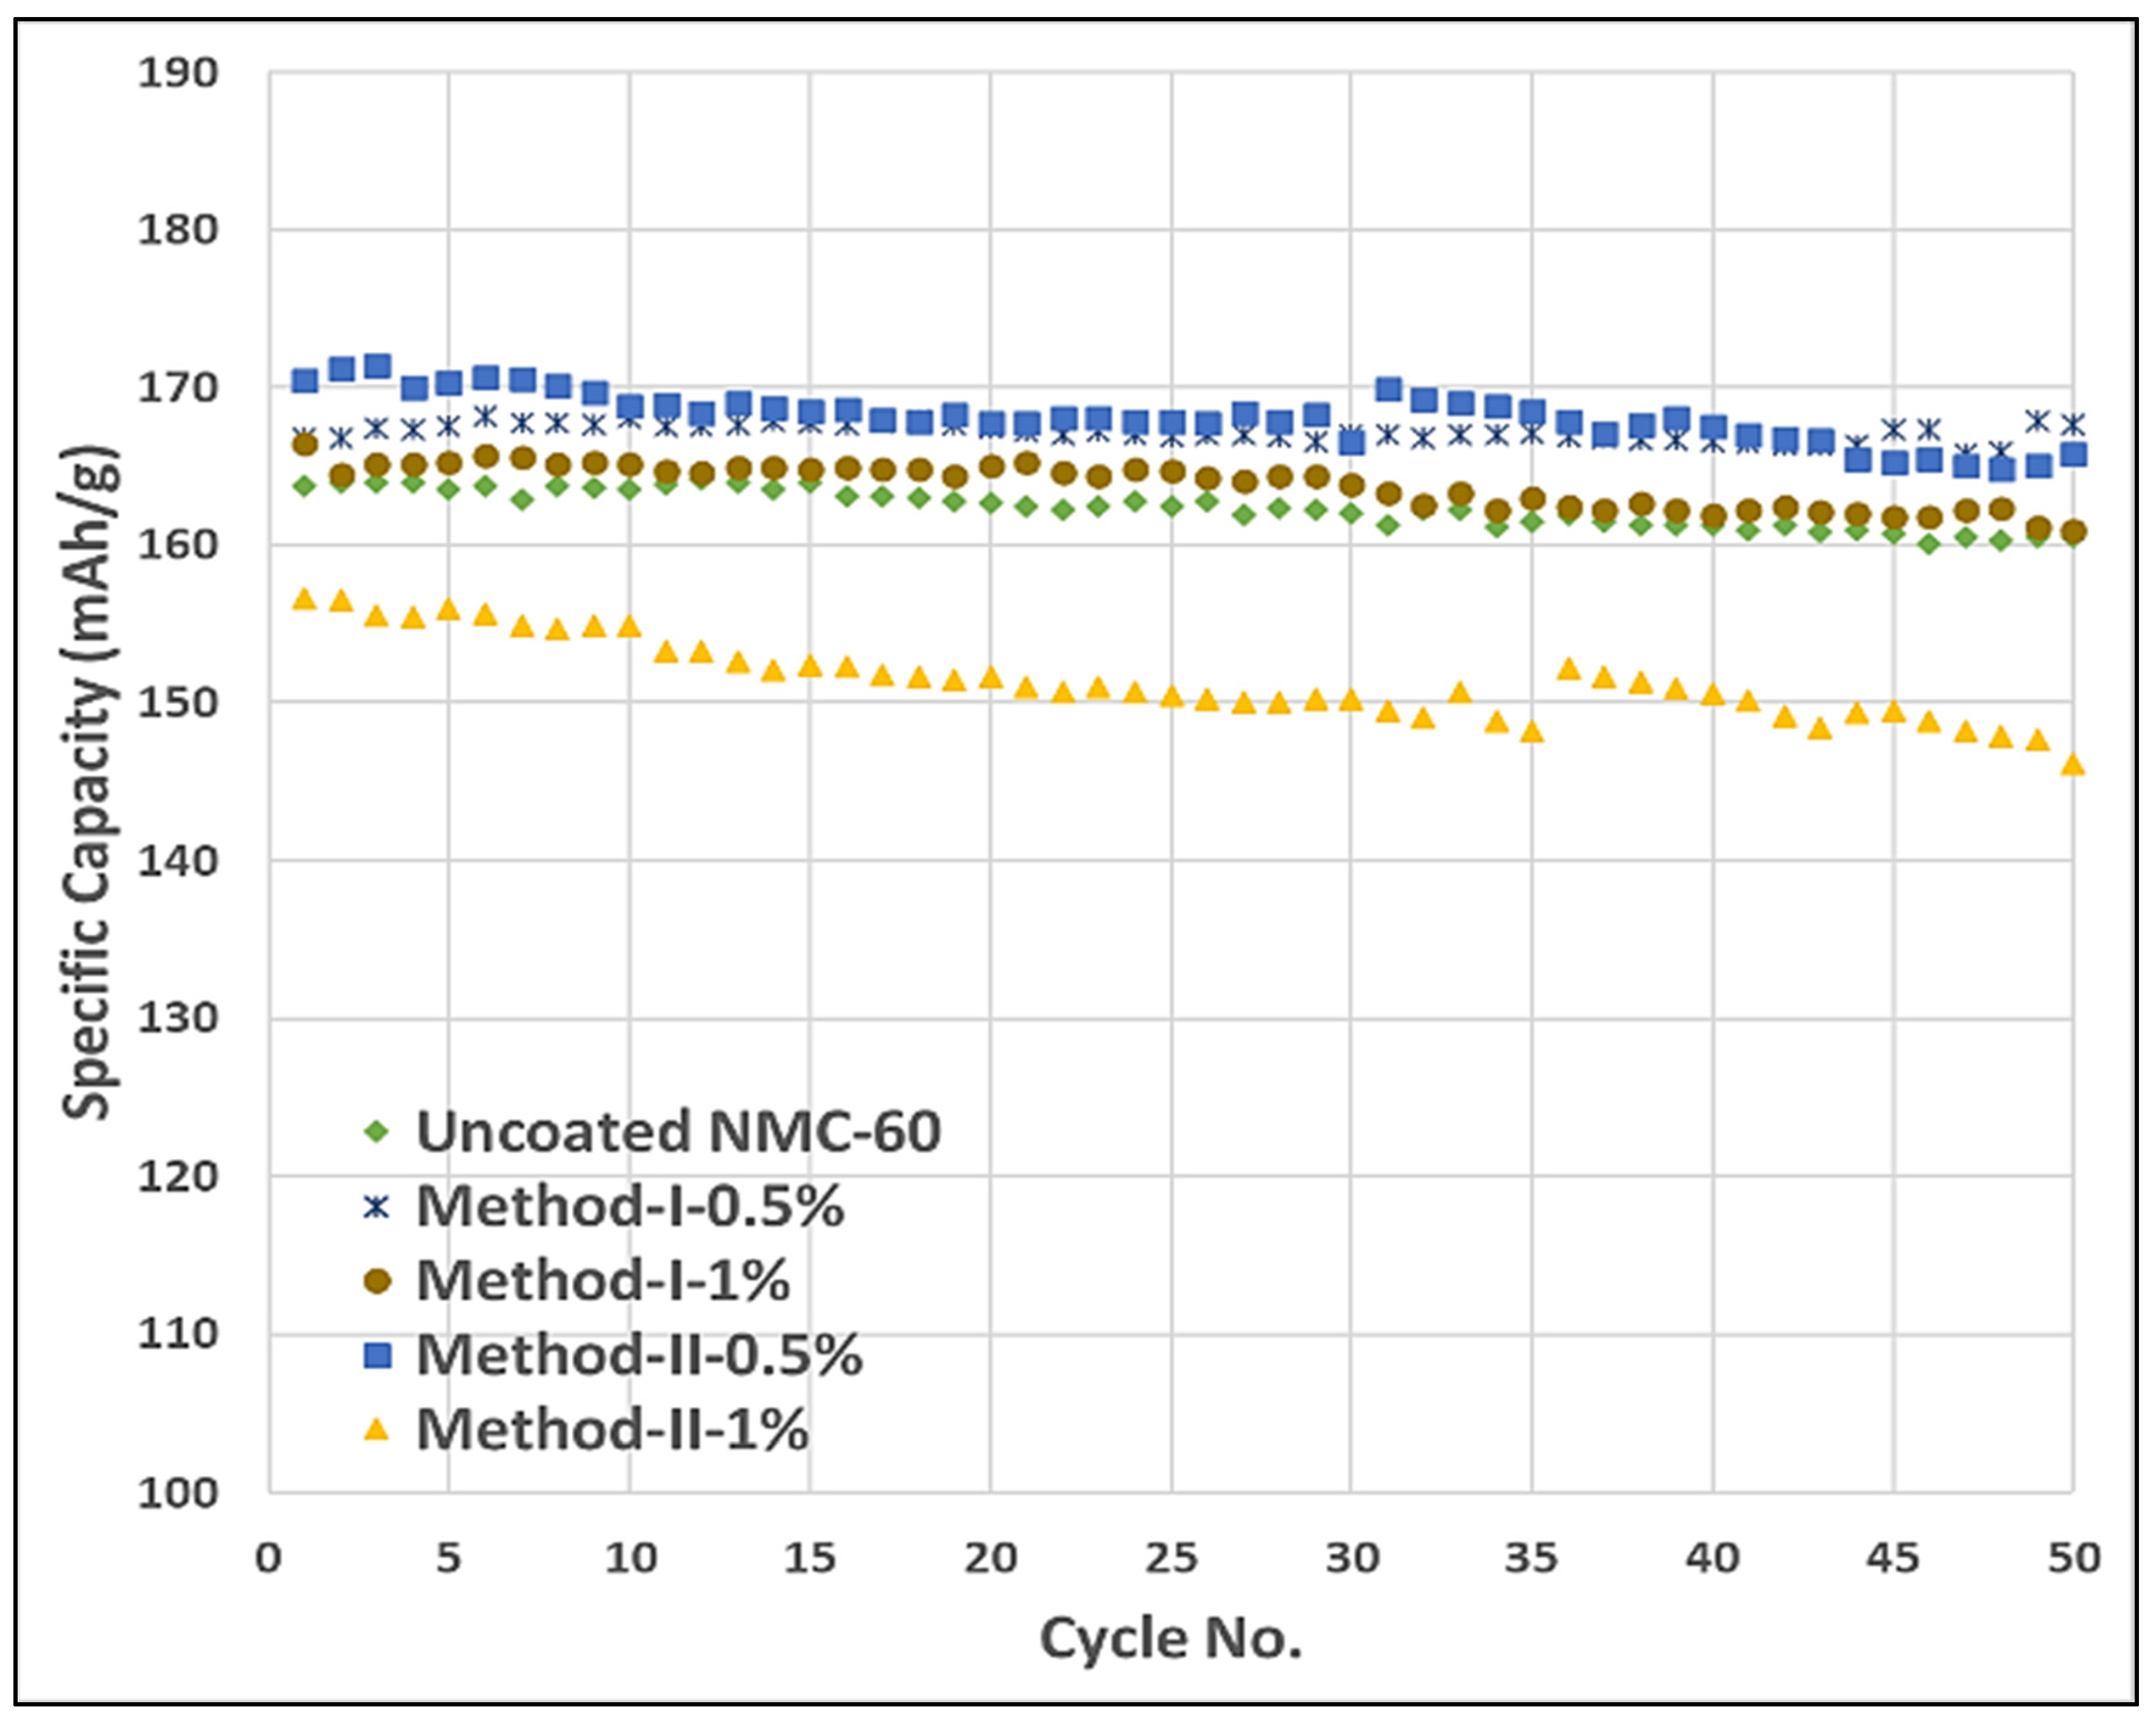
5.2.1. Cycling Performance Test

Cycling performance was performed at a charge and discharge rate of C/3 for 50 cycles. The results of this performance for uncoated NMC-60, Method-I, and Method-II with 0.5% and 1% for both methods are shown in Figure 9. Each point in this graph was found through charge and discharge voltage versus capacity curves. These curves showed almost the same trend between uncoated and coated NMC-60 with only changes in values of the capacity. Half-cells made using uncoated NMC-60 show an initial capacity of ~164.0 mAhg−1 and a capacity retention of 98.0%. Method-I-1% showed comparative values with an initial capacity of 166.4 mAhg−1 and a capacity retention of 97.0%. In comparison, Method-I-0.5% has a higher initial capacity of ~167.0 mAhg−1 with a much higher capacity retention of ~99.9%. This capacity retention is higher than the uncoated NMC-60, may be due to the protective coating layer formed around the NMC-60 particles. On the other hand, Method-II-1% showed an initial capacity of ~155.1 mAhg−1, which is much lower than that of the uncoated NMC-60 or Method-I-1%. However, the capacity retentions of uncoated NMC-60 (98.0%) and Method-II-1% (97.7%) were very similar. Method-II-0.5% has an initial capacity of 171.0 mAhg−1 which is higher than all other initial capacities. Contrastingly, while Method-II-0.5% has higher initial capacity, capacity retention is much greater for Method-I-0.5% with a value of ~99.9% versus 97.0% for Method-II-0.5%. It is apparent that Method-I-0.5% has very good stability with almost no capacity fade after 50 cycles. Furthermore, with special regard to capacity fade, Method-I-0.5% shows a clear improvement in electrochemical performance of NMC-60 with organic liquid electrolytes. This improvement should be checked with the argyrodite electrolyte as well, which is the out of the scope of this paper.
We define the capacity retention ratio (CRR) as the ratio of the capacity retention of the coated-CAM to the capacity retention of the uncoated-CAM. The CRR of the coated-NMC-60 with methods I and II is shown in Figure 10. In this figure, the CRR of the uncoated NMC-60 has been represented by the LNO wt.% of 0, which is obviously equal to 1. The Method-I-0.5% exhibits CRR ≈ 1.026 after 50 cycles, which is higher than other coated samples. The CRR of Method-I-1% and Method-II-0.5% are less than that of the uncoated-NMC-60, while Method-II-1% shows almost the same CRR compared to the uncoated-NMC-60.

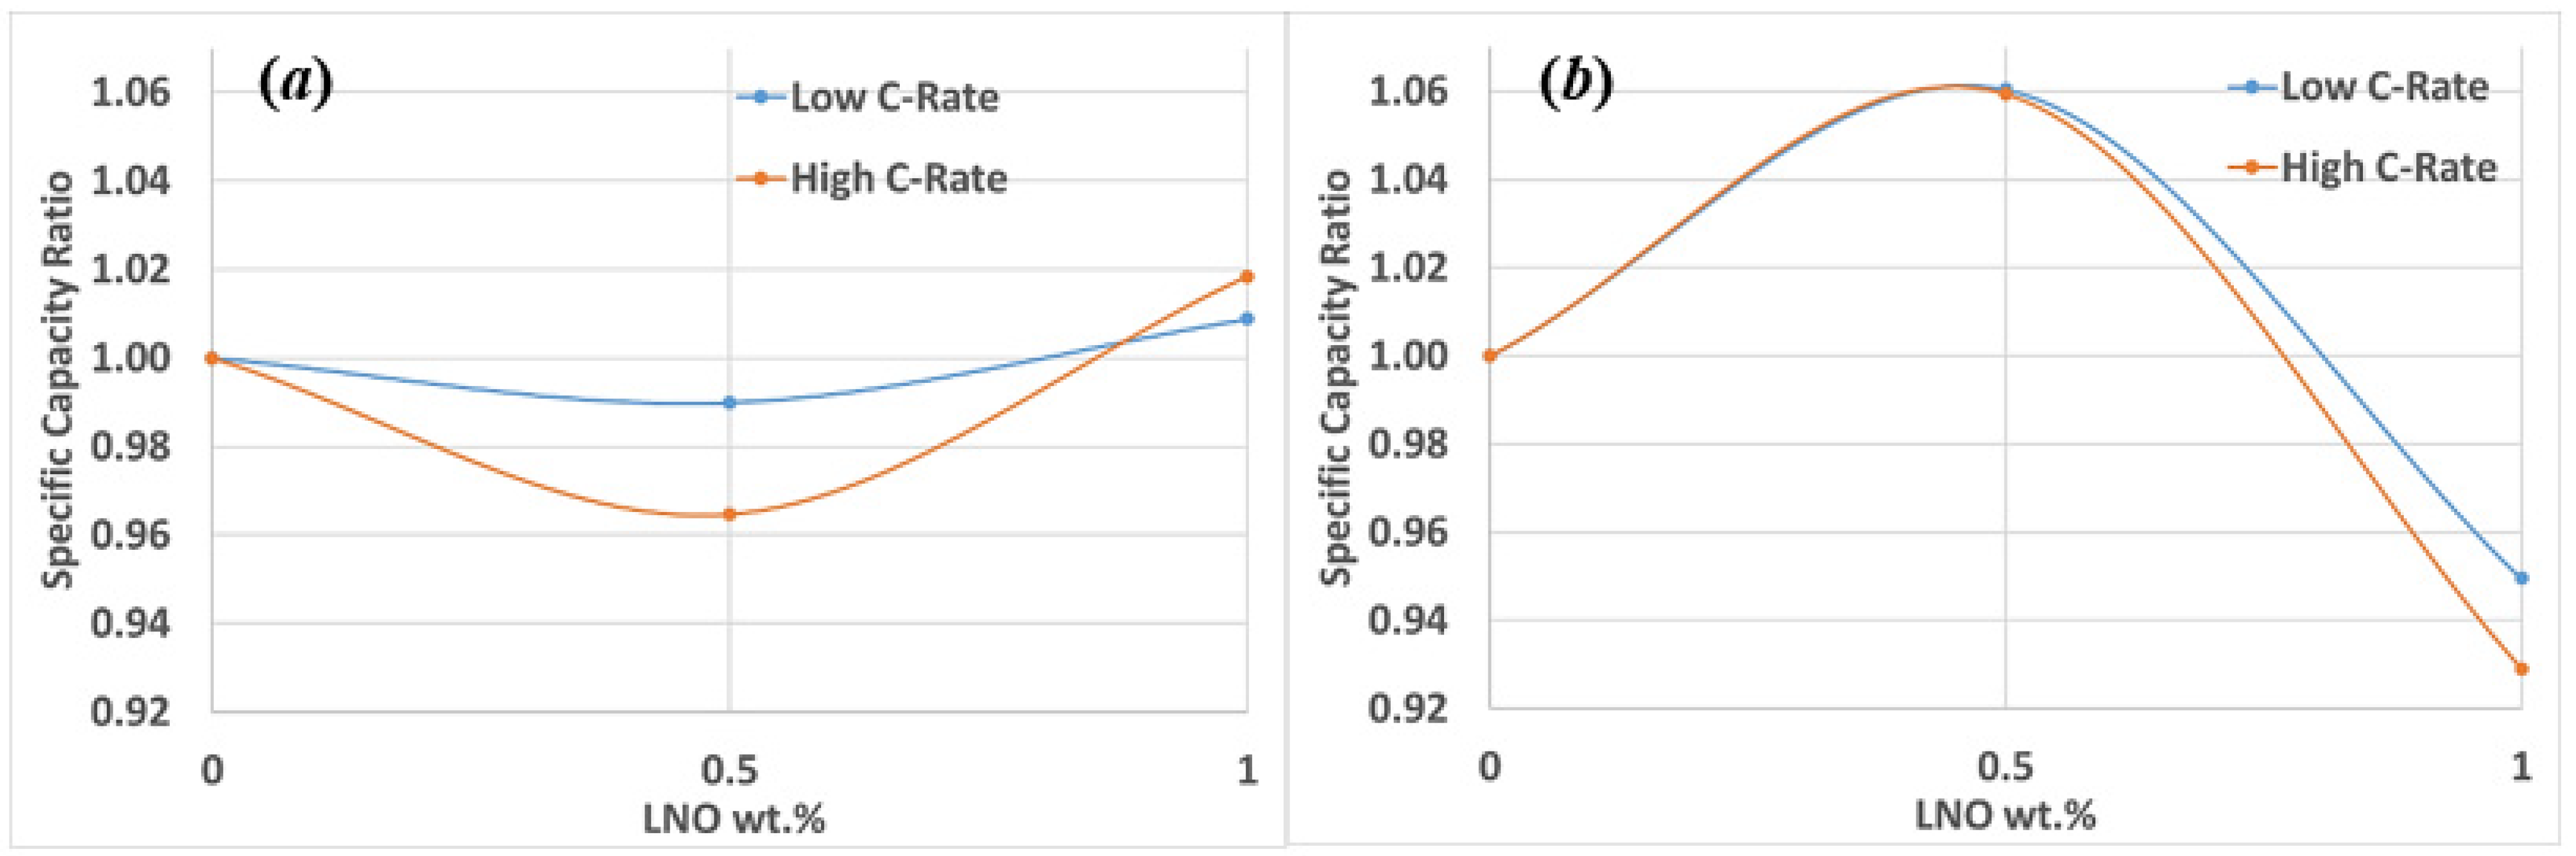
5.2.2. Rate Performance Test

Results of the rate performance test to compare the uncoated NMC-60 with the coated NMC-60 with Method-I and Method-II 0.5 wt.% and 1 wt.% LNO are shown in Figure 11. Tests were run in the same cut-off voltage range of 2.7 V to 4.3 V. Different C-rates of C/10, C/5, C/3, C/2, C, and 2C followed by a return to C/10 were each tested for 5 cycles. Regarding initial capacity, Method-I-1% has higher values than the uncoated NMC-60 and Method-I-0.5%. Method-I-1% also exhibits these higher capacities for all c-rates. Method-II-0.5% has higher capacity than all other samples for all c-rates. Conversely, Method-II-1% has lower capacity than all other samples for all c-rates. Method-I-0.5% consistently performs at lower capacities than uncoated NMC-60 for c-rates below 2C. Although Method-II-0.5% has the highest capacity overall, this sample has the lowest recuperation of capacity after returning to C/10, while Method-I-0.5% has the highest. For better comparison of rate capabilities, Table 1 features the initial capacities, capacities at 2C, and capacities after returning to C/10 for all five samples as well as their corresponding capacity retentions.
It is evident from the data that the most improvement of NMC-60 regarding rate capability is achieved through Method-II-0.5% and Method-I-1%. These two samples exhibit higher capacities and capacity retention than the uncoated NMC-60 even at high c-rates. This trend is maintained upon returning to C/10 discharge rate. It should also be noted that Method-I-0.5% performs better than the uncoated NMC-60 after returning to C/10.
We define the specific capacity ratio (SCR) as the ratio of the specific capacity of the coated-CAM to the specific capacity of the uncoated-CAM. The SCR of the coated-NMC-60 with methods I and II is shown in Figure 12. In this figure, the SCR of the uncoated NMC-60 has been represented by the LNO wt.% of 0, which is obviously equal to 1. The comparison is presented for low versus high c-rates. It is evident from Figure 12a that the 1 wt.% LNO for Method-I can keep the specific capacity of the coated-NMC-60 about 1 to 2 percent more than the specific capacity of the uncoated-NMC-60 at both low and high C-rates of C/10 and 2C. On the other hand, Figure 12b shows that the 0.5 wt.% LNO for Method-II can keep the specific capacity of the coated-NMC-60 about 6 percent more than the specific capacity of the uncoated-NMC-60 at both low and high C-rates of C/10 and 2C. Further investigations into the effects of various LNO wt.% are necessary to conclude a precise wt.% of LNO for each method.

6. Conclusions

This paper aimed to quantify the effect of LNO coating on the electrochemical performance of the nickel-rich NMC-60 cathode active material. The electrochemical performance parameters of the initial capacity, cycling performance, and rate performance were studied. To eliminate the effect of side reactions at the interface of the argyrodite solid electrolyte and NMC-60, we conduct all tests using organic liquid electrolyte cells to solely study the effect of coating on the NMC-60 electrochemical performance. We presented a model and formulation to control the coating thickness on the electrode active material particles. Based on these formulations and by using two synthesizing and coating methods, several coated-NMC-60 with 0.5 wt.% and 1 wt.% LNO were prepared. The effects of LNO on the morphology and electrochemical performance of the coated-NMC-60 were investigated. Using the TEM and SEM images and EDS analysis the presence of LNO coating on the surface of the NMC-60 was determined. Further characterization using XRD showed that the coating methods did not change the structure of NMC-60. The electrochemical performance analysis results indicated that the capacity, cycling performance, and the rate performance of the LNO coated-NMC60 are sensitive to the LNO coating thickness (or wt.%) and the synthesizing and coating method. It was found that the initial capacity and rate performance of the 0.5 wt.% LNO-coated-NMC-60 using Method II are noticeably higher than those of the uncoated-NMC-60. The initial capacity and rate performance of the 1 wt.% LNO-coated-NMC-60 using Method I are only slightly higher than the uncoated-NMC-60. The initial capacity and rate performance of the 0.5 wt.% LNO-coated-NMC-60 using Method I and 1 wt.% LNO-coated-NMC-60 using Method II are lower than the uncoated-NMC-60. Although the 0.5 wt.% LNO-coated-NMC-60 using Method II is promising, a more detailed study is required to determine the optimum LNO wt.% and the best synthesizing and coating methods. Although this study provided a baseline for electrochemical performance of the coated-NMC-60, further investigations are required by testing the coated-NMC-60 in solid state cells.

Author Contributions

Conceptualization, M.A. and S.F.; Data curation, E.H., M.A. and D.F.; Formal analysis, E.H., M.A. and S.F.; Funding acquisition, R.F. and S.F.; Investigation, E.H., M.A., D.F., J.D., R.F. and S.F.; Methodology, M.A. and S.F.; Project administration, M.A.; Resources, R.F.; Supervision, R.F.; Visualization, J.D.; Writing—original draft, E.H.; Writing—review & editing, M.A., R.F. and S.F. All authors have read and agreed to the published version of the manuscript.

Funding

The funding was provided internally by the Schaeffler Company and the University of Akron.

Informed Consent Statement

Not applicable.

Acknowledgments

The support of the Schaeffler Company and The University of Akron is highly appreciated. Work performed at the Center for Nanoscale Materials, a U.S. Department of Energy Office of Science User Facility, was supported by the U.S. DOE, Office of Basic Energy Sciences, under Contract No. DE-AC02-06CH11357.

Conflicts of Interest

The authors declare no conflict of interest.

References

  1. Goodenough, J.B.; Kim, Y. Challenges for Rechargeable Li Batteries. Chemistry of Materials. Am. Chem. Soc. 2010, 22, 587–603. [Google Scholar] [CrossRef]
  2. Hao, F.; Han, F.; Liang, Y.; Wang, C.; Yao, Y. Architectural Design and Fabrication Approaches for Solid-State Batteries. MRS Bull. 2018, 43, 775–781. [Google Scholar] [CrossRef]
  3. Zubair, M.; Li, G.; Wang, B.; Wang, L.; Yu, H. Electrochemical Kinetics and Cycle Stability Improvement with Nb Doping for Lithium-Rich Layered Oxides. ACS Appl. Energy Mater. 2018, 2, 503–512. [Google Scholar] [CrossRef]
  4. Zhu, X.; Wang, K.; Xu, Y.; Zhang, G.; Li, S.; Li, C.; Zhang, X.; Sun, X.; Ge, X.; Ma, Y. Strategies to Boost Ionic Conductivity and Interface Compatibility of Inorganic—Organic Solid Composite Electrolytes. Energy Storage Mater. 2021, 36, 291–308. [Google Scholar] [CrossRef]
  5. Divakaran, A.M.; Hamilton, D.; Manjunatha, K.N.; Minakshi, M. Design, Development and Thermal Analysis of Reusable Li-Ion Battery Module for Future Mobile and Stationary Applications. Energies 2020, 13, 1477. [Google Scholar] [CrossRef] [Green Version]
  6. Divakaran, A.M.; Minakshi, M.; Bahri, P.A.; Paul, S.; Kumari, P.; Divakaran, A.M.; Manjunatha, K.N. Rational Design on Materials for Developing next Generation Lithium-Ion Secondary Battery. Prog. Solid State Chem. 2021, 62, 100298. [Google Scholar] [CrossRef]
  7. Xiao, Y.; Wang, Y.; Bo, S.H.; Kim, J.C.; Miara, L.J.; Ceder, G. Understanding Interface Stability in Solid-State Batteries. Nat. Rev. Mater. 2020, 5, 105–126. [Google Scholar] [CrossRef]
  8. Shi, J.L.; Qi, R.; Zhang, X.D.; Wang, P.F.; Fu, W.G.; Yin, Y.X.; Xu, J.; Wan, L.J.; Guo, Y.G. High-Thermal- and Air-Stability Cathode Material with Concentration-Gradient Buffer for Li-Ion Batteries. ACS Appl. Mater. Interfaces 2017, 9, 42829–42835. [Google Scholar] [CrossRef]
  9. Ryu, W.G.; Shin, H.S.; Park, M.S.; Kim, H.; Jung, K.N.; Lee, J.W. Mitigating Storage-Induced Degradation of Ni-Rich LiNi0.8 Co0.1Mn0.1O2 Cathode Material by Surface Tuning with Phosphate. Ceram. Int. 2019, 45, 13942–13950. [Google Scholar] [CrossRef]
  10. Cho, D.H.; Jo, C.H.; Cho, W.; Kim, Y.J.; Yashiro, H.; Sun, Y.K.; Myung, S.T. Effect of Residual Lithium Compounds on Layer Ni-Rich Li[Ni0.7 Mn0.3]O2. J. Electrochem. Soc. 2014, 161, A920–A926. [Google Scholar] [CrossRef]
  11. Meng, K.; Wang, Z.; Guo, H.; Li, X.; Wang, D. Improving the Cycling Performance of LiNi0.8Co0.1Mn0.1O2 by Surface Coating with Li2TiO3. Electrochim. Acta 2016, 211, 822–831. [Google Scholar] [CrossRef]
  12. Song, B.; Li, W.; Oh, S.M.; Manthiram, A. Long-Life Nickel-Rich Layered Oxide Cathodes with a Uniform Li2ZrO3 Surface Coating for Lithium-Ion Batteries. ACS Appl. Mater. Interfaces 2017, 9, 9718–9725. [Google Scholar] [CrossRef] [PubMed]
  13. Srur-Lavi, O.; Miikkulainen, V.; Markovsky, B.; Grinblat, J.; Talianker, M.; Fleger, Y.; Cohen-Taguri, G.; Mor, A.; Tal-Yosef, Y.; Aurbach, D. Studies of the Electrochemical Behavior of LiNi0.80Co0.15Al0.05O2 Electrodes Coated with LiAlO2. J. Electrochem. Soc. 2017, 164, A3266–A3275. [Google Scholar] [CrossRef] [Green Version]
  14. Zhang, Z.J.; Chou, S.L.; Gu, Q.F.; Liu, H.K.; Li, H.J.; Ozawa, K.; Wang, J.Z. Enhancing the High Rate Capability and Cycling Stability of LiMn2O4 by Coating of Solid-State Electrolyte LiNbO3. ACS Appl. Mater. Interfaces 2014, 6, 22155–22165. [Google Scholar] [CrossRef] [PubMed]
  15. Xin, F.; Zhou, H.; Chen, X.; Zuba, M.; Chernova, N.; Zhou, G.; Whittingham, M.S. Li–Nb–O Coating/Substitution Enhances the Electrochemical Performance of the LiNi0.8Mn0.1Co0.1O2 (NMC 811) Cathode. ACS Appl. Mater. Interfaces 2019, 11, 34889–34894. [Google Scholar] [CrossRef]
  16. Ohta, N.; Takada, K.; Sakaguchi, I.; Zhang, L.; Ma, R.; Fukuda, K.; Osada, M.; Sasaki, T. LiNbO3-Coated LiCoO2 as Cathode Material for All Solid-State Lithium Secondary Batteries. Electrochem. Commun. 2007, 9, 1486–1490. [Google Scholar] [CrossRef]
  17. Gabrielli, G.; Axmann, P.; Diemant, T.; Behm, R.J.; Wohlfahrt-Mehrens, M. Combining Optimized Particle Morphology with a Niobium-Based Coating for Long Cycling-Life, High-Voltage Lithium-Ion Batteries. ChemSusChem 2016, 9, 1670–1679. [Google Scholar] [CrossRef]
  18. Nakamura, H.; Kawaguchi, T.; Masuyama, T.; Sakuda, A.; Saito, T.; Kuratani, K.; Ohsaki, S.; Watano, S. Dry Coating of Active Material Particles with Sulfide Solid Electrolytes for an All-Solid-State Lithium Battery. J. Power Sources 2020, 448, 227579. [Google Scholar] [CrossRef]
  19. Li, X.; Liu, J.; Banis, M.N.; Lushington, A.; Li, R.; Cai, M.; Sun, X. Atomic Layer Deposition of Solid-State Electrolyte Coated Cathode Materials with Superior High-Voltage Cycling Behavior for Lithium Ion Battery Application. Energy Environ. Sci. 2014, 7, 768–778. [Google Scholar] [CrossRef]
  20. Li, X.; Jin, L.; Song, D.; Zhang, H.; Shi, X.; Wang, Z.; Zhang, L.; Zhu, L. LiNbO3-Coated LiNi0.8Co0.1Mn0.1O2 Cathode with High Discharge Capacity and Rate Performance for All-Solid-State Lithium Battery. J. Energy Chem. 2020, 40, 39–45. [Google Scholar] [CrossRef] [Green Version]
  21. Kim, J.H.; Kim, H.; Choi, W.; Park, M.S. Bifunctional Surface Coating of LiNbO3 on High-Ni Layered Cathode Materials for Lithium-Ion Batteries. ACS Appl. Mater. Interfaces 2020, 12, 35098–35104. [Google Scholar] [CrossRef] [PubMed]
  22. Mereacre, V.; Stüble, P.; Ghamlouche, A.; Binder, J.R. Enhancing the Stability of Lini0.5Mn1.5O4 by Coating with LinbO3 Solid-State Electrolyte: Novel Chemically Activated Coating Process versus Sol-Gel Method. Nanomaterials 2021, 11, 548. [Google Scholar] [CrossRef] [PubMed]
  23. Mastali, M.; Samadani, E.; Farhad, S.; Fraser, R.; Fowler, M. Three-Dimensional Multi-Particle Electrochemical Model of LiFePO4 Cells Based on a Resistor Network Methodology. Electrochim. Acta 2016, 190, 574–587. [Google Scholar] [CrossRef]
  24. Kashkooli, A.G.; Amirfazli, A.; Farhad, S.; Lee, D.U.; Felicelli, S.; Park, H.W.; Feng, K.; De Andrade, V.; Chen, Z. Representative Volume Element Model of Lithium-Ion Battery Electrodes Based on X-Ray Nano-Tomography. J. Appl. Electrochem. 2017, 47, 281–293. [Google Scholar] [CrossRef]
  25. Farhad, S.; Nazari, A. Introducing the Energy Efficiency Map of Lithium-Ion Batteries. Int. J. Energy Res. 2019, 43, 931–944. [Google Scholar] [CrossRef]
  26. Mohammed, A.H.; Esmaeeli, R.; Aliniagerdroudbari, H.; Alhadri, M.; Hashemi, S.R.; Nadkarni, G.; Farhad, S. Dual-Purpose Cooling Plate for Thermal Management of Prismatic Lithium-Ion Batteries during Normal Operation and Thermal Runaway. Appl. Therm. Eng. 2019, 160, 114106. [Google Scholar] [CrossRef]
  27. Frisone, D.; Amiriyan, M.; Hassan, E.; Dunham, J.; Farahati, R.; Farhad, S. Effect of LiNbO3 Coating on Capacity and Cycling of Nickle-Rich NMC Cathode Active Material. In Proceedings of the International Mechanical Engineering Congress and Exposition, Virtual, Online, 4 November 2021. [Google Scholar]
Figure 1. Interface of the coating material with other components of the cathode. The red particles are argyrodite electrolyte, the blue particles are the cathode active material, the black particles are the electron conductive materials, the gray layer is the cathode current collector, and the green layers are the coating (Reprinted/adapted with permission from Ref. [7]. Copyright year: 2022, copyright owner’s name: Eman Hassan).
Energies 15 04886 g001
Figure 2. TEM image of the LNO coated NMC-60 showing a dense coating layer with a thickness of 14 nm has been formed, which is two-thirds of the theoretical thickness of 21 nm for a 1 wt.% of LNO coating on NMC-60 (work performed at the Center for Nanoscale Materials at Argonne National Laboratory).
Energies 15 04886 g002
Figure 3. (a) SEM of the uncoated NMC-60 particles, and (b) approximation of NMC-60 particle sizes with log-normal distribution.
Energies 15 04886 g003
Figure 4. Mass fraction of initial materials to coat NMC-60 with the desired thickness of LNO.
Energies 15 04886 g004
Figure 5. Materials in red circles seem to be the agglomerated LNO with sizes < 1 µm produced during synthesizing, but has not participated in coating layer formation on the NMC-60 particles.
Energies 15 04886 g005
Figure 6. SEM imaging of (a) uncoated NMC-60, (b) Method-I-1%, and (c) Method-II-1% with inset exhibiting LNO as soft or feathery surface material in appearance.
Energies 15 04886 g006
Figure 7. EDX analysis of 1% LNO coating using (a) Method-I and (b) Method-II.
Energies 15 04886 g007
Figure 8. XRD analysis of (a) uncoated NMC-60, (b) 1% LNO coated NMC-60 using Method-I, and (c) 1% LNO coated NMC-60 using Method-II.
Energies 15 04886 g008aEnergies 15 04886 g008b
Figure 9. Cycling performance of the uncoated NMC-60 and 0.5 wt.% and 1 wt.% LNO coating NMC-60 using Method-I and Method-II.
Energies 15 04886 g009
Figure 10. Capacity retention ratio of the coated-NMC-60 for (a) Method-I, and (b) Method-II.
Energies 15 04886 g010
Figure 11. Rate performance of the uncoated NMC-60 and 0.5 wt.% and 1 wt.% LNO coating NMC-60 using Method-I and Method-II.
Energies 15 04886 g011
Figure 12. Specific capacity ratio of the coated-NMC-60 for (a) Method-I, and (b) Method-II for low or high c-rates of C/10 and 2C.
Energies 15 04886 g012
Table 1. Comparison of rate performance at low and high C-rates.
Initial Capacity (mAhg−1)Capacity at 2C
(mAhg−1)
Capacity Retention at 2C
(%)
Capacity upon Return to C/10
(mAhg−1)
Capacity Retention at C/10
(%)
Uncoated NMC-60167.6146.187.2172.6103.1
Method-I-0.5%167.3140.083.7175.6105.0
Method-I-1%168.9148.788.0174.1103.1
Method-II-0.5%176.9154.887.5178.8101.1
Method-II-1%159.1135.485.1163.2102.6
Publisher’s Note: MDPI stays neutral with regard to jurisdictional claims in published maps and institutional affiliations.

