Article

Charcoal Production in Portugal: Operating Conditions and Performance of a Traditional Brick Kiln

Centre for Environmental and Marine Studies (CESAM), Department of Environment and Planning, University of Aveiro, Campus Universitário de Santiago, 3810-193 Aveiro, Portugal
*
Author to whom correspondence should be addressed.
Energies 2022, 15(13), 4775; https://doi.org/10.3390/en15134775
Submission received: 31 May 2022 / Revised: 23 June 2022 / Accepted: 27 June 2022 / Published: 29 June 2022
(This article belongs to the Special Issue Energy Production from Biomass Valorization)

Abstract

:
Charcoal is produced in large quantities in the Portuguese region of Alentejo mainly using traditional brick kilns. Information about this type of carbonization technology is scarce, which makes it urgent to characterize the process as a starting point for performance improvements. In this context, this study aims to characterize the operation of a cylindrical brick kiln (≈80 m3) during regular wood carbonization cycles. Relevant process parameters were monitored along with the yields and/or composition of the main products (carbonization gas, charcoal, and charcoal fines) to evaluate the mass balance of the process. The results show that the bulk of the kiln operates at temperatures below 300 °C, which greatly limits the quality of the charcoal. For instance, the fixed carbon content of charcoal can easily be as low as 60 wt.%. The yield of charcoal is also low, with values below 25 wt.% of dry wood feed. This means that significant quantities of by-products are generated in the process with little or no commercial value. Modifications in the carbonization process are needed to improve efficiency, charcoal quality, and environmental acceptance to sustain this activity in regions where it still represents vital income related to wood-waste management.

1. Introduction

Charcoal has been an important fuel/feedstock for both household and industrial activities throughout history and its manufacture is one of the oldest practices of mankind [1,2]. Currently, there are several applications for charcoal in various industries, including as a reductant agent for smelting metal ores, pharmaceutical products, fireworks, art products, CO2 sequestration, soil amendment, low-cost adsorbents for soil and wastewater treatment, syngas production (gasification), and heat and power production (combustion) [3,4,5,6]. As a household utility product, charcoal remains an important primary energy source for heating and cooking in peri-urban areas of developing countries, whereas in high-income countries charcoal is mainly used as recreational fuel in barbecues [7,8,9,10]. Although EU countries have a long tradition in charcoal production [1,11,12]—charcoal production in EU countries was ≈300 kton by 2020, according to the Food and Agriculture Organization (FAO) [13]—current production is roughly half of the demand. Then, the EU imports significant amounts of charcoal from countries in Africa, South America, and Asia [10,14].
Charcoal is a carbon-rich solid material resulting from the slow pyrolysis (also called carbonization) of biomass. The carbonization process evolves as an irreversible hermoschemical decomposition of the biomass main constituents (hemicellulose, cellulose, and lignin), starting at temperatures as low as 200 °C [15]. Besides charcoal, the carbonization process generates two other relevant products: a liquid fraction usually referred to as bio-oil, consisting of a large array of organic compounds and water, and a gaseous fraction containing several combustible species [16]. The proportions of these three main products (i.e., charcoal, liquids, and gas) are dependent on the composition of the biomass and the operating conditions, namely the carbonization temperature and heating rate [17,18].
Carbonization of woody biomass for charcoal production has been done with different types of technologies, ranging from kilns and retorts (with sizes from less than 5 m3 to over 100 m3) to continuous reactors. Although a few types of kilns show some technological improvements—notably concerning by-product energy recovery and process monitoring/control—most of the world’s charcoal production is based on low-tech batch-operated earth or masonry kilns, mainly because of their simplicity, low capital cost, and available know-how [19,20,21,22]. It is recognized that the use of traditional low-tech kilns results in lower charcoal yields, lower charcoal quality, and larger environmental impacts in the vicinity of the production sites due to the release of pyrolytic liquids and gases [23,24]. It is therefore important to characterize the operating conditions of traditional kilns (e.g., temperatures and airflow rate) and yields/composition of major products namely with respect to the European barbeque charcoal market, according to EN1860-2-2005:E standard [25].
There are some experimental studies in the literature about charcoal production in traditional kilns and retorts, mainly in Latin America (e.g., [26,27,28,29]) and Africa (e.g., [24,30,31,32]). These studies were performed under very specific conditions, such as the types of wood being processed and the weather conditions, which make it difficult to forecast the results for other regions of the world. In contrast, recent studies in this field in Europe are scarce, with one of the few references being the work by Tintner et al. [33,34] on the operating conditions of earth kilns in Austria. This wrongly suggests that traditional charcoal production is currently of limited relevance in Europe. Indeed, certain regions of southern Portugal (and Spain) are well-known for their intense charcoal production activities, often linked to the management of cork oak and holm oak forests, almost all are based on permanent low-tech masonry/brick kilns of various designs and sizes [35,36]. To the best of the author’s knowledge, there is no detailed study on the operating conditions and performance of these systems, including the characteristics of its main products, which not only hinders potential technological improvements but also contributes to negative perceptions about this activity, including possible environmental impacts and work safety aspects. Proper integration of this activity in biomass valorization plans then becomes difficult, which can lead to its vanishing in certain European regions. This can have adverse consequences not only in such European regions where charcoal production is still important—often regions of low population density and where job offers are scarce—but also in developing countries exporting charcoal to Europe and to where these problems associated with charcoal production will be transferred, including deforestation, air, soil and water contamination, and work safety conditions [23,37,38,39]. In this context, this work provides an overview of the operating conditions, performance, product characteristics, and overall mass balance of a large brick kiln under operation in the Portuguese region of Alentejo, with the aim that these results will provide the appropriate basis for future developments of this activity in Portugal and abroad.

2. Materials and Methods

2.1. Wood Feedstocks

Residual woody biomass from holm oak and cork oak forests was used as feedstock in the carbonization tests described in this work. This includes tree branches from regular tree pruning, as well as large dead tree trunks and stumps. In addition, partially charred wood from previous carbonization batches was also used as feedstock, which is a common practice in traditional charcoal production [36]. The diameter of the wood pieces varied widely from small branches with 5 cm to large logs with more than 50 cm. The length of the logs varied typically within 30 to 60 cm. There was minimal pretreatment of the raw feedstock before charging it into the kiln. The exceptions were the removal of cork in the case of cork oak wood and size reduction in the case of stumps, both with the aid of specialized machinery. Samples of each type of wood were hand-ground to obtain chemically homogeneous particles and later subjected to analysis, including proximate composition (moisture, ash, fixed carbon, and volatile matter contents, according to DIN 51718, CEN/TS 15148:2005 CEN/TS 14775:2004) and elemental composition (CHNS). The lower heating value (hereinafter referred to as LHV) was estimated from the respective elemental composition according to [40]. Table 1 shows the relevant properties of each type of wood feedstock used in this work, while the respective quantities charged into the kiln for carbonization are provided in Section 2.6.

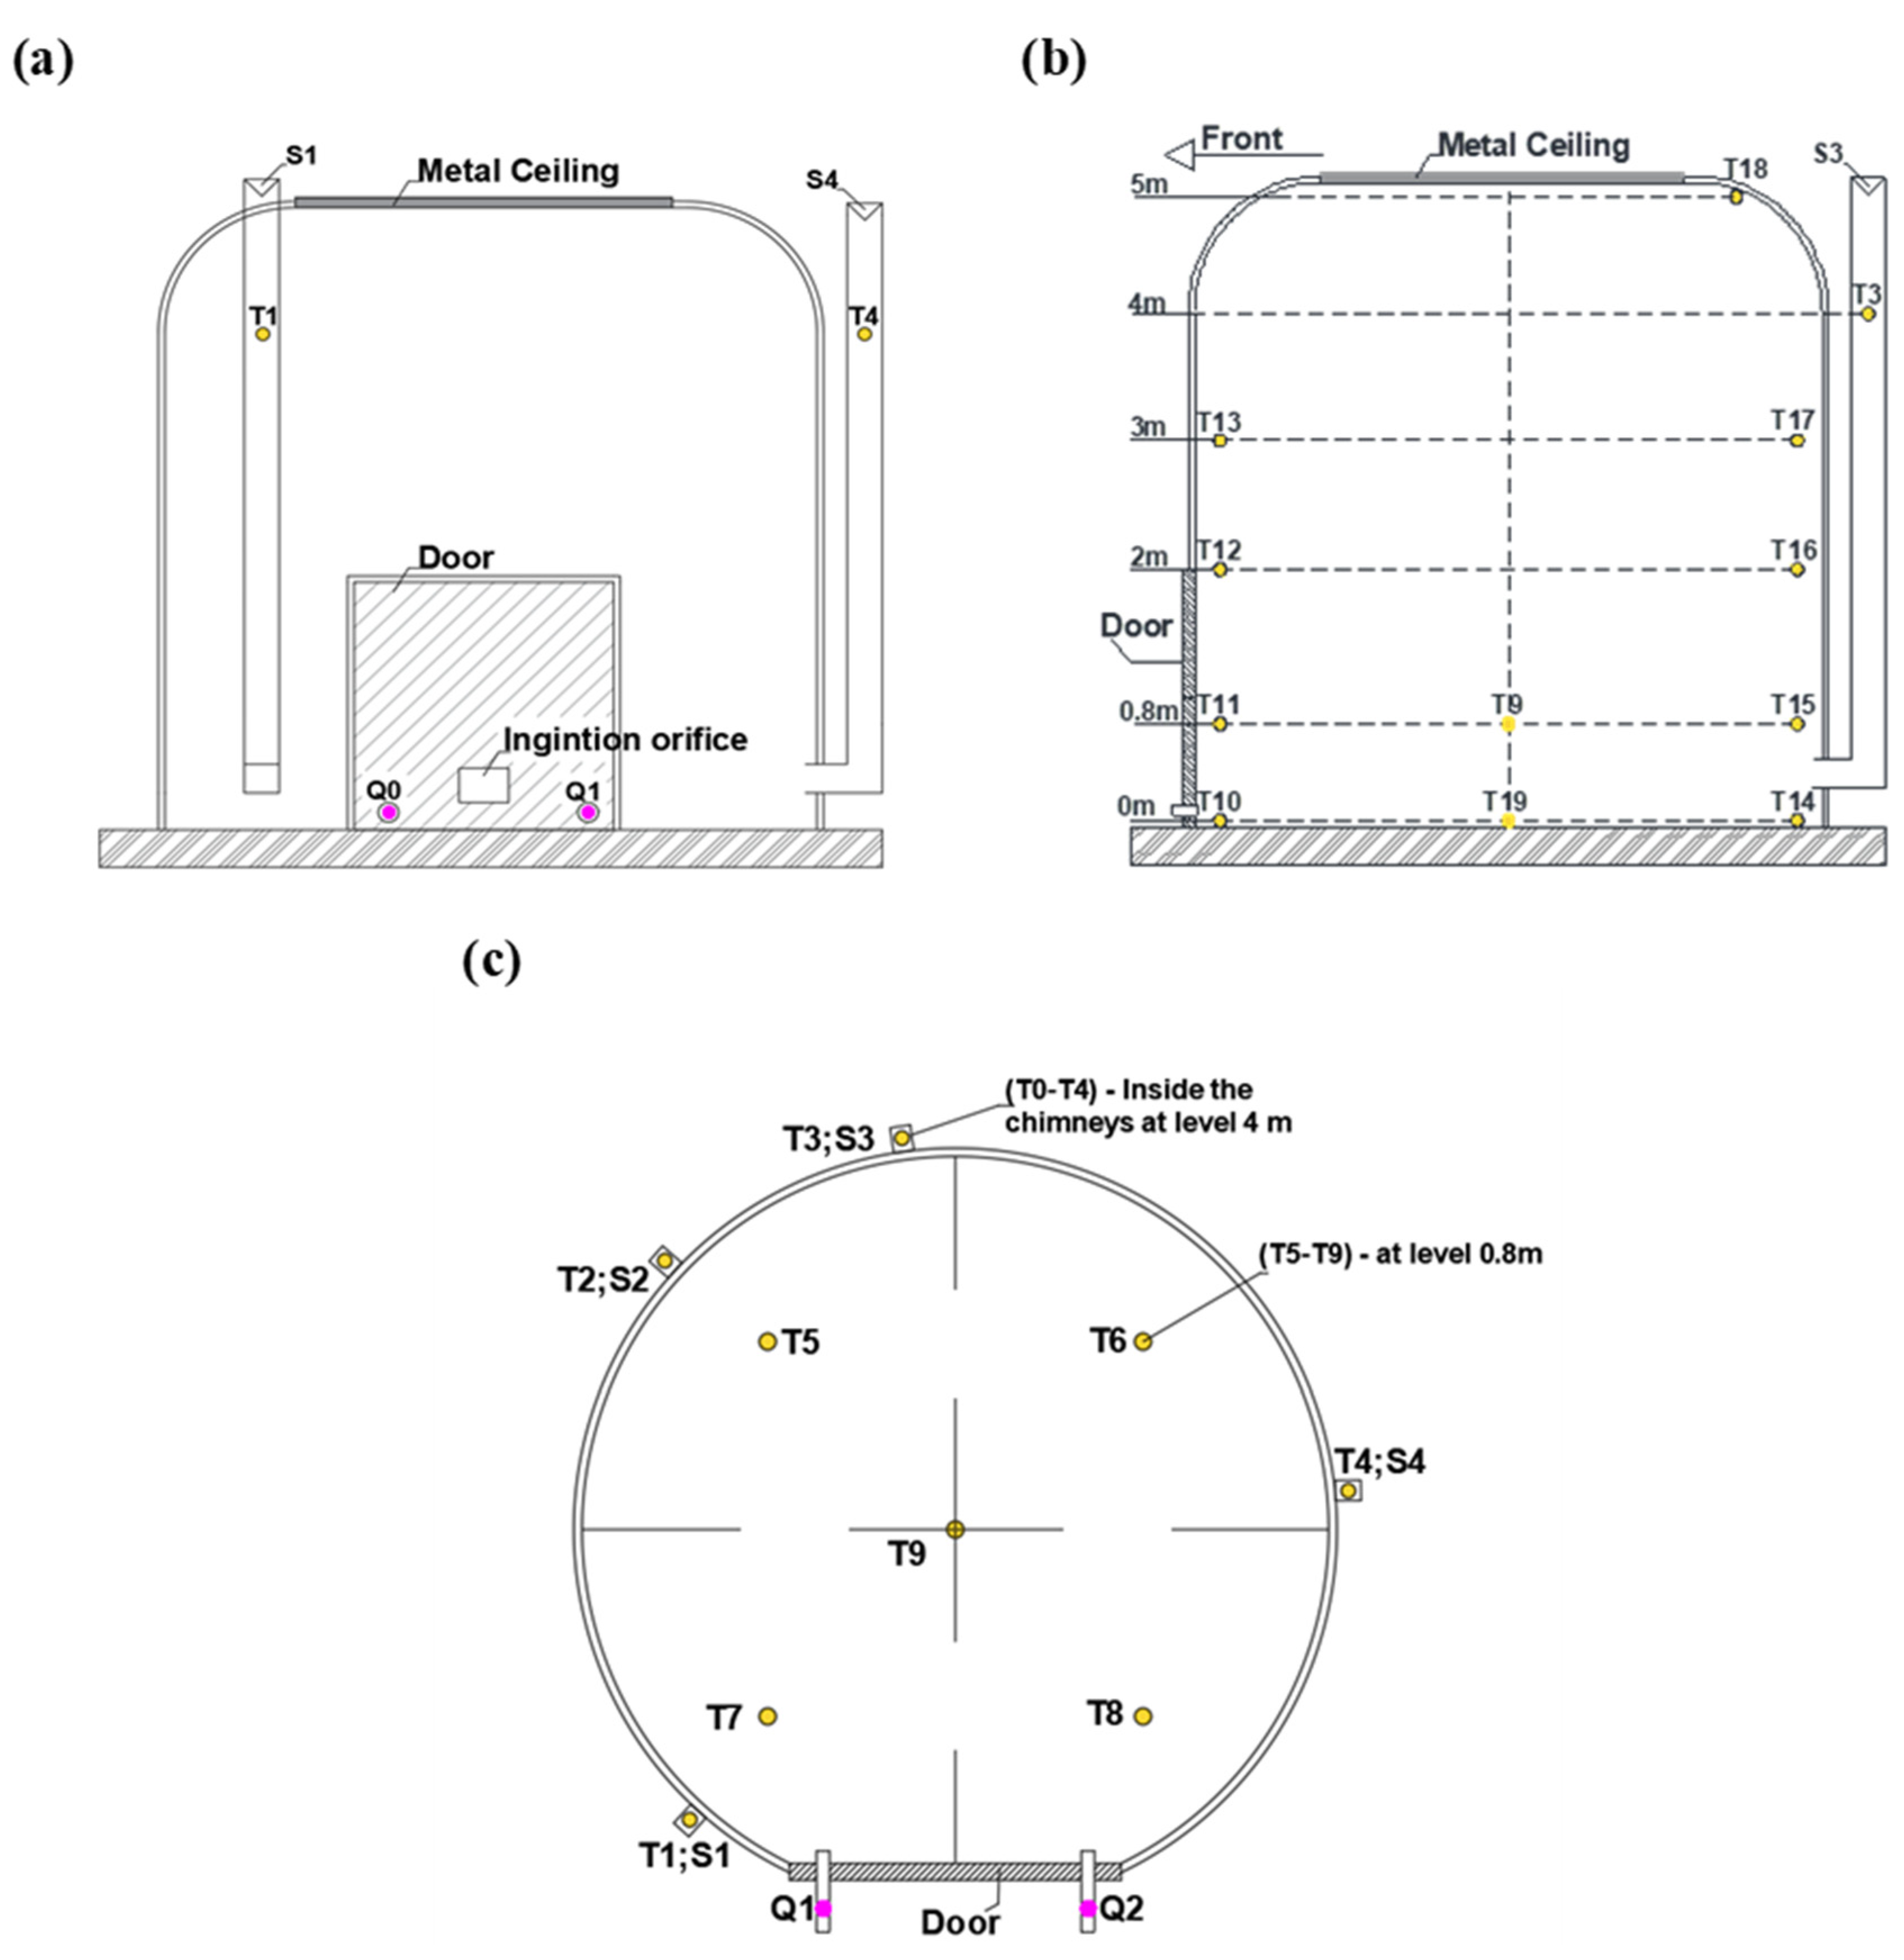
2.2. Carbonization Kiln

Figure 1 shows a schematic diagram of the carbonization kiln used in this work. It is a batch-operated cylindrical kiln with an internal charcoaling chamber of ≈4.50 m in diameter and ≈5 m in height (≈80 m3 in volume). The kiln is constructed with double walls made of hollow clay bricks in combination with solid clay bricks. Cement mortar is used as a binder agent. On the interior walls, the bricks are sometimes arranged radially with the tops facing the centerline of the kiln. A cement base forms the kiln floor while a metal sheet welded to suitable support beams is used as a ceiling. This metal ceiling can be put in place or removed from the top of the kiln with a telehandler. A sand layer is placed around the edges of the metal ceiling to seal it as needed. The kiln has a square door of 2 m × 2 m at its front, consisting of a single brick wall with an outer bond made of red clay. This brick door is laid by hand before each carbonization run. Three orifices of about 15 cm × 15 cm are left at the base of the door. Two of them are used as air intakes into the charcoaling chamber, while the other allows ignition of the wood charge inside the kiln. The carbonization gas leaves the charcoaling chamber through four ducts located at 0.3–0.8 m above the kiln floor (see Figure 1), which then connect to vertical chimneys that allow the gas to be discharged directly into the atmosphere. Two of these chimneys are built of bricks—square section—and the other two of round steel tubes. The internal cross-section of each chimney is about 100 cm2. The kiln is built on sloping terrain to facilitate charging through the top rear and is buried around its entire perimeter except for the front door area. Dedicated ports for monitoring the operating conditions inside the kiln were not available in the original design. The experiments were supported by the personnel involved in the operation of the kiln and the whole set of equipment/machinery available in the charcoal production facility, such as front loaders, a vehicle weighing scale, conveyor belts, etc.

2.3. Carbonization Procedure

The carbonization experiments followed the usual procedures used in the charcoal production facility, as established by the kiln operators. The process begins by removing the metal ceiling and cleaning the kiln. Then wood begins to be placed inside the kiln through the door, with the help of the operators who arrange the first layer of wood consisting of stumps and partially charred wood from the previous cycle. Random layers of holm oak and cork oak are then dropped from the top of the kiln into the carbonization chamber with a front loader. As soon as the kiln is filled with wood, the metal ceiling is put back in place and the brick door is built. Sand and red clay are used at different points in the kiln to seal the carbonization chamber. Ignition is done through the port located at the base of the kiln door, using a lighter and flammable material (e.g., paper, cardboard, and small wood sticks). The heat needed to raise the temperature of the kiln is supplied by burning a fraction of the wood charge under poorly controlled stoichiometric conditions. Kiln control actions during the carbonization phase are scarce and are mainly based on qualitative process observations. For example, the color of the carbonization gas leaving the chimneys is usually taken as a process indicator that triggers certain kiln control actions by the operators. One of these actions isto seal the chimneys once a blue-grey flue gas is observed since it is considered an indication of complete carbonization. After all chimneys are closed, the front air inlet is also closed, and the door, exterior walls, and metal ceiling of the kiln are checked for possible cracks. The sealing of the cracks is done by spreading additional red clay mortar. This stops any combustion processes inside the kiln, thus causing the kiln temperature to drop and the carbonization process to end. The process then enters the cooling stage, which can take several days. Once cooled, the kiln door is disassembled, the charcoal is removed from the kiln and transferred to a hopper (≈10 m3) by a small tractor-loader. A conveyor belt beneath the hopper further transfers the charcoal onto a vibrating screen sieve (≈20·mm mesh) sorting the charcoal by particle size. Particles smaller than ≈20 mm, including small charcoal particles, dust, ash, and inert materials, are separated and pilled outdoors (hereafter referred to as charcoal fines). The remaining material is inspected for the presence of partially charred wood and large pieces of inert materials e.g., large rocks entering the kiln during the loading process. Only the charcoal particles within 20 to 150 mm in size are bagged and weighting for marketing. More detailed descriptions of the current charcoaling practices in Portugal can be found in [36].

2.4. Measurements

2.4.1. Mass of the Wood Charge

The total mass of wood (as received) charged into the kiln was estimated from the number of loads carried out by the front loader underuse, after a previous assessment of the average net weight of the individual loads. For this purpose, the gross weight of the front loader was measured a minimum of five times for each type of wood feedstocks listed in Table 1, and the respective tare weight was subtracted. A vehicle scale was used to perform these measurements.

2.4.2. Temperatures

Continuous temperature measurements were done by 19 K-type thermocouples positioned at different locations in the kiln, as shown in Figure 1. Vertical temperature profiles were measured at the front (T10 to T13) and rear (T14 to T18) zones of the charcoaling chamber. Besides, two thermocouples (T9 and T19) were placed in the centerline of the kiln, at levels 0 m and 0.8 m. Another four thermocouples were radially distributed at level 0.8 m (T5 to T8) to create a radial temperature profile in the kiln (note that T9, T11, and T15 are also at level 0.8 m). Additionally, one thermocouple was placed inside each of the chimneys, at about 1 m from the outlet, to monitor the temperature of the carbonization flue gases (T1 to T4). The positioning of the thermocouples inside the kiln was done with the help of stainless-steel tubes resting on the kiln floor, thus allowing the thermocouples to be inserted to the exact measuring points. More than 60 m of high-temperature thermocouple wire (type K, RS PRO) were used in the experiments.

2.4.3. Airflow Rate

The airflow rate entering the carbonization chamber through the two air intakes at the kiln door (Q1 and Q2 in Figure 1) was measured by air velocity sensors (OMROM 0–1 or 0–4 m/s) mounted in stainless-steel tubes (0.15 m in diameter and 1 m in length). The calibration of these air velocity sensors was performed in the laboratory following different methods (e.g., the CO2 dilution method [41]).

2.4.4. Composition of the Carbonization Gas

The raw carbonization gas exiting each of the kiln chimneys was sampled twice a day. For this purpose, a 1.5 m heated probe (AISI 316 steel, max. 180 °C) was inserted down through the chimneys to sample the raw gas (one at a time). About 1 ln/min of gas was led through a series of ice-cooled traps, membrane quartz filters, and silica gel columns to remove condensable organics, water, and particles before being collected in suitable sampling bags (SKC FlexFoil). The sampling bags were later subjected to gas chromatography analysis (SRI8610#3, TCD + FID detectors) to derive the composition of the dry and clean carbonization gas in terms of CO, CO2, CH4, C2H4, C2H6, C3H8, H2, O2, and N2. The chromatographic method was based on 9′ Hayesep D and 6′ Molecular Sieve 13X columns and a temperature program consisting of a heating ramp from 40 °C to 200 °C at 20 °C/min.

2.4.5. Yields and Properties of the Carbonization Solid Products

The mass of charcoal recovered from the kiln was estimated from the quantity and weight of charcoal bags packed for marketing. The total mass of charcoal fines was estimated by weighting the mass of fines leaving the sieve over a period equivalent to the filling of 10 consecutive charcoal bags. This procedure was repeated up to five times during the kiln discharge procedure to obtain an average of the kg fines/kg charcoal ratio. The total mass of charcoal fines recovered from the kiln was then obtained from the average kg fines/kg charcoal ratio and the total mass of charcoal recovered. Finally, the mass of partially charred wood was measured following the same procedure as for the wood feedstock (see Section 2.4.1). The yields of solid products were obtained by dividing the total mass of each product by the total mass of dry wood feedstock charged into the kiln.
Samples of charcoal, charcoal fines, and partialized charred wood were collected during the kiln discharge process. The samples were hand-ground in the laboratory and subjected to proximate analysis (moisture, ash, fixed carbon, and volatile matter contents according to DIN 51718, CEN/TS 15148:2005, and CEN/TS 14775:2004), and elemental analysis (CHNS), while the respective LHV was also estimated according to [40].

2.5. Data Acquisition

Data signals from the thermocouples and airflow sensors were read, visualized, and recorded through a data acquisition system based on Advantech’s ADAM 4019/4050/4055 series modules and software. In addition, temperature dataloggers (Testo 176) were used to check and record temperatures in several kiln locations during the experiments.

2.6. Process Conditions

Two complete carbonization cycles (hereinafter referred to as Test 1 and Test 2) are described in this work with the relevant data summarized in Table 2. Similar process conditions were obtained for both tests, with the most notable differences being the moisture content of the wood feedstock—from 23 wt.% in Test 1 to 12 wt.% in Test 2—caused by a short period of rain in the days leading to Test 1 and the fact that wood is stored outdoors.

3. Results and Discussion

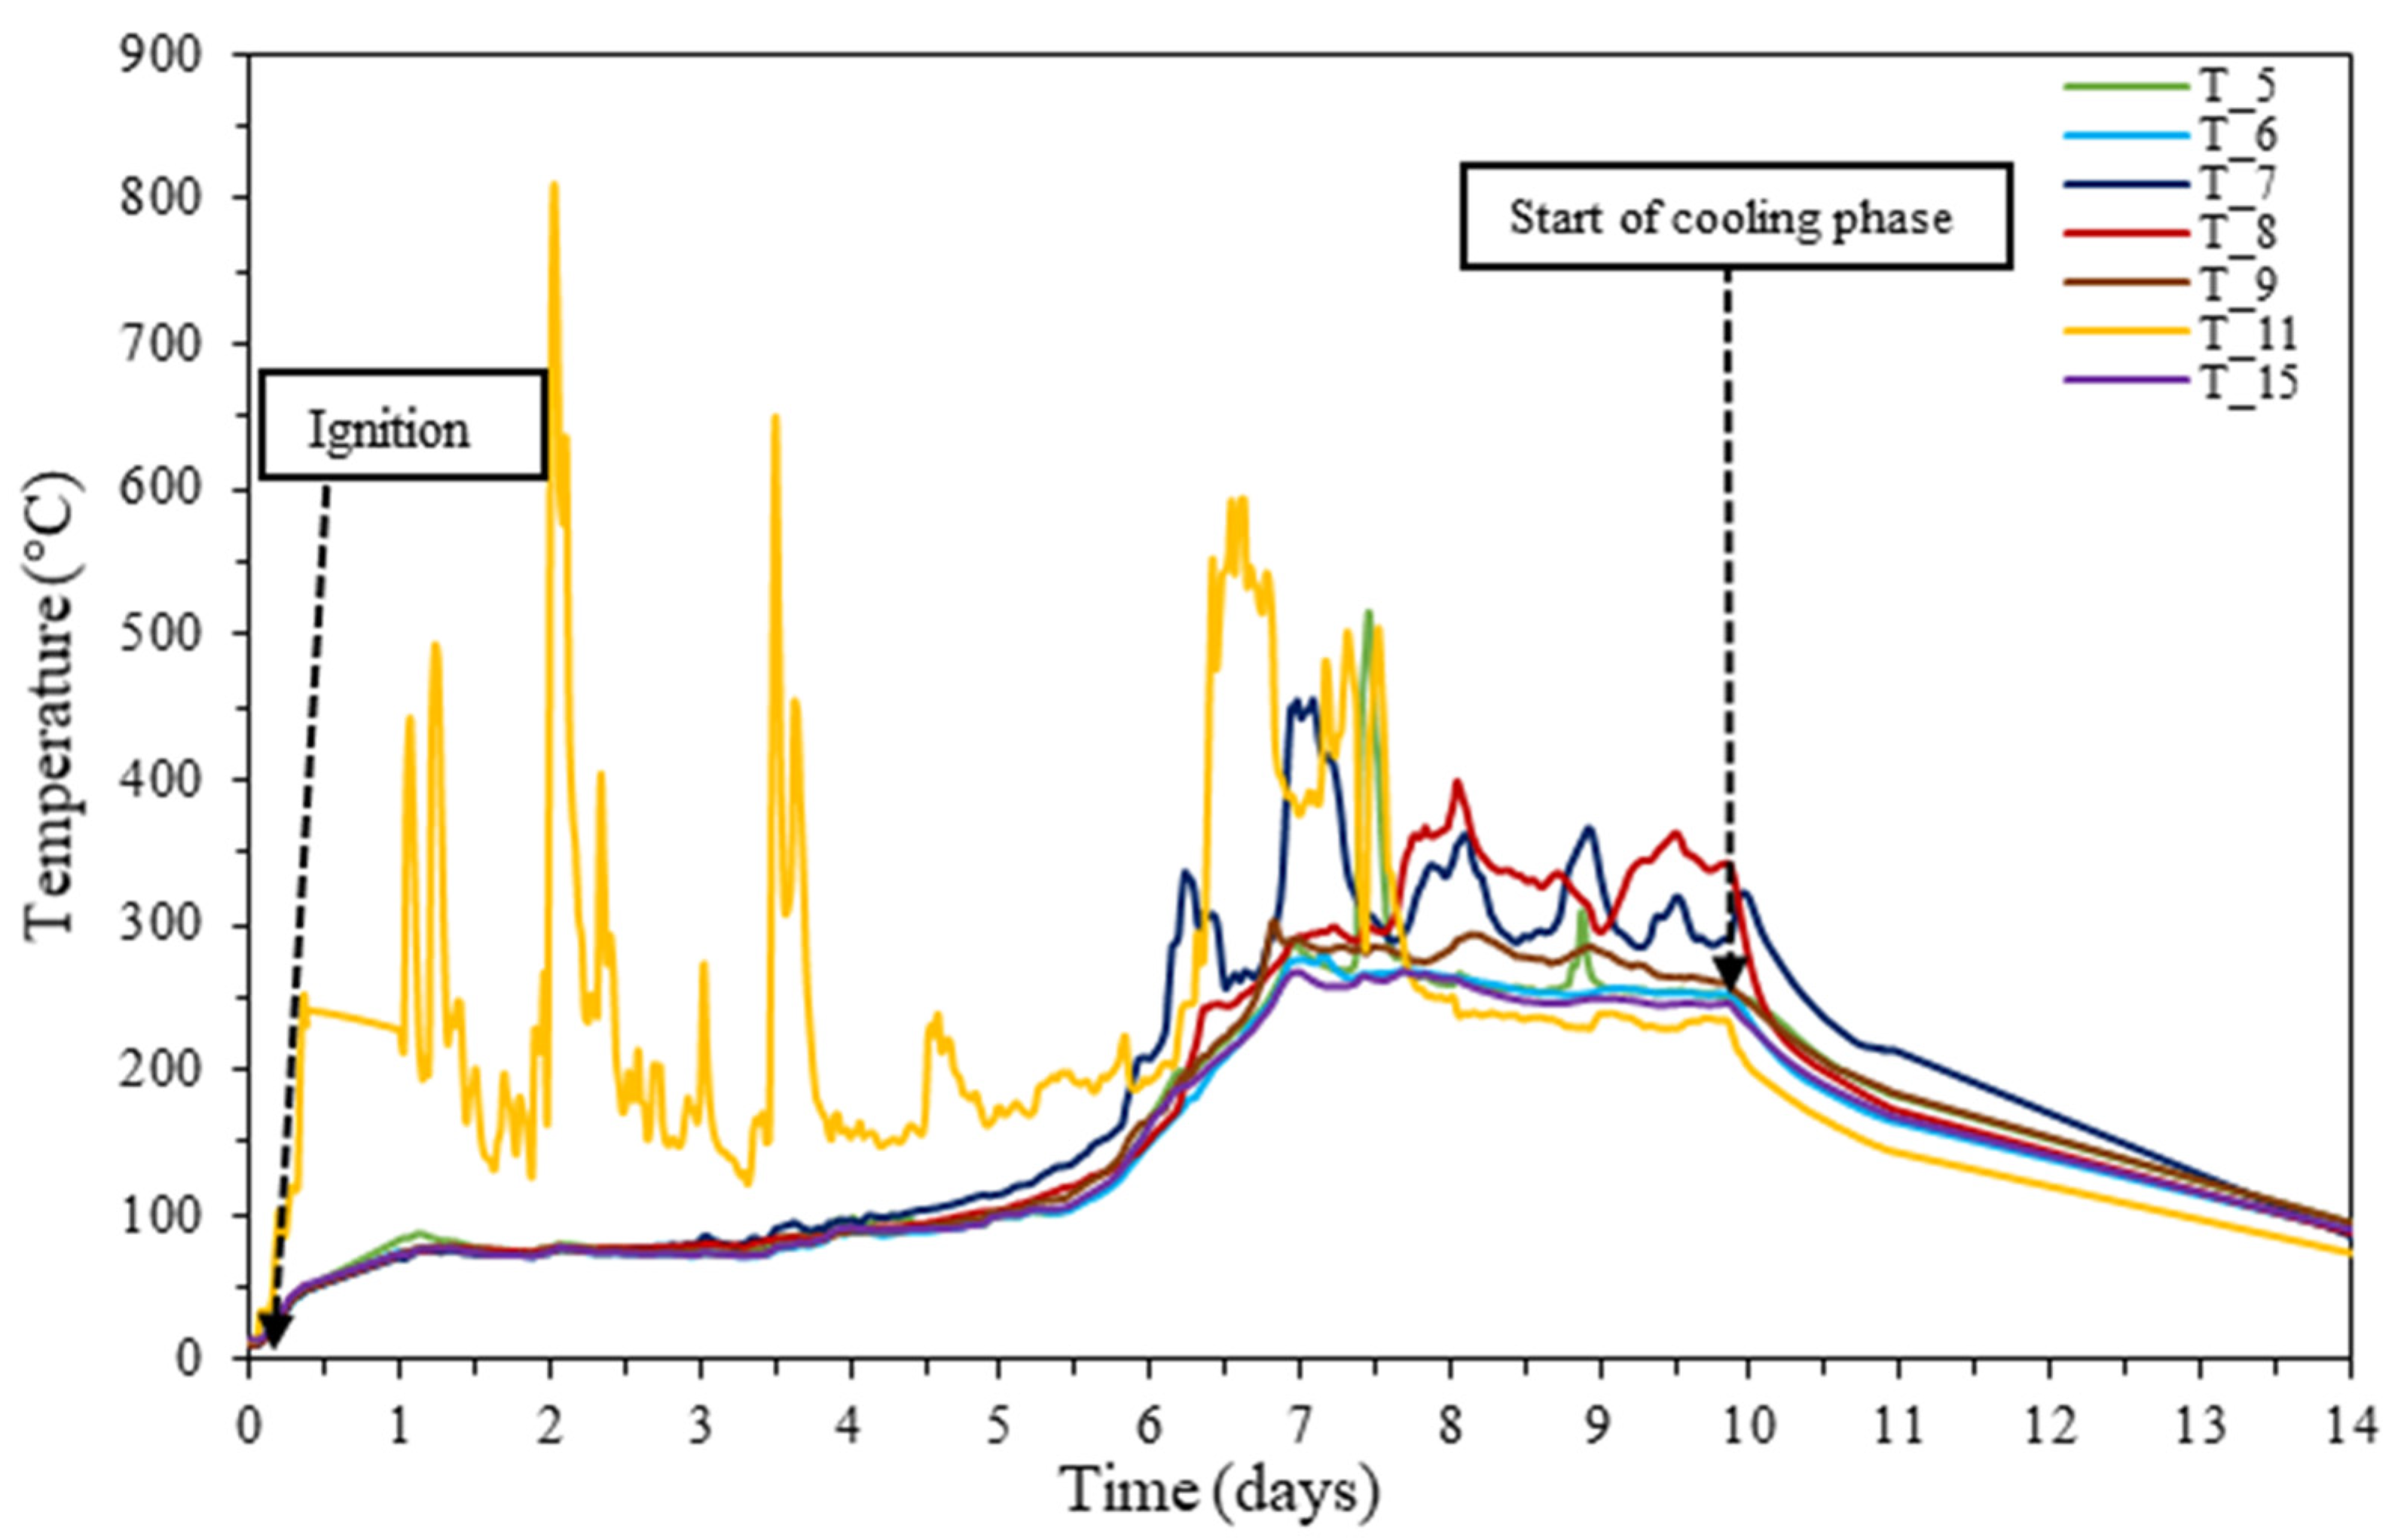
3.1. Temperature-Time Profiles

Once the wood is ignited, a vertical temperature profile develops within the kiln, which means that different levels of the kiln will be at different temperatures (or, in other words, at different stages of carbonization). It is then necessary to choose a particular level of the kiln to describe the temperature–time profile experienced by the converting wood load. Since seven thermocouples were available at 0.8 m (see Figure 1), this level was chosen to illustrate the temperature evolution over the first 14 days of the process (see Figure 2). The sequence of temperatures shown for the 0.8 m level is similar to those in other levels of the kiln, although there is a lag time between different levels in the kiln because of the vertical temperature profile mentioned above (see also Section 3.2). For the sake of clearness, only the results for Test 1 are shown in Figure 2, although the results were consistent and similar for both tests described in Table 2. The lack of data from day 14 onward was due to power supply failures at the charcoal production facility.
The first aspect to highlight in Figure 2 is that the temperature near the kiln’s door (T11) shows different behavior from the other measurement points at the 0.8 m level, being characterized by consistently higher (up to ≈800 °C) and unstable values. This behavior is related to the ignition technique used since the combustion process—which allows the kiln to heat up—develops from the ignition hole in the kiln door (see the position of the ignition hole in Figure 1). As a result, the T11 thermocouple captures the phenomena related to wood devolatilization and gas-phase combustion of the volatiles, involving fast chemical reactions and releasing large amounts of energy. Active flames were seen through the ignition and air inlet holes during the initial days of the carbonization process. On the opposite, the T5–T9 and T15 thermocouples, which are away from the combustion zone, show a stable and similar pattern. Even the T7 and T8 thermocouples, located only ≈1 m away from the door (Figure 1), do not show the unstable and highly exothermic phenomena observed in T11, at least for the first days of the cycle. This shows that the area near the door is unique and does not represent what happens in the majority of the kiln. For this reason, little will be said about the T11 thermocouple in the following discussion of temperatures-time profiles in the bulk of the wood charge.
Figure 2 shows that the carbonization cycle—at the 0.8 m level of the kiln—begins with a one-day heating phase from ambient temperature to nearly 100 °C, i.e., the steam saturation temperature at atmospheric pressure [42]. After this point, water/steam equilibrium determines the next phase of the process to be almost isothermal (i.e., at ≈100 °C) until the wood feedstock is completely dry. The drying phase lasts up to about day four, corresponding to a water evaporation rate of roughly 65 kg/h (considering 28.2 tons of wet wood with an average moisture content of 23 wt.%, as shown in Table 2). From the fifth day on, the wood located at the 0.8 m level is almost dry and, as a result, the temperature rises again. This new heating phase raises the temperature of the kiln to a plateau typically between 250 and 350 °C, at a heating rate of no more than 0.1 °C/min. The increase in temperatures in the kiln enables the carbonization stage to begin since the wood macro-components (hemicellulose, cellulose, lignin, and extractives) are thermally unstable at these temperatures (see e.g., [43]). For instance, thermogravimetric analysis of both softwoods and hardwoods, under an inert atmosphere, showed that weight loss starts at about 200 °C, and increases rapidly above 250 °C [44]. This low-temperature degradation of wood was attributed primarily to the decomposition of hemicellulose and cellulose, involving dehydration and deacetylation reactions [45], while lignin was found to degrade at higher temperatures (typically above 300 °C) [46]. The bulk of the carbonization process occurs during a three-day period (from day 7 to 10) during which the kiln temperature stabilizes within the above-referred range of 250–350 °C. However, it should be noted that the peaks above 300 °C observed during this phase are from thermocouples T7 and T8 that are closer to the kiln door. Since wood combustion develops from the ignition hole upward and toward the center of the kiln, it is justified that thermocouples T7 and T8 also start to show higher and more unstable values as the process develops. Therefore, if we consider that T7 and T8 also become more directly influenced by the above-referred combustion phenomena, it can be stated that the temperature across the kiln does not exceed ≈300 °C during the carbonization phase. As discussed above, these temperatures are low and perhaps insufficient to extensively convert the main components of wood (mainly lignin) thus compromising the charcoal quality (see Section 3.5).
Two aspects are worth noting about the phase of temperature stability between days 7 and 10 (Figure 2). The first is related to the stable behavior of thermocouple T11 from day 8 onward. The large quantity of the wood feedstock near the door is already burnt at this time and, thus, there is no further active combustion in the vicinity of thermocouple T11; also, a significant amount of ash accumulates, as was later observed during kiln discharge. As a result, starting on day 8, thermocouple T11 follows the average trend of the other thermocouples at level 0.8 m. The second aspect is related to thermocouple T5 located at the rear part of the kiln, close to chimney S2, where temperature peaks up to 550 °C were observed. This behavior is related to a common occurrence in this type of kilns: at certain moments in the process, one or more chimneys can act as air intakes rather than as carbonization gas outlets. This also results from the accumulation of ash near the kiln door, which can lead to a partial or total clogging of the air intakes. As a result, the kiln draft forces air downward through one or more chimneys to compensate for the clogged air intakes. The air entering through the chimneys allows combustion processes to develop near the exhaust ducts at the base of the kiln, leading to the emergence of hotspots. This was the case for chimney S2, which started acting as an air intake at an early stage of the process (on day 4 of Test 1), as visually confirmed by the absence of smoke coming out of this chimney and also by the fact that its temperature (T2 in Figure 1) dropped to nearly ambient temperature by the same time (data not shown). Later inspection of the gas outlet duct leading to chimney S2 showed significant ash deposition in this area (Figure 3), thus confirming the occurrence of combustion near thermocouple T5.
On day 10, the process goes into the last phase, which is the cooling phase. This phase begins once the air intakes and chimneys are sealed by the kiln operators using, for example, red clay mortar. Sometimes a delay of up to two days occurs in sealing, depending on the assessment made by the operators. During the cooling phase, the internal temperature of the kiln tends to balance, as seen in Figure 2. It takes 10 to 12 days for all the thermocouples inside the kiln to reach temperatures below 50 °C, which corresponds to an average cooling rate of less than 0.5 °C/min. This long cooling period brings the total length of the carbonization cycle (carbonization period + cooling period) to over 20 days (see Table 2) and represents significant productivity losses for the process.

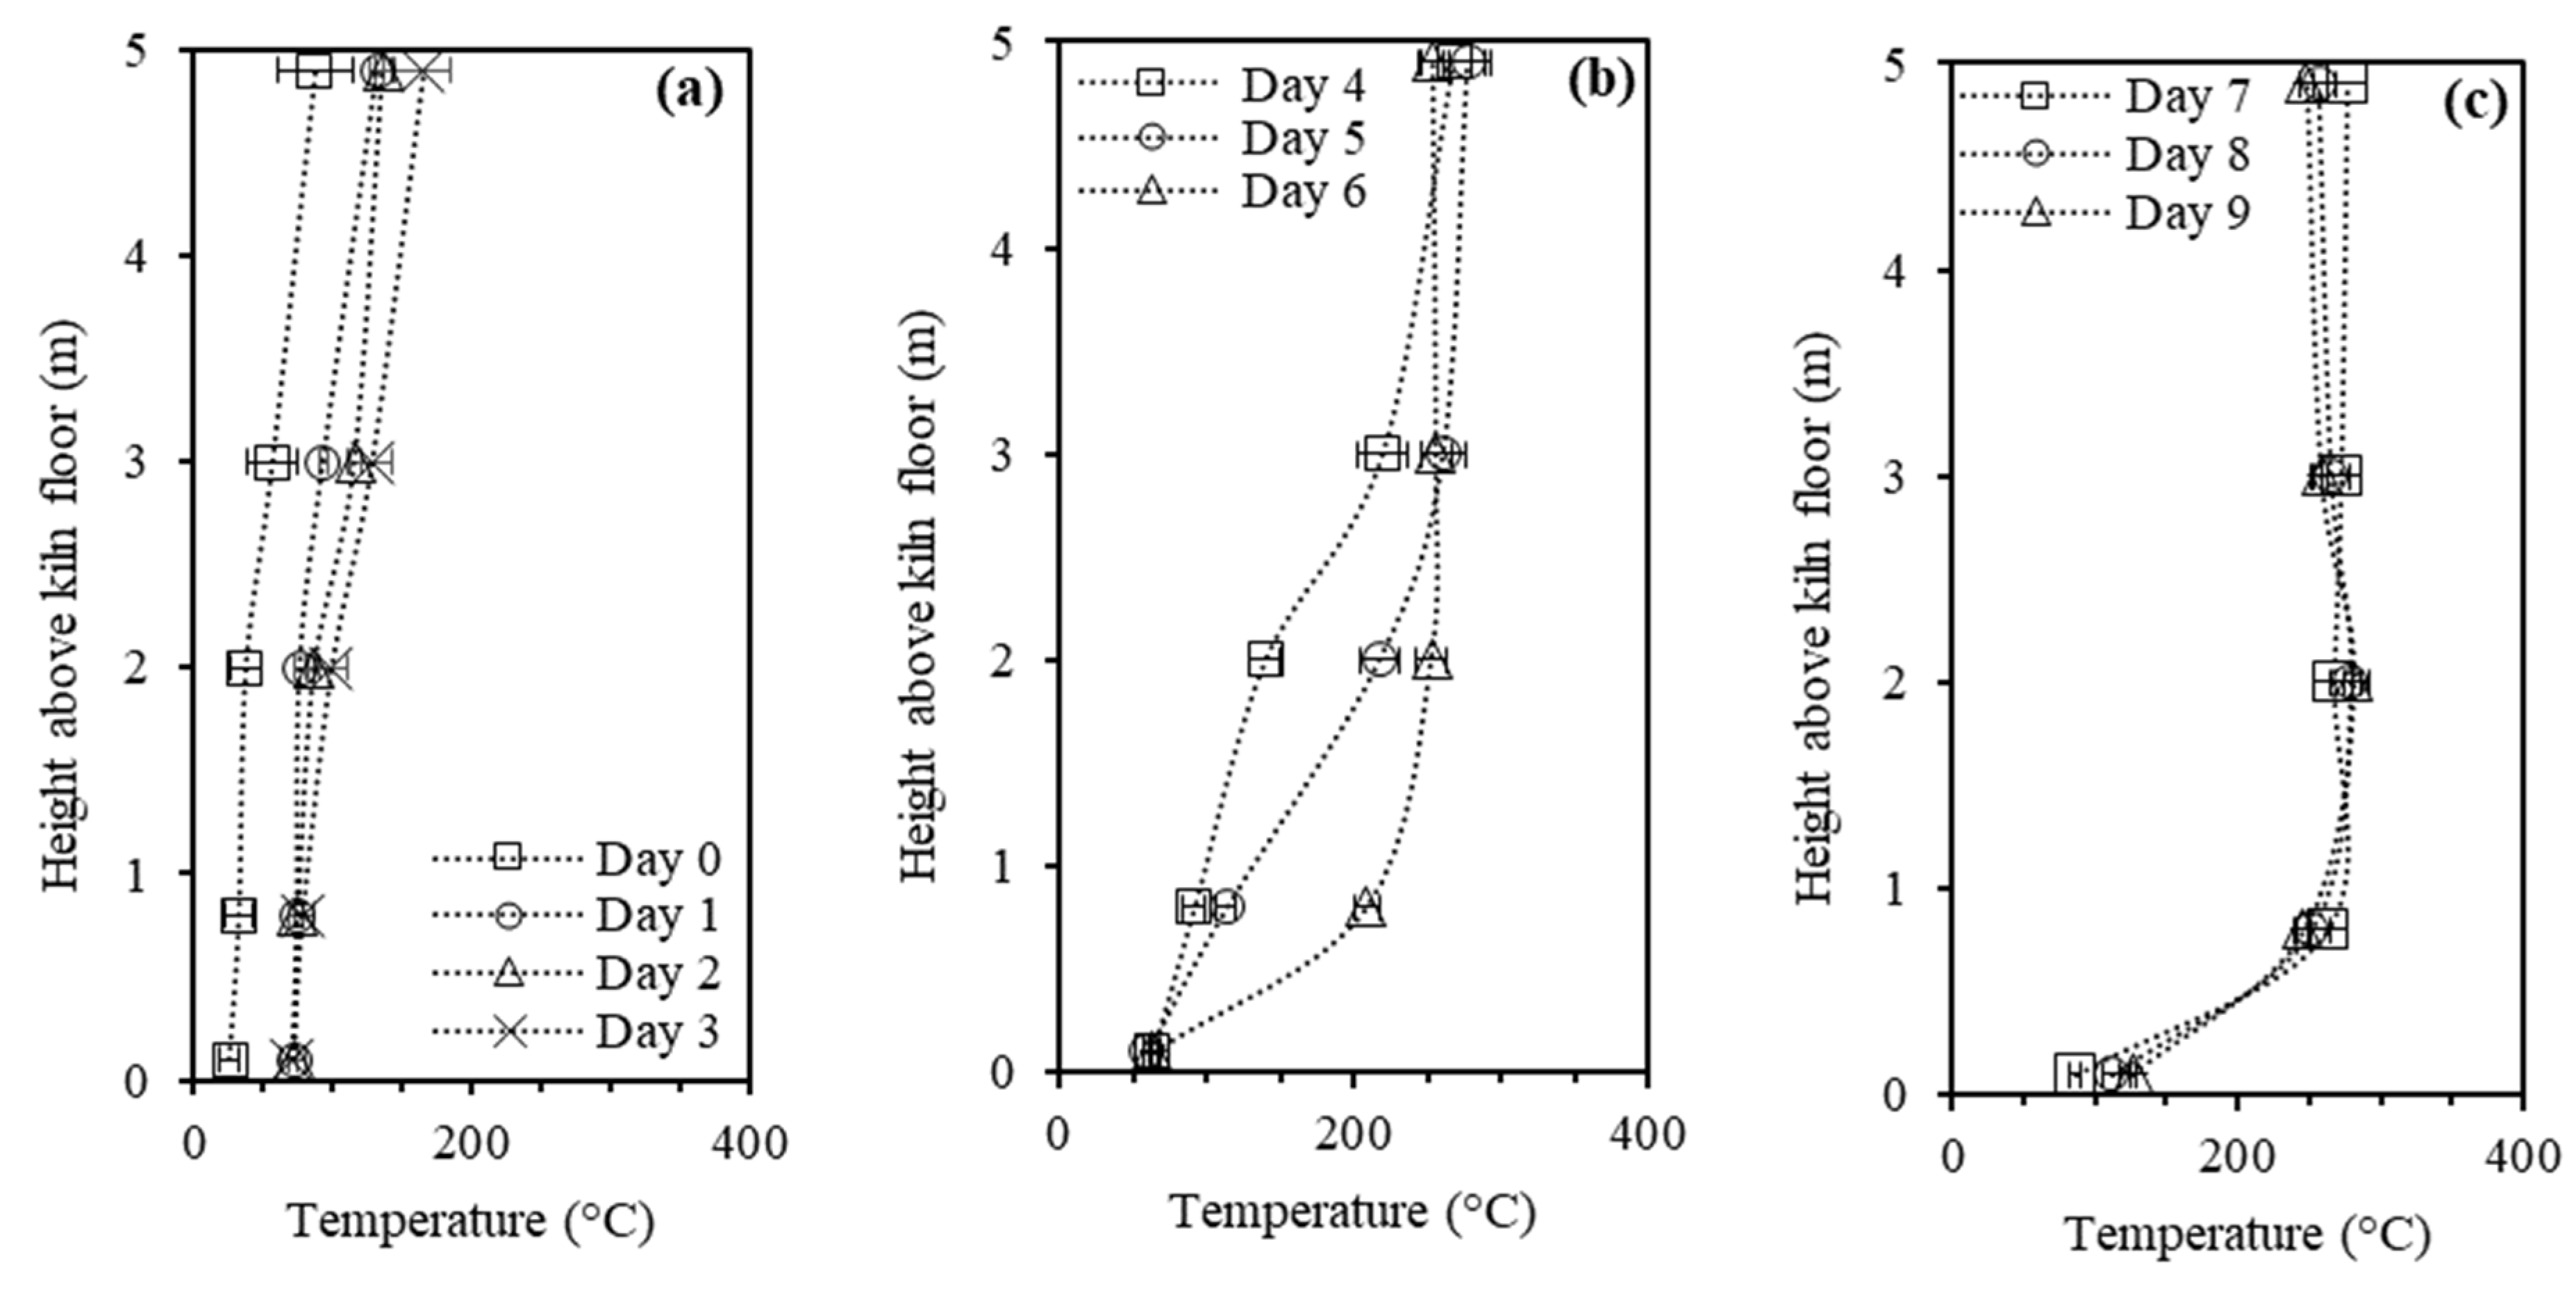
3.2. Vertical Temperature Profiles

Figure 4 shows the daily average, maximum, and minimum temperatures registered on a vertical profile at the rear part of the kiln during Test 1, as given by thermocouples T14 to T18 in Figure 1. It is expected that this vertical profile remains valid in other positions of the kiln, except in the zone close to the door where continuous combustion phenomena was observed. Figure 4 also provides insight into the time lag between the 0.8 m level and other levels in the kiln.
Figure 4 shows that although the wood load is ignited near the base of the kiln door, the temperate rises faster at the top of the kiln than at the bottom. For instance, on day 4, the average temperature at the 5 m level thermocouple (T18) is 280 °C (i.e., the aforementioned 250–300 °C plateau has already been attained at this level), while at the 0.8 m and 0 m levels it is still below 100 °C. This means that, on day 4, the wood at the 5 m level has already started to carbonize while the wood below the 0.8 m level is not even completely dry. At the 0.8 m level, it takes an additional three days for the temperature to reach ≈270 °C. At the 0 m level, the temperature remains below ≈130 °C during the whole carbonization cycle. The fact that the temperature at the top of the kiln stabilizes at 250–300 °C around day 4 is not a consequence of the control action performed by the kiln operators. It is only the result of the thermal balance between the exothermic combustion reactions, endothermic pyrolysis reactions, and heat losses through the kiln walls, metal ceiling, and chimneys. With the top of the kiln at a steady temperature of 250–300 °C, a downward heat flux develops that promotes the sequential heating and conversion of the lower layers of wood as the process unfolds. Heat transfer primarily occurs by the downward flow of hot gases and vapors (i.e., volatile matter and steam) toward the gas outlets at the base of the kiln. The hot gases and vapors cool down and condense in the lower layers of wood, thus releasing sensible and latent heat that would ultimately lead to an isothermal condition throughout the kiln. However, this process also promotes the accumulation of liquids (i.e., condensed organics vapors and water) at the kiln floor, sometimes making it necessary to drain them out through the door. The condensing vapors are the most plausible explanation for the extremely low temperatures observed at the kiln floor since this level becomes highly influenced by the boiling temperature of the accumulated liquids. The overall result is a steep temperature gradient developing at the base of the kiln. For instance, as of day 7, the whole vertical temperature profile is at 250–300 °C but the base (i.e., at 0 m level) is still under 130 °C (see Figure 4c). As will be seen later, these low temperatures at the kiln floor led to significant amounts of unconverted wood in this region of the kiln.

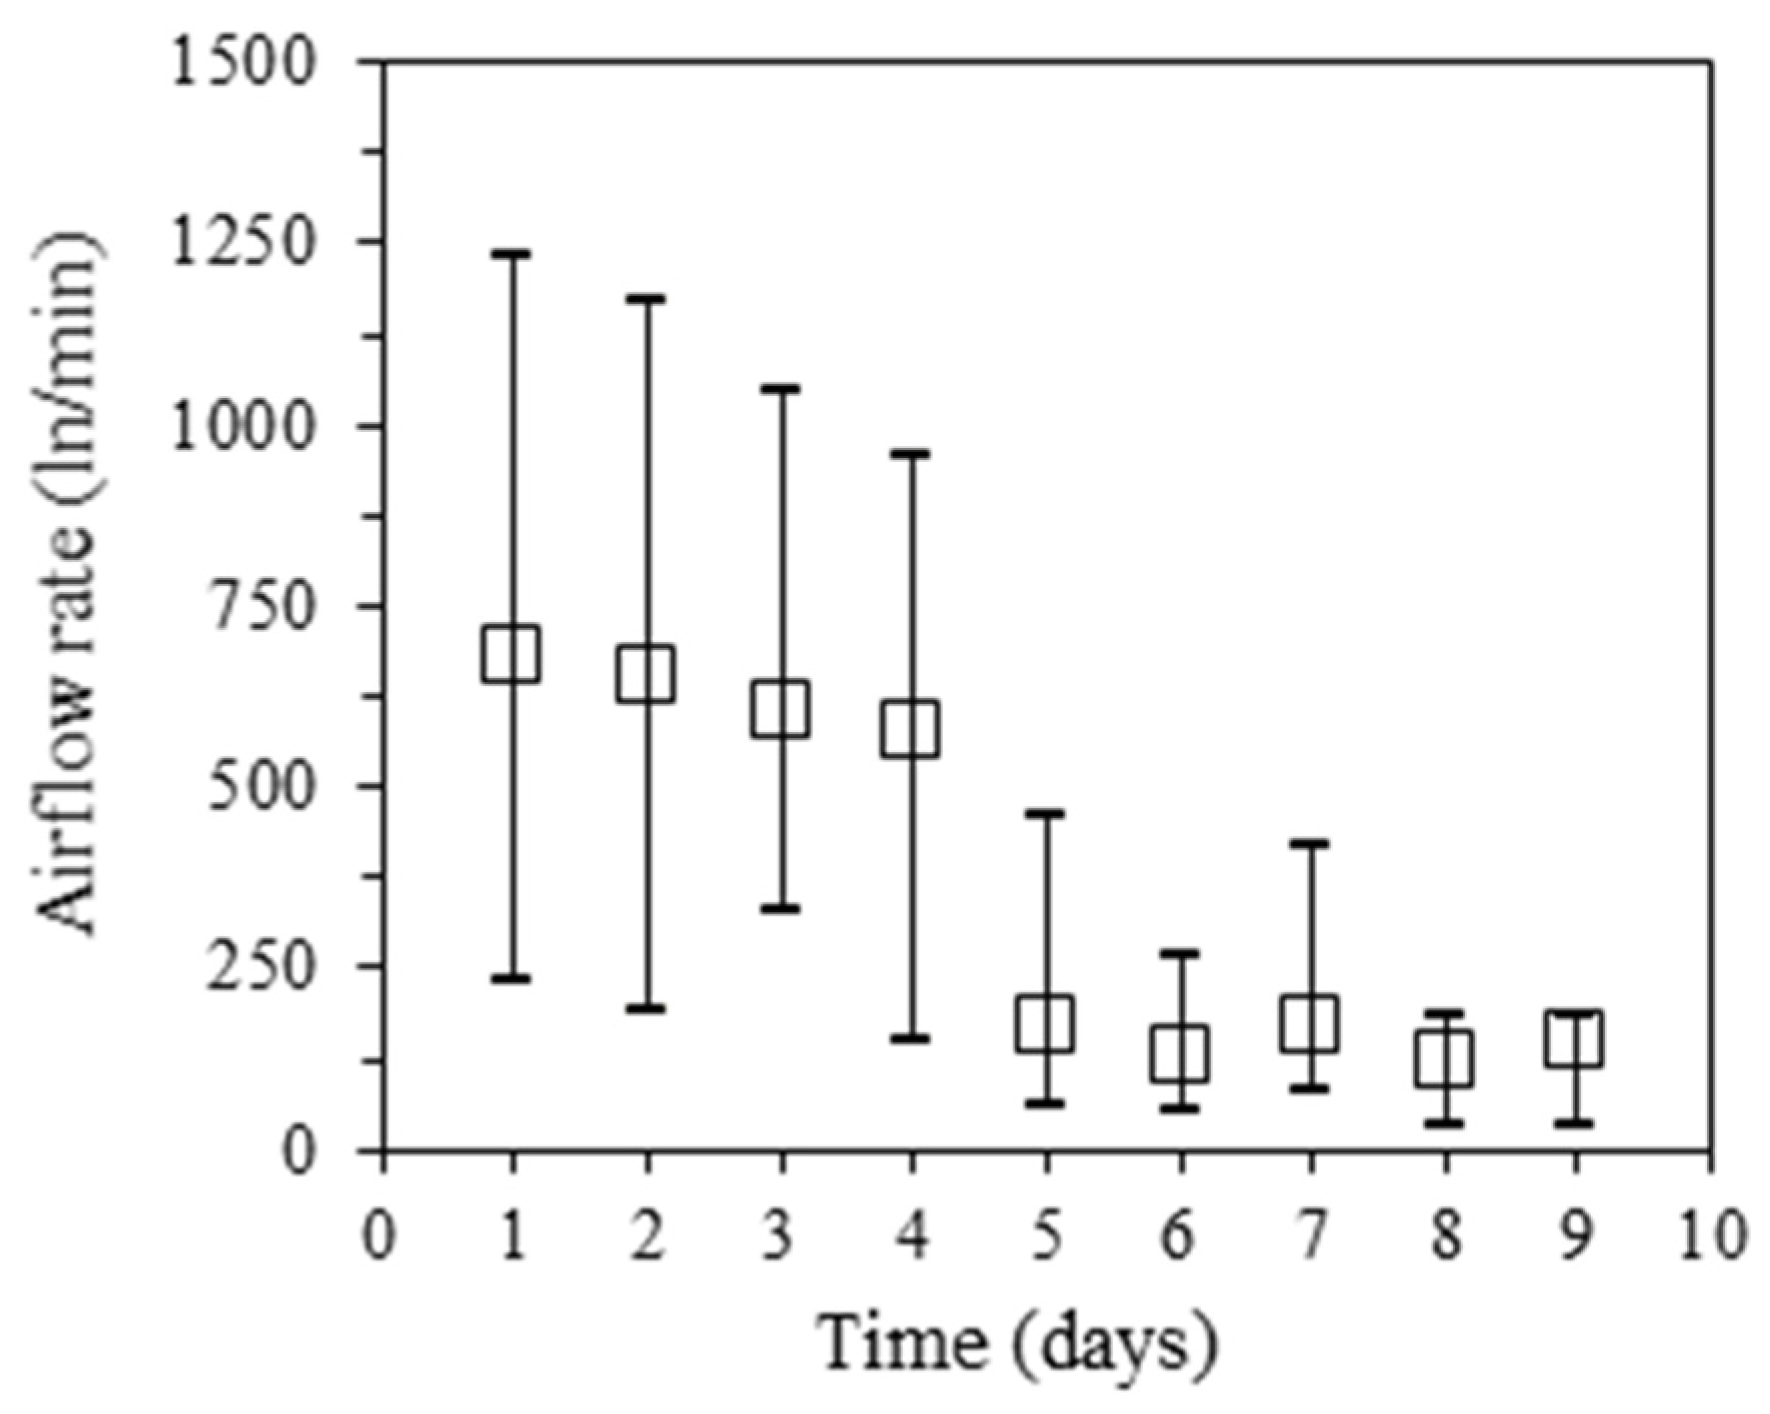
3.3. Intake Airflow Rate

Figure 5 shows the daily average, maximum, and minimum airflow rates through the air inlets at the base of the kiln door, considering the data for both Tests 1 and 2 (see Table 2). Data are unavailable on day 0 because of limitations related to the kiln ignition procedure that prevented the use of the airflow monitoring system. From day 9 onward, no data are available either since the kiln was sealed for cooling. Yet, the figure is based on a complete dataset for Test 1 (data collected from day 1 to day 9) and an incomplete dataset for Test 2 (data collected from day 1 to day 4, sometimes intermittently); this was due to several problems during Test 2, including flowrate sensor failure caused by both the power supply and dust accumulation issues.
Figure 5 shows that the airflow rate is considerably higher during the first four days of the process, with average daily values above ≈600 ln/min and peaks up to ≈1200 ln/min. Thereafter, the airflow rate is typically less than 200 ln/min. One explanation is that the ash resulting from the initial phase of intense combustion near the door leads to clogging of the air intakes within about four days of operation. The plummeting airflow from day 4 to day 5 is consistent with the moment when temperatures start to rise at faster rates at the top of the kiln. For example, the temperature at the 5 m level rises from ≈150 °C on day 4 to above 250 °C on day 5 (see Figure 4). It is then possible that the high airflow rates during the first days of the carbonization cycle may contribute to lowering the temperature inside the kiln because of the increase in the sensible heat of N2 as it travels across the kiln. However, it should be noted that the drop in airflow rate through the air intakes also coincides with the moment when the air begins to enter through chimney S2, as discussed above. Therefore, the decrease in the airflow entering through the door may be partially or fully offset by air entering through other (unmeasured) points in the kiln (including chimney S2 and wall cracks). It is not possible to clarify to what extent this may be the case from the results of this work.

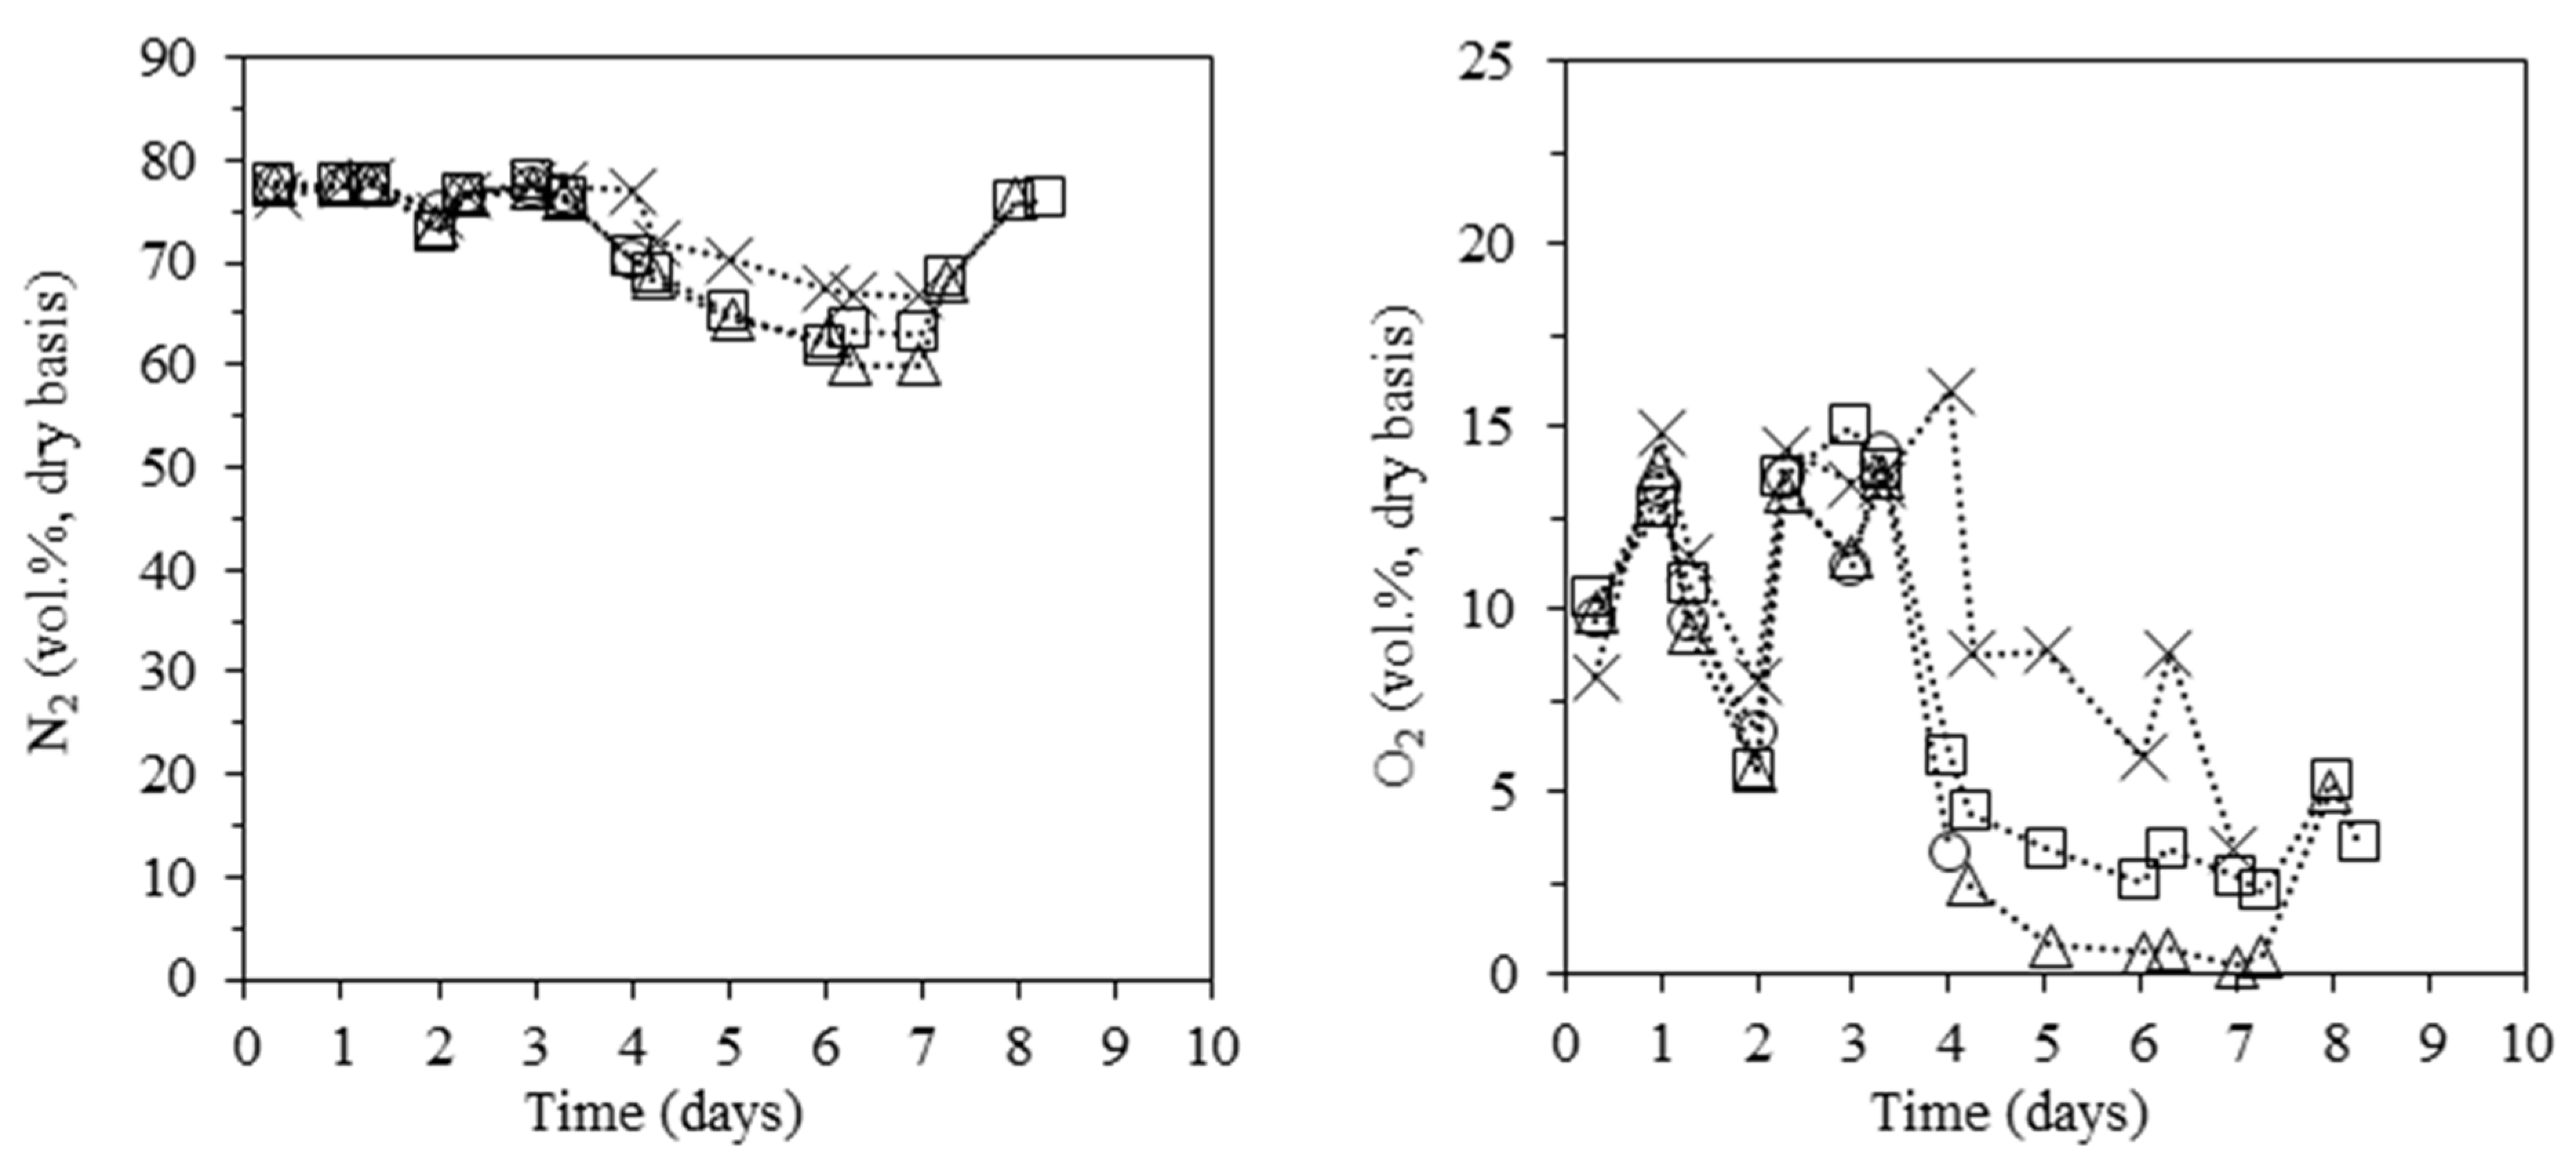
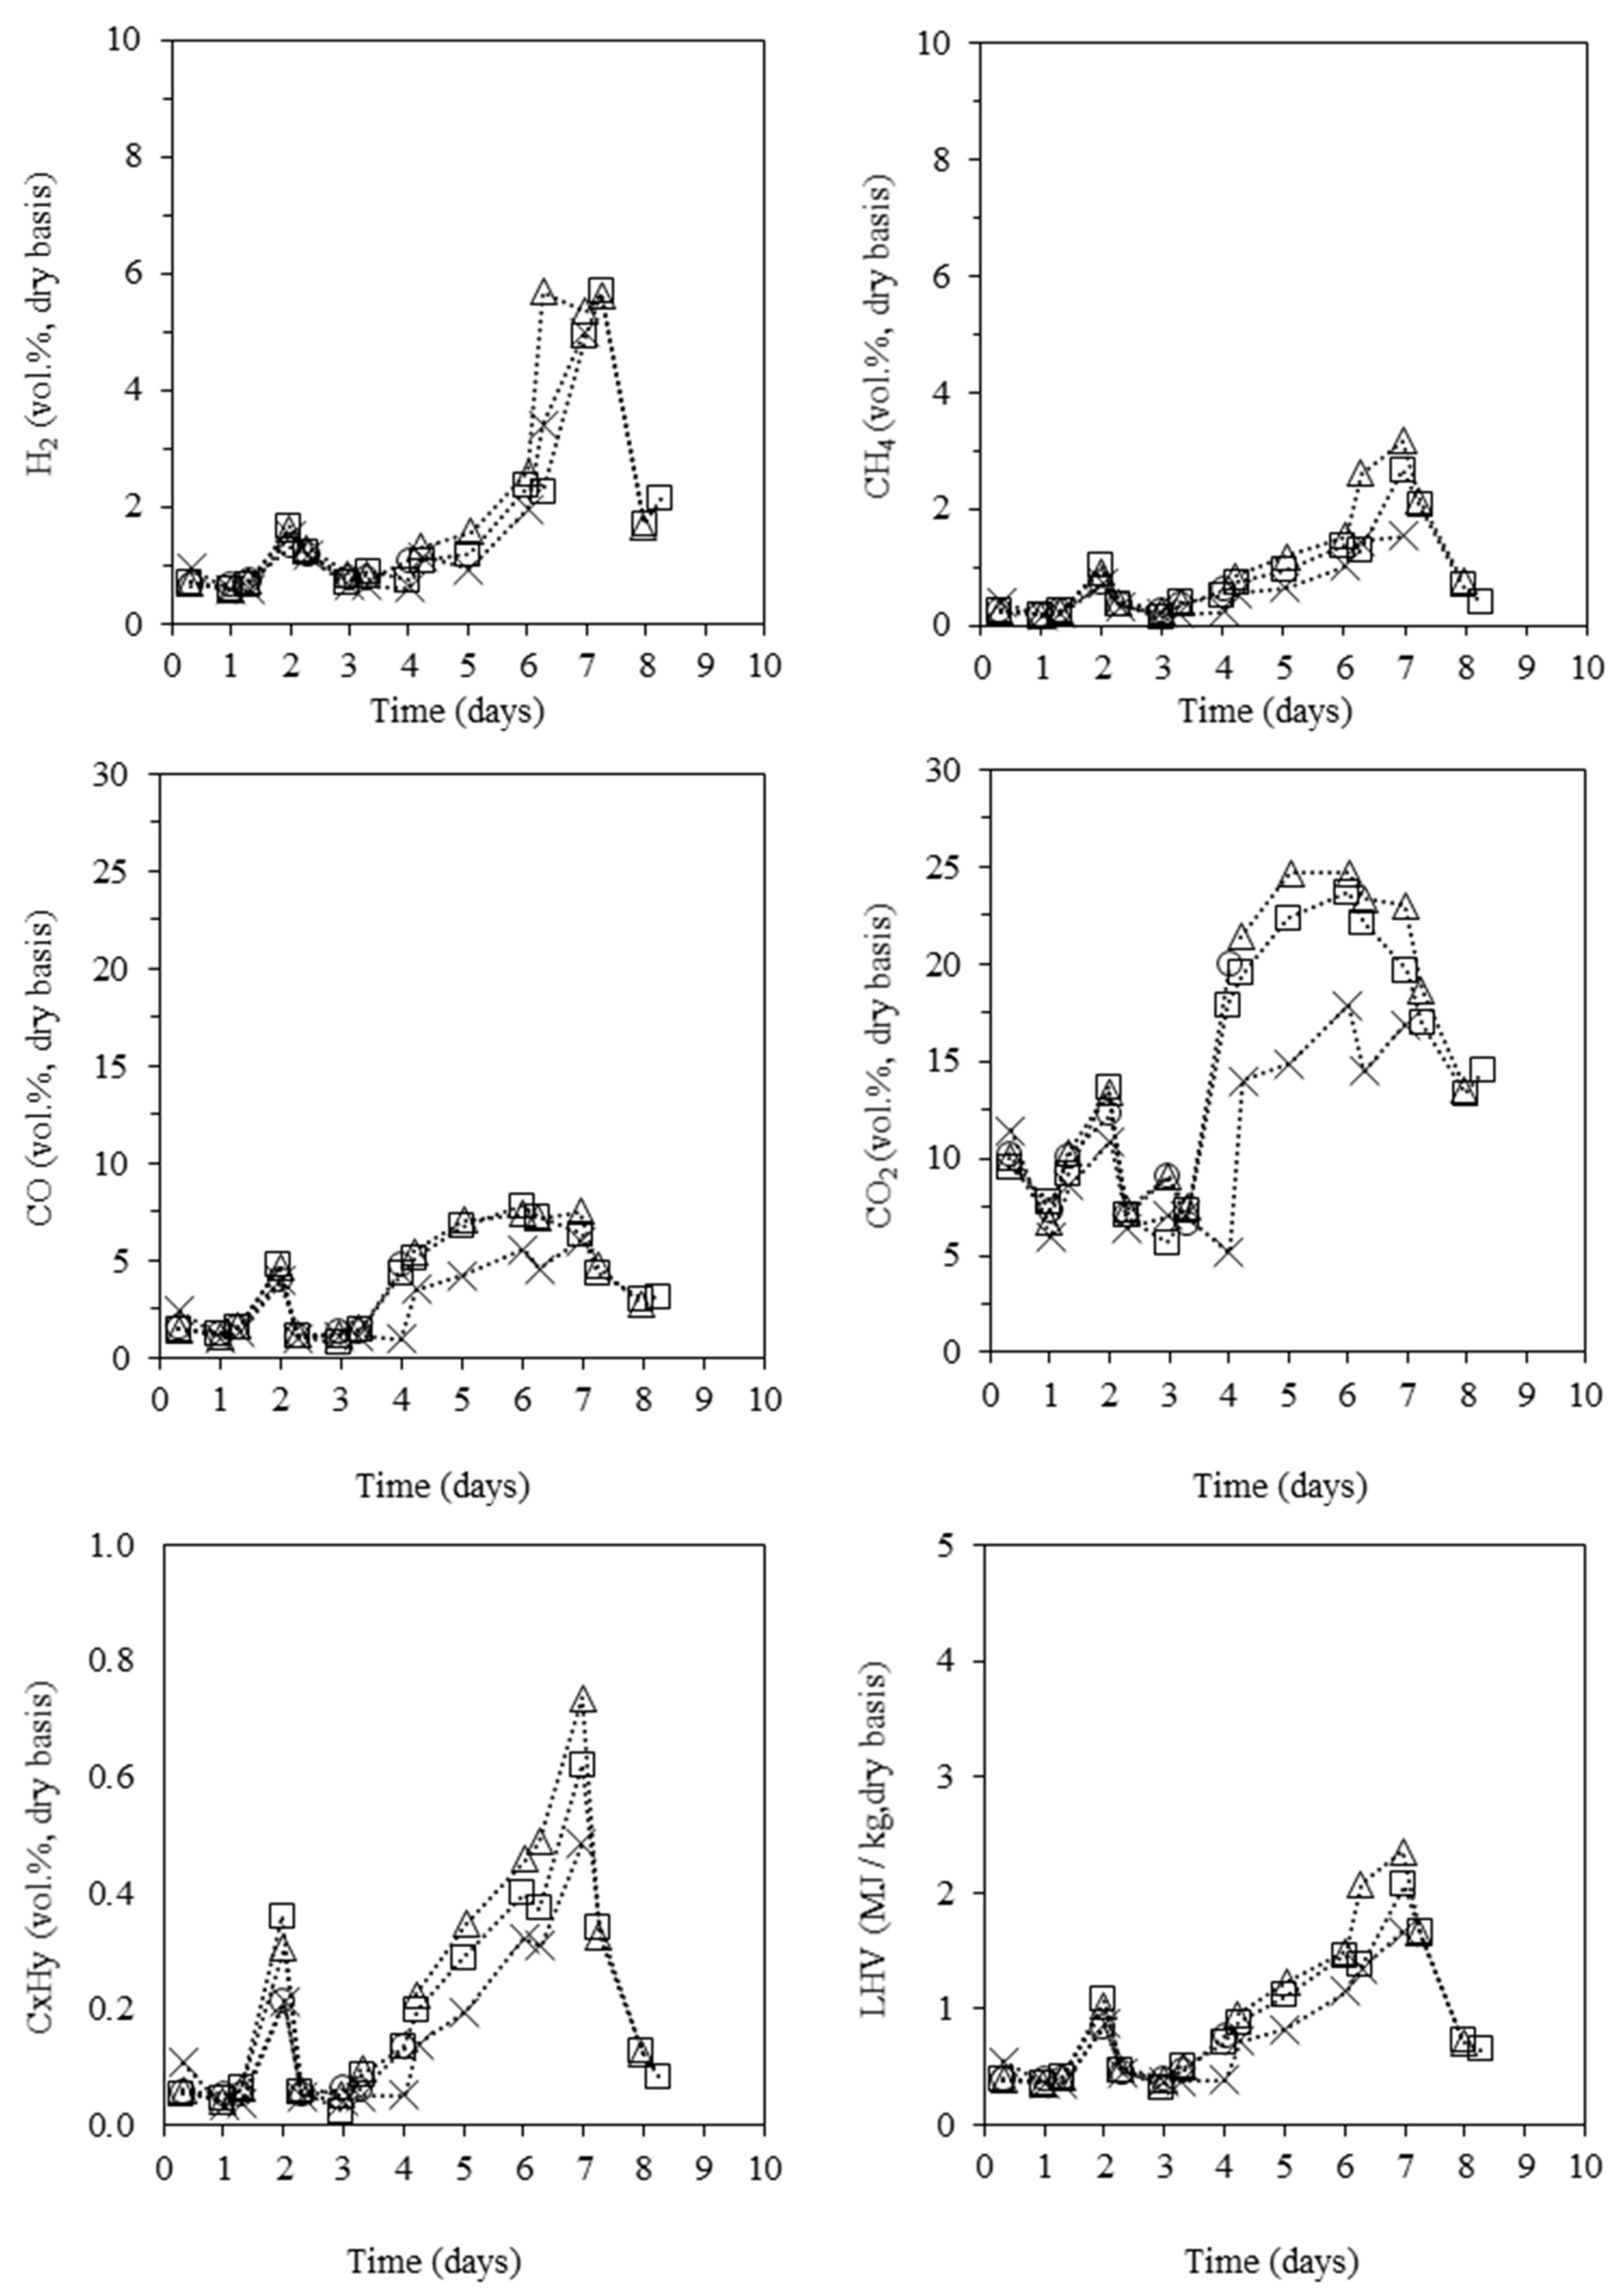
3.4. Composition of the Carbonization Gas

The concentrations of CO2, CO, CH4, CxHy, H2, O2, and N2 in the dry and clean carbonization gas leaving each of the four chimneys of the kiln during Test 1 are shown in Figure 6. Data are unavailable during the final part of the carbonization phase because of the partial or total closure of the chimneys, which made gas sampling unfeasible. In particular, data from chimney S2 are only available up to day 4, i.e., the day when this chimney started to act as an air intake instead of the gas outlet.
Similar gas concentration-time profiles were observed in all chimneys, indicating that the carbonization process unfolds quite uniformly across the kiln cross-section. However, there is some differences in “instantaneous” concentration values measured between chimneys. For example, an increasing trend in the concentration of CO is seen for all chimneys between days 3 and 6, although the values in chimney S1 are consistently lower. These inter-chimney differences vary from less than 2 vol.% in the cases of CO, H2, and CH4 to more than 5 vol.% in the cases of CO2, O2, and N2. Hence, for multi-chimney kilns like the one under study, the composition of the gas leaving a given chimney may not be representative of the gas leaving the other chimneys. Possible explanations for the differences in gas concentration between chimneys may include localized non-uniformities of wood conversion inside the kiln and temporary changes in the gas path across the wood bed. For example, Figure 6 shows that the behavior of chimney S1 changes when the air starts to enter through chimney S2 (end of day 3). This suggests that the air entering from chimney S2 has led to a preferential outflow of gases through chimney S1, including some by-pass of air (i.e., N2 and O2), which can also explain the lower concentrations of the other gases.
It is also worth noting the high concentrations of N2 in the dry and clean gas leaving the kiln, with values of no less than 60 vol.% during the whole carbonization cycle. For comparison purposes, the N2 content of combustible gases from direct biomass gasifiers, in which the aim is to fully gasify the fuel (including the char), is typically within 50–60 vol.% [47], which points to the huge amount of air that enters the kiln. The concentration of N2 is higher during the first four days of the process (drying phase) with values close to 79 vol.%, i.e., the N2 content of dry ambient air. This is because neither wood combustion—which occurs near the kiln door—nor wood drying leads to a net increase in dry gas molecules (assuming complete combustion for simplicity) and, therefore, the concentration of N2 in the flue gases remains similar to that in the incoming air. The N2 concentration starts to decrease on day 4 and reaches a minimum on day 7 with values within 60 to 70 vol.% (depending on the chimney). This decreasing trend of N2 is mainly related to the dilution effect caused by the release of volatile gases from the converting wood charge. Indeed, this trend follows the above-mentioned heating ramp of the wood charge from ≈100 °C to the maximum plateau of 270–300 °C (see Figure 2), during which a more intense outflow of grey gas leaving the chimneys is observed. In addition, the lower airflow rates entering the kiln during this period, as discussed earlier in Section 3.3, may also contribute to the decreasing concentration of N2 in the carbonization gas. After day 7, the N2 concentration rises again to ≈79 vol.% given the high degree of devolatilization of the wood charge at this stage of the process, which means that the release of volatile gases is again of little relevance. As previously referred to, the kiln operators were able to detect this process condition based on visual observations and proceeded to close the chimneys.
The concentration-time profile of O2 shows similarities with the respective N2 profile. This suggests that significant amounts of O2 can bypass directly from the air intakes to the carbonization gas outlets. During the initial days corresponding to the drying phase, when low temperatures are observed in most of the kiln, the O2 content in the gas is high, with values up to 15 vol.%. Therefore, a considerable excess of air seems to occur during this initial phase of the process, which may delay the heating of the wood charge, as previously discussed. There is a correlation between the sharp plunge in O2 on day 2, down to almost 6 vol.% in chimney S4, and the temperature peak occurring in the combustion zone at roughly the same time (almost 800 °C in T11, see Figure 2). This drop of O2 follows the drop observed for N2 and corresponding increases in CO, CO2, H2, and CH4, which suggests that this temperature peak may be due to a transient shortage of air entering the kiln. However, the plausible contribution of a more intense combustion period cannot be ruled out either. As in the case of N2, a consistent decrease in O2 concentration becomes evident on day 4, until reaching minimum values of less than 3 vol.% on day 7. In addition to the effects related to the dilution by the released carbonization gases and the lower airflow rates during this phase, the lower concentration of O2 also results from the fact that this gas (unlike N2) is consumed in the combustion reactions taking place inside the kiln. Thus, the O2 decreases to almost zero during this phase while the N2 does not drop below 60 vol.%. The subsequent rise in the O2 concentration after day 7 suggests that some air is bypassing again into the chimneys by this time.
Figure 6 also shows that the main gases released from wood carbonization are CO2, CO, H2, and CH4, while the quantities of other hydrocarbon species (in this study, C2H4, C2H6, and C3H8) are comparatively low. The concentration-time profiles of these species are essentially the opposite of those observed for N2 and O2.This is especially the cases of CO2 and CO, which are by far the dominant product species in the carbonization gas: these species start to increase as soon as N2 and O2 start to plummet on day 4. This is because the CO2 and CO are a result of both wood combustion reactions and wood pyrolysis reactions inside the kiln, where CO2 is the dominant product in both cases (see e.g., [48]). The CO2 concentration doubles the one of CO, with values that can easily exceed 20 vol.%. Unlike CO2 and CO, the H2 and hydrocarbons are mainly a result of wood pyrolysis reactions. These last species start to be released at higher rates on day 6 until peaking on day 7, which is roughly two days after the rise of CO2 and CO. It seems that this delay is equivalent to the time needed for the kiln to approach the maximum temperature values of 270–300 °C, at which the production of H2 and CH4 by pyrolysis reactions are favored. The H2 reaches maximum values of ≈6 vol.% on day 7, while CH4 and the remaining lumped hydrocarbons (CxHy)do not go beyond ≈3 vol.% and ≈1 vol.%, respectively. On day 7, the carbonization gases measured in this work begin to plunge, thus pointing to a condition of complete wood devolatilization at the current temperatures observed in the kiln. The available information (up to about day 8.5) suggests that by day 8 much of the carbonization process is complete, although some additional charcoal combustion/gasification surely occurs. This results from the fact that the fall in H2, and especially in hydrocarbons, appears to be steeper than the fall in CO2 and CO. The last measurement point shown in Figure 6 even suggests a slight rise in CO2, CO, and H2 while the hydrocarbons follow a downward trend. This behavior may result from combustion and gasification reactions between the charcoal and O2 or H2O, the latter present at the base of the kiln or associated to the incoming atmospheric air.
The LHV of the dry carbonization gas mixture shows a similar time profile to those of H2, CH4, and CxHy (Figure 6). Besides the peak observed on day 2, the LHV of the gas is less than 0.5 MJ/kg during the first four days of the process (i.e., the drying phase) and subsequently rises to a maximum of about 2.5 MJ/kg (dry basis) on day 7; a sharp decrease is observed thereafter. The carbonization gas is very poor in terms of heating value and, at most, it can reach a quality similar to gases from direct biomass gasifiers (typically 3 to 5 MJ/kg [47]) when the kiln reaches the highest temperatures (i.e., around day 7 under the conditions of the present study).

3.5. Properties of the Carbonization Solid Products

As previously mentioned, charcoal is the wanted product in the carbonization process, although two solid byproducts are obtained along with it: charcoal fines and partially charred wood. The partially charred wood makes up the bottom layer of the charge (≈50 cm above the kiln floor) where temperatures did not exceed ≈130 °C because of the build-up of pyrolytic liquids and water. The size and composition of the partially charred wood can vary widely, which makes it of little commercial value. In practice, the materials recovered from a given carbonization batch are set aside for use in the subsequent batch. In this context, Table 1 provides insight into the composition of the partially charred wood used as feedstock during Test 1, and no further reference to it will be made in this section. For the other solid products, Table 3 provides a summary of their main characteristics based on results from both Test 1 and Test 2.
There are two qualities of charcoal produced in the kiln—“charcoal-a” and “charcoal-b” in Table 3—depending on the kiln location from where the samples were recovered. The samples of “charcoal-a” were recovered from the small region near the kiln door, where continuous combustion processes took place and maximum temperatures of 800 °C were reached. In turn, the samples of “charcoal-b” were recovered from the remaining parts of the kiln (except the bottom layer) where fairly uniform maximum temperatures of 270–300 °C were observed. Charcoal-a is characterized by high fixed carbon content (≈82 wt.%), high elemental carbon content (≈83 wt.%), high ash content (≈7.0 wt.%), and high LHV (≈30 MJ/kg), which can be linked to the two distinctive features of the door region: steadily higher temperatures and continued combustion of wood/charcoal. The higher temperatures are well-known to favor the release of volatile species from the solid particles under conversion. This volatile fraction was found to be rich in oxygen and hydrogen [18,48] with the outcome being an increase in the fixed and elemental carbon contents of the remaining solids, i.e., the charcoal. This positive relationship between the fixed/elemental carbon contents of charcoal and the maximum pyrolysis temperature is well-documented in the literature [17,18,49], with major changes starting at temperatures as low as 200 °C. Regarding the ash content, the higher values found in charcoal-a result from a combination of the two features mentioned above. On the one hand, the higher temperatures also lead to lower charcoal yields [1,18], and since charcoal retains most of the ash originally present in the wood, the overall result is an increased ash content of charcoal. On the other hand, the progressive oxidation of the charcoal particles, owing to the high temperatures and high oxygen availability in the door region, further bolsters its enrichment in ash. As for the higher LHV of charcoal-a, it results from a balance between its higher carbon contents and higher ash contents, where the former contributes favorably to increasing the LHV and the latter unfavorably. In comparative terms, charcoal-b, which represents the overwhelming part of the total charcoal recovered from the kiln (possibly more than 90% based on a rough estimate of the number of full tractor buckets recovered from this region of the kiln), shows significantly lower values of fixed carbon content (≈65 wt.%), elemental carbon content (≈72 wt.%), ash content (≈5 wt.%), and LHV (≈26 MJ/kg). Following the discussion above, this can be attributed to the lower carbonization temperatures in this region of the kiln (typically below 300 °C). These characteristics point to a low-quality charcoal, namely considering its use as cocking fuel in residential or professional appliances, which is the major market in Portugal [36]. For instance, the indicative value established in the European standard EN1860-2-2005 [25] for barbecue charcoal is at least 75 wt.% fixed carbon and at most 8 wt.% ash. Although the ash content can pass, the fixed carbon content of charcoal-b is lower (64.9 ± 5.2 wt.%) than the threshold given in the standard. According to a previous study [50], the way to increase the fixed carbon content of charcoal to at least 75 wt.% is to raise the carbonization temperature from 300 °C to 400 °C, which may be difficult to achieve based on the type of brick kilns under study.
Unlike the charcoal samples that were hand-collected from inside the kiln, the charcoal fines were collected at the exit of the vibrating screen during the charcoal bagging process. Under these conditions, it is not possible to know the exact kiln location from where each fines sample was collected since there is some mixing of materials during the kiln discharge process (e.g., mixing inside the hopper before screening). Thus, in the case of the charcoal fines, no distinction is made between the region near the kiln door and the remaining parts of the kiln. Rather, Table 3 shows the average composition of the fines as derived from the analysis of a set of samples taken throughout the whole kiln discharge process. Deliberately, only the very initial and final stages of kiln discharge were excluded from this analysis, since it was found that the fines collected at these stages have very distinctive characteristics. On the one hand, the fines collected with the first tractor buckets removed from the kiln have visibly high amounts of ash resulting from the wood combustion process unfolding near the kiln door. On the other hand, the fines collected in the last tractor buckets removed from the kiln have a high quantity of inert materials (namely, sand, small rocks, and brick debris) that have been accumulating at the base of the kiln throughout the discharge process. Under the referred conditions, the conclusion drawn is that most of the sampled charcoal fines have a relatively homogeneous composition. Of note is their high ash content of 23 ± 4.4 wt.% which negatively influences the other characteristics of the fines. For instance, the fixed carbon content of the dry fines can easily plunge to under 50 wt.% and the respective LHV to under 21 MJ/kg. However, if these values are corrected to a dry ash-free basis, the organic fraction of the charcoal fines has a similar composition to that of the dry ash-free charcoal particles, which would be expected given that both experienced similar temperature–time profiles inside the kiln.

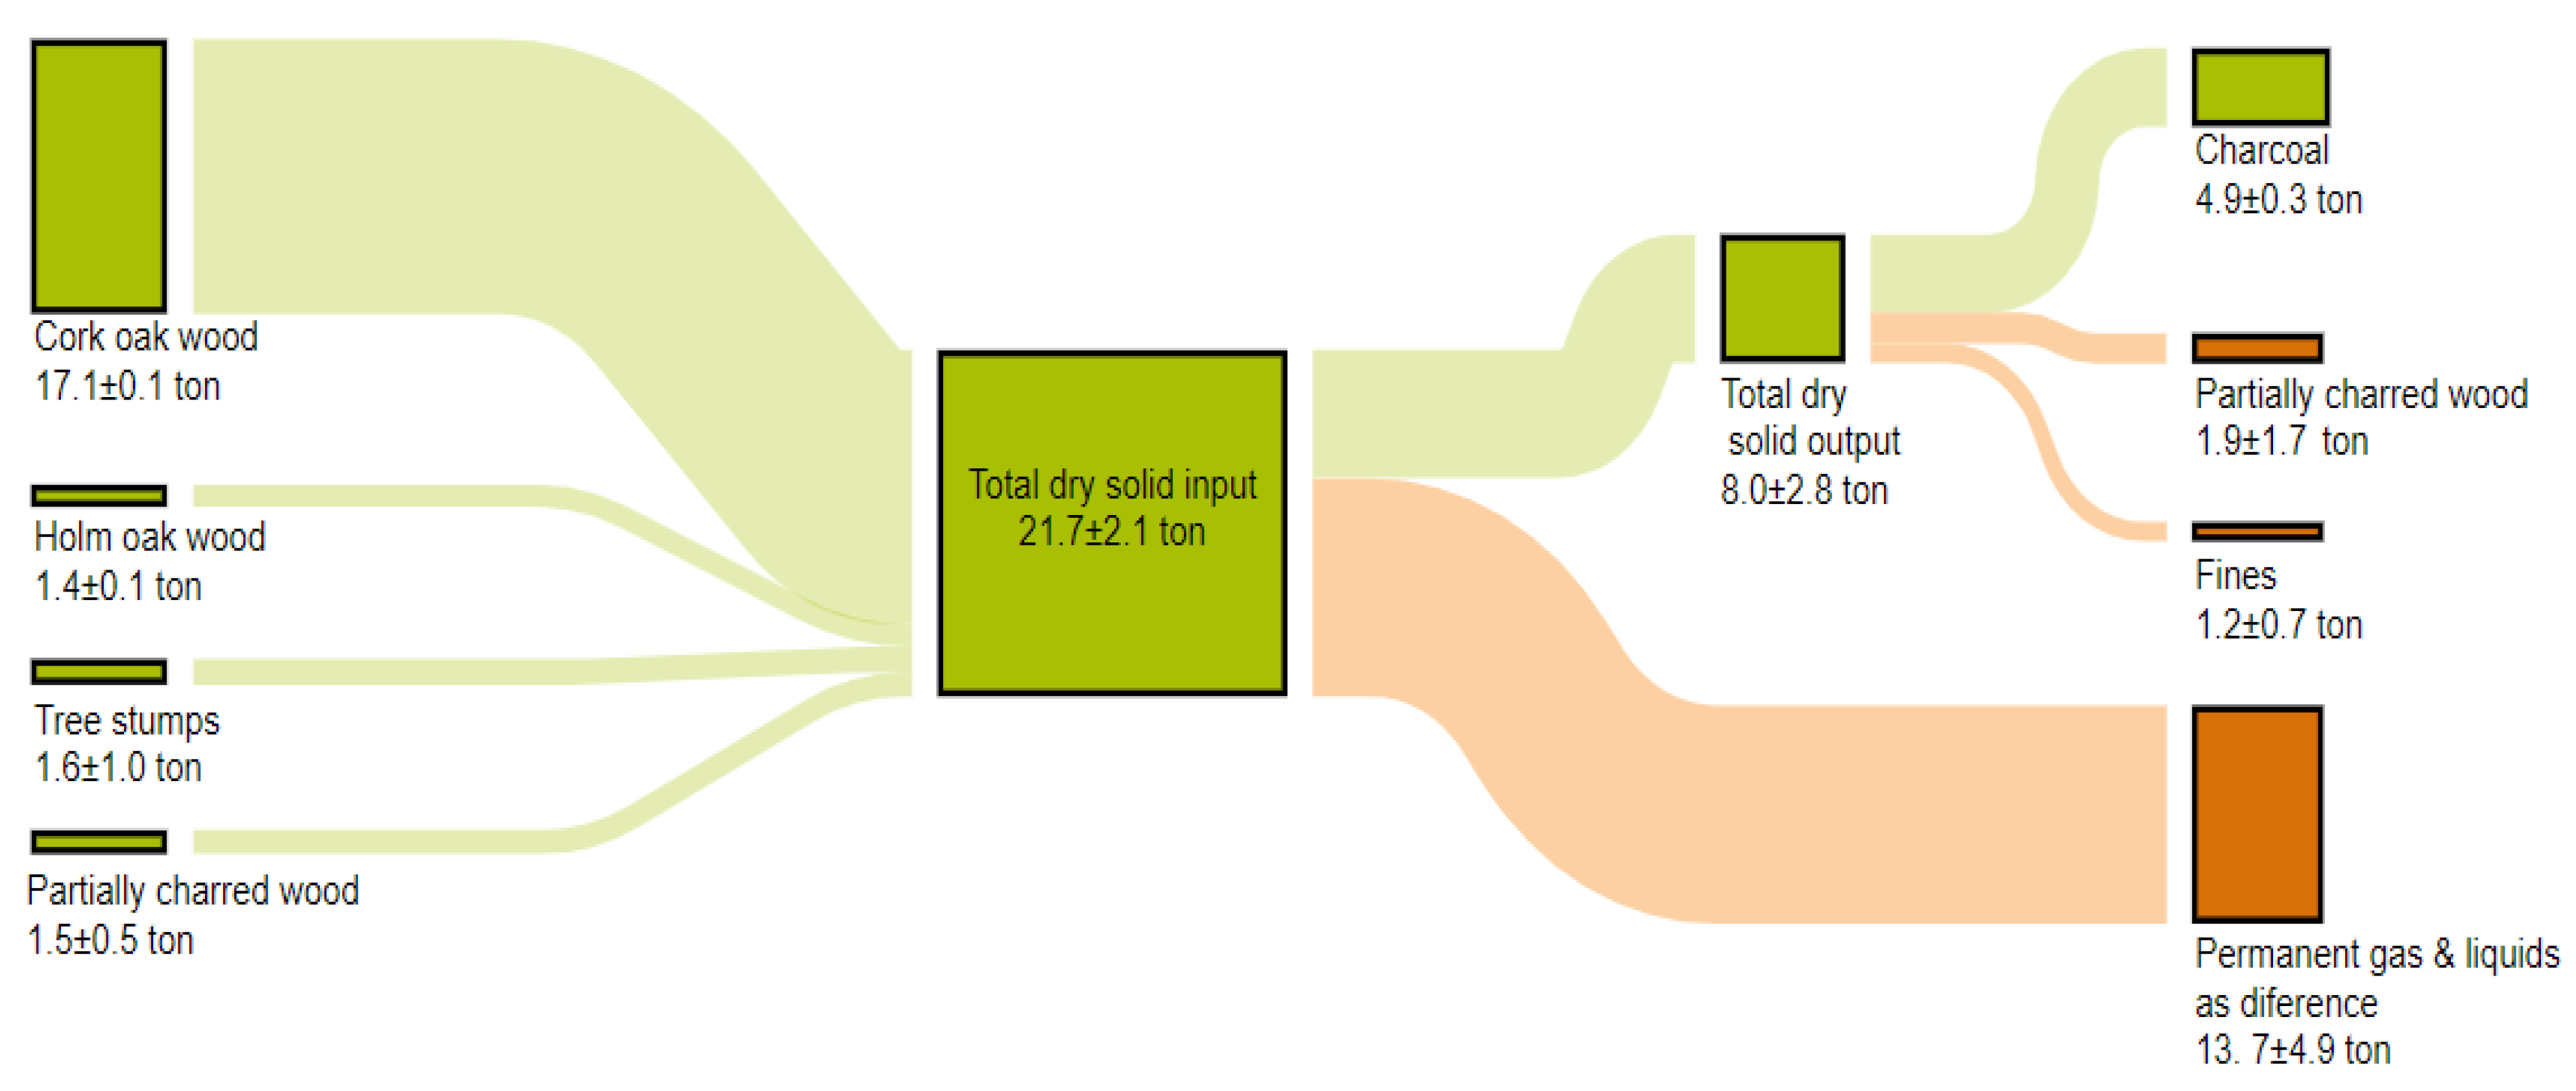
3.6. Overall Mass Balance to the Carbonization Process

Figure 7 provides insight into the mass balance of the carbonization process based on the gravimetric analysis of the dry solid materials that were loaded or unloaded from the kiln during Tests 1 and 2. The dry solid inputs correspond to the dry wood feedstocks described in Section 2.1 (cork oak, holm oak, partially charred wood, and stumps), with their main characteristics and quantities given in Table 1 and Table 2, respectively. On average, the total amount of dry wood loaded into the kiln was about 21.7 tons per batch, of which cork oak wood accounts for nearly 80 wt.% and the remaining feedstock types within 7 to 8 wt.% each. The bulk density of the dry wood charge in the kiln is nearly 270 kg/m3. After the carbonization process, the height of the charge inside the kiln decreases from 5 m to within 3 to 3.5 m, and its total dry mass to about 8 tons. Of this, 4.9 tons corresponds to dry charcoal for marketing, 1.9 tons to dry partially charred wood, and 1.2 tons to dry charcoal fines (average values for Test 1 and 2).
There is some variation in the mass of solid products recovered from the kiln between Tests 1 and 2: the differences were 475 kg for charcoal, 800 kg for fines, and 2560 kg for partially charred wood. The amount of partially charred wood recovered in Test 1 was high (3.1 tons), even higher than the respective amount initially charged into the kiln (1.1 tons). According to the kiln operators, this range of cycle-to-cycle variations in the amounts of solid products recovered from the kiln is typical. However, in extreme cases where the kiln temperature does not rise or uncontrolled charcoal combustion occurs, the variations can be much higher and can lead to an almost complete loss of the batch. This points to inadequate process monitoring/control methods, mostly relying on empirical observation. The above-mentioned 8 tons of dry solid products recovered from the kiln means that the volatile matter (i.e., permanent gases and liquids) released from the dry wood charge amounts to 13.7 tons (value taken as difference). However, the total amount of gases and liquids released from the kiln is much higher than this, owing to the water associated with the wood moisture, the nitrogen, and the oxygen associated with the combustion air entering the kiln.
The quantity of charcoal recovered from the kiln is equivalent to a charcoal mass yield of ≈23 wt.% (dry wood feed basis). At the time of bagging, the charcoal can be considered dry because the small time-lag between kiln discharge and charcoal bagging (<1 h); this is supported by later laboratory measurements of the moisture content of the charcoal samples, with values typically under 5 wt.% (wet basis). As an approximation, if the composition of “charcoal-b” in Table 3 is taken as representative of the whole amount of charcoal recovered from the kiln, then the above mass yield of ≈23 wt.% is equivalent to a charcoal carbon yield of ≈34 wt.% (i.e., the mass of elemental carbon remaining in the charcoal corresponds to about 34 wt.% of the mass of elemental carbon present the dry wood feed), and energy conversion efficiency of also ≈34% (i.e., charcoal accounts for about 34% of the total chemical energy fed to the kiln as dry wood feedstock, as calculated from the LHV of both dry wood and dry “charcoal-b”). For comparison purposes, Charvet et al. [50] presented a study of the mass balance of wood carbonization under the N2 atmosphere (i.e., indirect carbonization), including experiments with cork oak wood at 300 °C peak temperature. Their measurement values of charcoal mass yield, charcoal carbon yield, and energy conversion efficiency were 42 wt.%, 56 wt.%, and 54%, respectively, which are higher than the values obtained in this work. Even if the total amount of fines recovered from the kiln (on average 1.2 tons per cycle, Figure 7) is added to the charcoal (i.e., making a total of 6.1 tons of carbonized solid products per batch), the performance of the traditional process would remain comparatively low. This low performance of the traditional process (as compared to reference values resulting from laboratory tests in [50]) points to some operational drawbacks such as the burning of wood inside the kiln, the build-up of liquids on the kiln floor, and the poor control during the final stage of the process where unwanted charcoal burning is likely. Comparison with results from other carbonization kilns is difficult, as there can be large variability in fuel characteristics (including the type of wood, moisture content, particle size, etc.), kiln configuration, operating conditions, methods, and weather conditions, as well as in the way the results are reported (dry vs. wet basis, method used for the quantification of charcoal fines, etc.). An analysis of results from carbonization tests with different types of wood and kilns, including traditional masonry or earth kilns operated in various regions of the world, point to highly variable charcoal yields of typically within 20–35 wt.% [21,24,51]; this places the results of this work (≈23 wt.%) closer to the lower end of this range.

4. Conclusions

Experiments were conducted in a large-batch charcoal kiln to improve current knowledge about the production methods in use in the Portuguese region of Alentejo. The kiln comprised a cylindrical charcoaling chamber made of hollow and solid bricks (≈80 m3), a removable metal ceiling, four chimneys for gas exhaust, and a front door through which the wood is ignited and air is supplied to the process. A set of instrumentation was amassed around this kiln to evaluate its operating conditions (temperatures, airflow rate, and composition of solid and gaseous products) and mass balance during regular carbonization cycles. The results lead to the following main conclusions:
  • Charcoal production in traditional brick kilns is a flexible process in terms of the size and properties of the wood raw materials—both small branches and large logs can be used, as well as wood containing bark, inert materials (e.g., soil and stones associated with the stumps), and partially charred materials—which underlines its usefulness in the context of forest waste management.
  • Current practices of process control and monitoring are limited to visual observations—e.g., the color of the smoke leaving the chimneys—which makes it difficult to continuously follow the process (e.g., during night periods and weekends) and early detectoperational problems, chiefly combustion hotspots caused by uncontrolled temperatures (sometimes exceeding 800 °C) and air intake, with consequent loss of wood and charcoal.
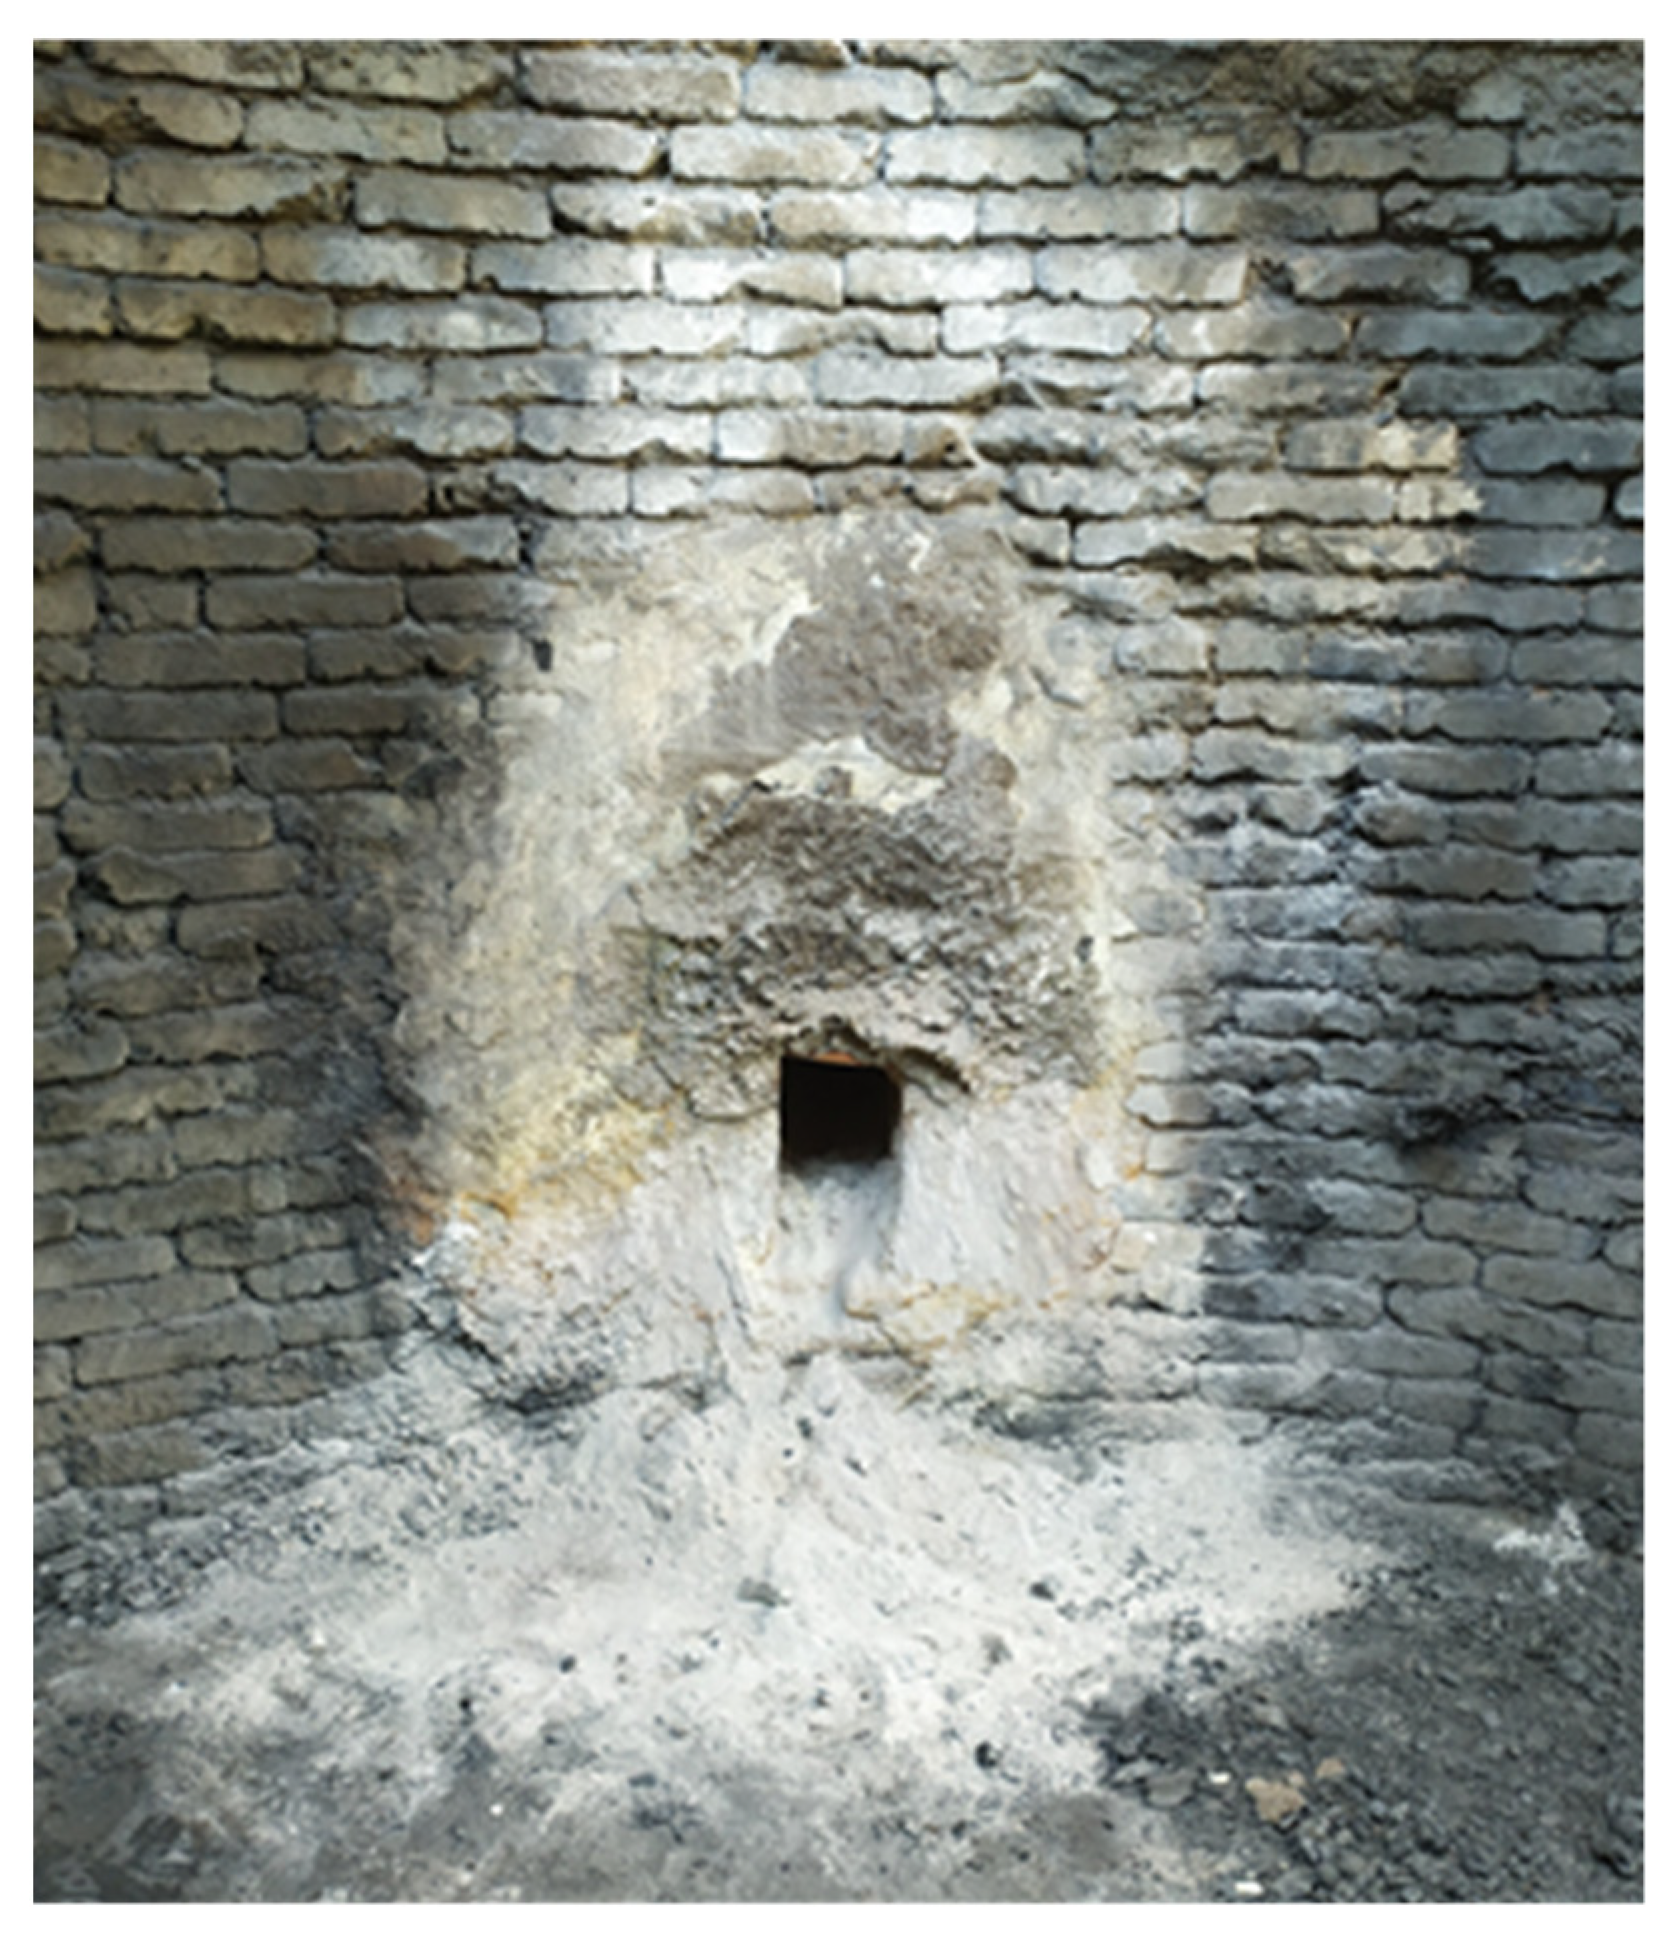
  • Improper design aspects of the kiln further reduce its performance, including (i) lack of insulation in the metal ceiling, (ii) build-up of liquids on the kiln floor because of insufficient drainage, (iii) easy clogging of the air inlets by ash accumulation, (iv) unknown air inlets, including through the chimneys and/or wall cracks, and (v) inadequate number, layout, and size of the chimneys. The large size of the kiln can also hinder productivity as it leads to longer production cycles (>20 days)—associated with the wood drying and heating (>4 days) and charcoal cooling (>10 days) phases—and extended oxidation of charcoal inside the kiln.
  • Inappropriate carbonization methods are also in use, of which the following are highlighted given their impact on the charcoal yield: (i) the ignition/heating method that is based on the continuous and uncontrolled combustion of the wood charge inside the kiln, (ii) the kiln charging method that favors the placing of thicker wood pieces on the kiln floor where temperatures are lower and carbonization more difficult, and (iii) the kiln-sealing method that follows an indefinite sequence of closing the chimneys and air intakes (sometimes for two consecutive days) that seems to allow excessive burning of charcoal.
  • The overall performance of the kiln is poor in terms of charcoal yield (≈23 wt.%) and quality, the latter mainly evidenced by its low fixed carbon contents (values as low as 60 wt.% are possible). This follows from key limitations in the kiln: the low maximum temperatures observed in most of the carbonization chamber (typically less than 300 °C), the inability to raise the temperature at the kiln floor above 130 °C, and the high O2 levels inside the kiln (often above 5 vol.%). Then significant amounts of byproducts are obtained: partially charred wood, charcoal fines, permanent gases, and liquids. While the partially charred wood is reused in the process and the charcoal fines marketed (mainly for briquette manufacturing), the gases and liquids are currently discharged into the atmosphere and soil. The gas composition is most favorable between days 4 and 7 of the cycle, where the concentration of combustible species (mainly, H2, CH4, and CO) and the LHV of the gas is higher; at this stage, the carbonization gas can approach the quality of gases from direct biomass gasifiers. Otherwise, the gas quality is very low, which can halt valorization, although it needs some kind of treatment before discharge into the atmosphere.
  • Charcoal consumers are increasingly aware of the quality and environmental issues associated with this activity and initiatives addressing both production certification and charcoal quality requirements are rising. It is then important to take urgent action to modernize the charcoal production activities and the market suitability of both charcoal and byproducts. The focus should be on research and technological development, funding, training, and administrative and legal frameworks to find solutions tailored to current activities and available infrastructure. These will be decisive to prevent charcoal production from vanishing from Portugal and other EU countries, where it is still an important activity, both for economic reasons and for forest biomass management reasons.

Author Contributions

Conceptualization, D.N., A.M. and F.C.; methodology, F.C., D.N. and A.M.; resources, A.M., L.T. and D.N.; investigation, F.C., M.L. and D.N.; data curation, F.C. and M.L.; formal analysis, F.C.; writing—original draft preparation, F.C. and D.N.; writing—review and editing, F.C., L.T., A.M., J.F.d.S. and D.N.; supervision, D.N. and A.M.; project administration, D.N. and A.M.; funding acquisition, D.N. All authors have read and agreed to the published version of the manuscript.

Funding

Thanks are due to the Portuguese Foundation for Science and Technology (FCT)/Ministry for Science, Technology and Higher Education (MCTES), Portugal, for the financial support within the scope of the Charclean project (PCIF/GVB/0179/2017) and CESAM (UIDP/50017/2020 + UIDB/50017/2020 + LA/P/0094/2020), through national funds.

Institutional Review Board Statement

Not applicable.

Informed Consent Statement

Not applicable.

Data Availability Statement

Data available on request because of project policies.

Acknowledgments

Thanks are given to the Municipality of Arronches (Portugal) for the the logistical support for the successful development of this work.

Conflicts of Interest

The authors declare no conflict of interest.

References

  1. Antal, M.J.; Grønli, M. The art, science, and technology of charcoal production. Ind. Eng. Chem. Res. 2003, 42, 1619–1640. [Google Scholar] [CrossRef]
  2. Emrich, W. Handbook of Charcoal Making: The Traditional and Industrial; D. Reidel: Dordrecht, The Netherlands, 1985. [Google Scholar]
  3. Sun, M.; Zhang, J.; Li, K.; Barati, M.; Liu, Z. Co-gasification characteristics of coke blended with hydro-char and pyro-char from bamboo. Energy 2022, 241, 122890. [Google Scholar] [CrossRef]
  4. Dufourny, A.; Van De Steene, L.; Humbert, G.; Guibal, D.; Martin, L.; Blin, J. Influence of pyrolysis conditions and the nature of the wood on the quality of charcoal as a reducing agent. J. Anal. Appl. Pyrolysis 2019, 137, 1–13. [Google Scholar] [CrossRef]
  5. Hammani, H.; Hrioua, A.; Aghris, S.; Lahrich, S.; Saqrane, S.; Bakasse, M.; El Mhammedi, M.A. Activated charcoal as a capture material for dopamine, paracetamol and salicylic acid in human blood and pharmaceutical formulations. Mater. Chem. Phys. 2020, 240, 122111. [Google Scholar] [CrossRef]
  6. Qambrani, N.A.; Rahman, M.M.; Won, S.; Shim, S.; Ra, C. Biochar properties and eco-friendly applications for climate change mitigation, waste management, and wastewater treatment: A review. Renew. Sustain. Energy Rev. 2017, 79, 255–273. [Google Scholar] [CrossRef]
  7. Jelonek, Z.; Drobniak, A.; Mastalerz, M.; Jelonek, I. Environmental implications of the quality of charcoal briquettes and lump charcoal used for grilling. Sci. Total Environ. 2020, 747, 141267. [Google Scholar] [CrossRef]
  8. Van Swaaij, W.P.M.; Kersten, S.R.A.; Palz, W. (Eds.) Biomass Power for the World, 1st ed.; Jenny Stanford Publishing: New York, NY, USA, 2015; ISBN 9780429183836. [Google Scholar]
  9. Vicente, E.D.; Vicente, A.; Evtyugina, M.; Carvalho, R.; Tarelho, L.A.C.; Oduber, F.I.; Alves, C. Particulate and gaseous emissions from charcoal combustion in barbecue grills. Fuel Process. Technol. 2018, 176, 296–306. [Google Scholar] [CrossRef]
  10. WorldWildlife Fund (WWF). The Dirty Business of Barbecue Charcoal; WWF Germany: Berlin, Germany, 2018; Available online: https://www.wwf.de/fileadmin/fm-wwf/Publikationen-PDF/WWF_Market_analysis_barbecue_charcoal_2018.pdf (accessed on 28 January 2022).
  11. Knapp, H.; Nelle, O.; Kirleis, W. Charcoal usage in medieval and modern times in the Harz Mountains Area, Central Germany: Wood selection and fast overexploitation of the woodlands. Quat. Int. 2015, 366, 51–69. [Google Scholar] [CrossRef]
  12. Carrari, E.; Ampoorter, E.; Bottalico, F.; Chirici, G.; Coppi, A.; Travaglini, D.; Verheyen, K.; Selvi, F. The old charcoal kiln sites in Central Italian forest landscapes. Quat. Int. 2017, 458, 214–223. [Google Scholar] [CrossRef]
  13. Food and Agriculture Organization (FAO). Forestry Production and Trade—Wood Charcoal. Available online: http://www.fao.org/faostat/en/#data/FO (accessed on 31 January 2022).
  14. Dam, J.V. The Charcoal Transition: Greening the Charcoal Value Chain to Mitigate Climate Change and Improve Local Livelihoods; Food and Agriculture Organization (FAO): Rome, Italy, 2017; ISBN 9789251096802. [Google Scholar]
  15. Zhao, C.; Jiang, E.; Chen, A. Volatile production from pyrolysis of cellulose, hemicellulose and lignin. J. Energy Inst. 2017, 90, 902–913. [Google Scholar] [CrossRef]
  16. Rizzo, A.M.; Pettorali, M.; Nistri, R.; Chiaramonti, D. Mass and energy balances of an autothermal pilot carbonization unit. Biomass Bioenergy 2019, 120, 144–155. [Google Scholar] [CrossRef]
  17. Demirbaş, A. Relationships between carbonization temperature and pyrolysis products from biomass. Energy Explor. Exploit. 2004, 22, 411–420. [Google Scholar] [CrossRef]
  18. Neves, D.; Thunman, H.; Matos, A.; Tarelho, L.; Gómez-Barea, A. Characterization and prediction of biomass pyrolysis products. Prog. Energy Combust. Sci. 2011, 37, 611–630. [Google Scholar] [CrossRef]
  19. Rodrigues, T.; Braghini Junior, A. Charcoal: A discussion on carbonization kilns. J. Anal. Appl. Pyrolysis 2019, 143, 104670. [Google Scholar] [CrossRef]
  20. Rodrigues, T.; Braghini Junior, A. Technological prospecting in the production of charcoal: A patent study. Renew. Sustain. Energy Rev. 2019, 111, 170–183. [Google Scholar] [CrossRef]
  21. Santos, S.D.F.D.O.; Piekarski, C.M.; Ugaya, C.M.L.; Donato, D.B.; Braghini, A.; de Francisco, A.C.; Carvalho, A.M.M.L. Life cycle analysis of charcoal production in masonry kilns with and without carbonization process generated gas combustion. Sustainbility 2017, 9, 1558. [Google Scholar] [CrossRef] [Green Version]
  22. Pyshyev, S.; Miroshnichenko, D.; Malik, I.; Bautista Contreras, A.; Hassan, N.; Abd Elrasoul, A. State of the art in the production of charcoal: A review. Chem. Chem. Technol. 2021, 15, 61–73. [Google Scholar] [CrossRef]
  23. Chidumayo, E.N.; Gumbo, D.J. The environmental impacts of charcoal production in tropical ecosystems of the world: A synthesis. Energy Sustain. Dev. 2013, 17, 86–94. [Google Scholar] [CrossRef]
  24. Sparrevik, M.; Cornelissen, G.; Sparrevik, M.; Adam, C.; Martinsen, V.; Cornelissen, G.; Cornelissen, G. Emissions of gases and particles from charcoal/biochar production in rural areas using medium-sized traditional and improved “retort” kilns. Biomass Bioenergy 2015, 72, 65–73. [Google Scholar] [CrossRef]
  25. EN1860-2-2005:E; Appliances, Solid Fuels and Firelighters for Barbecueing—Part 2: Barbecue Charcoal and Barbecue Charcoal Briquettes—Requirements and Test Methods. European Committee for Standardization (CEN): Brussels, Belgium, 2003.
  26. Bustamante-García, V.; Carrillo-Parra, A.; González-Rodríguez, H.; Ramírez-Lozano, R.G.; Corral-Rivas, J.J.; Garza-Ocañas, F. Evaluation of a charcoal production process from forest residues of Quercus sideroxyla Humb., & Bonpl. in a Brazilian beehive kiln. Ind. Crops Prod. 2013, 42, 169–174. [Google Scholar] [CrossRef]
  27. Oliveira, A.C.; Carneiro, A.D.C.O.; Pereira, B.L.C.; Vital, B.R.; Carvalho, A.M.M.L.; Trugilho, P.F.; Damásio, R.A.P. Otimização da produção do carvão vegetal por meio do controle de temperaturas de carbonização. Rev. Arvore 2013, 37, 557–566. [Google Scholar] [CrossRef]
  28. Cardoso, M.T.; Damásio, R.A.P.; Carneiro, A.D.C.O.; Jacovine, L.A.G.; Vital, B.R.; Barcelos, D.C. Construção De Um Sistema De Queima De Gases Da Carbonização Para Redução Da Emissão De Poluentes. Cerne 2010, 16, 115–124. [Google Scholar]
  29. Bustos-Vanegas, J.D.; Martins, M.A.; Carneiro, A.D.C.O.; Freitas, A.G.; Barbosa, R.C. Thermal inertia effects of the structural elements in heat losses during the charcoal production in brick kilns. Fuel 2018, 226, 508–515. [Google Scholar] [CrossRef]
  30. Mensah, K.E.; Damnyag, L.; Kwabena, N.S. Analysis of charcoal production with recent developments in Sub-Sahara Africa: A review. Afr. Geogr. Rev. 2022, 41, 35–55. [Google Scholar] [CrossRef]
  31. Chiteculo, V.; Lojka, B.; Surový, P.; Verner, V.; Panagiotidis, D.; Woitsch, J. Value chain of charcoal production and implications for forest degradation: Case study of Bié Province, Angola. Environments 2018, 5, 113. [Google Scholar] [CrossRef] [Green Version]
  32. Ekeh, O.; Fangmeier, A.; Müller, J. Quantifying greenhouse gases from the production, transportation and utilization of charcoal in developing countries: A case study of Kampala, Uganda. Int. J. Life Cycle Assess. 2014, 19, 1643–1652. [Google Scholar] [CrossRef]
  33. Tintner, J.; Preimesberger, C.; Pfeifer, C.; Theiner, J.; Ottner, F.; Wriessnig, K.; Puchberger, M.; Smidt, E. Pyrolysis profile of a rectangular kiln—Natural scientific investigation of a traditional charcoal production process. J. Anal. Appl. Pyrolysis 2020, 146, 104757. [Google Scholar] [CrossRef]
  34. Tintner, J.; Fierlinger, R.; Gerzabek, H.; Pfeifer, C.; Smidt, E. Pyrolysis profiles of a traditional circular kiln in Austria and a drum kiln in Namibia. J. Anal. Appl. Pyrolysis 2020, 150, 104865. [Google Scholar] [CrossRef]
  35. Silva, F.T.M.; Silva, J.J.F.; Silva, D.; Tarelho, L.A.C.; Matos, M.A.A.; Neves, D. Charcoal production infrastructure in Portalegre district (Portugal): First assessment from satellite imagery and field observations. In Proceedings of the 3rd Bioenergy International Conference, Portalegre, Portugal, 11–13 September 2019. [Google Scholar]
  36. Neves, D.; Charvet, F.; Ruivo, L.; Matos, A.; Tarelho, L.; Figueiredo Silva, J. Current practices of charcoal production in Southern Portugal: A case-study un a large production site. In Proceedings of the 29th European Biomass Conference and Exhibition, Virtual, Online, 26–29 April 2021; pp. 1026–1032. [Google Scholar]
  37. Dias, E.C.; Alejandro, H.; Prais, C. Processo de trabalho e saúde dos trabalhadores na produção artesanal de carvão vegetal em Minas Gerais, Brasil Labor process and workers’ health in charcoal production in Minas Gerais, Brazil. Cadernos de Saúde Pública 2002, 18, 269–277. [Google Scholar] [CrossRef]
  38. Doggart, N.; Meshack, C. The marginalization of sustainable charcoal production in the policies of a modernizing African Nation. Front. Environ. Sci. 2017, 5, 27. [Google Scholar] [CrossRef] [Green Version]
  39. Tassie, K.; Misganaw, B.; Addisu, S.; Tesfaye, E. Socioeconomic and Environmental Impacts of Charcoal Production Activities of Rural Households in Mecha District, Ethiopia. Adv. Agric. 2021, 2021, 6612720. [Google Scholar] [CrossRef]
  40. Channiwala, S.A.; Parikh, P.P. A unified correlation for estimating HHV of solid, liquid and gaseous fuels. Fuel 2002, 81, 1051–1063. [Google Scholar] [CrossRef]
  41. Claude-Alain, R.; Foradini, F. Simple and Cheap Air Change Rate Measurement Using CO2 Concentration Decays. Int. J. Vent. 2002, 1, 39–44. [Google Scholar] [CrossRef]
  42. Çengel, Y.A.; Boles, M.A. Thermodynamics: An Engineering Approach; McGraw-Hill, Inc.: New York, NY, USA, 2006; ISBN 9780070606593. [Google Scholar]
  43. Chen, W.H.; Wang, C.W.; Ong, H.C.; Show, P.L.; Hsieh, T.H. Torrefaction, pyrolysis and two-stage thermodegradation of hemicellulose, cellulose and lignin. Fuel 2019, 258, 116168. [Google Scholar] [CrossRef]
  44. Lin, Y.Y.; Chen, W.H.; Colin, B.; Pétrissans, A.; Lopes Quirino, R.; Pétrissans, M. Thermodegradation characterization of hardwoods and softwoods in torrefaction and transition zone between torrefaction and pyrolysis. Fuel 2022, 310, 122281. [Google Scholar] [CrossRef]
  45. Borrero-López, A.M.; Masson, E.; Celzard, A.; Fierro, V. Modelling the reactions of cellulose, hemicellulose and lignin submitted to hydrothermal treatment. Ind. Crops Prod. 2018, 124, 919–930. [Google Scholar] [CrossRef]
  46. Yang, H.; Yan, R.; Chen, H.; Lee, D.H.; Zheng, C. Characteristics of hemicellulose, cellulose and lignin pyrolysis. Fuel 2007, 86, 1781–1788. [Google Scholar] [CrossRef]
  47. Pio, D.T.; Tarelho, L.A.C.; Matos, M.A.A. Characteristics of the gas produced during biomass direct gasification in an autothermal pilot-scale bubbling fluidized bed reactor. Energy 2017, 120, 915–928. [Google Scholar] [CrossRef]
  48. Neves, D.; Matos, A.; Tarelho, L.; Thunman, H.; Larsson, A.; Seemann, M. Volatile gases from biomass pyrolysis under conditions relevant for fluidized bed gasifiers. J. Anal. Appl. Pyrolysis 2017, 127, 57–67. [Google Scholar] [CrossRef]
  49. Shi, Y.; Chrusciel, L.; Zoulalian, A. Production of charcoal from different wood species. Récents Progrès en Génie des Procédés 2008, 96, 9. [Google Scholar]
  50. Charvet, F.; Silva, F.; Ruivo, L.; Tarelho, L.; Matos, A.; Figueiredo da Silva, J.; Neves, D. Pyrolysis Characteristics of Undervalued Wood Varieties in the Portuguese Charcoal Sector. Energies 2021, 14, 2537. [Google Scholar] [CrossRef]
  51. Schure, J.; Pinta, F. Efficiency of charcoal production in Sub-Saharan Africa: Solutions beyond the kiln. Bois et Forêts des Tropiques 2019, 340, 57–70. [Google Scholar] [CrossRef]
Figure 1. Schematic diagram of the kiln showing the positions of the chimneys (S1 to S4), and the temperature (T1 to T19) and airflow (Q0 and Q1) measurement ports. (a) front view, (b) side view, and (c) top view.
Energies 15 04775 g001
Figure 2. Temperature–time profiles at level 0.8 m of the kiln during the first 14 days of Test 1. T5–T9, T11, and T15 according to Figure 1.
Energies 15 04775 g002
Figure 3. Ash deposition around the gas outlet duct leading to chimney S2 as observed during the kiln discharge procedure following carbonization Test 1.
Energies 15 04775 g003
Figure 4. Vertical temperature profiles at the rear part of the kiln during Test 1, from day 0 to day 9, as measured by thermocouples T14 (0 m) to T18 (5 m). (a) from day 0 to 3, (b) from day 4 to 6, and (c) from day 7 to 9.
Energies 15 04775 g004
Figure 5. Daily average, maximum, and minimum airflow rates through the air inlets at the kiln door, including the results for both Tests 1 and 2.
Energies 15 04775 g005
Figure 6. Concentrations of N2 O2, H2, CH4, CO, CO2, CxHy, and LHV of the dry clean carbonization gas leaving the kiln. Squares—chimney S4, triangles—chimney S3, circles—chimney S2, crosses—chimney S1.
Energies 15 04775 g006aEnergies 15 04775 g006b
Figure 7. Mass balance to the carbonization process based on the results from both Test 1 and Test 2. The masses of solid inputs and outputs are dry masses, which means that the permanent gases and liquids taken as differences only account for those released from the dry wood charge.
Energies 15 04775 g007
Table 1. Properties of the dry wood feedstocks used in the carbonization tests.
Wood Feedstock (a)Volatile MatterAshFixed CarbonElemental CarbonO/CH/CLHV (b)
[wt.%][wt.%][wt.%][wt.%][kg/kg][kg/kg][MJ/kg]
Holm Oak—branches82.7 ± 2.70.96 ± 0.0416.3 ± 2.747.3 ± 0.40.95 ± 0.020.14 ± 0.00417.1 ± 1.3
Cork Oak—logs and branches83.4 ± 0.90.80 ± 0.0315.8 ± 1.046.5 ± 0.40.98 ± 0.020.14 ± 0.00516.7 ± 1.3
Partially charred wood67.8 ± 9.91.88 ± 0.1330.3 ± 10.154.4 ± 6.40.70 ± 0.160.10 ± 0.0220.0 ± 14.5
Tree stumps76.8 ± 0.41.85 ± 0.1421.3 ± 0.547.3 ± 0.10.94 ± 0.010.13 ± 0.00417.9 ± 1.8
(a) average ± one std. deviation based on three replicates (dry basis); (b) lower heating value.
Table 2. Summary of process conditions during the wood carbonization tests.
Test 1Test 2
Time (days)
Total cycle (carbonization + cooling)2223
Carbonization phase (from ignition up to the start of cooling phase)1011
Cooling phase (up to kiln temperatures below 50 °C) (1)1212
Total precipitation during cycle (mm)34
Average feedstock moisture content (wt.%, wet basis)2312
Dry feedstock input (ton)
Total feedstock21.721.6
Cork oak wood16.817.5
Holm oak wood1.51.3
Tree stumps2.40.9
Partially charred wood1.11.8
Maximum temperatures (°C)
Kiln front (T10 to T13)807808
Kiln rear (T14 to T18)298322
Kiln floor (T14 and T19)132135
Chimneys (T1 to T4)379211
(1) The cooling phase was considered to end when all measurement points reached a temperature below 50 °C.
Table 3. Characteristics of charcoal and charcoal fines as recovered from inside the kiln in the aftermath of the carbonization process.
Solid Products (e)Fixed CarbonAshCarbon ContentO/CH/CLHV (d)
[wt.%][wt.%][wt.%][kg/kg][kg/kg][MJ/kg]
Charcoal—a (a)81.1 ± 2.06.8 ± 2.082.7 ± 1.40.09 ± 0.040.02 ± 0.0129.9 ± 0.1
Charcoal—b (b)64.2 ± 4.75.3 ± 0.872.3 ± 3.40.25 ± 0.060.04 ± 0.0126.3 ± 1.3
Charcoal fines (c) 50.5 ± 3.823.0 ± 4.460.5 ± 4.90.25 ± 0.100.04 ± 0.0121.4 ± 2.4
(a) Recovered from the region near the kiln door. (b) Recovered from the bulk of the carbonization chamber. (c) Initial and final stages of kiln discharge not included. (d) Lower heating value. (e) Average ± one std. deviation.
Publisher’s Note: MDPI stays neutral with regard to jurisdictional claims in published maps and institutional affiliations.

