1. Introduction
The study of eddy flows is interesting from a technical and scientific point of view due to their effect on the transfer processes related to the recirculation flow field. High-rotation flows can be applied, for example, in cyclones that are widely used in various industrial processes [
1].
Cyclones are used for a variety of purposes, and are usually used to separate the dense phase in a multi-phase flow. The flow inlet to the cyclone through the inlet portion of the various shapes may be axial or tangential [
2,
3,
4]. The vast majority of the applications of cyclones are in industrial processing (mechanical, thermal, and chemical properties of raw materials and semi-finished products). The cyclone is used in drying processes in construction and other material industries (cement and clinker), after mills in the raw materials industry, after various types of burners, as well as in combination with an aspiration system for pneumatic transport and the working environment.
The tangential inlet is widely used to separate particles from a gas stream [
5], and cyclone separators are among the most widely used devices in this type of treatment [
6,
7,
8,
9].
The new generation of cyclones works under the influence of centrifugal forces, as well as the effect of filtration. The contaminated flow curtain filters the flow coming from the subsequent channel in the area of curvature of the curvilinear half-rings, increasing the cleaning efficiency [
10]. The mixture of fluids enters the cyclone and rotates, and the dense phase of the mixture under the action of centrifugal forces begins to move relatively in the radial direction and is separated from the main stream [
11,
12,
13]. This issue is difficult to analyze because, in addition to its three-dimensional nature, this flow is influenced by many other parameters [
14,
15,
16,
17].
One of the problems in calculating cyclone efficiency is the effect of flow dynamics parameters. In general, in large cyclones, the flow is turbulent and the assumed friction factors and results are significant [
18]. This is, however, not the case in small cyclones where the flow and operating conditions—speed, temperature, pressure, viscosity, or cyclone diameter—may be more important, as [
5] in these cyclones, the flow can be laminar, turbulent, or transient. Turbulent flows may initially be laminar [
19]. The operating parameters have a greater effect on cyclone efficiency in laminar than turbulent flows. In small cyclones, it is particularly difficult to predict the effect of flow regime on efficiency and pressure loss compared with the effect of geometrical parameters. Computational fluid dynamics (CFD) is a potential tool for predicting flow field characteristics, particle trajectories, gaseous pollutants, and pressure drops inside cyclones [
13].
In a two-phase flow process in a cyclone, it is difficult to grasp the essence that can improve the operation due to the fact that, despite the supposed simplicity, the flow dynamics are complex, involving vortex motion and backflow circular zones. The peculiarities of many flow fields have not been distinguished in closed vortex flow theories so far. The problem concerning the mathematical modeling of the detailed flow structure involves the solution of closely related nonlinear partial differential equations of mass and momentum, and has no analytical solution. Furthermore, an estimate of turbulence based on an isotropic assumption, e.g., the turbulent viscosity hypothesis, cannot be applied to rapidly rotating flows [
20]. A similar opinion was expressed in the work [
21].
The time-averaged Navier and Stokes equations for the gas phase are related to the anisotropic combination of the turbulence model, the k–ε model, and algebraic stress equations. Following this groundbreaking work, turbulence was modeled in several more studies to better predict velocity and pressure by modifying turbulence models. All of these studies considered axial symmetry to allow the application of a two-dimensional model that assumed that the solid phase did not encounter a gas field [
21].
A turbulence model known as the Reynolds stress model (RSM) [
22] was applied to obtain values for Reynolds stress components [
23]. This model is based on the transfer equations for all components of the Reynolds stress tensor and the rate of dissipation. The RSM presents anisotropic turbulence for flows, and, according to the turbulent viscosity hypothesis, isotropic turbulence [
24,
25,
26]. In the first case, the Reynolds stress transfer equations for the individual stress components are solved [
27,
28].
Cyclone-modeling studies have been widely applied and developed. However, the design of multichannel cyclones is only just beginning to be analyzed in research. This device uses a dual cleaning method, i.e., complementary interactions between centrifugal forces and gas flows. This operating principle changes the aerodynamic properties and the particle deposition process in the plant and should, therefore, be considered as a new stage of research separately from traditional cyclone separators.
Cyclones of this construction are not traditional, i.e., hollow. This is a new generation of geometry in which the ducts are installed, which fundamentally changes the movement of the gas flow in the unit. This study analyzes different inflow rates, the control of which, in practice, according to the proposed work cases, would increase the cleaning efficiency.
Traditional cyclones are among the most widely used treatment plants for the removal of particulate matter. The main disadvantage of these devices is the insufficient cleaning efficiency in the removal of finely divided solids. The multichannel cyclone presented in this study is a new-generation device that, thanks to a channel system, rather than a hollow separation chamber, is capable of efficiently precipitating both coarse and fine solids. The design of these facilities is more complex than that of traditional ones, and flow management requires additional scientific evaluation.
The concept of multi-channel cyclones has more possibilities to adapt the cleaning apparatus to the needs of the cleaning process. Traditional cyclones are limited to the size of the separation chamber, which changes due to the efficiency of the air being cleaned. Investigations have been performed analyzing the orientation of the inflow opening, the number of inflows, and their geometry and size [
29,
30,
31,
32]. This analysis is also possible in multichannel cyclones, but additional purification can be controlled by changing the arrangement of the channels and the shape of the channel-forming elements—research in this area is being conducted [
32].
The results of a numerical study showed that the newly designed multichannel cyclone can be successfully analyzed using conventional models that can be applied to traditional hollow cyclones. An important result of this work is the resulting numerical model that simulates the total inflow. This traffic is then multiplied multiple times, resulting in backflows (connections) with the new inflow. This is an essential concept in the operation of this new-generation device, which fundamentally changes the course of the cleaning process. Therefore, the examination of this case is scientifically important for the development of numerical models for other feedback. The multichannel cyclone is a modular design that can be modified according to need and scope. As an example, a structure consisting of a larger number of channels could be considered in the future, which would result in a greater drop in air pressure, but would achieve greater efficiency in the removal of particulate matter.
The aim of this work is to perform the numerical modeling of a two-phase flow in a six-channel cylindrical cylinder using three-dimensional transfer equations and standard k–ε and RNG k–ε turbulence models. To evaluate the velocities, the pressures and volume distributions of the two phases in the cyclone under the action of centrifugal forces were specified.
2. Methods Introduction
The CFD methodology was applied to divide the considered area into many control volumes and replace partial differential equations with their algebraic equivalents. A set of algebraic equations obtained can be solved using iterative methods, and the distribution of the variables, such as the velocity component and pressure, in the field depending on the boundary conditions describing the specific problem can be obtained [
23].
The study [
33] stated that the use of CFD software for numerical calculations of the gas flow field is a more general modeling technique that better describes the operation of a cyclone.
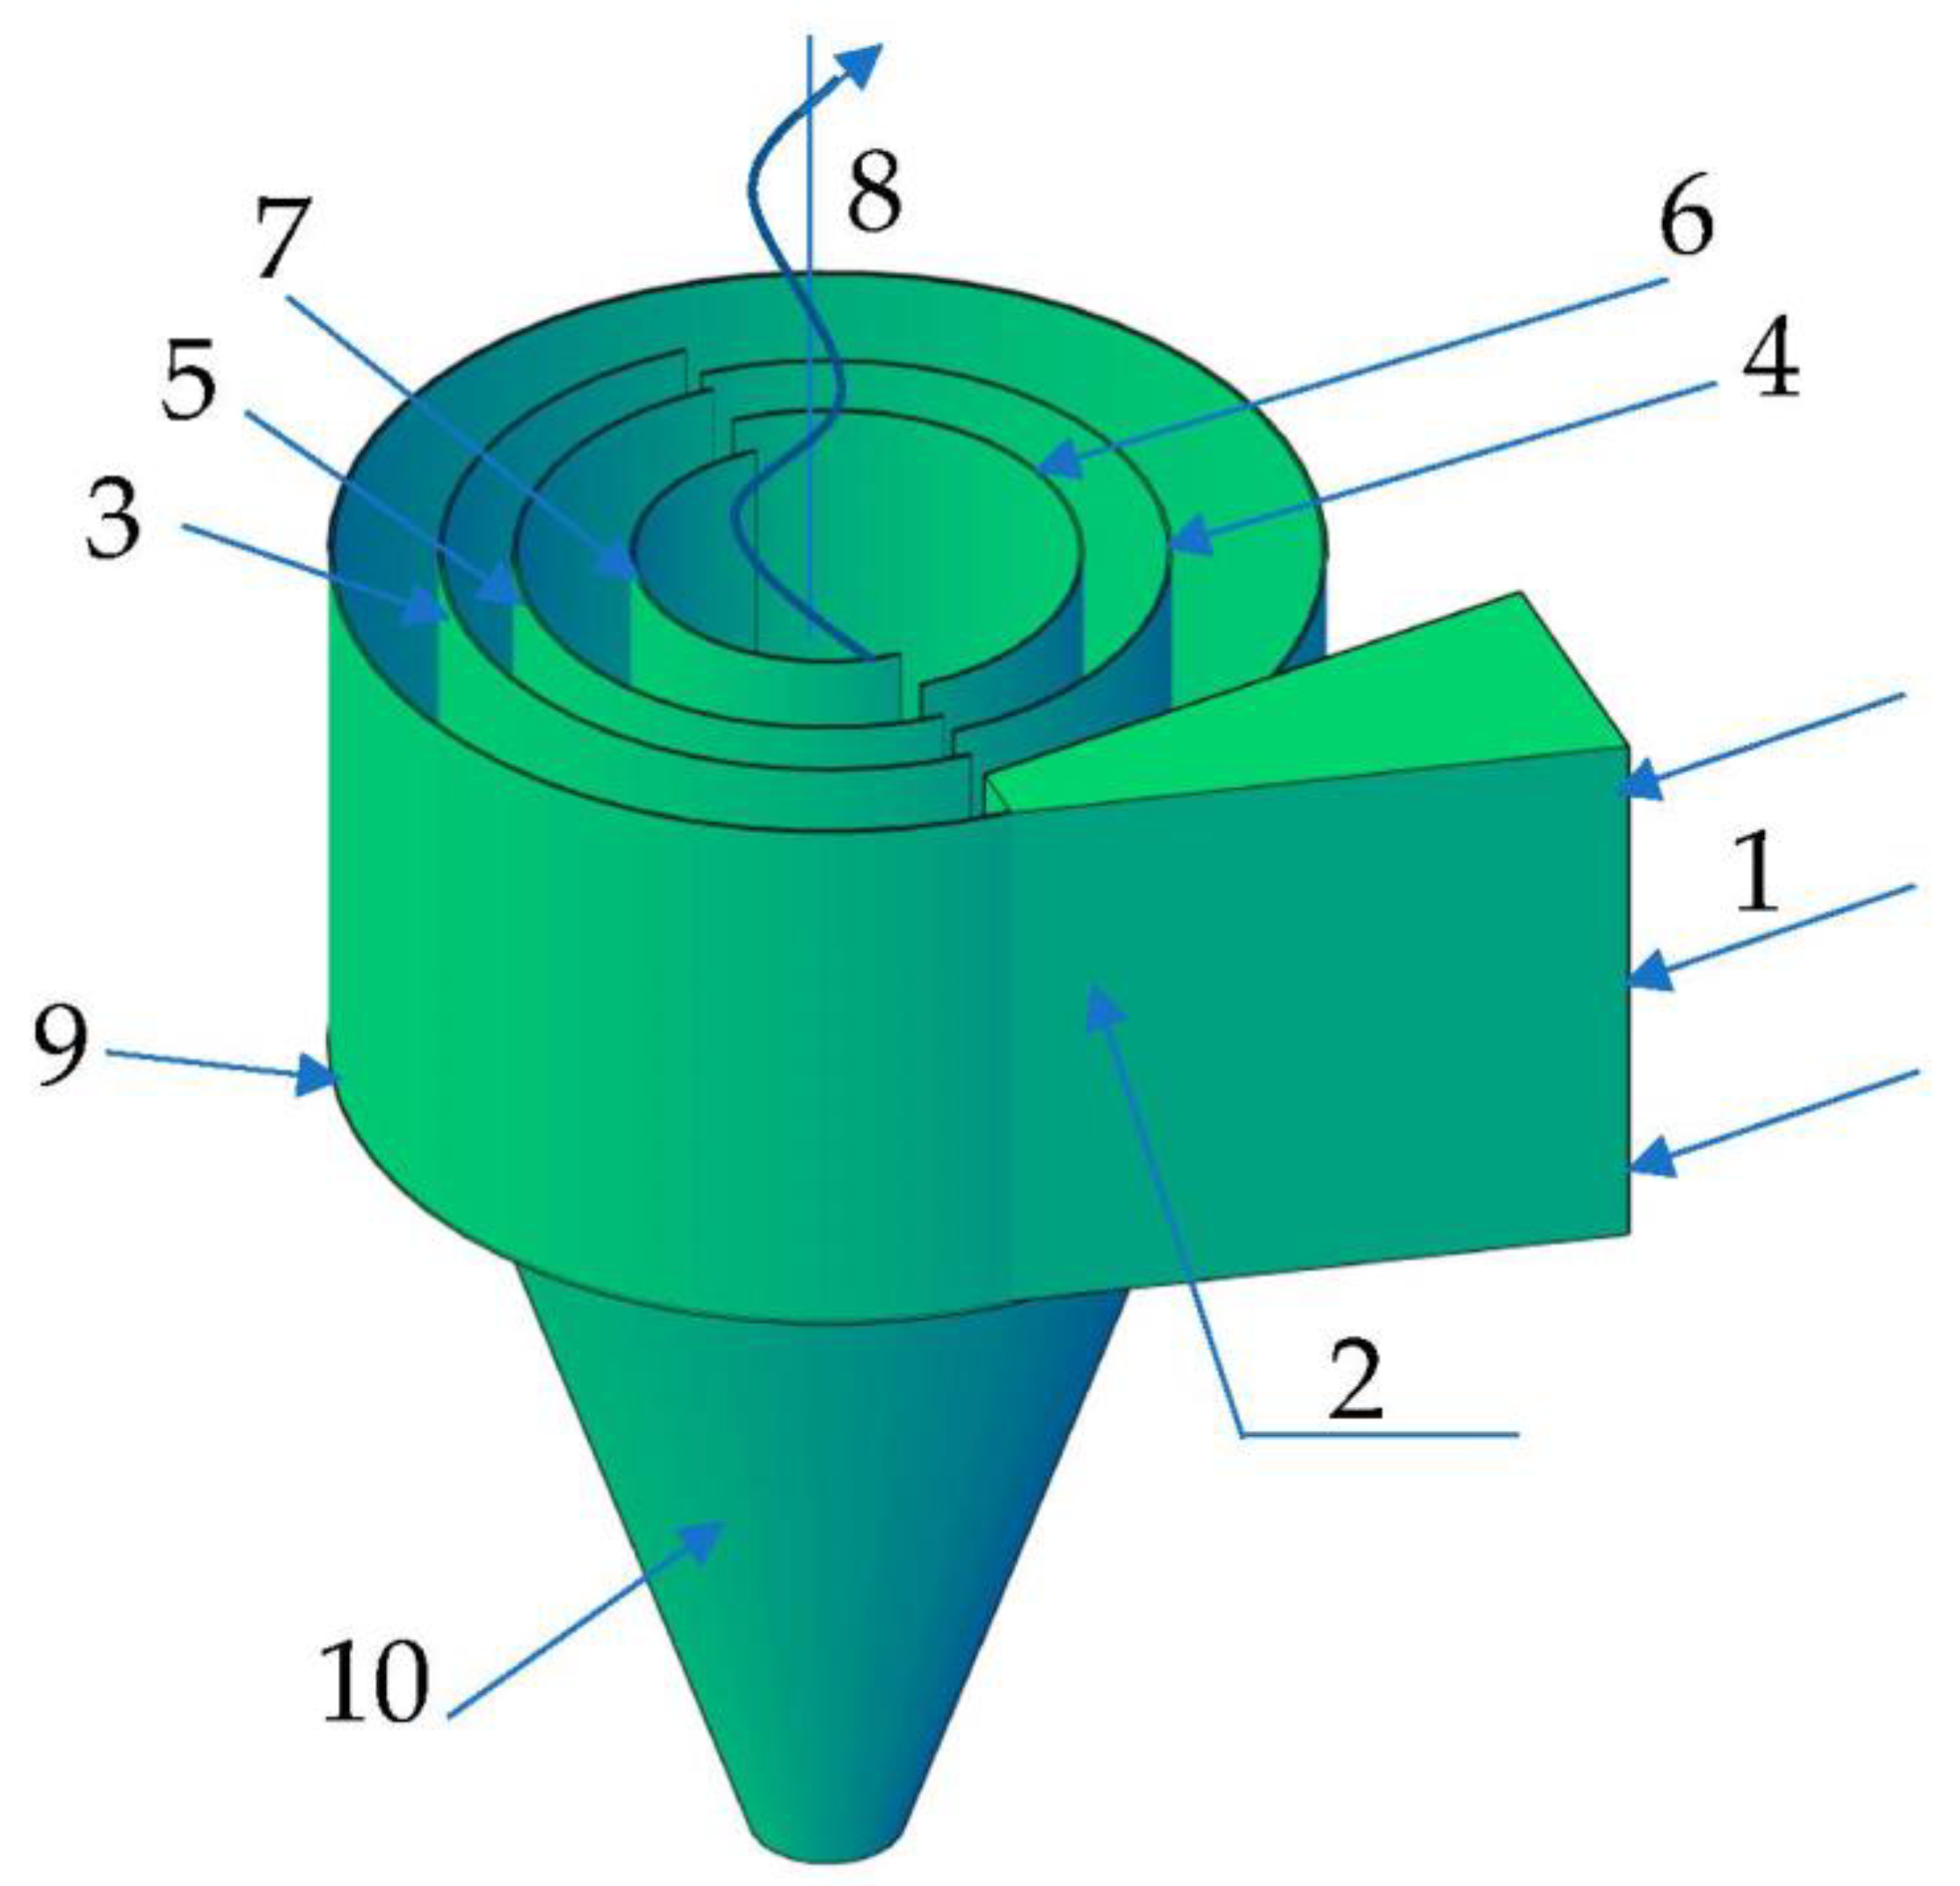
A schematic diagram of the cyclone model under consideration is shown in
Figure 1.
The two-phase flow flows tangentially through the inlet (1) and enters the separation chamber, the first cyclone channel, which is bounded by a peripheral wall and the first curvilinear half-ring. The flow flowing from the previous channel encounters the semicircular wall and splits into two flows—peripheral and transit. Part of the peripheral flow enters the re-filtration in the cyclone, and the transit flow enters the next channel towards the plant axis and the outflow from the cyclone. As it flows, the air flow is distributed along the channels with different curvatures and filtered through the gaps between the hemispheres. Under the action of centrifugal forces generated by the vortex flow and in the zone of the resulting filtration effect, solids are deposited on the bottom of the six-channel cyclone, fall into the segmental annular slits (9), and accumulate in the cyclone hopper (10). Purified air passing through all six cyclone channels exits the system through the air outlet (8). Dusty air is filtered in the active zone of the channel gaps as a result of the interaction of the particles themselves, which coagulate.
In experimental studies of the aerodynamic characteristics and cleaning efficiency, numerical modeling is performed by examining the construction of a six-channel cyclone using the PHOENICS 3.2 (CFD) software package for computational fluid dynamics. The model uses continuous curved linear channel-forming semicircles. The parameter of the different inlet velocities of the air flows generated by the axial fan is estimated in the model by entering the inlet velocities in the air flow inlet cell. The selected inflow rates are an appropriate step in this work. The design of cyclones starts with the need for clean air efficiency. In this case, speeds of 10.9 m/s, 13.9 m/s, and 21.9 m/s correspond to airflows of 900 m3/h, 1200 m3/h, and 1900 m3/h. The main structural parameters are: diffuser, width × height—0.008–0.025 × 0.3 (m); radius of semi-rings—0.2, 0.17, 0.14, 0.11, and 0.08 (m); air flow outlet—0.16 m; and height of the conical hopper—0.25 m. These velocities are 9.3 m/s, corresponding to the maximum flow, 8.3 m/s, corresponding to the average flow, and 6.3 m/s, corresponding to the minimum flow.
2.1. Determination of the Biphasic Flow Rate Distribution in a Six-Channel Cyclone
Variations in the inlet velocity parameters are used to determine the airflow velocities. Changes due to changes in inflow are considered at five different cyclone heights, i.e., 10 mm from the bottom of the cylindrical part (section I), 80 mm from section II, 150 mm (section III) corresponding to the center of the height of the cylindrical part of the cyclone, 220 mm from section IV, and 300 mm (section V) corresponding to the outlet cross-section.
In each case, the two-phase velocities U1 (gas (air) flow) and U2 (particulate matter) are given. According to the ruler of the spectrum, it is possible to determine the prevailing velocities in a certain cyclone channel and the height of the cylindrical part.
Airflow velocities are modeled at the aforementioned inlet velocities using median-diameter (8.995 μm) glass solids.
2.2. Determination of the Pressure Distribution of a Two-Phase Flow in a Six-Channel Cyclone
The same procedure as that used for the determination of flow velocities was used to determine the second aerodynamic parameter, but in this case, it was limited to a single phase only—the gas (air)-pressure cyclone. The sub-distribution is also considered in five sections at three different inflow rates. As in the flow-rate modeling, the pressure changes were considered only at a single average concentration of 5 g/m3 particulate matter due to the extremely negligible effect of the second-phase concentration on the gas (air) pressure distribution in the cyclone. When the mathematical model was created, it was observed that the pressure distribution remained the same for the single- and two-phase flows, i.e., the uncontaminated flow and the two-phase flow contaminated with median-diameter particulate matter (8.995 μm). Therefore, it is limited to determining the dynamic pressure distribution in the model in the case of a two-phase flow by varying the inlet velocity parameter, which is included in the list of input data in the mathematical model.
2.3. Determination of the Two-Phase Flow Separation Efficiency in a Six-Channel Cyclone
To determine the efficiency of a six-channel cyclone, the model evaluates the relationship between the air flow and particulate matter—the volume fraction of particulate matter and its change. This results in the flow of the different contaminants, their movement in the sections of the cyclone structure, and the relative parts at the respective points of the installation, which corresponds to the concentration of the particles under consideration [
30]. An air/particle ratio of 1:0.005 corresponds to a particle concentration of 5 g/m
3. In all cases, the efficiency of the separation of glass particulate matter from the air stream with a median diameter (8.995 μm) was considered. After performing the modeling task, in the case of different parameter variants, the average values of the volumes of the second phase in the outflow of the cyclone separation chamber were presented in two-dimensional space. The obtained results were comparable with those of experimental studies performed on the physical model [
34].
In this work, the two-dimensional Reynolds equations using the Reynolds stress–turbulence model RSTM (Reynolds stress–turbulence model) are solved by the finite area method. The k-e turbulence model is based on the isotropic eddy-viscosity concept for the closure of the Reynolds stresses. In some flow situations, such as when body forces or complex strain fields are present, this assumption is too simple. RSTMs not only allow for both the transport and different development of the individual Reynolds stresses, but they also have the advantage that terms accounting for anisotropic effects are introduced automatically into the stress-transport equations.
The standard models of
k-ε (Equations (1) and (2)) and
k-ε
RNG (Equations (3) and (4)) are expressed as partial derivatives as follows [
35]:
where
Gk is the variation in the turbulent kinetic energy (TKE) due to the internal rate gradient, which, according to Businesko’s hypothesis, is equal to
;
µt is the turbulent dynamic viscosity;
S is the deformation tensor;
Gb is the variation in TKE due to the average flow rate gradient, which is equal to
;
β is the temperature expansion coefficient;
Prt is the Prandtl number of energy turbulence;
gi is the gravitation vector in direction
I;
YM is the fluid rate distribution due to the space movement under turbulent compression, which is equal to
;
Mt is the turbulence Mach number, a coefficient;
C1ε,
C2ε, and
C3ε are the constants;
σε and
σk denote the Prandtl number for
ε and
k variables; and
Sε and
Sk are the users chosen.
In the modeling problem, the elliptical equations of the transfer processes were solved numerically with the PHOENICS software package. Multiphase flows were characterized as having two or more fluids moving relative to each other. The differential equation is summarized in the following form:
where
t—time;
ri—
i-phase volume;
ρi—
i-phase density; Φ
i—
i-phase dependent variable, such as movement per unit mass, turbulence energy, or phase volume;
vi—
i-phase velocity vector;
Γi—exchange coefficient of variable Φ
i; and
SΦi—flow (source) member for the variable Φ
i.
In Equation (5), the characteristics of gas viscosity, gas and second-phase densities, and velocities of both phases are evaluated. To ensure the accuracy of the results, the efficiency values of the mathematical model were compared with the values of the physical model, in which the combined effect of centrifugal forces and filtration on the cyclone cleaning efficiency is evaluated in any case. Based on the small discrepancies between the results of the two models, it can be assumed that, in both cases, the influence of the ongoing fluid dynamics processes on the cyclone separation efficiency acting only on centrifugal forces is properly evaluated. In the software package, it is possible to enter the parameters of the second-phase—particulate matter—the most important of which is density. Therefore, when testing glass particulate matter, an appropriate glass density of 2600 kg/m3 was introduced (bulk density of 1650 kg/m3 was not estimated).
The developed model determined the overall minimum air-cleaning efficiency, taking into account the ratio of the two phases under the same aerodynamic parameters. At the same time, it is possible to determine the points with the highest air/particle ratio, i.e., if the concentration of particulate matter is lower or vice versa.
The mathematical model separation efficiencies were determined at three speeds equal to 9.3 m/s, 8.3 m/s, and 6.3 m/s. This was intended to determine the influence of the flow of the first phase on the change in the volume fractions of the second phase in the mathematical model under consideration.
The air purification efficiency in the model was calculated as a normal measure of the purification efficiency, but the concentration value after purification was estimated using the highest value of the second phase (R2) at the cyclone effluent. The calculation of the cyclone purification efficiency was performed according to the Formula (6):
where
η—cyclone cleaning efficiency, %;
Vdal.1—volume fraction of particulate matter before treatment and concentration of particulate matter before treatment; and
Vdal.2—volume fraction of particulate matter at the outlet of the cyclone and minimum concentration of particulate matter after treatment.
In this way, it can be ensured that the cleaning efficiency will not be below the calculated value after estimating the said concentration.
2.4. Initial and Boundary Conditions
According to the physical model (
Figure 1), a numerical model of the cyclone and its discretization by dividing the cylindrical space into elements of finite volumes were formed.
The boundary conditions for finding the solution are: inflow (for all 6 variables), outflow (zero-pressure value), velocity adhesion to the hard walls (inside the cyclone, semi-annular on both sides: u = v = w = 0). The processes in the cyclone are constant and unchanging—oscillations in the residuals plot were not persistent, so the studies were conducted using a steady-state simulation.
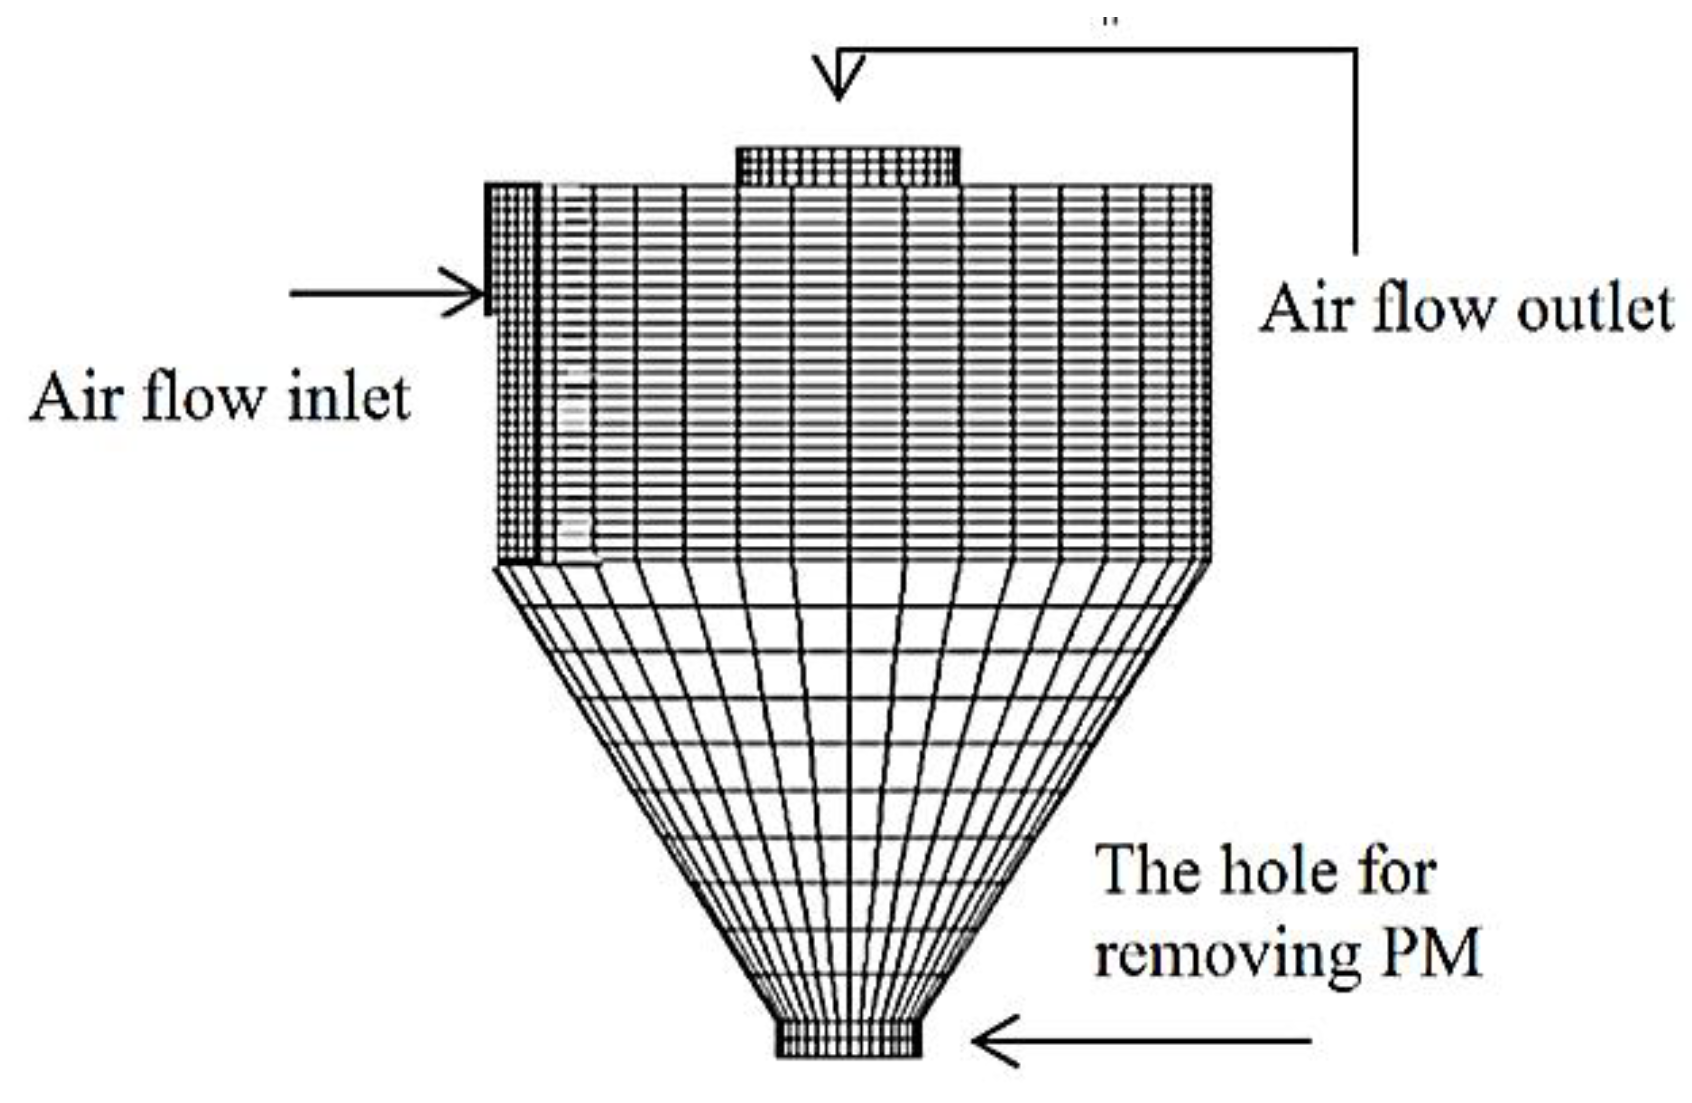
Figure 2 shows the cyclone modeling area in three-dimensional space in a cylindrical coordinate system divided into cells in the directions of the
x,
y, and
z coordinate axes [
23]. The coordinates start at the bottom of the cyclone: the coordinate z goes up the vertical axis of the cyclone (0–0.72 m), x is the angular coordinate in radians (0–2π), and y is the radial (0-R = 0.25 m), i.e., from the vertical axis of the cyclone to the cyclone body. The mesh of the cyclone generally consists of 64,800 (
Figure 2) and 97,200 volumetric cells. A confirmation of the boundary layer at the wall and the selected turbulence model is considered as y+. The detailed description and expression are presented in studies [
36,
37,
38]. The value of y+ in the first cell next to the solid boundary was 0.36, which was acceptable for the applied turbulence model. These are velocity control cells to calculate the radial, tangential, and axial velocity components; and the pressure, phase volumes, and turbulence characteristics were calculated. Three velocities—10.9 m/s, 13.9 m/s, and 21.9 m/s—were used to allow the airflow (opening on the side of the cylinder) to enter the cyclone. Zero-pressure conditions were evaluated for the outflow (opening at the top of the cyclone). Considering the sufficiently high rates in the cyclone channels, the total simulation time was equal to 60 s. No individual time steps were selected in that interval because the process was smooth. The obtained visual views analyzed the accumulation of solid particles at the walls during the whole process, so short time intervals were not relevant in this case. The hole at the bottom of the cyclone was for PM removal.
3. Results and Analysis
The created mathematical model enabled us to achieve the aim of this work, i.e., to determine the changes in the trajectories and parameters of the movements of both phases in the various sections of the six-channel cyclone model.
The modeling problem is solved by varying the air flow rate through the tangential inlet and selecting the ratio of the volume fractions of air to match the volume of particulate matter in the biphasic fluid.
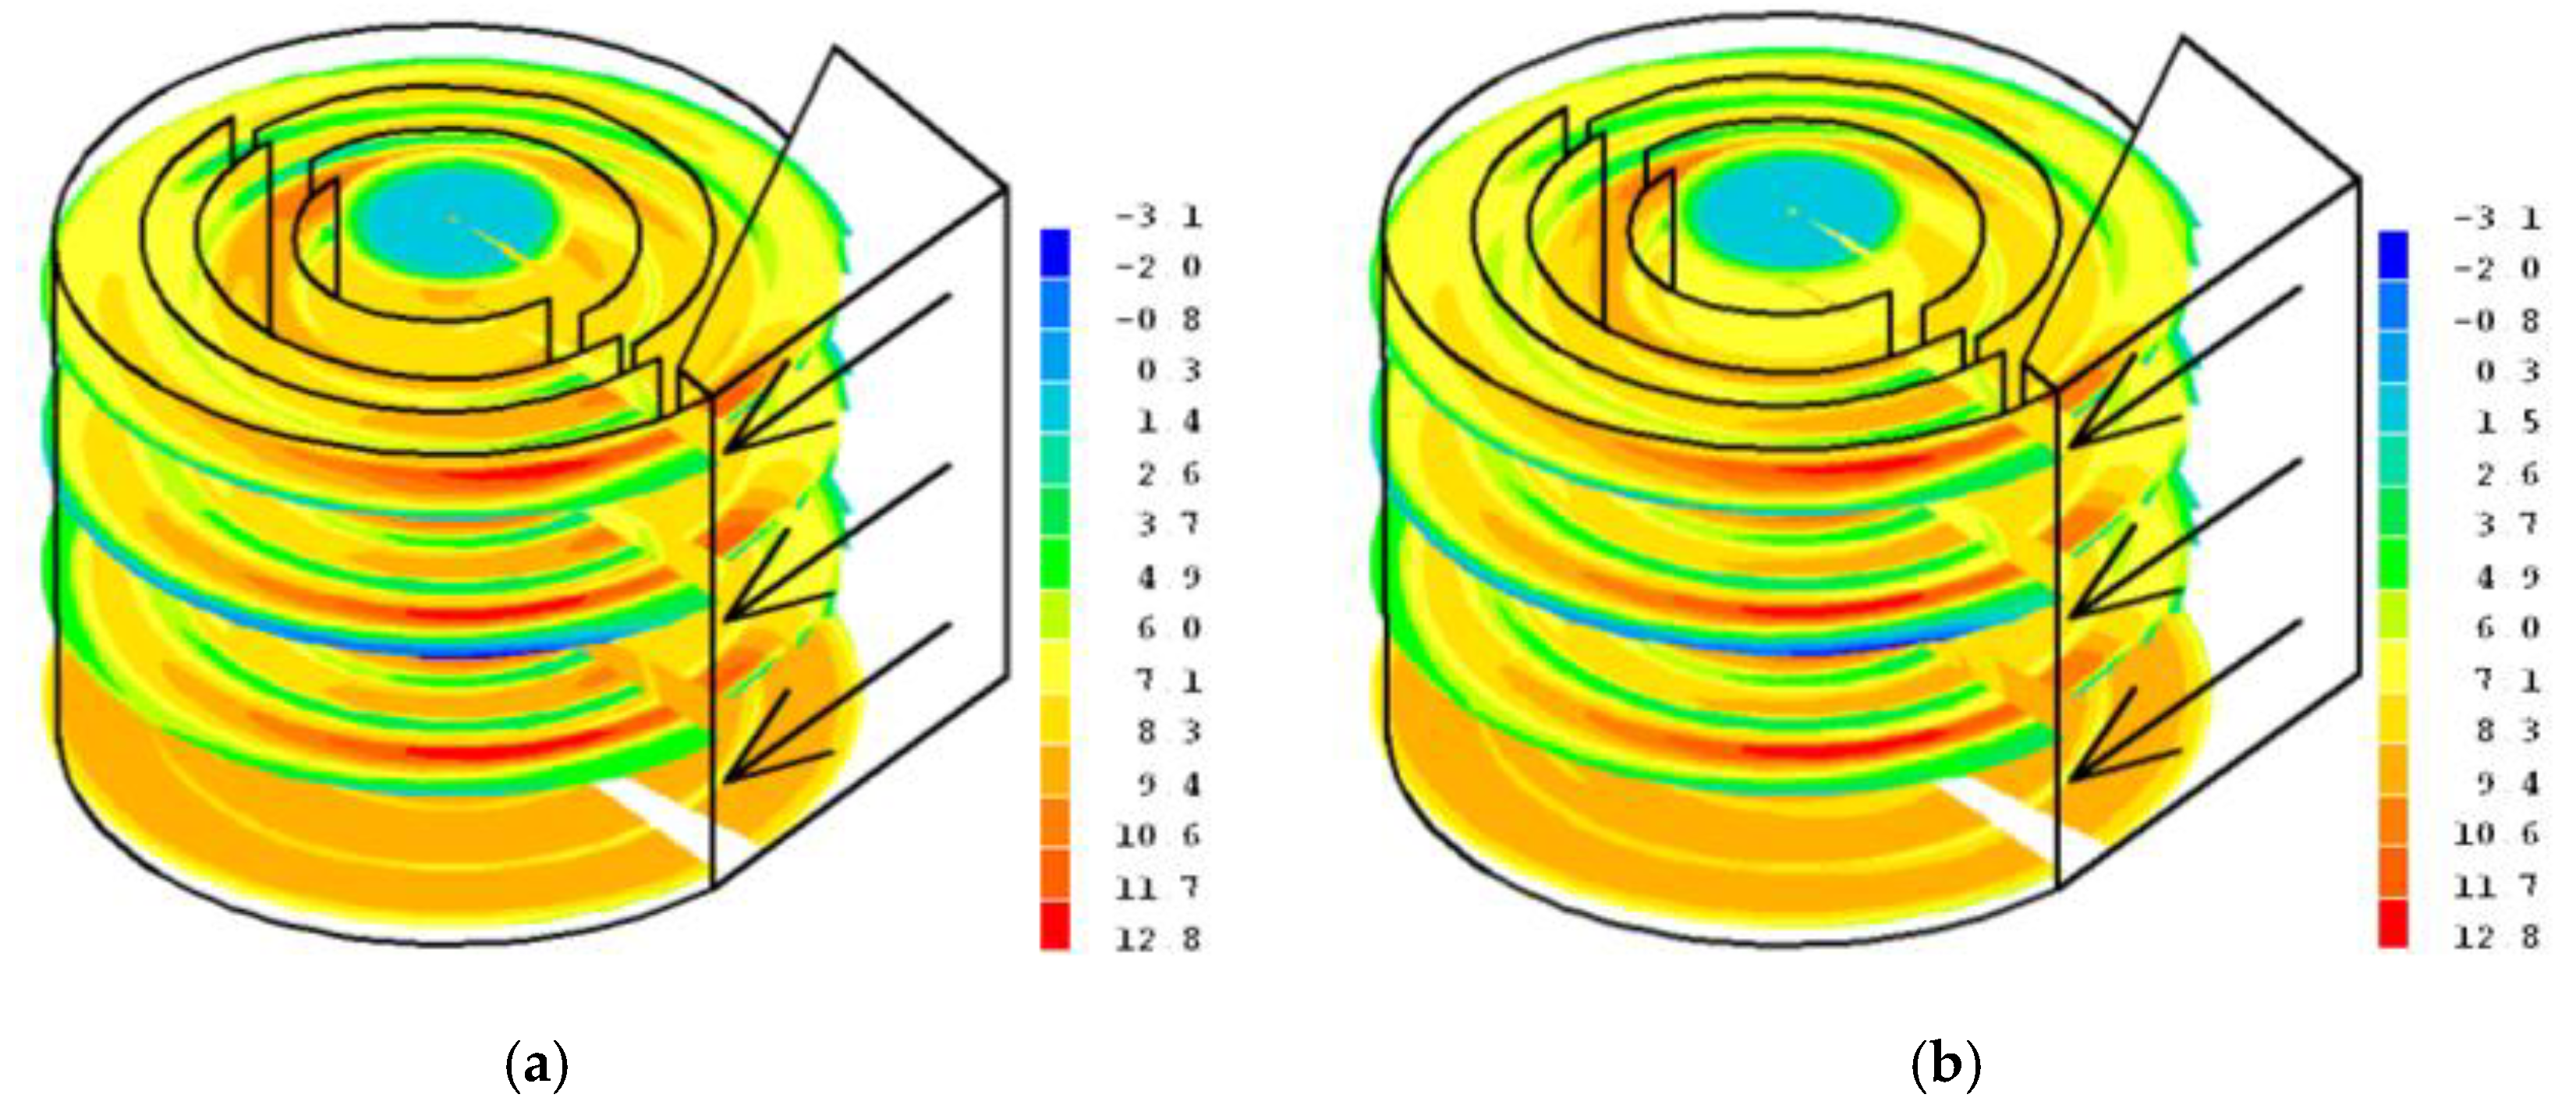
For the two-phase flow, in which the second phase consisted of glass particulate matter with the given median diameter (8.995 μm), the flow rate into the cyclone, which was 9.3 m/s in the first case, was chosen as before. The variation in the velocity components U1 (a) and U2 (b) in the cyclone sections is shown in
Figure 3.
At the maximum inflow velocity into the cyclone, an increase in the velocities of the second phase U2 in cyclone sections II, III, and IV could be observed at the inflow into the cyclone, where the velocities reached up to 13 m/s. Therefore, it can be concluded that favorable conditions were created for the capture of fine-dispersion particulate matter due to the lower mass, and under the action of eddy forces, they are directed closer to the peripheral wall. As a result, under the action of gravity, the particulate matter was deposited by entering the collection hopper through the segmental slits in the separation chamber.
A stationary fluid flow at a velocity of 0 was observed only in sections II and III at the air flow inlet and at the beginning of the channels. Negative velocity values were recorded only in the V-section at the air outlet at the cyclone axis.
An increase in the velocities of the first phase U1 (
Figure 3a) to 6.0–8.3 m/s was observed at the beginning of each cyclone channel, in the boundary zone of the curvilinear half-ring. The velocities of the second phase (
Figure 3b) were very close to those in the first phase, reaching an average velocity value of 6 m/s and slightly increasing to 8.3 m/s at the inflows into the channels.
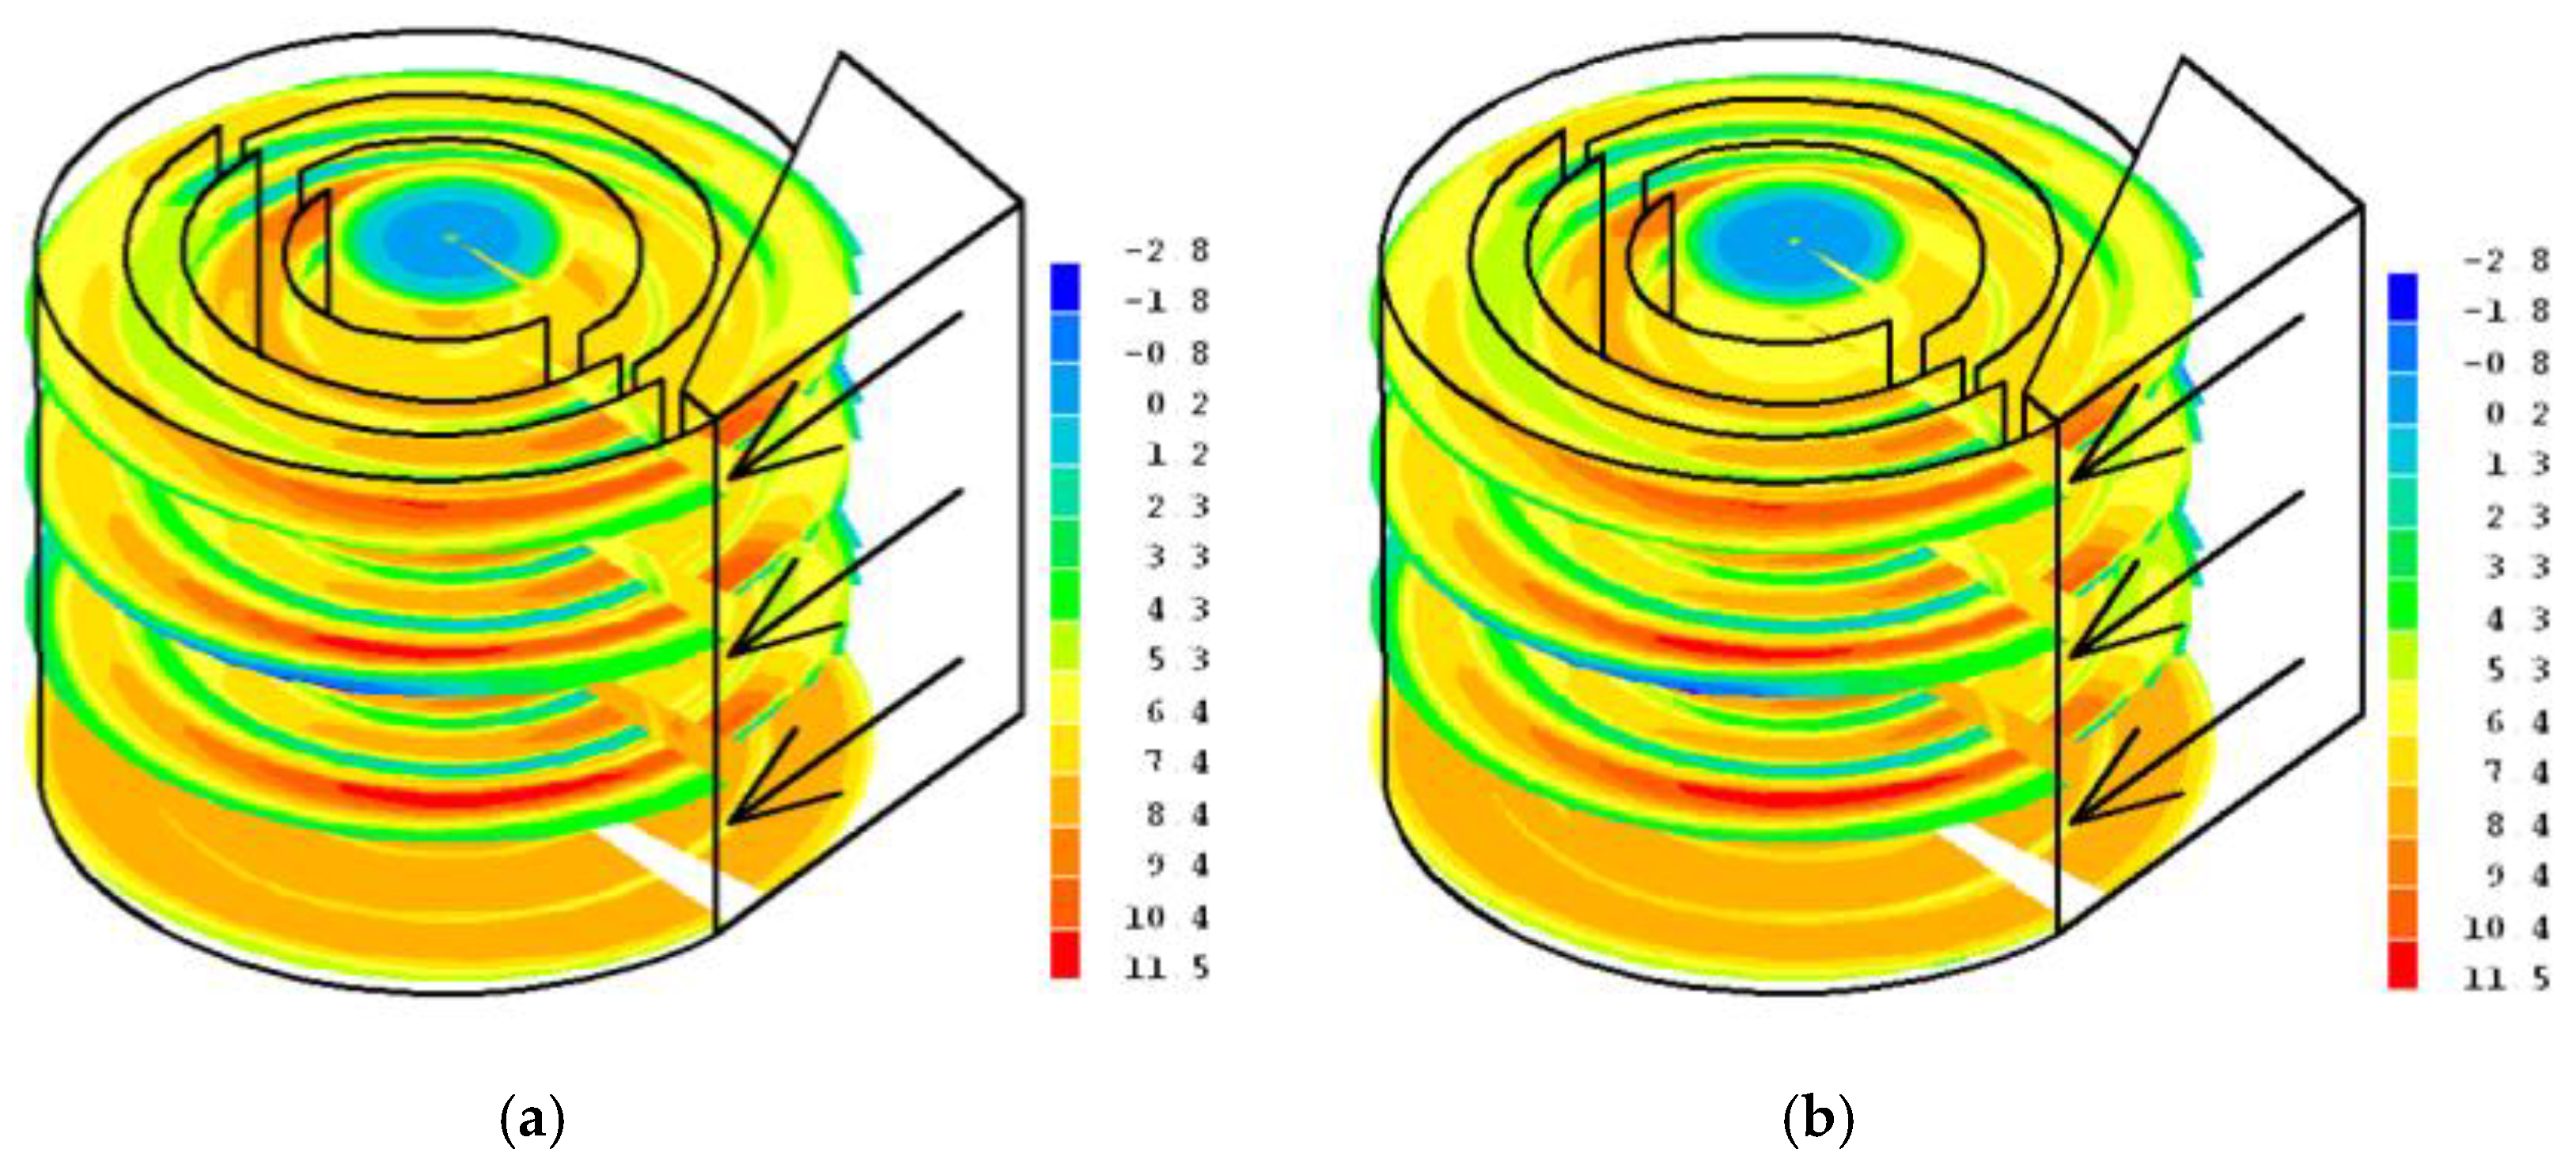
Continuing the analysis of the created mathematical model using fine-dispersion glass particulate matter, an average inflow velocity of 8.3 m/s was selected, and the velocity distribution in the cyclone is shown in
Figure 4.
At the average velocity of the examined ones, the maximum velocity in the cyclone, i.e., 11.5 m/s, was observed at the beginning of channel I in sections II, III, and IV. Slightly lower velocities, reaching 10.4 m/s, occurred at the outflow of channel V into channel VI. The velocity distributions of the two phases were almost the same, except for a small increase in the velocity of the first phase (
Figure 4a) in channel VI on the axis of the unit where the velocity reached 8.4 m/s, while the velocity of the second phase was equal to 8.4 m/s (
Figure 4b).
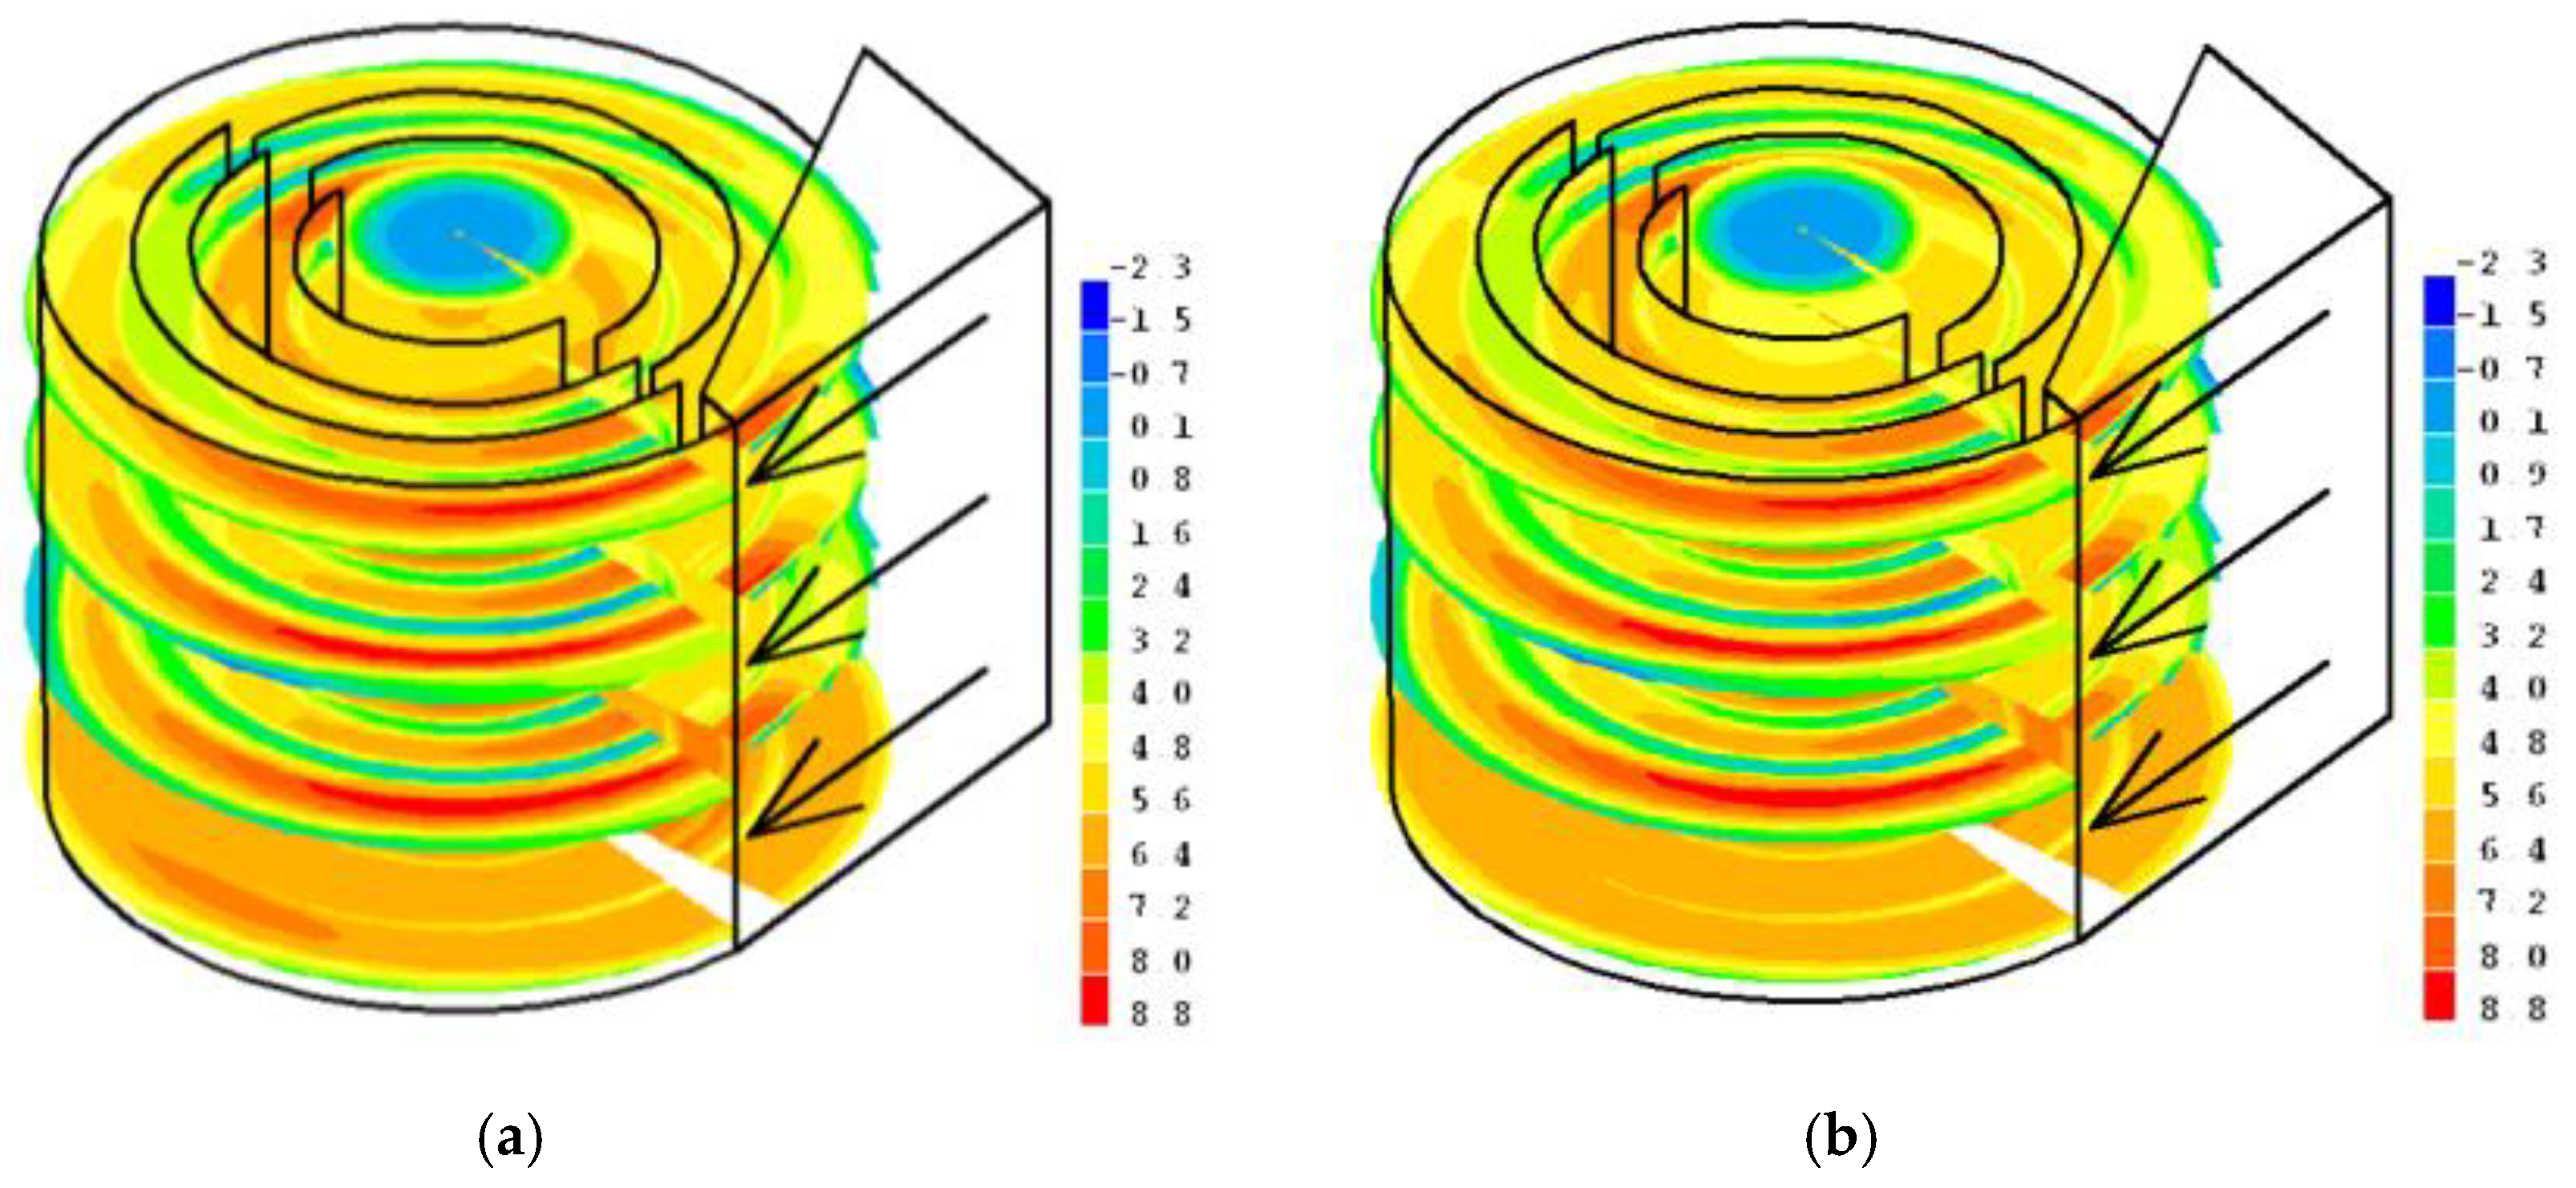
Figure 5 shows the variation in the two-phase flow velocities in the cyclone specified by the modeling of the two-phase flow using median-diameter (8.995 μm) glass particulate matter at the lowest of the selected inlet velocities, i.e., 6.3 m/s.
The maximum value of the air (gas)-phase flow (
Figure 5a) reached 8.8 m/s, which, as in most cases, occurred at the beginning of the first channel in sections II, III, and IV. An increase in speed to the maximum was also observed at the end of channel VI. The lower one-step value of 8.0 m/s was also set in channel V immediately before entering channel VI. Average velocities with values ranging from 3.2 to 6.4 m/s prevailed over the entire volume of the cylindrical part of the cyclone. The minimum velocities were observed in the boundary layers when the velocities fell to 0.2 m/s, and, in channel I, there were even opposite velocities up to 2.3 m/s. The velocities of the second phase U2 (
Figure 5b) were almost the same; in some cases, insignificant decreases were observed, and the maximum velocity was the same, equal to 8.8 m/s.
As in the cases already examined, the uniformity of the velocity of U2 could be observed in the axis of the device in channel VI, where the particulate matter did not accelerate in the same way as the air flow, but remained relatively constant. The velocities in this part reached 7.2–8.0 m/s.
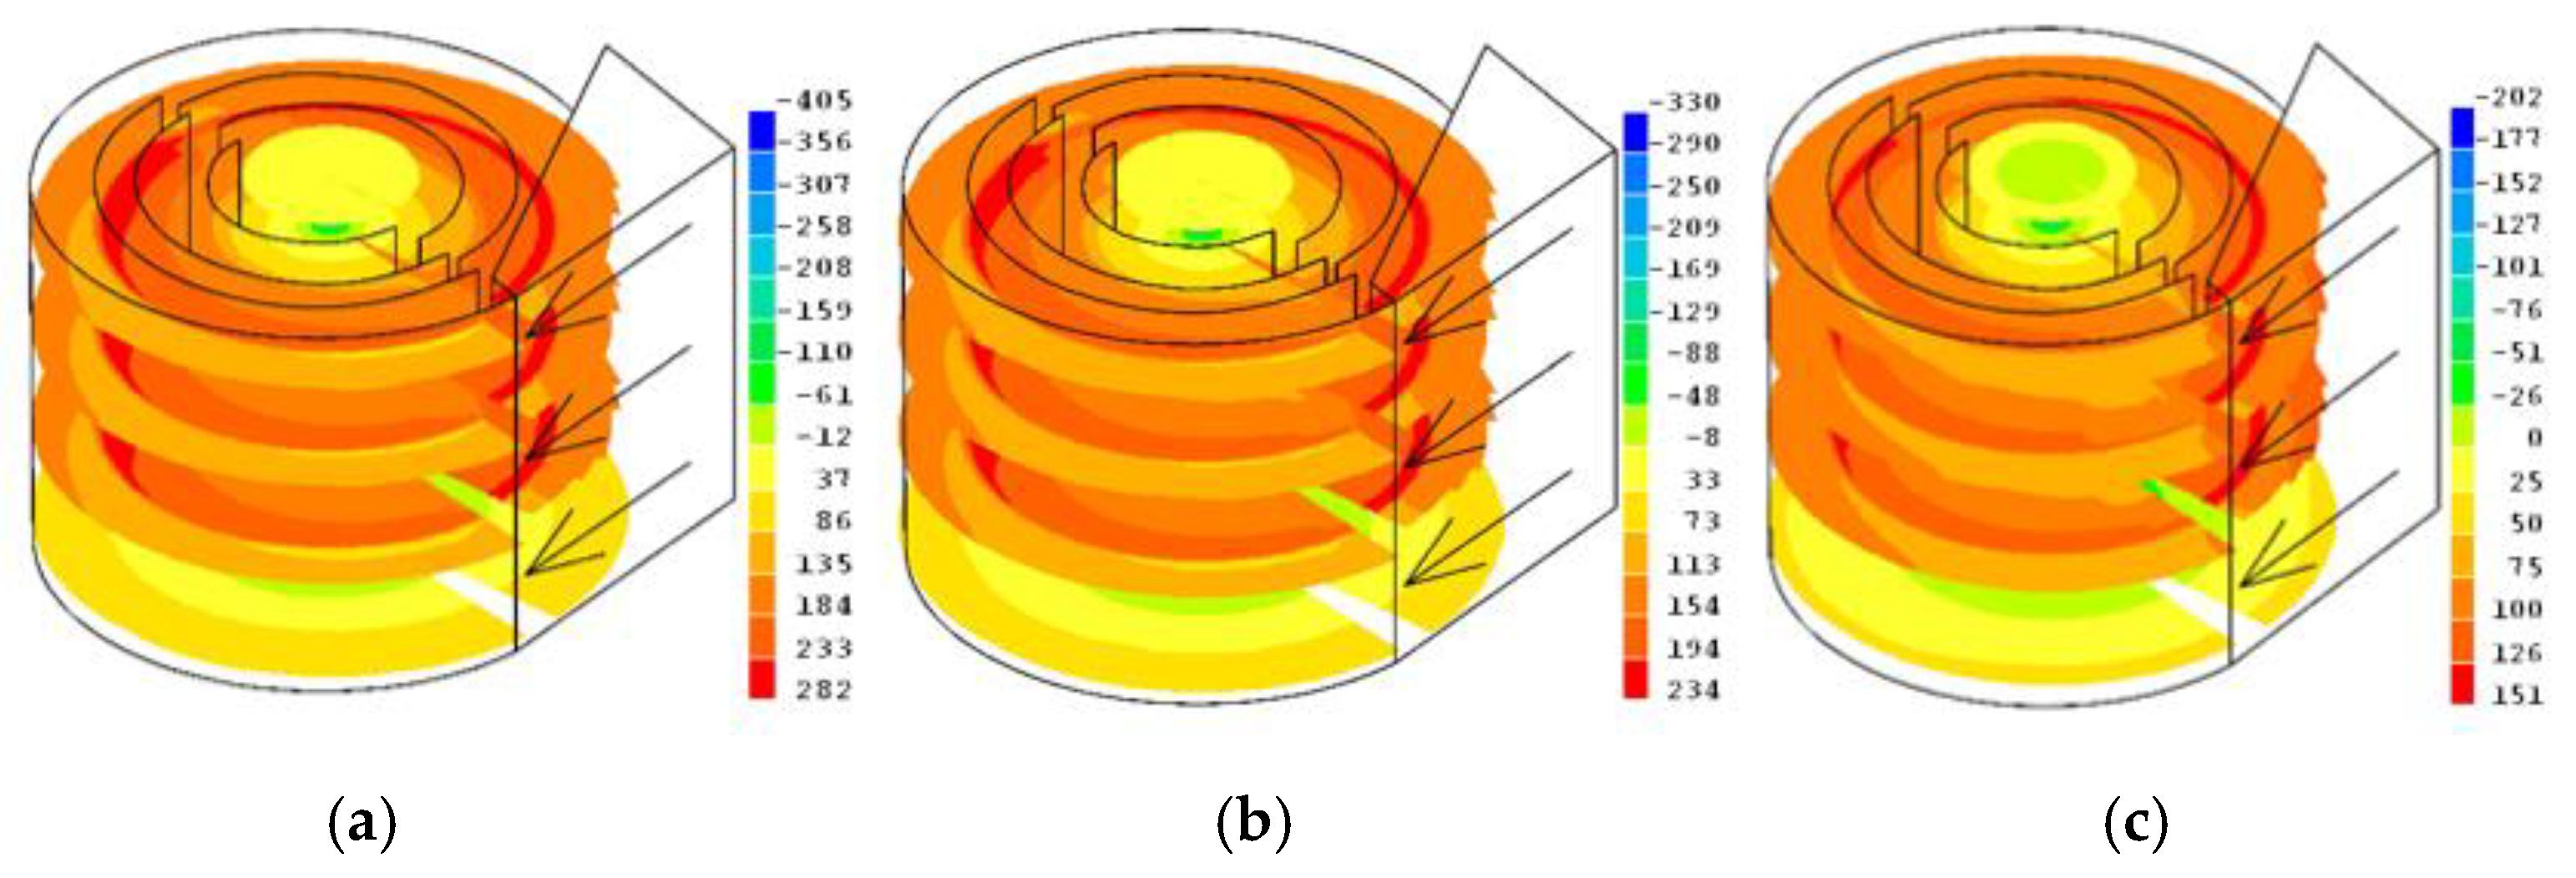
The next of the analyzed parameters, i.e., the pressure distributions at the selected three inlet velocities to the cyclone using glass particulate matter, is shown in
Figure 6, cases a, b and c.
Examining the pressure distribution in the cyclone at the maximum inlet velocity of 9.3 m/s (
Figure 6a), the change in the parameter was shown in the sections of the inner cylindrical part of the device.
It can be seen that the maximum value determined was 282 Pa, which was observed only in channels II and III in cyclone sections II to IV. Pressures below atmospheric were recorded only on the shaft of the unit, where a maximum vacuum pressure of 405 Pa was reached. The average pressure prevailing in the whole volume of the cyclone varied between 37 Pa and 233 Pa (
Figure 6a).
The pressure in the cyclone axis was almost 50% lower than the pressure at the peripheral wall, and they were 37 Pa and 184 Pa, respectively. Negative pressures below atmospheric were found in sections I and V, which could be due to the high turbulence flows. The maximum negative pressure of 12 Pa was recorded in these sections. Pressures above the vacuum pressure of 400 Pa occurred only on the axis of the installation and were distributed over the entire height of the cyclone in question (
Figure 6a).
The pressures in the cyclone channels in the mathematical model varied between 37 Pa and 233 Pa, and in the boundary layers, they rose to 282 Pa. In the studies with physical models, however, the dynamic pressures varied from 12.4 Pa to 180.3 Pa. Such a distribution may have been influenced by the position of the dynamic Pitot–Prandtl tube law with respect to the current, and the cyclone design, uneven turbulent flow motion, possible methodological and measuring instrument errors, and the results of the pressure distribution between physical and mathematical models were not evaluated (
Figure 6a).
At the inlet velocity of 8.3 m/s (
Figure 6b) using glass particulate matter, the maximum pressure in the cyclone was 234 Pa. The maximum pressure value was also recorded in sections II and V in channels II and III. Negative pressures below atmospheric were recorded only on the axis of the device where the maximum negative value was 330 Pa. Throughout the cyclone volume, the average pressures varied from 33 Pa to 194 Pa. In section V, located at the air outlet, the pressure was 33 Pa.
At the minimum inlet velocity of 6.3 m/s into the cyclone, the maximum resulting pressure in the cyclone was 151 Pa. The pressure distribution is shown in
Figure 6. In the case of c, it can be seen that the maximum pressures were in channels II and III at a height of 80 to 220 mm from the cylindrical part of the cyclone.
Negative, less than atmospheric, pressures were recorded in all sections on the axis of the device and reached a maximum negative value of 202 Pa. Lower values could also be seen in the III–V channels of section I and at the air outlet, where the negative values were 26–0 Pa (
Figure 6c).
The cleaning efficiency of the cyclone plant from the median-diameter (8.995 μm) glass particulate matter was determined based on the ratio of particulate matter to air volume in the plant (Formula (6)) and compared with the results of the already studied physical model. The volume distributions of glass particulate matter are given in
Figure 7.
At an inlet particle concentration of 5 g/m3 and an inlet velocity of 9.3 m/s, the maximum value of the particulate matter in the two-phase flow in the cyclone (R2) was 0.37 and the minimum cleaning efficiency was 63%. When the inlet velocity decreased to 8.3 m/s, the maximum value of the particulate volume in the two-phase flow in the cyclone (R2) was 0.42 and the minimum cleaning efficiency was 58%.
In the experimental studies, the separation efficiencies were 73.8% and 55.1% at 9.3 m/s and 8.3 m/s, respectively. The calculated mean errors of the obtained experimental and modeling results were equal to 14.63% at 9.3 m/s and less than 26.26% at 8.3 m/s (
Figure 7a,b).
At the lowest air flow, the inlet velocity of 6.3 m/s in the two-phase particulate flow in the cyclone (R2) was equal to 0.53 and the minimum cleaning efficiency was 47.0%. In the physical model, this value differed from the negative value of 0.21% and was equal to 46.9%. Thus, the total relative error of all the efficiencies examined between the physical and mathematical models was 3.05% (
Figure 7c).
From the distributions in
Figure 7, it can be stated that, at higher velocities, part of the particulate matter accumulated at the beginning of channels I, II, and III and at the end of channel II, along the outer walls delimiting the channels. At the lowest of the selected velocities, 6.3 m/s, the particulate matter completely filled the initial sections of all the existing cyclone channels, and only in the center of the channels did attenuations occur, which indicated the reductions in the second phase parts. The trend of velocity’s influence continued with the inflow of 8.3 m/s from the selected velocities to the cyclone plant, and the volume fractions of the particulate matter in the mentioned parts of the channels were higher than those at the maximum velocity of 9.3 m/s. Comparing the distributions of all three cases at the lowest selected velocity of 6.3 m/s (
Figure 7c), not only did the volume fraction of the particulate matter in channel I increase, but so did their longitudinal distribution.
Higher velocities were able to accelerate the coagulation of particulate matter and the adhesion of particulate matter to conglomerates, and thus increase the precipitation of the second phase due to increasing gravitational forces. It can also be concluded that the flows generated in the cyclone channels at an inflow velocity above 8.3 m/s were able to overcome the adhesive forces of the particulate matter in question with the surface of the cyclone body and the resulting vortex flow, directing them toward the segmental cracks in the cyclone bottom (
Figure 7).
It can also be seen that the particulate matter from channel V, due to the acting centrifugal forces, did not enter the next channel VI, but IV, where the effects of filtration occurred, which was not evaluated in this model, and sedimentation due to gravitational forces that repeatedly occurred (
Figure 7c). This could be due to higher velocities approaching the axis of the device, so that the particulate matter was transported in a flow directed to the previous channel by inertial forces.
In the two-phase flow of particulate matter (second phase R2), the flow moved most intensively along the peripheral wall and the boundary layers of the curvilinear hemispheres, moving from the first channel to the next. The maximum particle volume concentrations were 0.2114–0.2643 at inlet 9.3 (
Figure 7a), 0.24–0.30 at inlet 8.3 (
Figure 7b), and 0.3029–0.3786 at inlet 6.3 (
Figure 7c). Such a trend remained because, in all cases, the maximum values of the volume fractions of the particulate matter were recorded at the locations of the outflows from the channels. In all selected cases, increases in particle volume were observed at the beginning of channels III, IV, V, and VI, where values up to 90% of the maximum values were reached.
At the same time, the runoff of particulate matter from the previous to the next channels from the curved half-ring wall of the existing channel could be observed. This resulted in a particle path that elongated with the lower inflow rate. This effect was best manifested by the flow of air through hemisphere III and the flow into channel IV.
It is important to note that the outer boundary layer of curvilinear hemisphere II had a significantly lower particle volume value, which was, on average, 75% of the average value determined. At an inflow velocity of 9.3 m/s, the value was 0.1586; at 8.3 m/s, it was 0.18, and at 6.3 m/s, it was 0.2271 (
Figure 7).
The changes in the volume fractions of the particulate biphasic stream can be clearly seen in
Figure 7. In the case of c, when the particulate matter filled more than half of each channel, they moved along a uniform trajectory, and their content reached 0.3407. The change in the reduced content was only clear in the boundary layer at the end of channel II, where the values reached 0.3029.
Important properties of the cyclone device, such as changes in velocity and pressure in the boundary layers, were identified from the created mathematical model, which would not be possible to determine in real experimental studies. The Phoenics SFD software package identified identical conditions to those of studies with a physical model, so that possible errors or mismatches of the model with real conditions were minimized.
The total relative error of all of the examined efficiencies between the physical and mathematical models was 3.05%. The efficiency of particulate separation was more affected by the variation in the flow dynamics parameters (velocity and pressure) than in the active zone of the passing volumes of the semicircles, considering the different positions of the semicircles. Examining the developed mathematical model, it was assumed that the additional filtration at the flow junctions did not affect the efficiency of the multi-channel cyclone. In the physical model, this filtration process was an integral part of the particle separation process. The resulting second-phase curtain, when the peripheral flow flowed to the previous channel, did not allow particulate matter to pass through and additionally filtered the contaminated flow in the channel. Therefore, it can be concluded that the increase in the cyclone cleaning efficiency was fully evaluated only in the physical model. Due to the complexity of the applied differential equations in the mathematical model, only the characteristics of air flow (first phase) and the median-diameter (8.995 μm) glass particulate matter (second phase) were estimated, and, therefore, an additional error between the results of the two models was possible.
The particle distributions in the two-phase flow detailed the flow processes that would take place in the channel-transition zones. They also provided information on the variation in the volume fractions of glass particulate matter with median diameter in the cyclone channels. The results are presented in a rather expanded form in order to show the influence of the considered aerodynamic parameters—speed and pressure—on the change in the cleaning efficiency of polluted air flows as much as possible.
