Abstract
This work investigates the cost-efficient integration of renewable hydrogen into steelworks for the production of methane and methanol as an efficient way to decarbonize the steel industry. Three case studies that utilize a mixture of steelworks off-gases (blast furnace gas, coke oven gas, and basic oxygen furnace gas), which differ on the amount of used off-gases as well as on the end product (methane and/or methanol), are analyzed and evaluated in terms of their economic performance. The most influential cost factors are identified and sensitivity analyses are conducted for different operating and economic parameters. Renewable hydrogen produced by PEM electrolysis is the most expensive component in this scheme and responsible for over 80% of the total costs. Progress in the hydrogen economy (lower electrolyzer capital costs, improved electrolyzer efficiency, and lower electricity prices) is necessary to establish this technology in the future.
1. Introduction
The iron and steel industry is among the industrial sectors with the highest production volumes, having indispensable end-products for modern society [1]. It is, however, one of the most energy- and carbon-intensive industrial sectors, accounting for 27% of the total industrial CO2 emissions and 4–5% of the total anthropogenic CO2 emissions [2]. The usage of fossil raw materials is inextricably linked to steelworks operations, which are used in several points within the plant such as in the blast furnace and coke oven. The global steel demand and production is expected to grow multi-fold until 2060 [3]; therefore, decarbonization technologies must be adopted to cut carbon emissions and achieve the targets set by the Paris Agreement [4]. The global leaders in steel production are currently investigating and developing processes to almost completely de-fossilize their conventional steelmaking processes. There are two main approaches which, in their full deployment, both require large amounts of renewable hydrogen [5,6]. The first approach requires the development of new production processes and differ from the current processes which are already exhaustively optimized. Focus is given on the substitution of coke with renewable hydrogen as a reducing agent in the blast furnace or other steel operations [5]. This approach could prove useful in reducing GHG emissions and is centered around the usage of renewable hydrogen and renewable electricity. This approach requires enormous amounts of subsidies, extensive infrastructure modification, as well as large amounts of electricity [4]. The second approach, which is investigated in this work, is to fully convert steelworks off-gases to useful products such as methane and methanol (MeOH), again using large amounts of renewable hydrogen [7,8]. In contrast to the first approach, there is no deviation from the existing steel production routes. In addition, the production of methane and methanol from carbon sources is already deployed in large-scale facilities [9].
Steelworks off-gases such as the blast furnace gas (BFG), coke oven gas (COG), and basic oxygen furnace gas (BOFG) are generated during several steps of steel production and are used internally in steelworks operations or power production applications. The surplus of those gases is stored in gasholders and, in many cases, flared with detrimental environmental consequences. This approach uses this surplus to produce useful chemicals that have a significant market value (methanol) or can be used internally for power/heat generation (methane). The advantages of this approach are multi-fold since the external purchase of fossil-based methane is avoided; methanol is sold externally to generate additional revenues; and, simultaneously, an environmental problem is tackled [7]. To achieve the required stoichiometries for methanol synthesis and methanation, additional hydrogen is required, since the contained hydrogen in those off-gases is not sufficient for the synthesis processes [8].
The concept of using steelworks off-gases for the production of methanol and methane is investigated in a variety of published works. Nevertheless, these are works performed in different contexts, related to different countries, and most importantly considered different technologies and types of off-gases. An effort is presented in Table 1 to compare and highlight the differences of the existing published works. The average reported costs of those works are converted to 2022 EUR values and illustrated in Figure 1. There is a difference in the reported methanol production costs which is associated with the included processes, the different hydrogen and carbon sources as well as to the studied region of the publications. Due to the large content of hydrogen and the lower content of inerts, the majority of the publications use coke oven gas as the main feedstock [10,11,12,13] and/or in mixtures with other steelworks off-gases [14,15,16,17,18,19,20]. In most cases, hydrogen is derived from the coke oven gas itself, either through recovery by pressure swing adsorption [13,14,15,18,19] or by reforming of the COG [10,11,12,16]. Only certain publications specify if the gaseous feedstock undergoes cleaning and/or if gas cleaning is included in the production cost estimation [10,13,16,20]. The large number of recent publications indicate the increased interest in utilizing steelworks off-gases as a feedstock to produce methanol and simultaneously tackle an environmental issue. Finally, the majority of the publications are focused on the region of Asia, which is the largest steel-producing region in the world [10,11,12,14,17,18,19]. The work conducted by Kim et al. [21] reports higher costs than the rest, since it uses solely blast furnace gas as the main carbon source (which contains higher inert components), investigates different hydrogen production techniques that further raise the costs, and focusses on the US region.

Table 1.
Literature review of steelworks off-gases to methanol techno-economic analysis works.
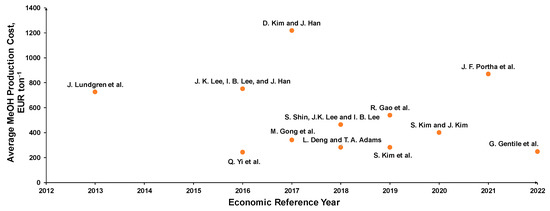
Figure 1.
Literature review on average production costs of methanol synthesis from steelworks off-gases [10,11,12,13,14,15,16,17,18,19,20,21].
Regarding the methanation of steelworks off-gases, few previous studies have been published. Yi et al. [22] investigated the usage of coke oven gas and coal gasification syngas for the production of methane, with COG as the main hydrogen source, whereas Man et al. [23] used COG as the main carbon and hydrogen source for methanation. Both publications are focused on the country of China. The work conducted by Rosenfeld et al. [24], which uses a steelworks off-gases mixture combined with a biomass gasification plant for methanation with the addition of renewable hydrogen by electrolysis, is also worthy of mention.
Based on the conducted literature review, the current work presents a scheme of utilizing steelworks off-gases that has not been previously investigated. In particular, all three steelworks off-gases (coke oven gas, blast furnace gas, and basic oxygen furnace gas) are used for the simultaneous production of methane and methanol. A gas-cleaning scheme of the off-gases is included in the cost calculations, whereas hydrogen addition is conducted by PEM electrolysis. Special cases are presented that refer to different utilization rates of the steelworks off-gases and are of particular interest to the European steel industry, which is the second largest steel-producing region and has to comply with the strict environmental regulations set by the European Union. The most influential factors on the production costs and sensitivity analyses for different operating and economic parameters are presented. To our knowledge, no previous techno-economic analysis-related work has been published that presents those characteristics and findings in those topics.
This publication is organized as follows. Section 2 describes the steelworks off-gases and case studies that are investigated in this work. Section 3 shows the processes that are included in the overall scheme and considerations that are taken into account for the economic analysis. Section 4 describes the costing methodology, the equipment costing data, and assumptions that are used to conduct the costing analysis. Section 5 shows the economic analysis results of the three case studies, the most influential factors on production costs, as well as sensitivity analyses for different operating and economic parameters. Finally, Section 6 shows the conclusions of this study and hints for future work.
2. Case Study Overview
The scope of this study is the economic analysis of integrating renewable hydrogen into steelworks off-gases for the production of methane and methanol. Three available steelworks off-gases (blast furnace gas, basic oxygen furnace gas, and coke oven gas) are used for this purpose. Their composition and the total amount available for a steel plant producing 6 MT steel per year are shown in Table 2 [25].
Table 2.
Mean composition of steelworks off-gases (data from [25]).
The BFG contains large amounts of nitrogen, due to the usage of hot air as an oxidant in the blast furnace. The contained CO and CO2 are used as the feedstock for the production of chemicals, whereas hydrogen is contained in low amounts; hydrogen addition is required for the synthesis [26]. The coke oven gas is generated in the coking plant during the heating of coal to produce coke and contains large amounts of hydrogen. In several works, COG serves as the main hydrogen source for the synthesis or can be used in the power plant for power generation [27]. The BOFG is generated in the basic oxygen furnace, where oxygen is injected to oxidize part of the carbon in the pig iron produced from the blast furnace; the contained CO and CO2 are used as feedstocks for the synthesis [25]. It is assumed that after the initial cleaning in the steel plant, the off-gases are water-saturated. This water should be removed prior to compression to avoid condensation that could damage the compressors [25] and avoid the promotion of the water–gas shift (WGS) reaction that could lead to the consumption of CO for the formation of additional CO2 [28].
The total amount of generated off-gases within the plant can be seen in Table 2, and illustrates that the BFG is produced in larger amounts in the steel plant compared to the other two gases. Those off-gases have several uses within the plant, mostly for heating and electricity production. It is assumed that approximately 50% of the total generated amounts are available for the synthesis of methanol and methane, after the rest is utilized in applications within the plant [7,29].
In this work, three case studies are evaluated that differ on the utilization of different amounts of steelworks off-gases and on the end-product (methane and/or methanol). Those case studies are of particular interest to the steel industry and refer to the short- and medium-term deployment horizon of this technology, with the final aim to move towards the decarbonization of the steel industry [7].
Figure 2, Figure 3 and Figure 4 present the different flowrates and utilization factors of the steelworks off-gases for the production of methane and methanol. The three case studies are as follows.
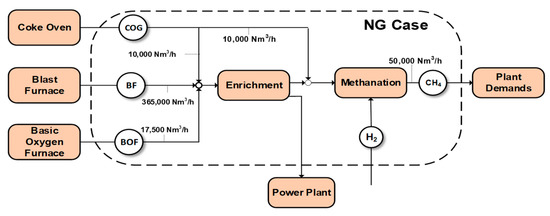
Figure 2.
The NG case: replacement of natural gas demands of the steel plant.
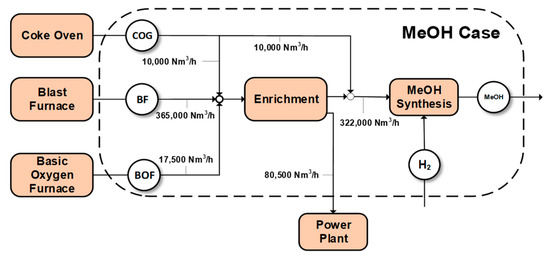
Figure 3.
The MeOH case: methanol synthesis of 80% of the available off-gases.
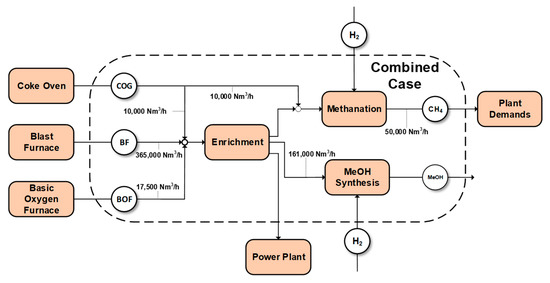
Figure 4.
The combined case: replacement of natural gas demands and methanol synthesis.
- The natural gas (NG) replacement case. Methanation of specific amounts of the by-product gases to replace the natural gas demands of the plant and the remaining fraction is used in the power plant. Before the methanation process, the enrichment step serves as a mixing/upgrading process before entering the power plant [29]. This case investigates the possibility of valorizing the steelworks off-gases for the replacement of the internal steelworks needs of natural gas by assuming an overestimated case of approximately 50,000 Nm3/h internal natural gas demands for a 6 MT/year steel plant [30].
- The MeOH synthesis case. Methanol synthesis of 80% of the available by-product gases and the remaining fraction is used in the power plant. Before the synthesis process, the enrichment step serves as a mixing/upgrading process before entering the power plant. A part of the COG is dispatched directly to methane synthesis, due to its higher hydrogen content compared to the other gases.
- The combined case: Methanation of specific amounts of by-product gases is used for the production of significant quantities of methane in order to replace the natural gas demands of the plant and 50% of the quantity used in the MeOH synthesis case is used for MeOH synthesis (only the remaining by-product gases are used in the power plant). This case presents the most integrated valorization scheme of the off-gases for the simultaneous production of methane and methanol.
The case studies are investigated using flowsheet simulations in AspenPlusTM and indicative stream results of the case studies can be found in Table A1, Table A2, Table A3 and Table A4. Table A5, Table A6 and Table A7 in Appendix A present an overview of the key results of the case studies that refer to methanation conducted at P = 5 bar, T = 250 °C, and different hydrogen stoichiometries, as well as for methanol synthesis: S.N. = 1.9, P = 70 bar, T = 250 °C, and different recycling ratios and hydrogen stoichiometries. A detailed overview of those case studies, the modelling methodologies, and assumptions can be found in a previous publication by the authors [7].
3. Process Description and Cost Estimation Assumptions
A preceding step in a techno-economic analysis is used to define the subsystems that are included in the overall scheme. The borders of each system must be determined, as well as the items and equipment which are included in each one. Figure 5 schematically shows the overall scheme and the borders of each process system.

Figure 5.
Integration of synthesis units into steelworks.
After their generation in the steel plant, the steelworks off-gases are cleaned and stored in gas holders. If those gases are used in the synthesis units, additional gas cleaning is required to protect the synthesis catalysts. After an ad hoc cleaning procedure for the removal of the unwanted impurities, the gases are compressed to a certain pressure. Methanation is conducted at low pressures (1–10 bar) and therefore one compression step is required, whereas three compression stages are required for methanol synthesis since MeOH synthesis is conducted at higher pressures (50–100 bar). After compression, the gases are fed either to the methanol synthesis or methanation units. Renewable hydrogen produced by PEM electrolysis is added to reach the required stoichiometric number for the methanol synthesis and/or methanation. Overall, the proposed scheme comprises the following subsystems: steelworks and modifications to the existing plant, gas cleaning, feedstock compression, methanation, methanol synthesis, and electrolysis. The subsequent subsections describe each of those processes in more detail, the equipment that is included, as well as the economic data and assumptions that are used in the economic analysis. The used models, to which the economic analysis was based, have been developed and presented in two previous publications by the authors [7,8]. The key results of the case studies can be found in Appendix A.
3.1. Steelworks: Pipelines and Existing Gas-Cleaning Scheme
The steelworks off-gases after their generation in the steel plant are cleaned and then stored in gas holders before being further used for power generation or in applications within the steel plant. A typical gas-cleaning scheme of a steel plant involves steps such as dust removal, cooling, scrubbing (for ammonia and benzene–toluene–xylene (BTX) removal), and demistering [27,31]. To transport the off-gases from the gas holders and enrichment sections to the synthesis units, pipelines are required since the synthesis units cannot be placed next to steelworks operations due to space and safety issues. Due to space problems in some steel mills, the pipelines cannot be built underground and for this reason, bridges should be constructed. In this work, a 500 m distance is assumed from the steelworks off-gases storage to the gas-cleaning unit. The capital costs of a pipeline are based on the diameter of the pipelines, which in consequence depends on the volumetric flowrate and flow characteristics of the gases [32].
3.2. Gas Cleaning
To protect the synthesis catalysts from potential impurities that escaped from the existing gas-cleaning scheme of the steelworks plant, a series of gas-cleaning beds is placed before entering the synthesis units. Those include processes for the removal of the contained dust, halogens, sulfur compounds, heavy metals, and moisture. The proposed gas-cleaning scheme is shown in Figure 6. An economic evaluation of the gas-cleaning setup is based on the throughput of the steelworks off-gases and the design is based on thermodynamic calculations in AspenPlusTM. More details on the gas-cleaning process and the occurring reactions can be found here [7].
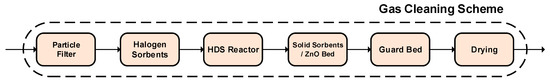
Figure 6.
The gas-cleaning scheme.
To calculate the required size of equipment, the required amount of catalysts/sorbents, possible by-products, required utilities, and respective costs, the following composition in the total steelworks off-gases is assumed (Table 3) [29].
Table 3.
Assumed impurities in the steelworks off-gases for the cost estimation.
For the combined case based on the assumed composition, the produced water from the gas-cleaning unit is approximately <0.01% w/w of the feedstock that is used in the synthesis units and therefore would not pose any threat to the subsequent compression unit and synthesis catalysts.
3.3. Compression
The steelworks off-gases require compression before their utilization in the methanation and methanol synthesis units. Methanation is usually conducted at low pressures (1–10 bar) whereas methanol synthesis is conducted at higher pressures (50–100 bar). In this work, the base-case pressure is 5 bar for methanation and 70 bar for methanol synthesis. The pressure ratio between the inlet and the outlet of the compressor is recommended to be kept under ~4 to avoid any damages that could occur in the compression equipment [33]. Therefore, for higher outlet pressures, a series of compression steps must be employed to achieve the final operating pressure. One stage is required for methanation, whereas three compression stages are required for methanol synthesis.
A special case is investigated for the combined case, where it is assumed that the steelworks off-gases are compressed in three stages instead of four. In other words, one step is used to compress the steelworks off-gases to 5 bar, and the feedstock for methanation and methanol synthesis is separated, and then two more stages to are used compress the gases in methanol synthesis, instead of four compression stages (one to compress the gases to methanation and three to compress to methanol synthesis pressure). Table 4 presents a comparison of those two options for the combined case.
Table 4.
Comparison of 3 and 4 stages for steelworks feedstock compression.
Based on the above table, the three-stage compression concept results in significant cost reductions: 8.9% less equipment costs as well as 3.4% less electricity costs per year. Therefore, for the combined case, the three-stage compression concept is applied.
3.4. Methanation
Syngas methanation is an exothermic process used to produce substitute natural gas (SNG) from CO and CO2 with the addition of H2. Simplicity and high efficiency of the process are crucial parameters for the establishment of this technology for the production of methane from waste feedstocks such as biomass [34,35] or steelworks off-gases [27,36]. During methanation, the main occurring reactions are:
CO + 3H2 → CH4 + H2O ΔH0 = −206 kJ/molCO
CO2 + 4H2 → CH4 + 2H2O ΔH0 = −165 kJ/molCO2
CO2 + H2 → CO + H2O ΔH0 = +41 kJ/molCO2
Based on experimental results, the reaction mechanism is assumed to consist of a more complex reaction network, taking provision for the formation of solid carbon through the Boudouard reaction [37,38]. The methanation process is usually conducted at low pressures (<10 bar) with nickel-based catalysts as the main employed catalysts. The operating temperature is a crucial factor for catalyst lifetime and efficiency and could vary between 200 °C and 600 °C [36,38]. The stoichiometric number (SN) for methanation expresses the ratio between the added hydrogen and the carbonaceous components of the feed mixture and is expressed in molar flowrates: [6]. A conventional methanation system includes equipment such as heat exchangers, compressors to pressurize the feedstock, a methanation reactor, and a flash drum to separate the gaseous products from the formed water (Figure 7). In this work, the compressors are estimated separately. The methanation process is modelled in AspenPlusTM using thermodynamic approaches with the Soave–Redlich–Kwong equation of state (SRK) as the property estimation model; more details on the modelling methodology, assumptions, and underlying equations can be found here [7]. Methanation usually results on high conversion rates, leaving the minimum unreacted hydrogen and carbonaceous components. To calculate the catalyst mass required for methanation, a GHSV value of 4000 h−1 is assumed per methanation reactor with a catalyst lifetime of one year [36].
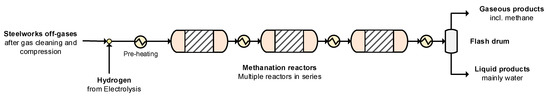
Figure 7.
Methanation process flowsheet.
3.5. Methanol Synthesis
Methanol can be produced from syngas that is derived from a variety of sources, such as process off-gases [7,39], biogas [40], biomass [41,42], coal [22], and natural gas [43,44]. Methanol synthesis is based on the CO and CO2 hydrogenation reactions that can be combined to form the reverse water–gas shift (RWGS) reaction [7]:
CO + 2H2 → CH3OH ΔH0 = −90 kJ/molCO
CO2 + 3H2 → CH3OH + H2O ΔH0 = −49 kJ/molCO2
CO2 + H2 → CO + H2O ΔH0 =+41 kJ/molCO2
Although low temperatures are thermodynamically favorable, MeOH synthesis is usually conducted at temperatures between 200 and 300 °C, due to the activation of the copper-based catalyst at this temperature range. At higher synthesis temperatures, sintering could occur, resulting in higher catalyst deactivation rates [45]. The operating pressure is between 50 and 100 bar [46]. The methanol synthesis reaction is characterized by the stoichiometric number where [H2], [CO], and [CO2] refer to the molar flows of the feed components: [7]. A value of refers to a stoichiometric correlation between the components [45]. Methanol synthesis results in conversion close to the thermodynamic equilibrium; thus, any additional carbon and hydrogen are not consumed and remain unexploited. Therefore, methanol synthesis is conducted in a loop that takes advantage of separating and reusing the unreacted gases in the synthesis reactor [39]. A conventional methanol synthesis loop includes equipment such as compressors, heat exchangers, flash and steam drums, reactors, as well as distillation columns to further purify the methanol product (Figure 8). The methanol synthesis process is modelled using thermodynamic approaches in AspenPlusTM with the Soave–Redlich–Kwong equation of state (SRK) as the property estimation model. A presentation of the different methanol synthesis modelling methodologies, critical assumptions, as well as the results to which the economic evaluation was based can be found in Appendix A and in a previous publication by the authors [7]. The costs of the methanol synthesis reactor can differ based on the different types of methanol synthesis, i.e., gas-phase investment costs differ from liquid-phase synthesis [47]. To calculate the total catalyst per reactor, a GHSV of 5.5 m3 kgcat−1 h−1 is assumed in the methanol synthesis reactor [14] with a catalyst lifetime of one year [16].
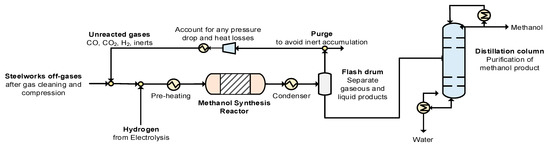
Figure 8.
Methanol synthesis process flowsheet.
3.6. Electrolysis
In the water electrolysis process, water is split into oxygen and hydrogen through the application of electrical energy. The three main electrolysis technologies are: proton exchange membrane (PEM), alkaline (AEL), and solid oxide electrolysis (SOEC). AEL is a mature technology and employed in commercial applications [48] but is sensitive to fluctuations in the power supply (voltage and current) [49,50]. PEM and SOEC electrolyzers are considered as the most suitable technologies to produce green hydrogen and are not sensitive to the fluctuations of renewable energy sources, such as wind or solar energy [8]. In this work, PEM electrolysis is employed as a hydrogen production technology. Apart from the electrolyzer stack, a hydrogen production plant consists of additional peripheral equipment (balance-of-plant) that provides secondary functions to the system. Those are equipment for the power supply, a deionized water circulation system, hydrogen processing equipment, and cooling equipment that must also be included in the cost estimation (Figure 9) [51]. The electrolysis system is based on the costs and methodology described in [51]. The PEM electrolysis model used to estimate the power requirements of the process is based on a previous publication by the authors that includes all relevant aspects for the modelling of such systems [8]. For the estimation of the electrolysis costs, the following values are used: highly pure hydrogen product >99.9%, a specific power consumption of 54.8 kWh/kg [8], and an outlet pressure of 30 bar [52].
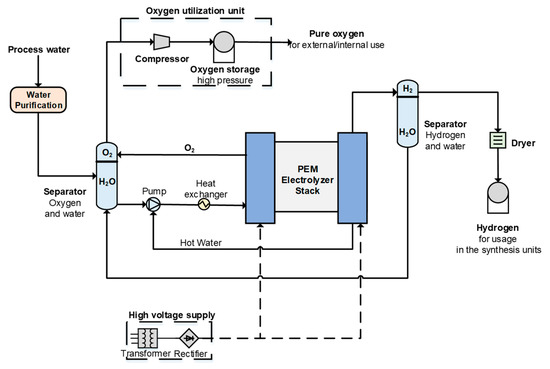
Figure 9.
Water electrolysis process flowsheet.
Apart from hydrogen, large amounts of oxygen are produced; for every 1 kg of hydrogen, approximately 8 kg of oxygen is produced. This oxygen can be stored and used in applications within the plant (such as in the blast furnace, the basic oxygen furnace, or the power plant) or sold externally to generate additional revenue and decrease the production cost of the main products. If oxygen is used for internal applications, additional modifications in the existing plant have to be taken into consideration (modifications of existing processes, pipelines for transportation, etc.). Potential external users could be industrial users (pulp and paper, chemicals, refineries, or mining) or, on a lower scale, glass industries and hospitals [53]. In this case, it is assumed that oxygen is sold externally to generate additional revenue. The required specifications and purity of the used oxygen differ on the end-user and consequently the price; a price of EUR 50 t−1 is assumed as the mean price of the sold oxygen [54]. An oxygen utilization unit is also included in the cost calculations to utilize the side-stream oxygen that is produced by electrolysis. The oxygen utilization unit comprises a compressor to compress the oxygen at storage pressure (150 bar) and an oxygen tank to store the produced oxygen for a day [55].
4. Cost Estimation Methodology and Procedure
For the estimation of the total production costs of each case, the capital and operating expenses of the proposed scheme are calculated. The capital costs of the infrastructure needed to build the plant are classified into direct and indirect costs. Direct costs include the: equipment purchase and installation costs, piping, electrical systems, and instrumentations, as well as additional buildings and land/site improvements. The indirect costs include the engineering and supervision, construction/contractor expenses, legal expenses, and contingencies if unexpected events occur. The sum of the total direct and indirect costs refers to the fixed capital investment (FCI) and an additional 10% of the FCI is assumed to make up the working capital required to run the plant for the first operations. The sum of the working capital and the fixed capital investment is the total capital investment. Table 5 shows the factorial estimates for the calculation of the total capital investment for the synthesis plant, which are based on the purchased and delivered equipment costs [56]. The assumed factor values can be modified according to the studied case and the type of processes.
Table 5.
Total capital investment estimation.
Based on the size of the reference equipment, the equipment costs should be upscaled or downsized, which is carried out using an appropriate scaling factor: , where Size_Ref and Size_Act are the capacities of the reference and the actual system, respectively; Cost_Ref and Cost_Act are the costs of the reference and the actual system; and n is the scaling factor. A simple but critical assumption is that the equipment design and unit performance do not change with the different scales. An additional 10% is included in the equipment costs to account for additional required power/heat and peripheral equipment. Table 6 shows the equipment costs used for the economic analysis.
Table 6.
Equipment cost data.
In contrast to the capital expenses which are one-time expenses and are reduced over the entire plant life (using the discount rate and the capital recovery factor), the operational expenses are calculated on a yearly basis. Operational expenses include the price of the feedstock (in this case, residual sources from the steel industry are used) and utilities (such as electricity, catalysts, process water, waste, and wastewater disposal). Additional operational fixed costs are the insurance and taxes, overheads, and maintenance. Table 7 shows the used mean prices of the operational expenses on a 2020 EUR basis. Table 8 shows the economic assumptions that are used for economic evaluation.
Table 7.
Operational expenses for the base-case conditions.
Table 8.
Economic assumptions.
5. Results
This section presents the economic evaluation of the three case studies that are shown in Section 2:
- The NG case: replacement of natural gas requirements;
- The MeOH case: methanol synthesis of gases to the power plant;
- The combined case: replacement of natural gas requirements and methanol synthesis.
Across the three case studies, the total capital investment and operating costs are calculated, as well as the production cost per mass (kg), volume (m3), and/or energy content (GJ) of the product. For the combined case, the total production costs are evaluated in terms of the total energy content of the products (energy content of methanol and methane). The total production costs are broken down to the respective cost components and analyzed to identify the most influential cost factors. In addition, sensitivity analyses are conducted on several operating parameters (hydrogen excess and recycling ratio), operational costs (electricity, utilities, labor, maintenance, etc.), as well as capital expenses in order to investigate their influence on the total production costs of each case study.
5.1. The NG Case: Replacement of Natural Gas Demands
The NG case uses the steelworks off-gases to replace the existing natural gas needs of the plant (50,000 Nm3/h). The impacts of the different capital and operating expenses, as well as the electricity price, on the natural gas production costs per m3 are shown in Figure 10. Since methane is the only product, 100% of the output energetic content is attributed to methane. For the base-case conditions, 2.5% of the production cost is associated with the methanation of capital expenses (reactors, heat exchangers, and flash drum), and compression is responsible for 1% of the total production cost. Electrolysis is the most influential CAPEX component, contributing 17.3%, whereas the rest of the CAPEX components (pipelines, gas cleaning, heat-related equipment, and oxygen storage) is responsible for 0.5% of the production costs. The methanation production scheme is strongly influenced by the operational expenses. Approximately 79% of the total production costs are associated with the OPEX and the remaining 21% is attributed to the CAPEX. The utilities (process water, catalysts, gas-cleaning sorbents, etc.), excluding electricity, are responsible for 0.5%, whereas labor, insurance and taxes, overhead labor costs, and maintenance are responsible for 4.5% of the total costs. In the figure, utilities and the rest of the OPEX are depicted as “Other OPEX and utilities”. The sale of the oxygen by-product from electrolysis contributes to 7–10% cost reductions; therefore, for the subsequent cases and results, it is included in the cost calculations. Special attention should be paid to the oxygen market and its ability to absorb the produced oxygen; due to its high purity, it is assumed that it is sold completely at EUR 50 t−1. Finally, electricity cost is the most influential factor on the overall production costs and the methane production scheme is dependent on its cost and volatility. For instance, a cheap electricity price (EUR 10–30 ΜWh−1) can lower the price of methane to competitive levels (EUR 0.311–0.599 m−3), whereas higher electricity prices (EUR 50–80 ΜWh−1) can significantly increase the costs (EUR 0.888–1.320 m−3).
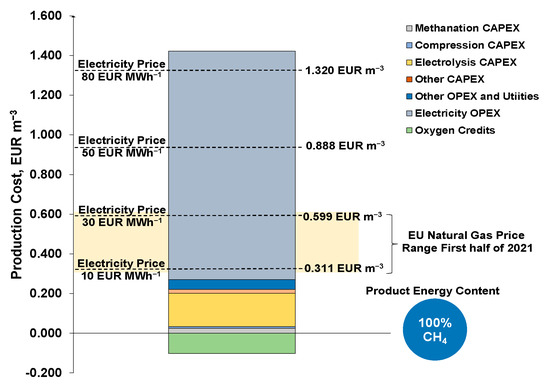
Figure 10.
Methane production cost breakdown and effect of electricity price of the NG case.
The results shown above refer to the base-case economic conditions and equipment costs shown in Section 4. Apart from the electricity price, sensitivity analysis is conducted on the rest of the cost components to analyze their influence on the natural gas production costs. Figure 11 shows the variation of certain economic parameters (while the rest of the cost components are kept constant) to illustrate their influence on the production costs. When operating at 10% hydrogen excess during methanation, the final production cost could increase by 7.8%. Variations in the costs of different components and/or the usage of different cost equipment data can also influence the final results. In terms of the electrolysis section, significant technological progress is expected to occur in the following years that could further increase the electrolyzer system efficiency and reduce the associated capital and operating expenses [66]. Assuming that the electrolyzer system efficiency substantially improves from 54.8 kWh/kg to 40 kWh/kg in the future, a 26.9% decrease in the production costs can be expected. In addition, assuming that electrolysis CAPEX reduces by 50%, an 11.1% cost decrease can be expected, whereas a 50% increase could increase the cost by the same percentage. A 50% deviation of the methanation and compressor price could change the price by ±1.8% and ±0.7%, respectively. The rest of the CAPEX and the cost of utilities could influence the price to a lower extent (±0.1% and ±0.3%) and the other OPEX (labor, insurance and taxes, overhead labor costs, and maintenance) could influence the price by ±2.5%. Finally, the oxygen selling price affects the revenues of by-product oxygen sales and can reduce production costs by 11.5%, if the oxygen market price increases to EUR 100 t−1, if the price increases by 6.9%, and if the market price decreases to EUR 20 t−1, compared to the base-case price.
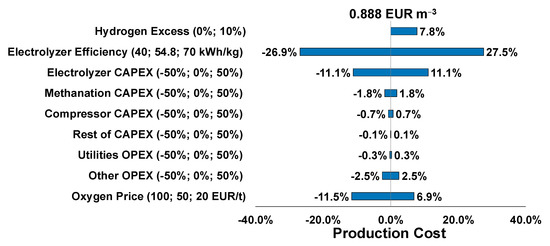
Figure 11.
Sensitivity analysis of different cost components of the NG case.
5.2. The MeOH Case: Methanol Synthesis of Gases to Power Plant
The MeOH case utilizes the amount of steelworks off-gases that is previously used in the power plant for methanol synthesis (322,000 Nm3/h). Figure 12 and Figure 13 show the influence of the operating stoichiometric number and recycling on the methanol production costs for the base-case conditions. The lower the stoichiometric number, the lower the production costs of methanol. Compared to the base case of S.N. = 1.9, operating at S.N. = 1.7 could result in 3.2% lower production costs, whereas operating at above-stoichiometric conditions (S.N. = 2.1) could lead to 3.3% higher production costs. However, unless no other provision for the unreacted gases is taken into consideration that could further lower the expenses, the once-through methanol costs are much higher compared to the market price of methanol in Europe (methanol contract price [67]).
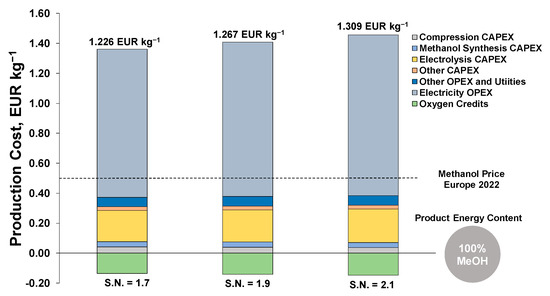
Figure 12.
Effect of the stoichiometric number on methanol production costs in the MeOH case.
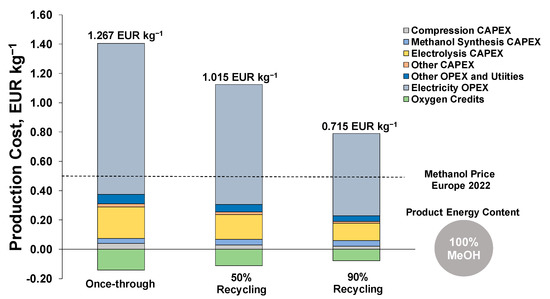
Figure 13.
Effect of recycling on methanol production costs in the MeOH case.
Operating in a loop where the unreacted gases are recycled to the reactor could decrease the methanol production costs. Furthermore, 50% recycling of the unreacted off-gases could decrease the production costs by 19.9% and 90% recycling by 43.6%, resulting in significant cost reductions per produced methanol unit (Figure 13).
For the base-case conditions with 90% recycling, Figure 14 shows a breakdown of the production costs and the influence of the varying electricity price. For the base-case conditions, 5% of the production cost is associated with the methanol capital expenses (reactors, heat exchangers, flash drum, and distillation), whereas compression is responsible for 2.6% of the total production costs. Electrolysis is again the most influential CAPEX component, contributing 14.8%, and the rest of the CAPEX components are responsible for 0.8% of the production costs. The operational expenses are responsible for 74% of the total production costs and the rest is associated with the capital expenses. The utilities excluding electricity are responsible for 0.6%, whereas labor, insurance and taxes, overhead labor costs, and maintenance are responsible for 4.3% of the total costs. The sale of the oxygen by-product from electrolysis reduces the final methanol production cost by approximately 10%. Again, the electricity cost is the most influential factor on total production costs. Cheap electricity prices (EUR 10–30 ΜWh−1) can lower the price of methanol production costs to a range between EUR 0.266 and 0.491 kg−1, whereas higher electricity prices (EUR 50–80 ΜWh−1) can significantly increase the costs to EUR 0.715–1.051 kg−1. Overall, hydrogen is the most expensive component in this scheme since approximately 85% of the total costs are associated with hydrogen production (electrolysis CAPEX, electricity for hydrogen production, process water, etc.).
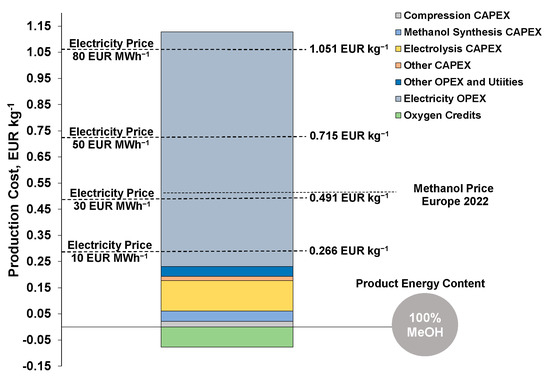
Figure 14.
Methanol production costs breakdown and effect of electricity price in the MeOH case.
In Figure 15, sensitivity analysis is conducted to show the influence of several cost components on the total production cost. An improvement in the electrolyzer system efficiency to 40 kWh/kg could decrease the costs by 24.9%, whereas a system efficiency of 70 kWh/kg could increase the costs by 25.5%. In addition, assuming that electrolysis CAPEX is varied by ±50%, a ±9.6% cost decrease/increase can be expected. A 50% decrease/increase in the methanol synthesis and compressor costs could increase/decrease the methanol production cost by 3.0% and 1.8%, respectively. The rest of the CAPEX and the cost of utilities influence the price to a lower percent (<0.1% and 0.4%, respectively), where the rest of the OPEX (labor, insurance and taxes, overhead labor costs, and maintenance) could adjust the price by ±2.4%. Finally, the oxygen selling price could reduce the price by 10.8% if the oxygen market price increases to EUR 100 t−1, if the price increases by 6.5%, and if the oxygen market price decreases to EUR 20 t−1.
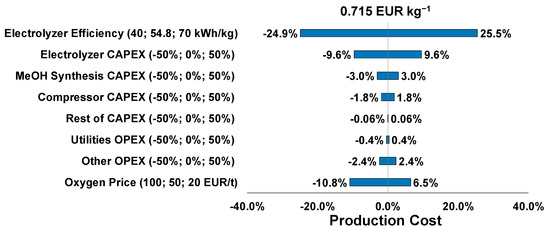
Figure 15.
Sensitivity analysis of different cost components in the MeOH case.
5.3. The Combined Case: Replacement of NG Requirements and MeOH Synthesis
The combined case refers to the simultaneous replacement of the natural gas demands of the plant and the production of significant quantities of methanol. The methanation section of the combined case is identical to the NG case since the same amount of methane is produced, whereas a lower amount of steelworks off-gases is used for methanol synthesis compared to the MeOH case (161,000 compared to 322,000 Nm3/h). Since two different products are the output of the case study, the production costs are evaluated in terms of the combined energetic content of the products (GJ). The simultaneous production of methane and methanol could benefit from synergetic phenomena and shared equipment used in both processes. Examples are the compression and electrolysis units that are common for both methanation and methanol synthesis and can benefit from the economies-of-scale.
In a similar manner to the MeOH case, Figure 16 shows the effect of the stoichiometric number to the overall costs per produced GJ. The pies under each bar show the energy contents of each product compared to the total output. A higher stoichiometric number results in 2.6% higher costs, whereas a lower stoichiometric number (S.N. = 1.7) led to 2.6% cost reductions, compared to the base case of S.N. = 1.9 with a cost of 38.4 EUR/GJ. Across the different stoichiometric numbers, approximately 30–32% of the total energy content is attributed to methanol and 68–70% to methane.
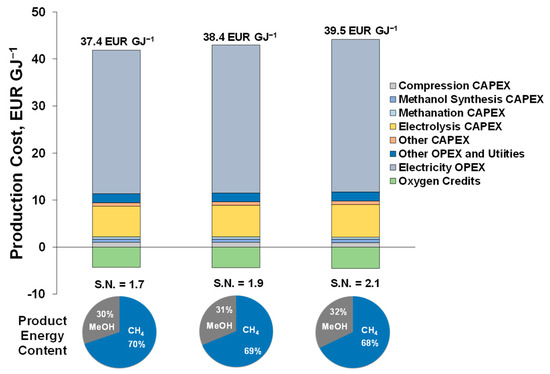
Figure 16.
Effect of the stoichiometric number on total production costs in the combined case.
Similarly, Figure 17 shows the effect of recycling on the overall costs per produced GJ. Evidently, 50% and 90% recycling of the methanol synthesis off-gases results in reductions of 6.5% and 18.5% in the total production costs, respectively. For the 50% recycling case, 37% of the product energy content is attributed to methanol and 63% to methane, whereas for the 90% recycling case, 47% is attributed to methanol and 53% to methane.
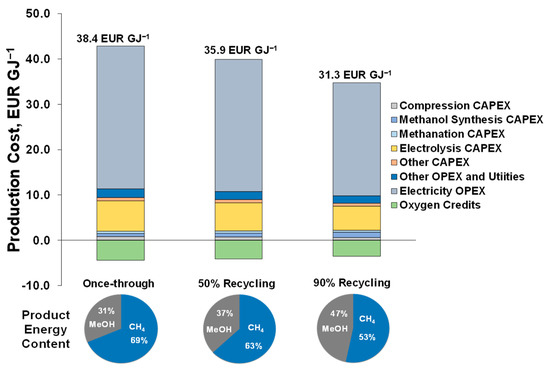
Figure 17.
Effect of recycling on total production costs of the combined case.
Figure 18 shows a breakdown of the total production costs expressed per GJ for 90% recycling during methanol synthesis. For the base-case conditions, 3.4% of the total costs are associated with methanol synthesis, 1.2% with methanation, and 1.9% with the compression capital expenses. Electrolysis is responsible for 15.3% of the total production costs. The utilities excluding electricity are responsible for 0.6%, whereas labor, insurance and taxes, overhead labor costs, and maintenance are responsible for 4.1% of the total costs. Selling oxygen by-products contributes to a 10% reduction in the production costs. Electricity is again a decisive factor in this production scheme that could lower the costs to EUR 11.3–21.3 GJ−1 for electricity prices of (EUR 10–30 ΜWh−1) and increase the expenses to EUR 31.3–46.2 GJ−1 for higher electricity prices (EUR 50–80 ΜWh−1). Overall, the OPEX is responsible for 77% of the total production costs for the base-case conditions.
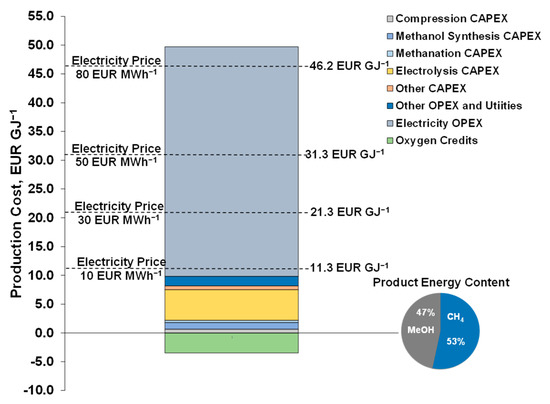
Figure 18.
Production cost breakdown and effect of electricity price of the combined case.
Finally, sensitivity analysis is conducted on the rest of the CAPEX and operational expenses (Figure 19). Improving the electrolyzer system efficiency to 40 kWh/kg could decrease the costs by 25.8%, whereas an efficiency rate of 70 kWh/kg could increase the costs by 26.4%. A ±50% variation of the electrolysis CAPEX results in a ±10% production cost decrease/increase. A 50% decrease/increase in the methanol synthesis, methanation, and compressor costs could increase/decrease the production costs by 2.4%, 0.8%, and 1.3%, respectively. The rest of the CAPEX and the cost of utilities may also influence the price to a lower extent, where the rest of the OPEX could influence the price by ±2.3%. The oxygen selling price could reduce the price by 11.2% if the oxygen market price increases to EUR 100 t−1 and could increase the price by 6.7% if the market price decreases to EUR 20 t−1.
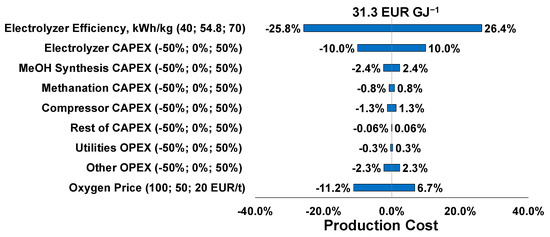
Figure 19.
Sensitivity analysis of different cost components of the combined case.
A comparison of the different production costs according to the energy content of the products for the three cases is shown in Figure 20 for different electricity prices. Due to the fact that the natural gas replacement case requires less hydrogen compared to the other cases, and also the fact that carbon feedstock and the added hydrogen are almost entirely converted to methane, the NG replacement case requires lower expenses compared to the other two cases. On the other hand, the methanol synthesis case is the most expensive case per produced energy unit due to the lower carbon conversion, higher hydrogen demands, and feed compression costs. The combined case has higher expenses than the NG replacement case but is less expensive than the MeOH synthesis case.
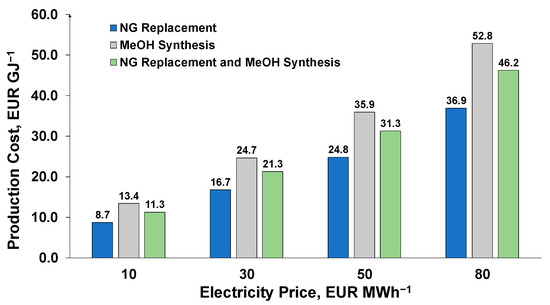
Figure 20.
Comparison of production costs for the three cases.
6. Conclusions
In this work, a detailed cost analysis of the integration of renewable hydrogen into steelworks off-gases for the synthesis of methane and methanol was conducted. Three case studies were investigated that are of particular interest to the steel industry and correspond to different utilization rates of steelworks off-gases for the synthesis of methane and/or methanol: (i) replacement of natural gas demands, (ii) methanol synthesis of 80% of the gases that were inserted in the power plant, and (iii) simultaneous methanol synthesis and replacement of natural gas demands. The new synthesis units that were integrated into steelworks comprise the following subsystems: pipelines for off-gases transportation, gas cleaning, compression, methanol synthesis, methanation, and electrolysis. An economic evaluation of the cases studies showed that the electricity price is the main factor influencing the production costs. The electrolysis capital expenses presented the highest capital expenses, whereas sensitivity analyses showed that the other capital expenses affect the production costs to a lower extent. The production costs were mainly attributed to the operational expenses (75–80%), whereas hydrogen production and handling were responsible for over 80% of the total production costs across the three case studies. For the methanol synthesis cases, operation in a recycling loop and at lower stoichiometric numbers resulted in lower production costs. Unless no other provision is considered for the unreacted gases from methanol synthesis, once-through operation results in higher production costs. Methanation achieves almost complete carbon and hydrogen conversion; operation at stoichiometric hydrogen conditions is preferred compared to over-stoichiometric conditions. Across the three case studies, the NG case results in lower production costs in energetic terms, followed by the combined case. Despite the fact that production costs of renewable methanol and methane surpassed the fossil-based alternatives and their respective market prices, progress in the hydrogen economy (lower electrolyzer capital costs, improved electrolyzer efficiency, and lower electricity prices) is necessary to establish this technology in the future.
Author Contributions
Conceptualization, M.B., K.P., S.H., A.S., P.R. and P.W.-Z.; methodology, M.B. and K.P.; software, M.B. and K.P.; validation, M.B., K.P., S.H., P.S., A.S., M.L., L.R., N.K., S.K., P.W.-Z., S.D., I.M., V.C. and P.R.; formal analysis, M.B., K.P., A.S., S.H. and P.W.-Z.; investigation, M.B., K.P., A.S., S.H. and P.W.-Z.; resources, K.P., S.H., P.S., A.S., M.L., N.K. and L.R.; data curation, M.B. and K.P.; writing—original draft preparation, M.B. and K.P.; writing—review and editing, M.B., K.P., S.H., P.S., A.S., M.L., L.R., N.K., S.K., P.W.-Z., S.D., I.M., V.C. and P.R.; visualization, M.B., K.P., S.H., P.S., A.S., M.L., L.R., N.K., S.K., P.W.-Z., S.D., I.M., V.C. and P.R.; supervision, K.P., S.H., P.S., A.S., M.L., N.K., V.C. and L.R.; project administration, K.P., S.H., A.S., M.L., N.K., V.C. and L.R.; funding acquisition, K.P., S.H., A.S., M.L., V.C., N.K. and L.R. All authors have read and agreed to the published version of the manuscript.
Funding
The work carried out was funded by the European Union through the Research Fund for Coal and Steel (RFCS), within the project entitled “i3upgrade: Integrated and intelligent upgrade of carbon sources through hydrogen addition for the steel industry” (grant agreement no. 800659). This paper reflects only the author’s view and the European Commission is not responsible for any use that may be made of the information contained therein.
Institutional Review Board Statement
Not applicable.
Informed Consent Statement
Not applicable.
Data Availability Statement
Not applicable.
Conflicts of Interest
The authors declare no conflict of interest.
Appendix A
Indicative process stream results are depicted in Table A1, Table A1 and Table A3, namely the steelworks off-gases feedstock, the added hydrogen, the reactor inlet and outlet of the methanol, and methane sections. Note that the depicted cases refer to methanation conducted at T = 250 °C, P = 5 bar, and stoichiometric H2, whereas for methanol synthesis T = 250 °C, P = 70 bar, S.N. = 1.7, and once-through conditions.
Table A1.
Stream results of the NG case.
Table A1.
Stream results of the NG case.
| Stream Name | Feed | H2 Feed | Reactor Inlet | Reactor Outlet |
|---|---|---|---|---|
| m, kg/s | 35.9 | 3.5 | 38.5 | 38.5 |
| T, °C | 25 | 150 | 150 | 250 |
| P, bar | 1 | 5 | 5 | 5 |
| Mole fraction, % | ||||
| H2 | 10.03 | 99.90 | 62.71 | 1.31 |
| N2 | 40.90 | - | 17.71 | 27.60 |
| CO2 | 19.26 | - | 8.34 | 0.52 |
| CO | 22.57 | - | 9.78 | Trace |
| CH4 | 2.45 | - | 1.06 | 29.37 |
| O2 | 0.56 | - | 0.24 | Trace |
| H2O | 4.00 | 0.10 | 0.06 | 41.05 |
| C2H6 | 0.22 | - | 0.10 | 0.15 |
| CH3OH | - | - | - | - |
Table A2.
Stream results of the MeOH case.
Table A2.
Stream results of the MeOH case.
| Stream Name | Feed | H2 Feed | Reactor Inlet | Reactor Outlet |
|---|---|---|---|---|
| m, kg/s | 106.5 | 6.6 | 114.8 | 114.8 |
| T, °C | 25 | 150 | 150 | 250 |
| P, bar | 1 | 70 | 70 | 70 |
| Mole fraction, % | ||||
| H2 | 6.85 | 99.90 | 51.67 | 40.25 |
| N2 | 43.1 | - | 23.34 | 28.47 |
| CO2 | 20.40 | - | 11.04 | 13.06 |
| CO | 23.74 | - | 12.85 | 5.30 |
| CH4 | 1.22 | - | 0.66 | 0.81 |
| O2 | 0.58 | - | 0.32 | trace |
| H2O | 4.00 | 0.10 | 0.05 | 1.24 |
| C2H6 | 0.11 | - | 0.06 | 0.07 |
| CH3OH | - | - | - | 10.80 |
Table A3.
Stream results of the combined case—MeOH synthesis.
Table A3.
Stream results of the combined case—MeOH synthesis.
| Stream Name | Feed | H2 Feed | Reactor Inlet | Reactor Outlet |
|---|---|---|---|---|
| m, kg/s | 54.4 | 3.5 | 56.5 | 56.5 |
| T, °C | 25 | 150 | 150 | 250 |
| P, bar | 1 | 70 | 70 | 4 |
| Mole fraction, % | ||||
| H2 | 5.13 | 99.90 | 51.90 | 40.55 |
| N2 | 44.29 | - | 23.42 | 28.58 |
| CO2 | 21.01 | - | 11.11 | 13.17 |
| CO | 24.37 | - | 12.88 | 5.29 |
| CH4 | 0.56 | - | 0.30 | 0.36 |
| O2 | 0.59 | - | 0.31 | trace |
| H2O | 4.00 | 0.10 | 0.05 | 1.21 |
| C2H6 | 0.05 | - | 0.03 | 0.03 |
| CH3OH | - | - | - | 10.81 |
Table A4.
Stream results of the combined case—methanation.
Table A4.
Stream results of the combined case—methanation.
| Stream Name | Feed | H2 Feed | Reactor Inlet | Reactor Outlet |
|---|---|---|---|---|
| m, kg/s | 35.9 | 3.5 | 38.5 | 38.50 |
| T, °C | 25 | 150 | 150 | 250 |
| P, bar | 1 | 5 | 5 | 5 |
| Mole fraction, % | ||||
| H2 | 10.03 | 99.90 | 62.71 | 1.31 |
| N2 | 40.90 | - | 17.71 | 27.60 |
| CO2 | 19.26 | - | 8.34 | 0.52 |
| CO | 22.57 | - | 9.78 | trace |
| CH4 | 2.45 | - | 1.06 | 29.37 |
| O2 | 0.56 | - | 0.24 | trace |
| H2O | 4.00 | 0.10 | 0.06 | 41.05 |
| C2H6 | 0.22 | - | 0.1 | 0.15 |
| CH3OH | - | - | - | - |
Table A5, Table A6 and Table A7 show the key results to which the economic analysis was based. The base-case results refer to methanation conducted at P = 5 bar, T = 250 °C, stoichiometric H2, and for methanol synthesis: S.N. = 1.9, P = 70 bar, T = 250 °C, and once-through. Sensitivity analyses are conducted on methanation for different added hydrogen and for methanol synthesis at different stoichiometric number and recycling ratios. A stoichiometric number of 1.9 is used for the different recycling ratios of methanol synthesis. The total compression requirements refer to the compression of the steelworks off-gases, compression for oxygen storage, and compression for recycling of the methanol synthesis off-gases (if applicable).
Table A5.
Key results of the NG case.
Table A5.
Key results of the NG case.
| Parameter | Hydrogen Excess | ||
|---|---|---|---|
| Stoichiometric | 5% | 10% | |
| Steelworks off-gases feedstock, kg/s | 35.9 | 35.3 | 35.3 |
| Total compression requirements, MW | 14.0 | 14.1 | 14.4 |
| Fresh hydrogen requirements, kg/s | 3.5 | 3.7 | 3.8 |
| Methane product, kg/s | 9.0 | 9.0 | 9.0 |
| PEM electrolysis requirements, GW | 0.7 | 0.7 | 0.8 |
Table A6.
Key results of the MeOH case.
Table A6.
Key results of the MeOH case.
| Parameter | Stoichiometric Number | Recycling | ||||
|---|---|---|---|---|---|---|
| 1.7 | 1.9 | 2.1 | 0% | 50% | 90% | |
| Steelworks off-gases feedstock, kg/s | 106.5 | 106.5 | 106.5 | 106.5 | 106.5 | 106.5 |
| Total compression requirements, MW | 77.3 | 77.3 | 77.3 | 77.3 | 77.5 | 77.7 |
| Fresh hydrogen requirements, kg/s | 6.6 | 7.2 | 7.9 | 7.2 | 7.3 | 7.5 |
| Methanol product, kg/s | 19.2 | 20.2 | 21.1 | 20.2 | 29.9 | 38.6 |
| PEM electrolysis requirements, GW | 1.3 | 1.4 | 1.6 | 1.4 | 1.5 | 1.5 |
Table A7.
Key results of the combined case.
Table A7.
Key results of the combined case.
| Parameter | Stoichiometric Number (Methanol) | Recycling (Methanol) | ||||
|---|---|---|---|---|---|---|
| 1.7 | 1.9 | 2.1 | 0% | 50% | 90% | |
| Steelworks off-gases feedstock, kg/s | 90.3 | 90.3 | 90.3 | 90.3 | 90.3 | 90.3 |
| Total compression requirements, MW | 50.0 | 50.0 | 50.0 | 50.0 | 50.1 | 50.3 |
| Fresh hydrogen requirements, kg/s | 7.0 | 7.3 | 7.6 | 7.3 | 7.4 | 7.4 |
| Methane product, kg/s | 9.0 | 9.0 | 9.0 | 9.0 | 9.0 | 9.0 |
| Methanol product, kg/s | 9.9 | 10.4 | 10.8 | 10.4 | 13.3 | 19.9 |
| PEM electrolysis requirements, GW | 1.37 | 1.44 | 1.50 | 1.44 | 1.45 | 1.47 |
References
- The European Steel Association (EUROFER). European Steel in Figures 2020. 2020. Available online: https://www.eurofer.eu/publications/archive/european-steel-in-figures-2020/ (accessed on 14 March 2022).
- Quader, M.A.; Ahmed, S.S.; Ghazilla, R.A.R.; Ahmed, S.S.; Dahari, M. A comprehensive review on energy efficient CO2 breakthrough technologies for sustainable green iron and steel manufacturing. Renew. Sustain. Energy Rev. 2015, 50, 594–614. [Google Scholar] [CrossRef]
- Organization for Economic Co-Operation and Development. Global Material Resources Outlook to 2060: Economic Drivers and Environmental Consequences; ECD Publishing: Paris, France, 2019; ISBN 9789264307452. [Google Scholar]
- Sasiain Conde, A.; Rechberger, K.; Spanlang, A.; Wolfmeir, H.; Harris, C. Decarbonization of the steel industry. A techno-economic analysis. Matériaux Tech. 2021, 109, 305. [Google Scholar] [CrossRef]
- Dolci, F. Green hydrogen opportunities in selected industrial processes—Workshop summary report (26th of June 2018, Centre Albert Borschette, Brussels, Belgium). Publ. Off. Eur. Union 2018, 29. [Google Scholar] [CrossRef]
- Matino, I.; Dettori, S.; Zaccara, A.; Petrucciani, A.; Iannino, V.; Colla, V.; Bampaou, M.; Panopoulos, K.; Rechberger, K.; Kolb, S.; et al. Hydrogen role in the valorization of integrated steelworks process off-gases through methane and methanol syntheses. Matériaux Tech. 2021, 109, 308. [Google Scholar] [CrossRef]
- Bampaou, M.; Panopoulos, K.; Seferlis, P.; Voutetakis, S.; Matino, I.; Petrucciani, A.; Zaccara, A.; Colla, V.; Dettori, S.; Annunziata Branca, T.; et al. Integration of renewable hydrogen production in steelworks off-gases for the synthesis of methanol and methane. Energies 2021, 14, 2904. [Google Scholar] [CrossRef]
- Zaccara, A.; Petrucciani, A.; Matino, I.; Branca, T.A.; Dettori, S.; Iannino, V.; Colla, V.; Bampaou, M.; Panopoulos, K. Renewable hydrogen production processes for the off-gas valorization in integrated steelworks through hydrogen intensified methane and methanol syntheses. Metals 2020, 10, 1535. [Google Scholar] [CrossRef]
- Dieterich, V.; Buttler, A.; Hanel, A.; Spliethoff, H.; Fendt, S. Power-to-liquid via synthesis of methanol, DME or Fischer–Tropsch-fuels: A review. Energy Environ. Sci. 2020, 13, 3207–3252. [Google Scholar] [CrossRef]
- Gong, M.H.; Yi, Q.; Huang, Y.; Wu, G.S.; Hao, Y.H.; Feng, J.; Li, W.Y. Coke oven gas to methanol process integrated with CO2 recycle for high energy efficiency, economic benefits and low emissions. Energy Convers. Manag. 2017, 133, 318–331. [Google Scholar] [CrossRef]
- Yi, Q.; Gong, M.H.; Huang, Y.; Feng, J.; Hao, Y.H.; Zhang, J.L.; Li, W.Y. Process development of coke oven gas to methanol integrated with CO2 recycle for satisfactory techno-economic performance. Energy 2016, 112, 618–628. [Google Scholar] [CrossRef]
- Kim, S.; Kim, M.; Kim, Y.T.; Kwak, G.; Kim, J. Techno-economic evaluation of the integrated polygeneration system of methanol, power and heat production from coke oven gas. Energy Convers. Manag. 2019, 182, 240–250. [Google Scholar] [CrossRef]
- Portha, J.F.; Uribe-Soto, W.; Commenge, J.M.; Valentin, S.; Falk, L. Techno-economic and carbon footprint analyses of a coke oven gas reuse process for methanol production. Processes 2021, 9, 1042. [Google Scholar] [CrossRef]
- Shin, S.; Lee, J.K.; Lee, I.B. Development and techno-economic study of methanol production from coke-oven gas blended with Linz Donawitz gas. Energy 2020, 200, 117506. [Google Scholar] [CrossRef]
- Lundgren, J.; Ekbom, T.; Hulteberg, C.; Larsson, M.; Grip, C.E.; Nilsson, L.; Tunå, P. Methanol production from steel-work off-gases and biomass based synthesis gas. Appl. Energy 2013, 112, 431–439. [Google Scholar] [CrossRef] [Green Version]
- Deng, L.; Adams, T.A. Techno-economic analysis of coke oven gas and blast furnace gas to methanol process with carbon dioxide capture and utilization. Energy Convers. Manag. 2020, 204, 112315. [Google Scholar] [CrossRef]
- Lee, J.K.; Lee, I.B.; Han, J. Techno-economic analysis of methanol production from joint feedstock of coke oven gas and basic oxygen furnace gas from steel-making. J. Ind. Eng. Chem. 2019, 75, 77–85. [Google Scholar] [CrossRef]
- Gao, R.; Zhang, C.; Kwak, G.; Lee, Y.J.; Kang, S.C.; Guan, G. Techno-economic evaluation of methanol production using by-product gases from iron and steel works. Energy Convers. Manag. 2020, 213, 112819. [Google Scholar] [CrossRef]
- Kim, S.; Kim, J. The optimal carbon and hydrogen balance for methanol production from coke oven gas and Linz-Donawitz gas: Process development and techno-economic analysis. Fuel 2020, 266, 117093. [Google Scholar] [CrossRef]
- Gentile, G.; Bonalumi, D.; Pieterse, J.A.Z.; Sebastiani, F.; Lucking, L.; Manzolini, G. Techno-economic assessment of the FReSMe technology for CO2 emissions mitigation and methanol production from steel plants. J. CO2 Util. 2022, 56, 101852. [Google Scholar] [CrossRef]
- Kim, D.; Han, J. Techno-economic and climate impact analysis of carbon utilization process for methanol production from blast furnace gas over Cu/ZnO/Al2O3 catalyst. Energy 2020, 198, 117355. [Google Scholar] [CrossRef]
- Man, Y.; Yang, S.; Qian, Y. Integrated process for synthetic natural gas production from coal and coke-oven gas with high energy efficiency and low emission. Energy Convers. Manag. 2016, 117, 162–170. [Google Scholar] [CrossRef] [Green Version]
- Yi, Q.; Wu, G.S.; Gong, M.H.; Huang, Y.; Feng, J.; Hao, Y.H.; Li, W.Y. A feasibility study for CO2 recycle assistance with coke oven gas to synthetic natural gas. Appl. Energy 2017, 193, 149–161. [Google Scholar] [CrossRef]
- Rosenfeld, D.C.; Böhm, H.; Lindorfer, J.; Lehner, M. Scenario analysis of implementing a power-to-gas and biomass gasification system in an integrated steel plant: A techno-economic and environmental study. Renew. Energy 2020, 147, 1511–1524. [Google Scholar] [CrossRef]
- Uribe-Soto, W.; Portha, J.F.; Commenge, J.M.; Falk, L. A review of thermochemical processes and technologies to use steelworks off-gases. Renew. Sustain. Energy Rev. 2017, 74, 809–823. [Google Scholar] [CrossRef]
- Matino, I.; Dettori, S.; Colla, V.; Weber, V.; Salame, S. Forecasting blast furnace gas production and demand through echo state neural network-based models: Pave the way to off-gas optimized management. Appl. Energy 2019, 253, 113578. [Google Scholar] [CrossRef]
- Razzaq, R.; Li, C.; Zhang, S. Coke oven gas: Availability, properties, purification, and utilization in China. Fuel 2013, 113, 287–299. [Google Scholar] [CrossRef]
- Saito, M.; Murata, K. Development of high performance Cu/ZnO-based catalysts for methanol synthesis and the water-gas shift reaction. Catal. Surv. Asia 2004, 8, 285–294. [Google Scholar] [CrossRef]
- Remus, R.; Roudier, S.; Aguado Monsonet, M.A.; Sancho, L.D. Best Available Techniques (BAT) Reference Document for Iron and Steel Production. 2013. Available online: https://data.europa.eu/doi/10.2791/97469 (accessed on 14 March 2022).
- Bender, M.; Roussiere, T.; Schelling, H.; Schuster, S.; Schwab, E. Coupled Production of Steel and Chemicals. Chem. Ingenieur Technik 2018, 90, 1782–1805. [Google Scholar] [CrossRef]
- Lajtonyi, A. Blast Furnace Gas Cleaning Systems; Danieli Corus: MJ Velsen-Noord, The Netherlands, 2006. [Google Scholar]
- Castello, P.; Tzimas, E.; Moretto, P.; Peteves, S.D. Techno-Economic Assessment of Hydrogen Transmission & Distribution Systems in Europe in the Medium and Long Term; Publications Office: Petten, The Netherlands, 2006.
- Tzimas, E.; Filiou, C.; Peteves, S.D.; Veyret, J. Hydrogen Storage: State-of-the-Art and Future Perspective; European Commission: Petten, The Netherlands, 2003; ISBN 9289469501.
- Schildhauer, T.J.; Biollaz, S.M.A. Synthetic Natural Gas from Coal and Dry Biomass, and Power to Gas Applications; John Wiley & Sons: Hoboken, NJ, USA, 2016; ISBN 9781119191339. [Google Scholar]
- Koytsoumpa, E.I.; Karellas, S.; Kakaras, E. Modelling of Substitute Natural Gas production via combined gasification and power to fuel. Renew. Energy 2019, 135, 1354–1370. [Google Scholar] [CrossRef]
- Wolf-Zoellner, P.; Medved, A.R.; Lehner, M.; Kieberger, N.; Rechberger, K. In Situ Catalytic Methanation of Real Steelworks Gases. Energies 2021, 14, 8131. [Google Scholar] [CrossRef]
- Gao, J.; Wang, Y.; Ping, Y.; Hu, D.; Xu, G.; Gu, F.; Su, F. A thermodynamic analysis of methanation reactions of carbon oxides for the production of synthetic natural gas. RSC Adv. 2012, 2, 2358–2368. [Google Scholar] [CrossRef]
- Hauser, A.; Weitzer, M.; Gunsch, S.; Neubert, M.; Karl, J. Dynamic hydrogen-intensified methanation of synthetic by-product gases from steelworks. Fuel Process. Technol. 2021, 217, 106701. [Google Scholar] [CrossRef]
- Bampaou, M.; Kyriakides, A.-S.; Panopoulos, K.; Seferlis, P.; Voutetakis, S. Modelling of Methanol Synthesis: Improving Hydrogen Utilisation. Chem. Eng. Trans. 2021, 88, 931–936. [Google Scholar] [CrossRef]
- Bisotti, F.; Fedeli, M.; Prifti, K.; Galeazzi, A.; Dell’Angelo, A.; Barbieri, M.; Pirola, C.; Bozzano, G.; Manenti, F. Century of Technology Trends in Methanol Synthesis: Any Need for Kinetics Refitting? Ind. Eng. Chem. Res. 2021, 60, 10623–10653. [Google Scholar] [CrossRef]
- Carvalho, L.; Furusjö, E.; Kirtania, K.; Wetterlund, E.; Lundgren, J.; Anheden, M.; Wolf, J. Techno-economic assessment of catalytic gasification of biomass powders for methanol production. Bioresour. Technol. 2017, 237, 167–177. [Google Scholar] [CrossRef]
- Huisman, G.H.; Van Rens, G.L.M.A.; De Lathouder, H.; Cornelissen, R.L. Cost estimation of biomass-to-fuel plants producing methanol, dimethylether or hydrogen. Biomass Bioenergy 2011, 35, S155–S166. [Google Scholar] [CrossRef]
- Cañete, B.; Gigola, C.E.; Brignole, N.B. Synthesis gas processes for methanol production via CH4 reforming with CO2, H2O, and O2. Ind. Eng. Chem. Res. 2014, 53, 7103–7112. [Google Scholar] [CrossRef]
- Rafiee, A. Modelling and optimization of methanol synthesis from hydrogen and CO2. J. Environ. Chem. Eng. 2020, 8, 104314. [Google Scholar] [CrossRef]
- Bozzano, G.; Manenti, F. Efficient methanol synthesis: Perspectives, technologies and optimization strategies. Prog. Energy Combust. Sci. 2016, 56, 71–105. [Google Scholar] [CrossRef]
- Schittkowski, J.; Ruland, H.; Laudenschleger, D.; Girod, K.; Kähler, K.; Kaluza, S.; Muhler, M.; Schlögl, R. Methanol Synthesis from Steel Mill Exhaust Gases: Challenges for the Industrial Cu/ZnO/Al2O3 Catalyst. Chem.-Ing.-Tech. 2018, 90, 1419–1429. [Google Scholar] [CrossRef] [Green Version]
- Larson, E.D.; Tingjin, R. Synthetic fuel production by indirect coal liquefaction. Energy Sustain. Dev. 2003, 7, 79–102. [Google Scholar] [CrossRef]
- Bhandari, R.; Trudewind, C.A.; Zapp, P. Life cycle assessment of hydrogen production via electrolysis—A review. J. Clean. Prod. 2014, 85, 151–163. [Google Scholar] [CrossRef]
- Dobó, Z.; Palotás, Á.B. Impact of the voltage fluctuation of the power supply on the efficiency of alkaline water electrolysis. Int. J. Hydrogen Energy 2016, 41, 11849–11856. [Google Scholar] [CrossRef]
- Dobó, Z.; Palotás, Á.B. Impact of the current fluctuation on the efficiency of Alkaline Water Electrolysis. Int. J. Hydrogen Energy 2017, 42, 5649–5656. [Google Scholar] [CrossRef]
- Mayyas, A.; Ruth, M.; Pivovar, B.; Bender, G.; Wipke, K.; Mayyas, A.; Ruth, M.; Pivovar, B.; Bender, G.; Wipke, K. Manufacturing Cost Analysis for Proton Exchange Membrane Water Electrolyzers. Natl. Renew. Energy Lab. 2019. [Google Scholar] [CrossRef]
- Bertuccioli, L.; Chan, A.; Hart, D.; Lehner, F.; Madden, B.; Standen, E. Development of water electrolysis in the EU. Fuel Cells Hydrog. Jt. Undert. 2014, 1–160. [Google Scholar] [CrossRef] [Green Version]
- Hurskainen, M. Industrial Oxygen Demand in Finland; Technical Research Centre of Finland VTT Ltd.: Lappeenranta, Finland, 2017. [Google Scholar]
- Graf, F. STOREandGO, Innovative large-scale energy STOragE technologies AND Power-to-Gas concepts after Optimisation, H2020. Impact 2018, 2018, 81–83. [Google Scholar] [CrossRef]
- Bampaou, M.; Panopoulos, K.D.; Seferlis, P.; Voutetakis, S. Evaluation of novel hydrogen integration options in bio-oils introduction to petrochemical refineries. Energy 2022, 254, 124353. [Google Scholar] [CrossRef]
- Peters, M.; Timmerhaus, K.; West, R.E. Plant Design and Economics for Chemical Engineers, 5th ed.; McGraw-Hill: New York, NY, USA, 2003; ISBN 0-07-239266-5. [Google Scholar]
- Hamelinck, C.N.; Faaij, A.P.C. Future prospects for production of methanol and hydrogen from biomass. J. Power Sources 2002, 111, 1–22. [Google Scholar] [CrossRef]
- Atsonios, K.; Panopoulos, K.D.; Kakaras, E. Thermocatalytic CO2 hydrogenation for methanol and ethanol production: Process improvements. Int. J. Hydrogen Energy 2016, 41, 792–806. [Google Scholar] [CrossRef]
- Szima, S.; Cormos, C.C. CO2 utilization technologies: A techno-economic analysis for synthetic natural gas production. Energies 2021, 14, 1258. [Google Scholar] [CrossRef]
- Atsonios, K.; Panopoulos, K.D.; Kakaras, E. Investigation of technical and economic aspects for methanol production through CO2 hydrogenation. Int. J. Hydrogen Energy 2016, 41, 2202–2214. [Google Scholar] [CrossRef]
- Tijmensen, M.J.A.; Faaij, A.P.C.; Hamelinck, C.N.; Van Hardeveld, M.R.M. Exploration of the possibilities for production of Fischer Tropsch liquids and power via biomass gasification. Biomass Bioenergy 2002, 23, 129–152. [Google Scholar] [CrossRef]
- Woods, D.R. Rules of Thumb in Engineering Practice; Wiley-VCH Verlag GmbH & Co. KgaA: Weinheim, Germany, 2007; ISBN 9783527312207. [Google Scholar]
- Turton, R.; Bailie, R.C.; Whiting, W.B.; Shaeiwitz, J.A. Analysis, Synthesis and Design of Chemical Processes, 3rd ed.; Prentice Hall: Boston, MA, USA, 2009; ISBN 978-0-13-512966-1. [Google Scholar]
- EC Eurostat Online Statistical Database. Available online: https://ec.europa.eu/eurostat/ (accessed on 14 March 2022).
- Ringer, M.; Putsche, V.; Scahill, J. Large-Scale Pyrolysis Oil Production: A Technology Assessment and Economic Analysis; National Renewable Energy Lab: Golden, CO, USA, 2006. [CrossRef] [Green Version]
- IRENA. Green Hydrogen Cost Reduction: Scaling up Electrolysers to Meet the 1.5 C Climate Goal; IRENA: Abu Dhabi, United Arab Emirates, 2020. [Google Scholar]
- Methanex Corporation Methanex Regional Contract Methanol Prices for Europe, North America, Asia and China. Available online: https://www.methanex.com/our-business/pricing (accessed on 14 March 2022).
Publisher’s Note: MDPI stays neutral with regard to jurisdictional claims in published maps and institutional affiliations. |
© 2022 by the authors. Licensee MDPI, Basel, Switzerland. This article is an open access article distributed under the terms and conditions of the Creative Commons Attribution (CC BY) license (https://creativecommons.org/licenses/by/4.0/).