Article

Study on Stress Evolution Law of Overburden under Repeated Mining in Long-Distance Double Upper Protective Layer

1
College of Mining, Liaoning Technical University, Fuxin 123000, China
2
School of Mechanics and Engineering, Liaoning Technical University, Fuxin 123000, China
*
Author to whom correspondence should be addressed.
Energies 2022, 15(12), 4459; https://doi.org/10.3390/en15124459
Submission received: 28 April 2022 / Revised: 31 May 2022 / Accepted: 14 June 2022 / Published: 18 June 2022

Abstract

:
Upper protective seam mining has been widely applied in China, but the theory of long-distance multiple upper protective seam mining is not yet perfect. In order to investigate the overburden stress evolution law of repetitive mining of long-distance coal seam groups, an experimental study was conducted to simulate similar materials under repeated mining conditions in the long-distance double upper protective layer in the background of Pingmei Group 8th coal mine. By analyzing the roof-collapse structure and the stress evolution law of different layers of the floor during the superposition mining, the pressure-relief range of the protective layer after the mining of the double upper protective layer was determined. The study results showed that: the pressure relief of the protective layer in the long-distance upper protective layer mining was a dynamic process. After the mining of Group D coal seam, the maximum impact depth of the bottom plate could reach 182 m, and the pressure-relief angle of the upper side of Group E coal seam was 65°, and the pressure-relief angle of the lower side was 75°. The distance behind the vertical projection of the working face of Group D was 42 m. The overlapping back mining would affect the stress distribution of Group F coal seam. The pressure-relief angle of the upper side of Group F coal seam was 88°, and the pressure-relief angle of the lower side was greater than 78°. The distance behind the vertical projection of the working face of Group E was less than 61 m. The superposition and staggered mining of double protective layers could expand the protective layer. Through the verification of the measurement of gas parameters on site, it can be seen from the results that it has a certain protection effect. The research results can enrich the theory of long-distance multiple upper protective layer mining, and provide theoretical guidance for long-distance Coal Seam Group Mining in Pingmei coal-mine area.

1. Introduction

Coal is the dominant energy source in China, and it is expected to account for more than 50% of primary energy consumption by 2030, and coal will remain the basic energy to ensure China’s energy security and stability [1,2]. China’s main coal mining is underground mining method, and with the increase of mining depth, the risk of coal and gas protrusion increases [3,4,5,6,7]. To effectively control coal and gas outburst accidents, the national bureau of coal-mine safety issued Prevention and Control of Coal and Gas Outburst Conditions [8], emphasizing the prominent danger zone with the conditions of mining the protective layer, and mining the upper protective layer as a priority. The protective layer mining method is preferred for gas management, and protective layer mining is proved to be the most economical and reliable pressure-relief measure and one of outstanding prevention and control according to domestic and foreign practice [9]. Protective layer mining, combined with pressure-relief gas extraction from the protective layer, has become a regional gas-control technology that is being promoted as a priority in China’s coal mines [10,11,12,13,14,15].
Protective layer mining provides pressure relief for the protective layer. During the process of the protective layer mining, its surrounding rocks are deformed and damaged, and the stress is released, providing the preconditions for the outflow of coalbed methane. After protective layer mining, the ground stress is redistributed, and the surrounding pressure is unloaded, and the coal and rock bodies above and below the protective layer are bent to the mining area, resulting in the rupture of the surrounding rock, which, in turn, improves the permeability of the coal seam and facilitates the transportation of coal seam gas for extraction, so as to reduce the risk of coal and gas protrusion in the protective layer. During the mining process of the coal seam group affected by repeated disturbance of the mined coal seam, both the surrounding rock stress field and fracture field will further evolve on the basis of single seam coal mining. Li [16] used similar material simulation experiments to study the mining background of multiple protection layers in a large dip coal seam group and concluded that the physical and mechanical properties of coal rocks were changed by the cyclic unloading of the protective layers, and the fractures in the coal seams were further developed to provide strong conditions for gas desorption and transport. Li et al. [17] studied the dynamic evolution law of overburden motion and fracture field of double-unloading mining in the context of a proximity coal seam group. The results show that under the action of double-unloading mining, the overburden fissures undergo a complex process of generation, expansion, compaction, tension, and compaction, forming a three-dimensional interlaced gas transport channel, and changing with the advancement of the double-unloading mining workings. Li et al. [18] explored the spatial and temporal evolution of double unloading stress in the composite coal seam group, and concluded that, under the double unloading conditions, the overburden fractures were further developed, the unloading effect at both ends of the mining area was more significant, and the unloading degree and unloading range of the protective layer were significantly increased. Kong et al. [19] used similar material simulation experimental means to carry out a study on the damage mechanism of the bottom slab in the downward mining of a large, inclined coal seam group, and concluded that the effect was limited by downward mining to unload pressure at a long distance, but the effect was better when downward unloading mining was carried out on the basis of upward unloading mining. Cheng et al. [20] studied the stress–fracture distribution and evolution characteristics of the surrounding rock under the influence of double unloading of the protected seam in the context of a close coal seam group, and concluded that single mining influenced the development of fractures in the overlying rock and the degree of unloading of the top and bottom plates was not sufficient, while repeated mining influenced the development of fractures in the overlying rock and the degree of unloading of the top and bottom plates was sufficient. Yang et al. [21] studied the evolution of stresses with time and space during the mining of the upper protective layer and analyzed the dynamic evolution law of stresses at different burial depths in the bottom slab during the mining of the upper protection layer, as well as the dynamic evolution law of the unloading angle during the mining of the protective layer. Xiong et al. [22] conducted a study on the stability of coal mining working face under repetitive mining disturbance in a close coal seam group, and the results showed that the main controlling factor for the damage of the working face was the strength of the coal body. Under the influence of repetitive mining disturbance, the fissures of the working face were relatively developed, and the strength of the coal body was reduced. The working face was more likely to be damaged under the same roof pressure. Zhang et al. [23] used numerical simulation study means to investigate the bottom plate stress and fracture distribution law during the mining process of the close coal seam group and concluded that the bottom plate decompression range and damage depth was increasing gradually with the advance of the upper protective layer. Jiang et al. [24] reported that mining multiple protective seams could superimpose unloading effects and coal seam deformation under the conditions of coal seam clusters and concluded that the correct selection of the first protective seam to be mined was very important. A large number of scholars have used similar material simulation experiments, numerical simulation calculations, and theoretical analysis to study the protection effect of the protective layer under the multiple protection of a coal seam group, and it provides important technical support to the safe working of coal mines [25,26].
Extraction works will extend to deeper depths over time, and both gas content and gas pressure is going to increase with burial depth [27], and upper protective layer mining will be more common in the deep mining stage. However, when designing the upper protective seam mining, the spacing between the lower protective seam and the upper protective seam should not be too large in order to ensure the effect of pressure release from the lower protective seam. However, in practice, there are cases of large layer spacing at the site, and the layer spacing between coal groups exceeds one hundred meters. After the overlying coal group is mined back as the upper protective seam, the protection effect of the protective seam at a distance is not yet known. This paper adopted similar material simulation experimental means to explore the stress evolution law of the lower hexagonal coal seam during the back mining process with the Ding and E coal groups as the protective seam in Pingmei 8th coal mine and analyzed the pressure-relief effect of mining the volcanic rock on the long-distance (170 m) upper protective seam stack. The study results can provide theoretical guidance for the mining of long-distance coal seam clusters in the Ping mine area, providing theoretical basis for comprehensive gas management, and provide guidance for comprehensive gas management and safe and efficient production in the Ping mine area.

2. Similarity Materials Simulation Experiment of Long-Distance Coal Seam Group Superposition Mining

2.1. Project Background Overview

Pingmei 8th coal mine is located in Pingdingshan City, Henan Province, China, as shown in Figure 1. Most coal mines in Pingmei mining area are mined in multi coal seam groups. The main minable coal seams in the mining area include Group D, Group E, Group F, and Group G. The coal seams form a unique coal seam group structure relationship with large group spacing and small layer spacing in the group. This paper takes the working face of the lower mining area with the typical coal seam structure of Pingmei 8th coal mine as the research object. The main mining coal seams of Pingmei 8th coal mine are Ding5.6, Wu9.10, and Ji15 coal seams. The coal seam spacing of Group D and Group E is 70 m–90 m, and the average coal seam spacing of Group E and Group F is about 170 m. Among them, the buried depth of Group D coal seam is 569–615 m, the gas pressure is 0.39 MPa, and the gas content is 4.13 m3/t; the buried depth of Group E coal seam is 649–695 m, the gas pressure is 2.5 MPa, and the gas content is 16 m3/t; the buried depth of Group I coal seam is 819–875 m, the gas pressure is 2.65 MPa, and the gas content is 20 m3/t. There is a certain skew angle between the Ji15-21030 working face of Pingmei 8th coal mine and the goaf of Group D and Group E after the overlying mining, and there is a relationship of interleaving and overlapping in spatial position. Under the influence of the mining disturbance of Group D coal pillar superimposed on Group E coal seam, it is bound to change the evolution law of overburden stress in space and time, resulting in corresponding pressure-relief area and stress concentration area.
In this paper, through the similar material simulation experiment method, the stress evolution law of the group coal seam under the influence of the coal pillar superposition of coal seam mining disturbance has been analyzed, and the stress evolution law of overlying strata in the eighth coal mine of Pingdingshan Coal Mine has been explored. The distribution of working faces in the study area is shown in Figure 1. The mining sequence of the working face is Ding5.6-11010→Ding5.6-11030→Ding5.6-11050→Ding5.6-11070→Ding5.6-11090→Wu9.10-21030→Wu9.10-21050→Ji15-21030.

2.2. Program Design

Based on the geological conditions of No. 1 mining area of Pingmei Group 8th coal mine, a physical similar material simulation model was built. In this experiment, similar materials were used to simulate the test-bed: length (2.85 m) × width (0.3 m) × height (2.0 m) plane stress model test frame. The model simulated the tendency profile with a pavement angle of 9°. Intercepting vertical section of the Ji15-21030 working face and simulating the mining face according to the actual mining conditions. Three working faces were arranged in the coal seam of Group D, and the working faces Ding5.6-11010, Ding5.6-11030, and Ding5.6-11050 were excavated from right to left, in turn. Two working faces were arranged in the coal seam of Group E, and the working faces of Wu9.10-21030 and Wu9.10-21050 were excavated, in turn. After conversion, the working face Ding5.6-11010 was 104 m from the right boundary of the model, the working face length was 182 m, the working face Ding5.6-11030 was 150.8 m, and the working face Ding5.6-11050 was 156 m, with a 13 m coal pillar reserved between the two working faces. After the excavation of Group D was completed and the model was stable, the working face of Group E was excavated. The cut hole of working face Wu9.10-21030 was 122.2 m away from the right boundary of the model, and the length of working face Wu9.10-21050 was 208 m. A 13 m coal pillar was reserved between the two working faces. The specific working-face parameters and the reserved length of coal pillar were shown in Figure 2.
The displacement monitoring points and stress monitoring points were, respectively, arranged in the model. The coding points were set on the experimental frame, drawing marker lines which were parallel to the seam or lead hammer on the front of the coal seam. The parallel lines were 3 cm from the top and bottom of the coal seam, respectively, and the rest of the parallel lines and lead hammer lines were spaced at 10 cm. The intersection of the two lines was set as the non-coding points. The XJTUDP 3-D optical photogrammetry system was used to observe the non-coded point displacement changes of the overburden. The XJTUDP 3-D optical photogrammetry system is an industrial non-contact optical three-dimensional coordinate measurement system, which can accurately obtain the three-dimensional coordinates of discrete target points. It is a portable and mobile three-dimensional optical measurement system, which can be used for deformation analysis and real-time measurement. The BW type earth stress box was pre-buried in a similar material model as a stress-monitoring point for monitoring, and the stress and pre-burial scheme were shown in Figure 2 and Table 1. The stress box was connected to the DH3818Y static strain gauge to monitor the stress changes of the stress-monitoring points during the mining process.

2.3. Model Establishment

The model similarity constants were determined according to the field conditions and the law of similarity. Geometric similarity ratio: α l = 1 : 260 . The similarity ratio of bulk density α γ is determined as α γ = 1 : 1.5 , according to the density of the selected similar simulation material. The similarity ratio of time α t can be determined from α t = α l = 260 16 . The similarity ratio of stress can be α σ determined from α σ = α l α γ = 260 × 1 . 5 = 390 . [28]
River sand and mica were selected as aggregates, lime and gypsum as cement, and citric acid as retarder. Through conversion and mechanical tests of materials with different ratios, the similar material ratio number table of river sand, lime, and gypsum were converted to the corresponding model material mechanical parameters, as shown in Table 2. It is worth noting that the Ration Number “437” is for Fine sandstone, in which river sand, lime, and gypsum are distributed, according to the weight ratio of 4:0.3:0.7.
In view of the size of similar material simulation test bench, the overburden of Group D was about 400–500 m from left to right, and the overburden was not paved. The lever load was used to load the equivalent stress of the overlying coal stratum. Through conversion, it could be seen that the loading equivalent stress load and the longitudinal load were 26–32 kpa from left to right. At the bottom of the model and the left and right sides of the model, the displacement was limited by the boundary. The dimensions of the experimental model of similar materials after the completion of paving were L (2.85 m) × W (0.3 m) × H (1.65 m), and the model was paved, as shown in Figure 3. At the same time, the overburden loading system, the stress acquisition system, and the displacement acquisition system of the model were shown in Figure 3. The excavation plan, combined with the production system of the profile and the daily feed, was converted according to the similarity ratio, and the model single excavation length of 4 cm was determined, and the mining time interval was 50 min.

3. Analysis of Experimental Results

3.1. Overburden Movement Law of Long-Distance Coal Seam Group Overlapping Mining

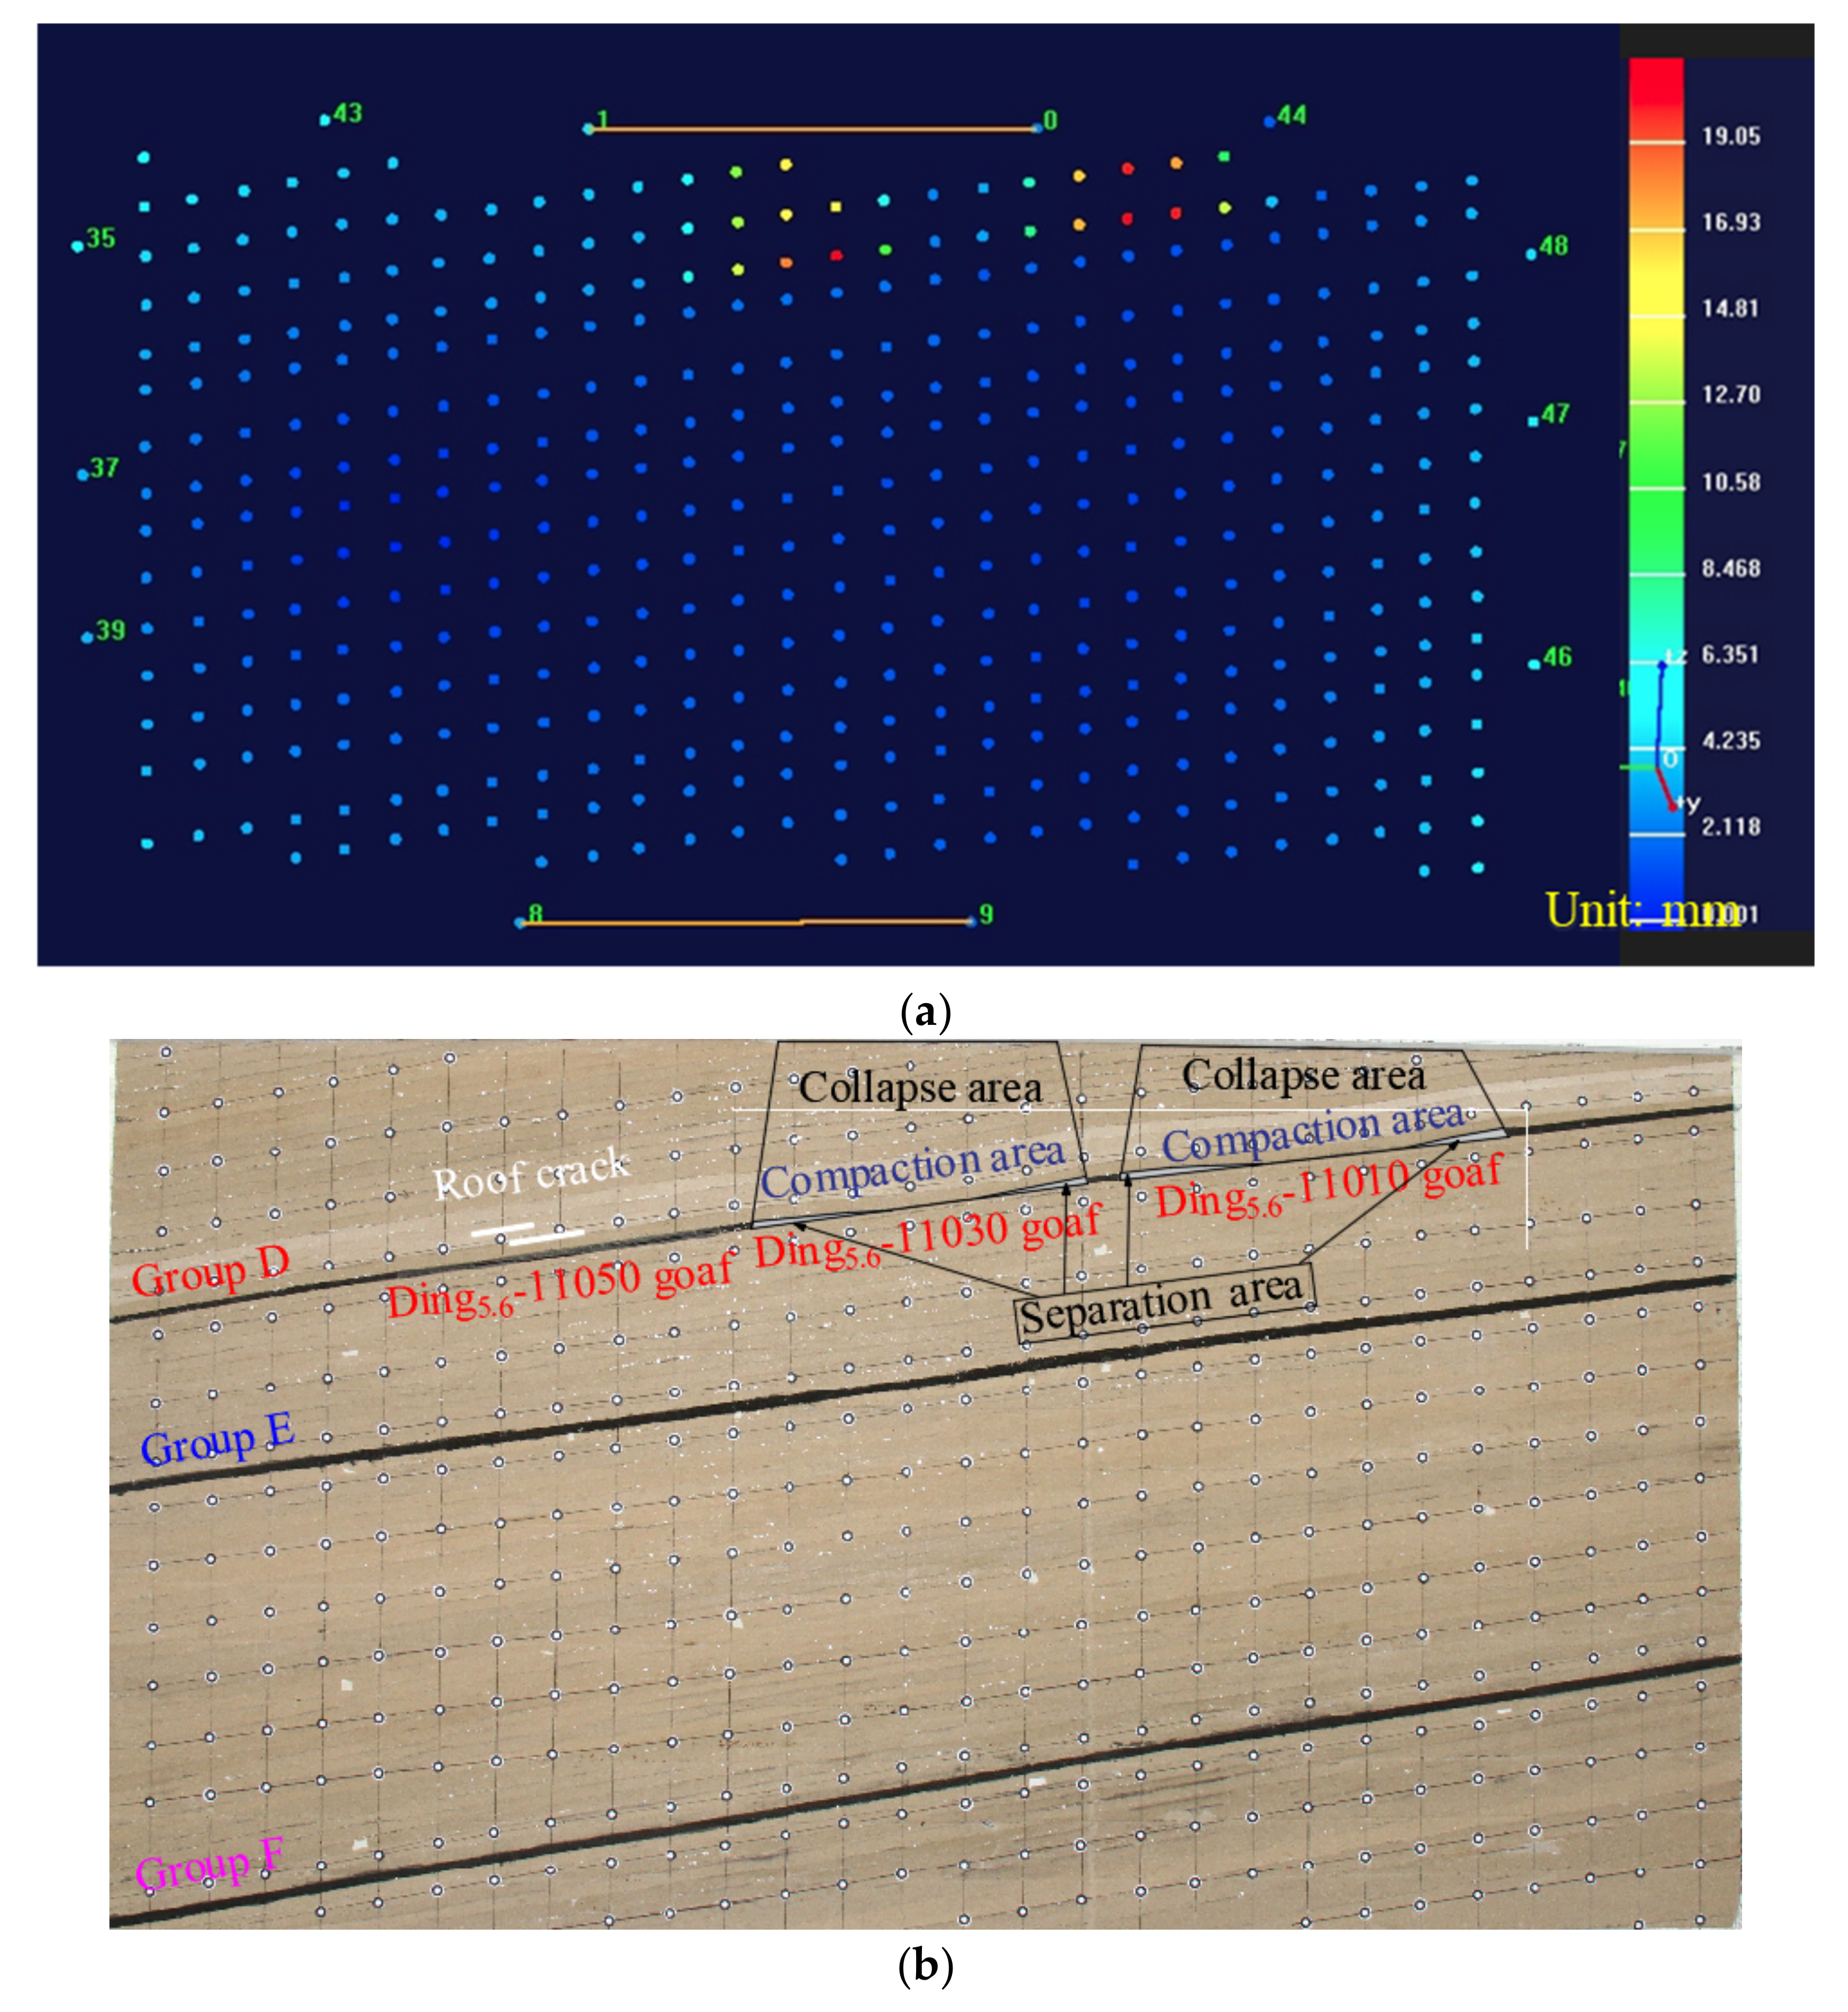
3.1.1. Overburden Movement Law after Mining Group D Coal Seam

After the mining of Group D working face completed, it could be seen from Figure 4b that Ding5.6-11010 working face collapsed when mining 156 m. The collapse had a certain suddenness. The roof collapse range extended to the top of the model. The whole collapse structure presented a “U” shape. The collapse in the middle of the goaf of the working face was connected with the bottom plate. The roof of the working face at the opening and stopping line did not collapse, with a separation presence, and the integrity of the collapsed top plate was good. The overlying roof plate of the coal seam did not collapse at the end of back mining of the Ding5.6-11030 working face. During the back mining of the Ding5.6-11050 working face, the roof plate of Ding5.6-11030 working face collapsed. The collapse form was consistent with that of the Ding5.6-11010 working face, and the roof integrity was good. After the mining of the Ding5.6-11050 working face was completed, the working face did not collapse, but there was slight displacement. The displacement vector of the overlying roof is shown in Figure 4.

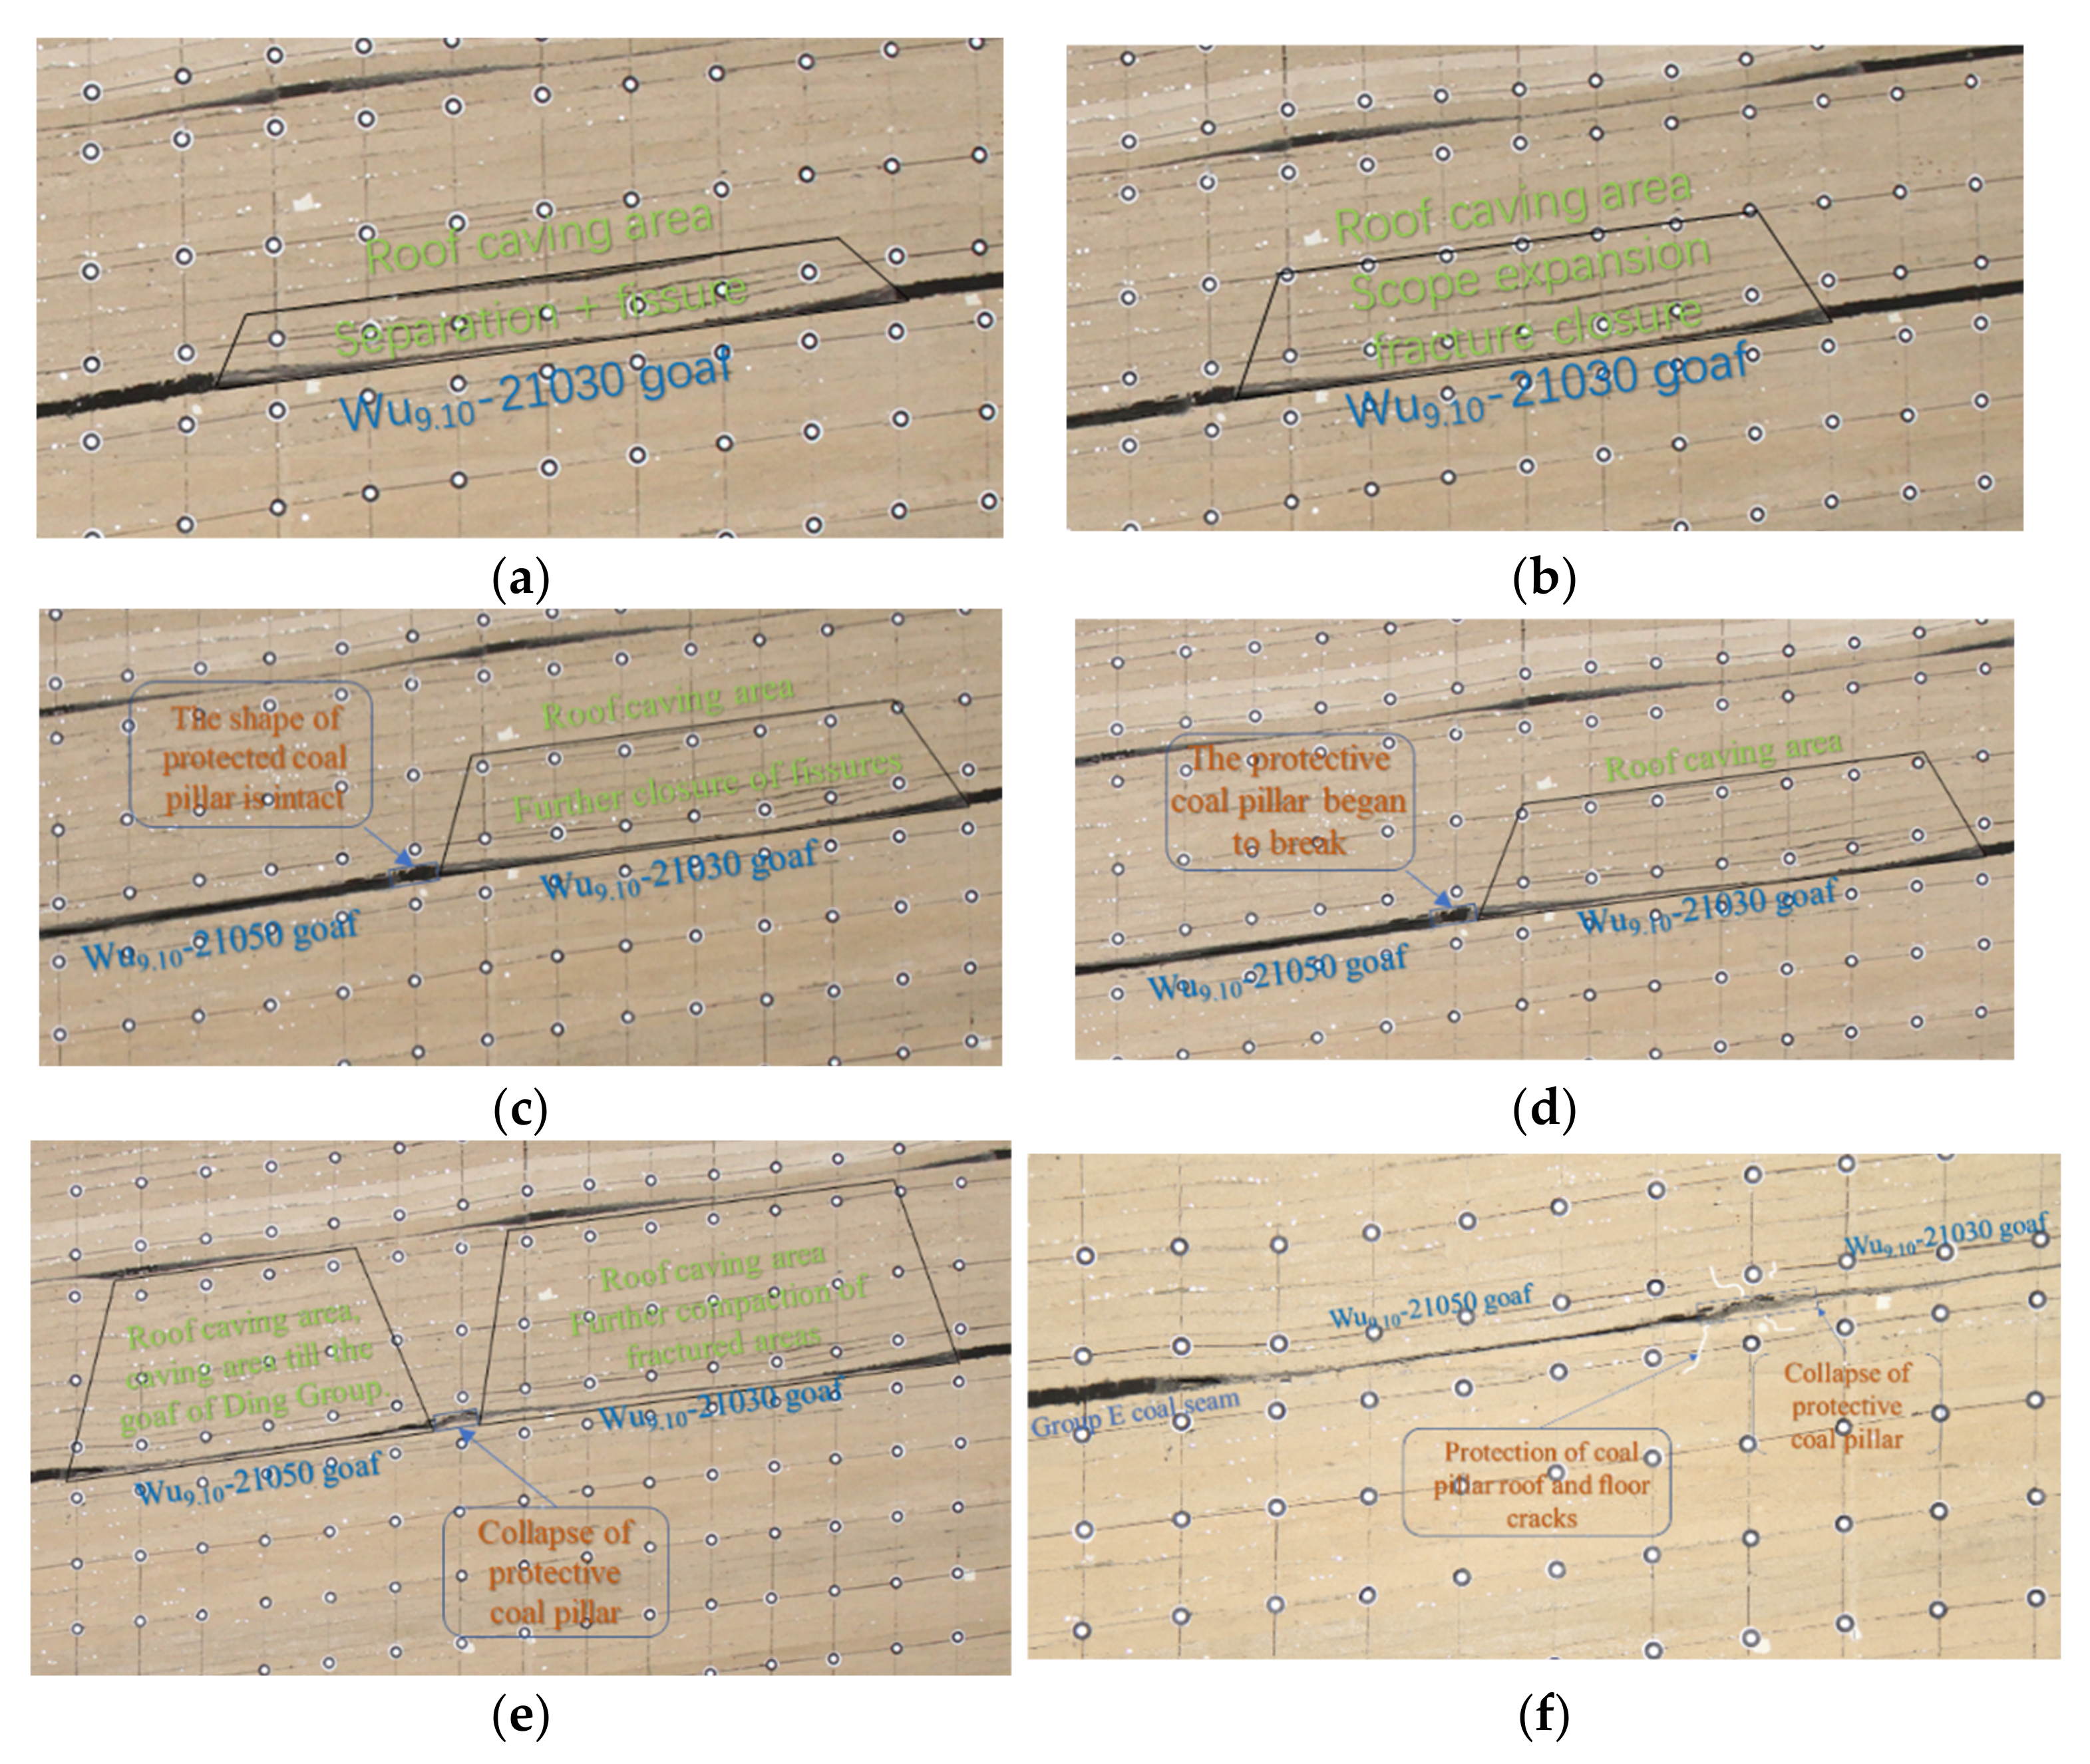
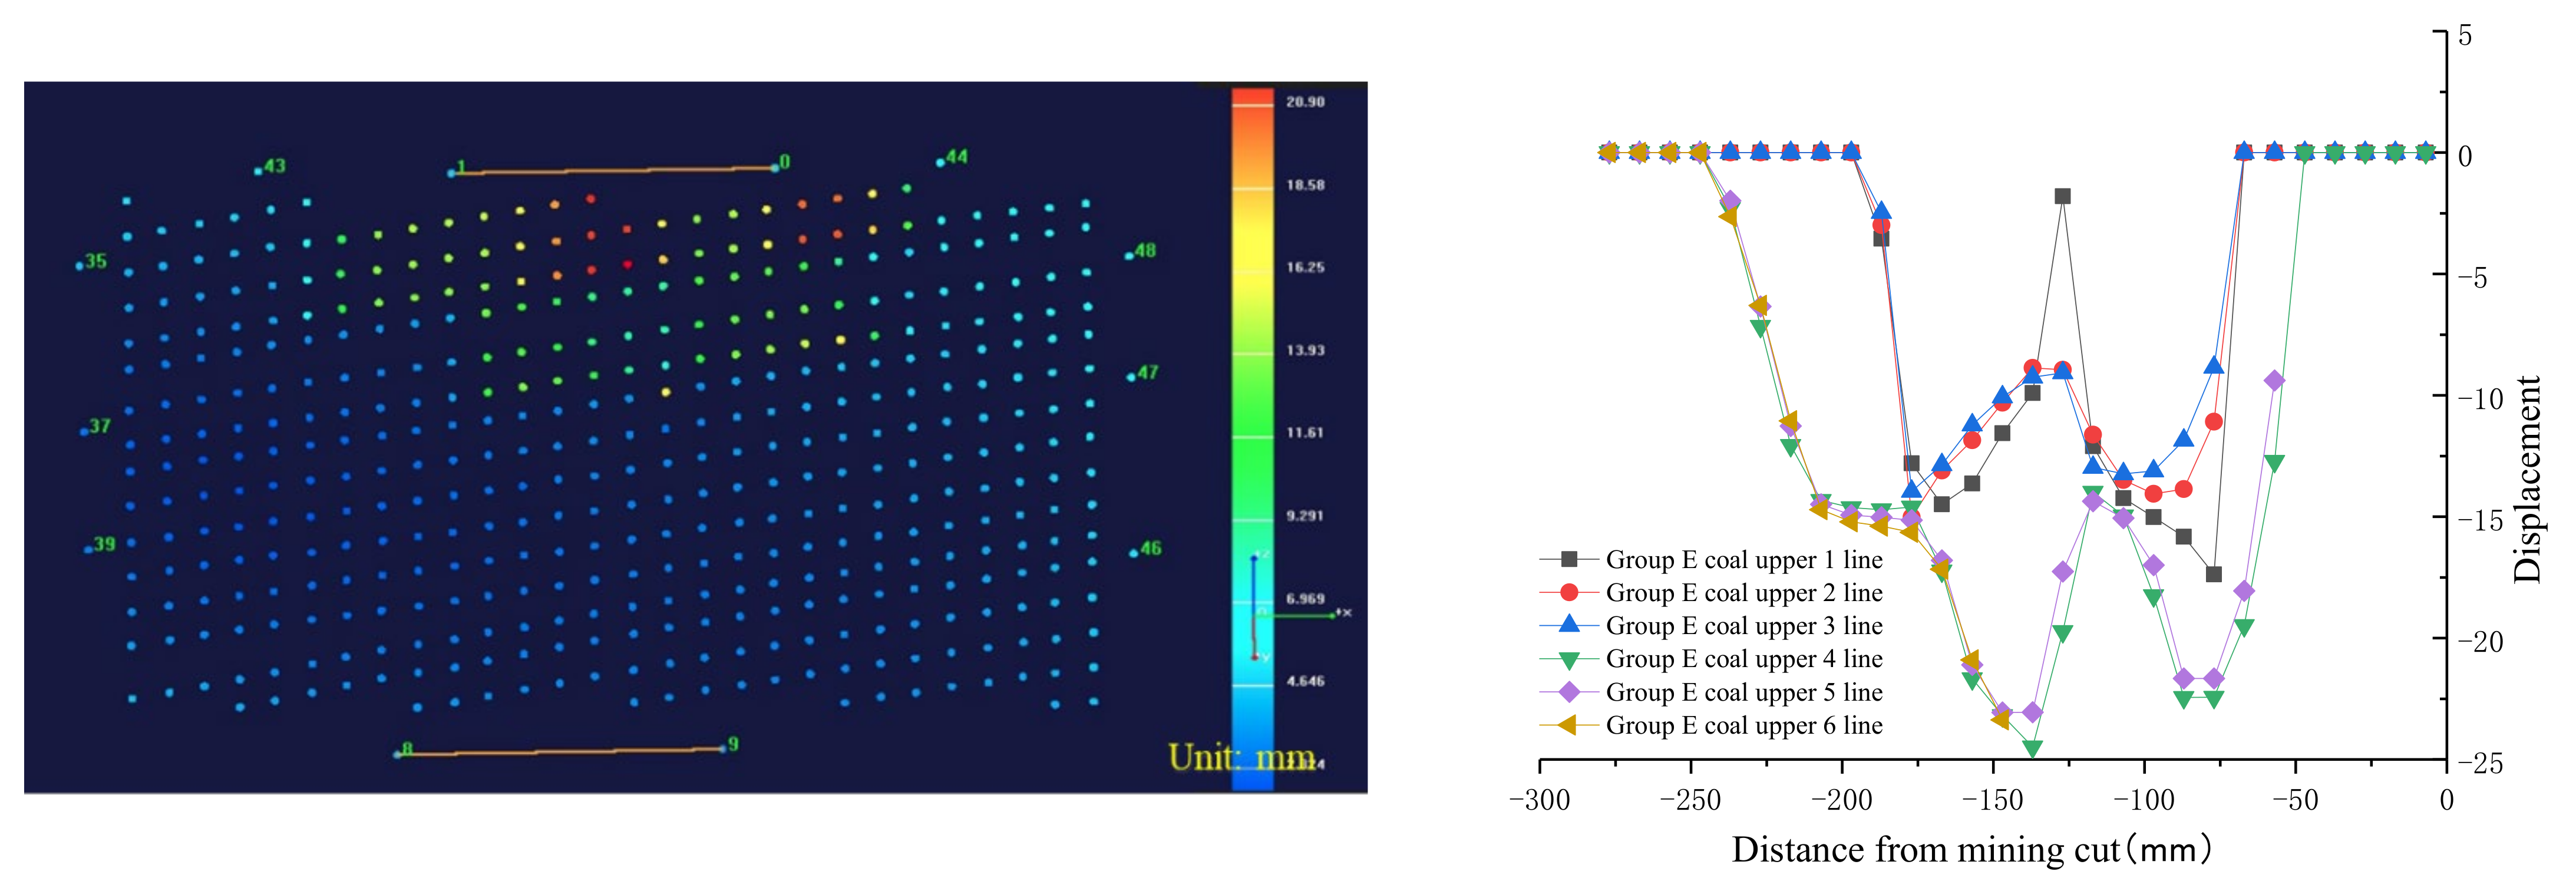
3.1.2. Overburden Movement Law after Mining Group E Coal Seam

After the mining of Group D coal seam was completed and the model was stable, the working face of Group E was to be mined. When the Wu9.10-21030 working face was mined to 197.6 m, the roof of goaf 20.8 m collapsed, and the collapsed roof was in a bending and sinking state. The roof of the working face at the opening and stopping line did not collapse, leaving gaps. The roof of Group E was separated by 20.8 m, with a maximum height of 2.6 m and a length of 156 m, as shown in Figure 5a. The mining of the Wu9.10-21030 working face was completed immediately, and the Wu9.10-21050 working face was mined after a 13 m coal pillar reserved. When the Wu9.10-21050 working face was mined to 124.8 m, there was still no obvious change in the reserved coal pillar. Continuing to excavate for a cycle, the reserved coal pillar in Group E had a wall phenomenon. After mining for 10.4 m, the coal pillar was completely unstable and collapsed, and then the overlying roof collapsed. The collapsed roof extended to the top of the model, which was in a bending and sinking state as a whole. There was still a certain gap at the stopping line and it was not compacted. The process of coal seam retrieval and collapse of Group E is shown in Figure 5. The displacement vector occurring on the overlying roof is shown in Figure 6.

3.1.3. Mechanical Structure Analysis of Protective Layer

According to the experimental phenomenon, it was known that the destabilization collapse of the protective coal pillar between the two working faces during the Group E coal seam retrieval had a certain abruptness, which was prone to coal and gas outburst accidents, and its collapse mechanism needed to be analyzed [14,29]. After the protective layer mined, the self-weight stress of surrounding rock would act on the protective layer, which was related to the depth of coal and rock mass. At the same time, there was still some residual bearing pressure in the goaf of the protective layer. With the mining of the working face, the goaf was continuously compacted and stress recovery occurred. Due to the existence of a structural protective belt near the coal pillar, the residual bearing pressure was small, and the residual bearing pressure increased away from the area. The residual supported pressure, together with the self-weight stresses in the interbedded rock and the stresses transmitted by the coal pillar, constituted the stress system of the protected seam, as shown in Figure 7.
The width of the coal pillar was smaller compared with the working face, and it was considered that the approximate distributed stress on the surface of the coal pillar was the mean value. The spatial structure below the coal pillar could be regarded as a half plane body. The coal pillar applied its normal distribution force to the half plane body as a whole. Therefore, a model of the normal distribution force of the half plane body was formed, as shown in Figure 8. According to the part of the normal distribution force on the boundary of the half plane in elasticity, the vertical stress value of any point in the half plane could be obtained, so as to obtain the vertical stress exerted by the coal pillar on each point above the coal body of the protective layer.
In Figure 8, q is uniform compressive stress above the coal pillar, and H is vertical distance between the coal pillar and the protected coal seam. Take the midpoint below the coal column as the coordinate origin, the lead direction as the X-axis, the horizontal direction as the Y-axis, and establish a right-angle coordinate system. The distance from the midpoint of the coal pillar to the sides of the pillar is a, and L is Range of influence of the coal pillars on the protective seam. Let the coordinates of any point in the half-plane body be A (x, y), and take the tiny length, in the MN section at a distance O from the origin of coordinates, to obtain the stress produced by the normal distributed force q at point A as:
σ x = 2 π a a q x 3 d ξ [ x 2 + ( y ξ ) 2 ] 2
Integrating the above equation yields:
σ x = q π arctan y a x arctan y + a x + x ( y a ) x 2 + ( y a ) 2 x ( y + a ) x 2 + ( y + a ) 2
It could be seen that σ x was an even function with the same distribution on both sides of the σ x axis. According to Equation (2), it could be seen that under a certain force on the coal column, when the stress was transferred to the coal body, that was, x = H, at the same time the horizontal sitting y determined the size. When y = 0, x reached its maximum value.
σ x max = 2 q π arctan a H + H a H 2 + a 2
In addition, there is residual support pressure around the goaf. In Figure 8, when it is close to the coal pillar, due to the existence of the structural protection belt (red area), the residual bearing pressure is very small. After it is far away from the coal pillar, the residual bearing pressure begins to increase. When it is about l away from the solid coal, the residual abutment pressure gradually returned to the original stress level. For calculation purposes, the vertical stress at the edge of the extraction zone is approximated as a linear increase from 0 to the recovery of the original stress inside the extraction zone. Therefore, the residual bearing pressure of the protective layer could be expressed as:
Δ σ q = γ H l y + a l a y a γ H y l a
The rock seam between the two coal seams exerted a self-weight stress Δ σ g on the coal body of the protective seam, and the expression of Δ σ g is:
Δ σ g = γ y + b tan α b y H tan α b γ H y H tan α b  
where b is the horizontal distance from the coal wall to the midpoint of the coal pillar, and α is the rock stratum movement angle.
To sum up, the stress system of the protective layer could be expressed as:
σ = σ x + Δ σ q + Δ σ g  

3.2. The Temporal and Spatial Evolution Law of Overburden Stress

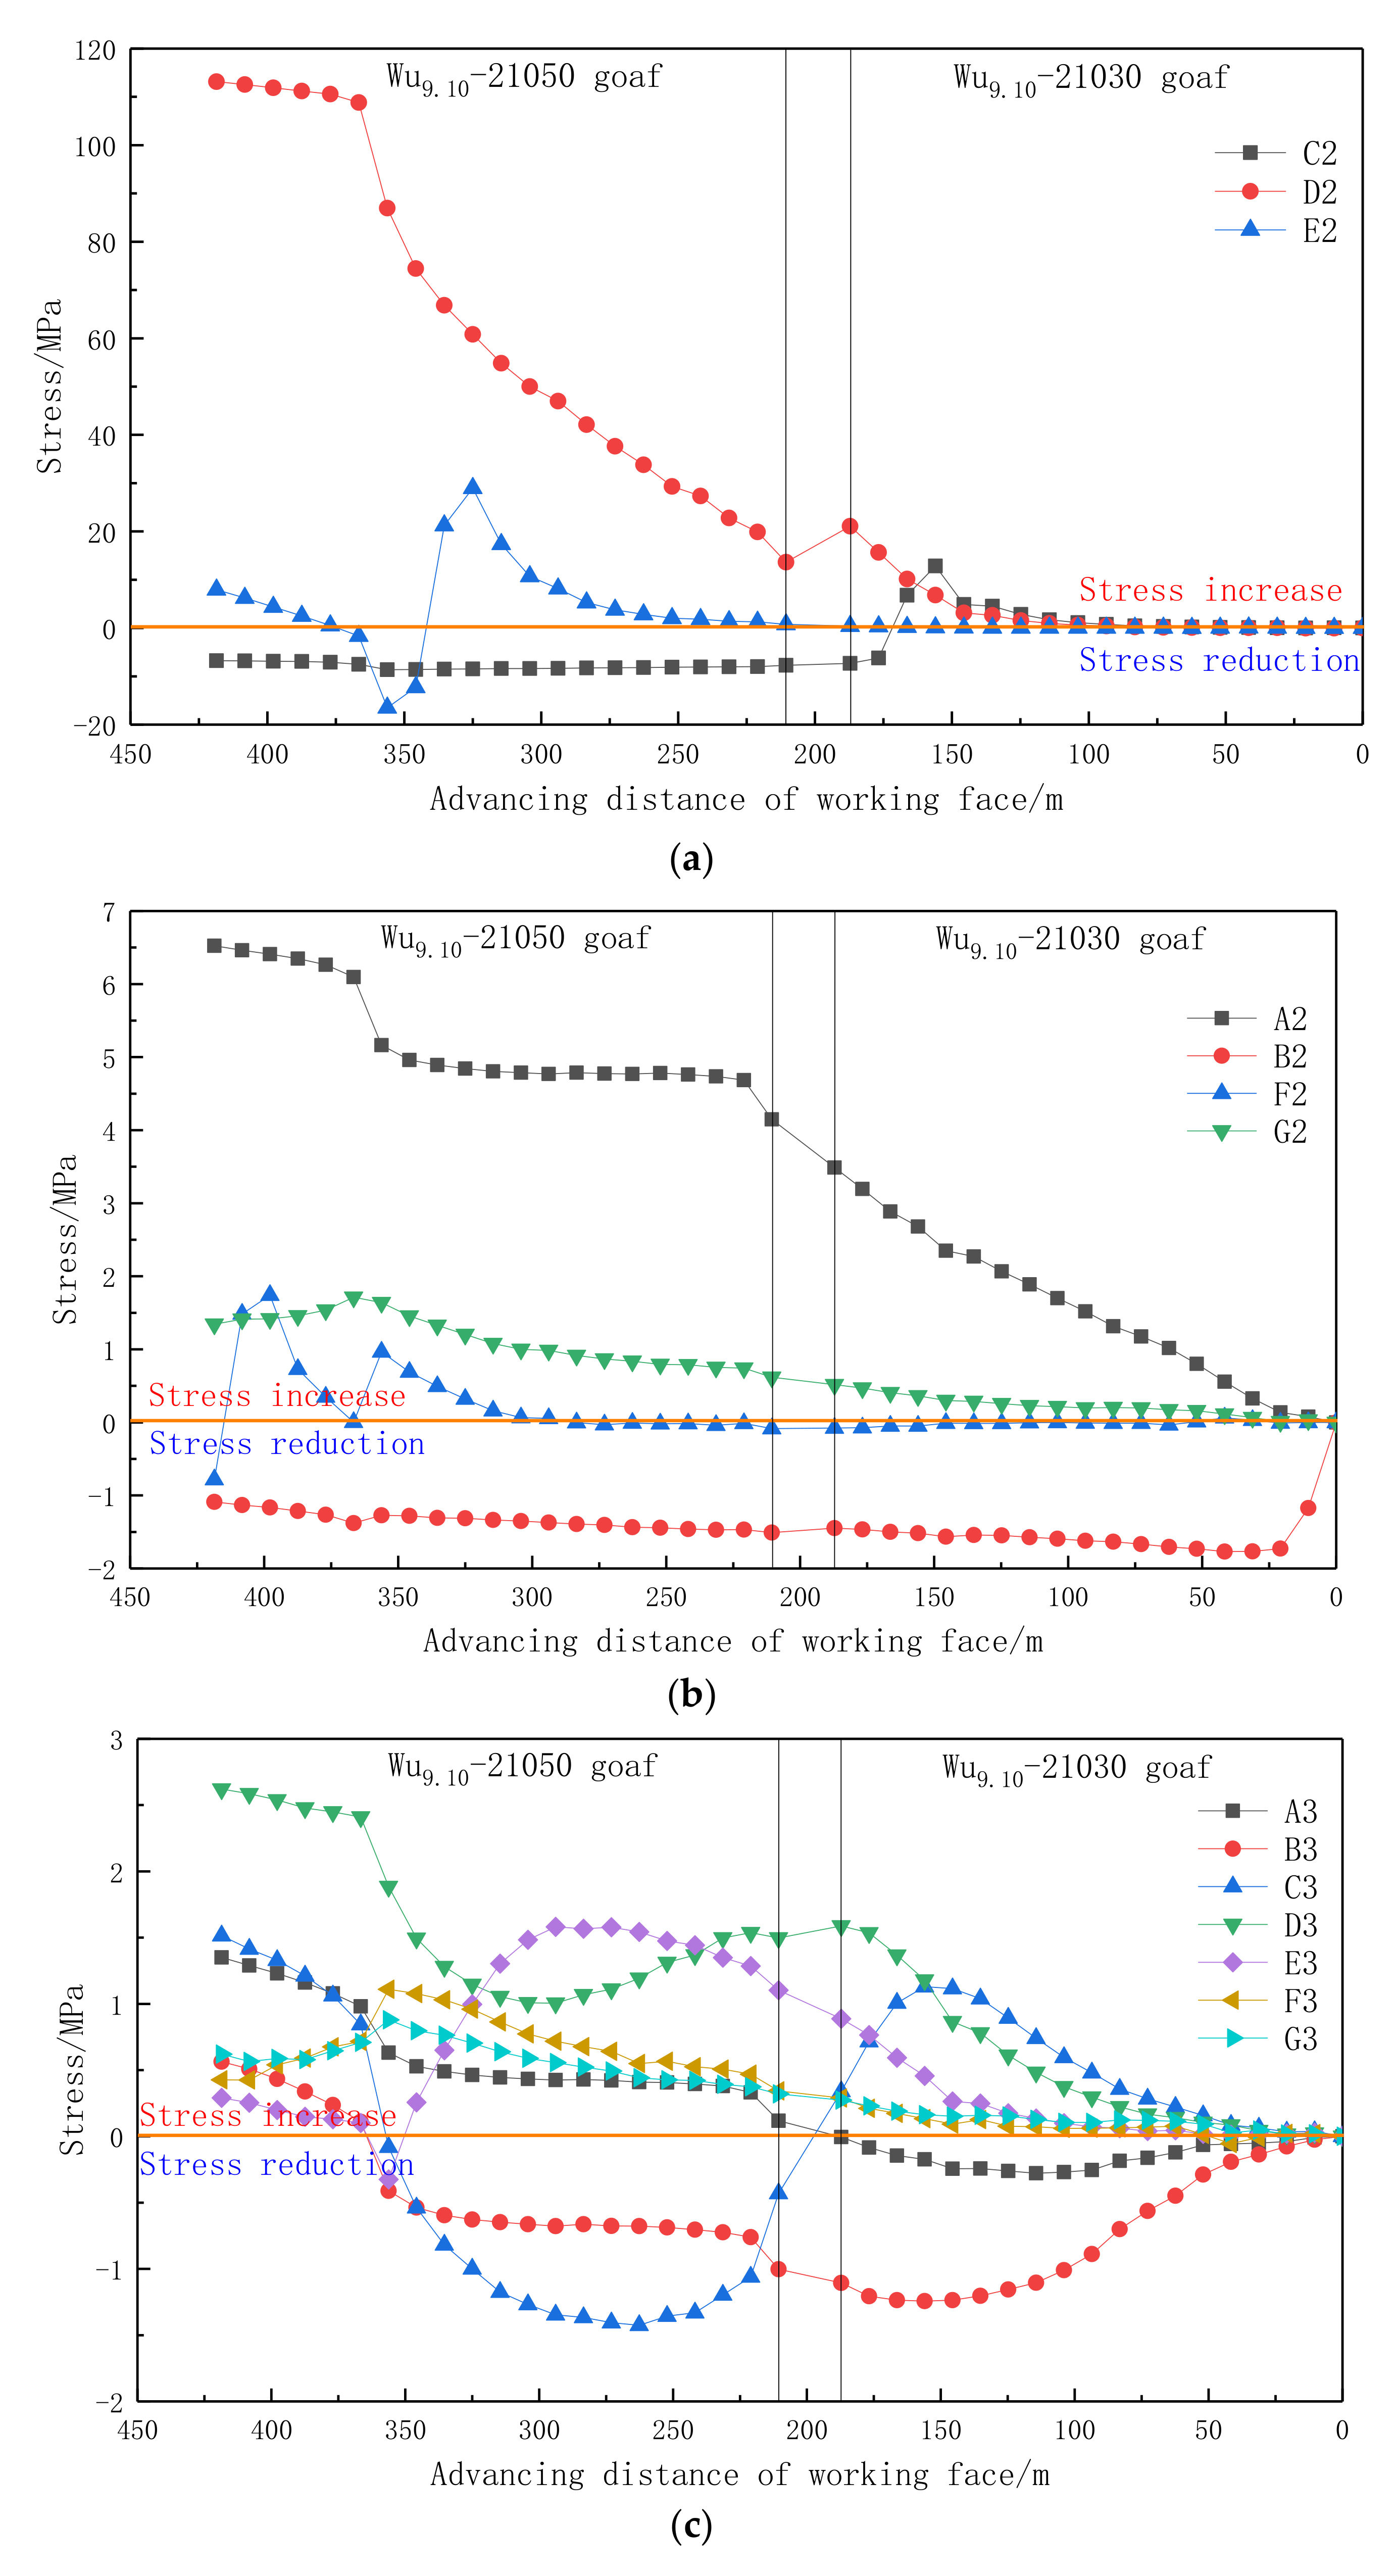
3.2.1. Stress Evolution Law of Different Layers of Mining Floor in Group D Coal Seam

After the mining of the upper protective layer, the stope stress was redistributed. Three working faces of Ding5.6-11010, Ding5.6-11030, and Ding5.6-11050 were arranged for the Ding Group coal. After the back mining of the working face of the Group D coal seam finished, the stress values of the stress monitoring points at different burial depths and locations of the Group D coal seam were measured. Taking the open cut eye of the Ding5.6-11010 working face as the 0 point, the stress evolution curve of the floor at different distances was drawn to study the stress change law of the floor.
The stress evolution curve at 33 m of Group D coal floor was drawn, as shown in Figure 9a. During the mining of the Ding5.6-11010 working face, the B1 stress value was reduced to a minimum of 3.08 MPa. The pressure-relief ratio was 21.1%, and then the stress was restored to near the initial stress. In the mining process of working faces Ding5.6-11030 and Ding5.6-11050, the stress basically remains unchanged. When the mining of Group D coal was close to the end, the stress decreased below the initial stress. With the advancing of two working faces, the stress of C1 stress-monitoring point was affected by the stress concentration of the coal pillar. The stress increased continuously at 21.6 MPa, and the stress concentration factor was 2.48. The stress value in the Ding5.6-11050 mining face was basically stable during the mining process. During the whole Group D coal seam retrieval process, the stress at G1 stress-monitoring point continued to show a rising trend, and the stress rose faster when retrieving at the Ding5.6-11050 working face. After the mining of Group D coal seam, the stress in this area was pressurized, the maximum stress increased by 3.5 Mpa, and the stress concentration factor was 1.24.
The stress evolution curve at 87 m of Group D coal floor was drawn, as shown in Figure 9b. This layer also represented the evolution law of the stress of the coal seam floor in Group E. By analyzing the evolution law of stress in this group, we could know that the Group D coal seam was a long-distance upper protective layer, and the mining process affected the Group E coal seam. The stress evolution law of A2 and B2 stress-monitoring points was basically the same. In the mining process of the Ding5.6-11010 working face, the stress decreased first and then increased. The maximum reduction values of stress were 0.37 MPa and 0.75 MPa, and the pressure-relief ratio was 2.3% and 4.7%. In the mining process of the Ding5.6-11030 and Ding5.6-11050 working faces, the stress basically remained stable and gradually recovered to the original stress. The stress evolution law of C2 and E2 stress monitoring points affected by stress concentration of the stress pillar increased with the three working faces of Group D. The stress increased continuously, the stress increased 3.44 MPa and 5.84 Mpa, and the stress concentration coefficient was 1.21 and 1.37. The stress evolution law of D2 and F2 stress-monitoring points showed a trend of decreasing after increasing. When the working face was pushed to the stress-monitoring point, the stress increased continuously, and the stress began to decrease after pushing the stress-monitoring point. The difference was that the final stress of D2 stress-monitoring point was higher than the initial stress 1.35 MPa, which showed stress concentration, and the stress of the F2 stress-monitoring point eventually decreased to less than the initial stress 0.01 MPa, which showed a pressure-relief state. The G2 stress-monitoring point was located in the coal pillar area at the boundary of the stopping line of the Ding5.6-11050 working face. During the whole mining process of Group D coal seam, the stress of this stress-monitoring point continued to increase. When mining the Ding5.6-11050 working face, the stress increase trend was faster. After mining Group D coal seam, the stress in this area was pressurized. The stress increased by 2.48 MPa and the stress concentration factor was 1.16.
The stress evolution curve at 182 m of Group D coal floor was drawn, as shown in Figure 9c. The stress evolution law of the A3 and B3 stress-monitoring points was basically the same. In the mining process of the Ding5.6-11010 working face, the stress decreased first and then increased. There was a dynamic pressure-relief process. The maximum pressure-relief values were 0.42 MPa and 0.83 MPa, and the maximum pressure-relief ratio was 2.2% and 4.5%. In the subsequent mining process, the stress increased first and then decreased, and the stress basically returned to the initial stress state after mining. C3 and E3 were located below the coal pillar in Group D, and D3 was located outside the coal pillar. The stress evolution law of the three stress-monitoring points was consistent, and the stress increased first and then decreased. The stress increased 1.16 MPa, 1.13 MPa, and 1.12 MPa, and the stress concentration coefficient was about 1.06. F3 was located below the goaf of the Group D working face, and the stress increased first and then decreased. After the working face passed through the stress-monitoring point, the stress decreased. After mining, the stress showed a pressurized state, the final stress increased by 0.85 MPa, and the stress concentration factor was 1.05. During the entire Group D coal seam retrieval, the stress at the G3 stress-monitoring point continued to increase, and, finally, showed the pressurization state. The maximum stress value increased by 0.77 MPa and the stress concentration factor was 1.04.
The stress evolution curve at 260 m of Group D coal floor was drawn, as shown in Figure 9d. At the same time, the stress evolution law of Group F coal seam was characterized. The analysis showed that the change trend of measuring points between stresses was relatively close, and the final stress state was pressurization. Since this horizon was far away from the coal seam of Group D, quantitative analysis was not conducted. It could be seen from the analysis that the stress evolution law of each stress inter-measurement point was relatively close, and the final stress state was all expressed as increasing pressure. Since this seam was far away from the coal seam of Group D, quantitative analysis was not done.
The above analysis shows that there was a pressure-relief blind area under the protective coal pillar. The underlying stress concentration state under the protective coal pillar between the working faces was more prominent, and there was a dynamic pressure-relief area under the fracture area at both ends of the working face. It was more favorable to grasp this window period for gas drainage. After the mining of Group D coal seam was completed, the structure of the goaf was three working face goafs and two protective coal pillars. Whether it was the stress concentration phenomenon of the coal pillar or the pressure-relief effect, the effect decreased with the increase of the distance from the coal seam floor. Although the 87 m layer of the bottom plate was slightly affected by the mining of the protective layer of Group D, it still showed a strong regularity. To the deeper part of the bottom plate, the stress evolution trend of each monitoring point tended to be consistent, indicating that the influence effect is further weakened.

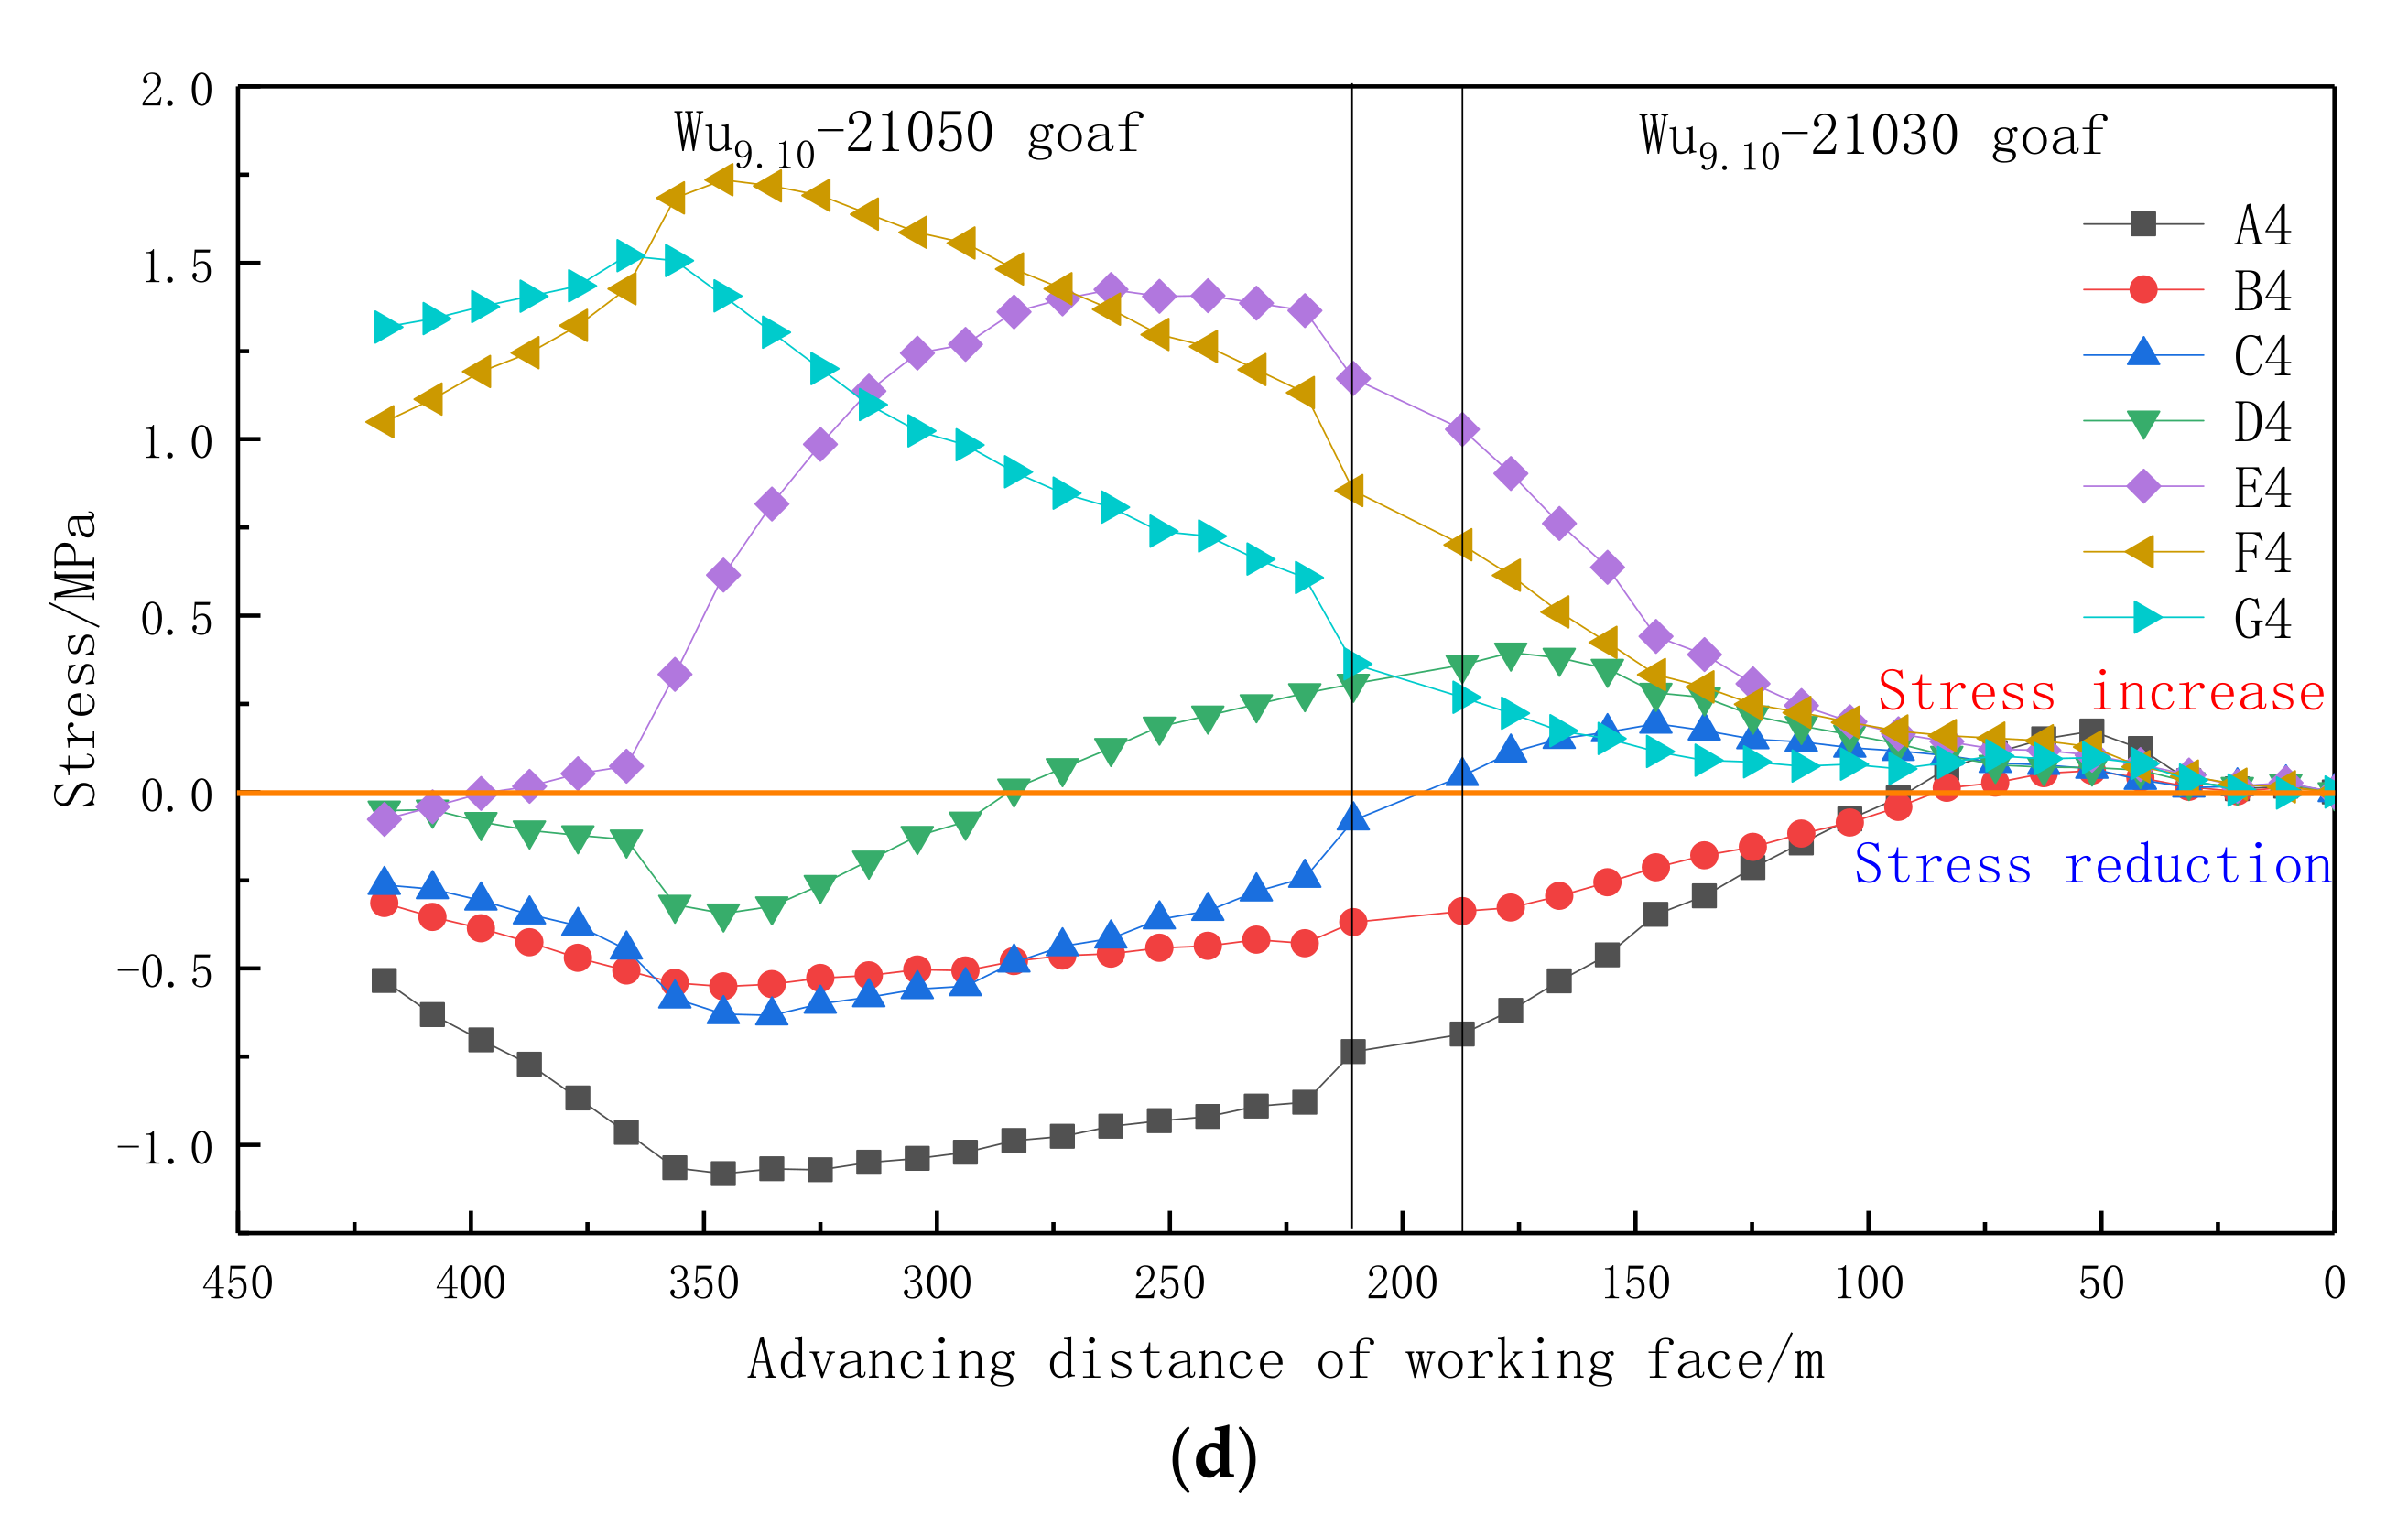
3.2.2. Stress Evolution Law of Different Layers of Mining Floor in Group E Coal Seam

After the completion of the coal mining in the Group D, the static model was stable after the stress of the model stabilized, and then the working face of the Group E coal seam was excavated. The Group E coal seam was arranged with two working faces, Wu9.10-21030 and Wu9.10-21050. After the mining of Group E coal seam working face, the stress values of stress-monitoring points at different buried depths and different positions of Group E coal seam floor were measured, and the stress evolution curves at different distances of the floor were drawn with the opening line of the Wu9.10-21030 working face as 0 point to study the change law of floor stress.
The curve of stress evolution law at 6 m from the coal seam floor of Group E was drawn. Since it was close to the coal seam floor and there was a large supporting stress under the coal pillar, in order to more clearly analyze the stress evolution law at different positions, the stress-monitoring points of this group were plotted in groups, as shown in Figure 10a,b. As shown in Figure 10a, the C2 stress-monitoring point was affected by both the bearing pressure and the coal pillar. The stress first increased by 12.8 MPa. After pushing through the stress-monitoring point, the stress value decreased by 8.63 MPa compared with the initial stress, and the maximum pressure-relief ratio was 54.2%, which showed that the pressure was relieved until the end of the mining of the working face of Group E coal seam. The stress value of D2 stress-monitoring point continued to increase. During the mining process of the Wu9.10-21050 working face, the stress increased rapidly until the coal pillar collapsed. The stress value area was stable. The stress increased to 113.1 MPa at most, and the stress concentration factor was 8.1. The E2 stress-monitoring point remained stable before advancing the monitoring point. When it was close to the stress-monitoring point, the stress increased, and the maximum stress increase value was 28.95 MPa. After pushing through the stress-monitoring point, the stress decreased, and the maximum stress decrease value was 16.5 MPa. The stress was completely relieved. After the reserved coal pillar in Group E collapsed, the stress value returned to above the initial stress. The analysis showed that the stress under the floor coal pillar of the Group E working face increased continuously and the risk increased with the advance of the working face. It was located in the fracture-affected area of goaf, and the stress could maintain the pressure-relief state for a long time. When it was located in the compaction area of the goaf, the stress presented a dynamic pressure-relief process.
As shown in Figure 10b, the stress trends of A2 and G2 were consistent, both of which were continuously pressurized. The A2 stress value finally increased by 6.52 MPa, and the stress concentration factor was 1.41. The G2 stress value finally increased by 1.71 MPa, and the stress concentration factor was 1.10. The increase of A2 stress value was larger than that of G2. The reason was that A2 was affected by the double superposition of boundary coal pillars of overlying Group D and Group E, while the overlying structure of G2 was the goaf of Group D and the boundary coal pillar of Group E, so this phenomenon appeared. The B2 and F2 stress-monitoring points were located below the separation zone at the open cut and stope line. When the working face passed through the stress-monitoring point, the stress showed a pressure-relief state, and the stress value was reduced by 1.37 MPa and 0.8 MPa, respectively. The pressure-relief ratio was 8.6% and 5.0%, respectively, and the duration of the pressure-relief state was long.
The stress evolution curve at 101 m of the coal seam floor of Group E was drawn, as shown in Figure 10c. The A3 stress-monitoring point stress value decreased. The maximum unloading value was 0.28 MPa, and the maximum unloading ratio was 1.5%. After the first working face was retrieved, the stress recovered the initial stress. Then the stress continued to rise, the final stress value increased by 1.35 MPa, and the stress concentration coefficient was 1.07. The stress of the C3 stress-monitoring point increased with the advance of the working face. The maximum stress value increased by 1.12 MPa, and the stress concentration factor was 1.06. As the stress-monitoring point was pushed, the stress value begun to decline and presented a pressure-relief state. The maximum stress value decreased by 1.42 MPa and the pressure-relief ratio was 7.76%. With the accumulation of the coal pillar damage, the stress value rose again until the coal pillar collapsed. The stress value was stable in the region, and, finally, the stress value at this point showed a state of increased pressure. The stress value continued to rise before the monitoring point, with a maximum increase of 1.58 MPa and a maximum stress concentration coefficient of 1.08. After the face pushed through this monitoring point, the stress started to decrease until it was lower than the initial stress, and after the face collapsed, the stress returned to the initial stress level with the compaction of the mining area. The maximum stress value increments were 1.10 MPa and 0.89 MPa, and the maximum stress concentration coefficients were 1.06 and 1.04, respectively. The stress value slightly decreased after the coal pillar collapsed.
The stress evolution curve at 179 m of the coal seam floor of Group E was drawn, as shown in Figure 10d. The stress values of the A4 and B4 stress points decreased first, and the stress values decreased by 1.08 MPa and 0.55 MPa at the most. The pressure-relief ratio was 5.3% and 2.7%, respectively. The stress of the coal pillar collapsed after the collapse of the coal pillar, but it was still lower than the original stress. The stress evolution trend of C4 and D4 was close to the same. The stress value increased before the advancing stress-monitoring point. After pushing through the C4 stress-monitoring point, the stress value began to decrease and it decreased to below the initial stress value. The stress value decreased by 0.63 Mpa and 0.34 MPa, respectively, at most. After the coal pillar collapsed, the stress value increased to close to the initial stress. The D4 stress-monitoring point was located below the group coal pillar, but there was still a pressure-relief phenomenon. The maximum pressure-relief ratio was 1.68%, indicating that the stress concentration phenomenon of the coal pillar had disappeared at this level. The coal pillar overlapped with the goaf of Group D. The structure could counteract the stress concentration effect caused by the coal pillar. The stress at the E4 stress-monitoring point increased first and then decreased. When the working face advanced to this monitoring point, the maximum stress value increased by 1.42 MPa, and the maximum stress concentration factor was 1.07. Then the stress begun to decrease until the working face was pushed, and the stress dropped below the initial stress value, which showed pressure relief. The F2 and G2 stress-monitoring points were located outside the boundary coal pillar of Group E, where the pressure-relief effect of the Group D goaf on this area was not reflected. The stress evolution law of the two stress-monitoring points was the same, which increased first. After the coal pillar collapsed, the stress value decreased slightly, but it was still higher than the initial stress, which was in a state of pressurization. The maximum stress value increased by 1.73 MPa and 1.51 MPa, and the stress concentration coefficient was 1.08 and 1.07, respectively.
Through the analysis, it could be seen that under the joint protection of the Group D and E coal seams, the dynamic unloading phenomenon occurred below the Group E mining area at the 101 m level of the bottom plate of the Group E, and the stress returned to a state higher than the initial stress after the workface meeting was over. During the back mining process of the Group E working face, the formed mining void area overlapped with the Group D coal pillar, and the monitoring points C3 and E3 were located below this structure, and both have dynamic pressure-relief processes, which indicated that the Group E mining void area played a cover role for the Group D coal pillar. The analysis showed that whether it was located in the goaf or under the coal pillar, the mining of Group E working face could relieve the pressure of its own coal seam. The pressure relief was a dynamic process. After the mining of the Group E working face was completed, the stress would rise to the stress level after the mining of the Group D working face. The goaf formed after the mining rock movement of the Group E working face was stable and it would promote the stress of the existing coal seam to return to the original in situ stress value, and the stress concentration of the island coal pillar had little impact on the existing coal seam. When mining with the double upper protective layer and when the spatial structure was in the form of the goaf and the coal pillar, it could play an important role in shielding and pressure relief, which is beneficial to the long-distance underlying protective layer.

3.3. Determination of Pressure-Relief Angle of Protective Layer in Group D and E Coal Seams

According to the Technical Specification for Protective Layer Mining, the protection range of the working face of the protective layer along the inclination direction could be delineated according to the unloading angle. The unloading angle is related to the coal seam inclination. When the coal seam inclination is 10°, the working face inclination unloading angle α, β are 75°. According to the theoretical pressure-relief angle, it could be modeled into a pressure-relief zone and a pressure-relief blind zone after retrieval, as shown in the Figure 11. The specifications stipulate that the effective vertical distance of pressure relief in upper protective layer mining is less than 50 m. However, with the deep development of coal mining, the interval between layers is greater than 50 m. Thakur [30] concluded from his study that the upper protective layer pressure relief may extend to 82.3 m below the protective layer, and reports of over 100 m upper protective layer mining were rare. In this paper, based on the research background of No. 1 mining area of Pingmei 8th coal mine, the maximum layer spacing reached 170 m. In the following, the stress evolution law of the underlying rock affected by the disturbance of the double upper protective layer was analyzed in detail through this experiment, so as to determine the influence of ultra-long-distance upper protective layer mining on the stress distribution of the coal and rock below.
In order to determine the pressure-relief range of Group E coal seam after mining of Group D coal seam, it was necessary to delimit the inclined pressure-relief angle. The stress-monitoring points DZ2-1, DZ2-2, and DZ2-3 investigated the relief angle of the upper side of the working face (Figure 12a). The stress values of the three measuring points decreased when the mining of the Ding5.6-11010 working faces was advanced, and the maximum value of measuring point DZ2-3 decreased by 3.16 MPa. With the continuous mining of the Ding5.6-11030 and the Ding5.6-11050 working faces, the stress increased to −1.94 MPa. The relief ratio was 10.5%, and it was still in the relief state, while the stress values of DZ 2-1 and DZ 2-2, basically, returned to the original stress states. The relief area was designated to the left of DZ2-3, and the upper relief angle was 65°, as shown in Figure 13.
In order to determine the pressure-relief area of Group F coal seam after the completion of coal mining in Group E, the inclination angle of pressure should be delineated. As shown in Figure 10d, after the mining of Group E coal seam, A4-E4 stress-monitoring points were lower than the original stress. After a certain stage of mining, the A4 stress-monitoring point of unloading the bottom plate on the upper side of Group E coal seam was always in the pressure-relief state. Until the mining of the working face of Group E coal seam was completed, the maximum stress value decreased by 1.08 MPa, and rose to −0.53 MPa at the end of mining. The pressure-relief ratio was 2.62%. Based on this point, the pressure-relief angle on the upper side of Group E coal seam was 88°. Pressure relief at the E4 stress-monitoring point of the bottom plate at the lower side of Group F coal seam. The stress had been reduced by 0.21 MPa, and the pressure-relief ratio was 1.03%. Based on this point, the pressure-relief angle of the lower side of the coal seam in the group had been defined as no less than 78°, and the pressure-relief lag distance of the working face was less than 61 m, as shown in Figure 14. It could be seen from this that the superposition mining of the double upper protective layers of Group D and Group E had an effect on expanding the protection scope of the coal seam of the protective layer.

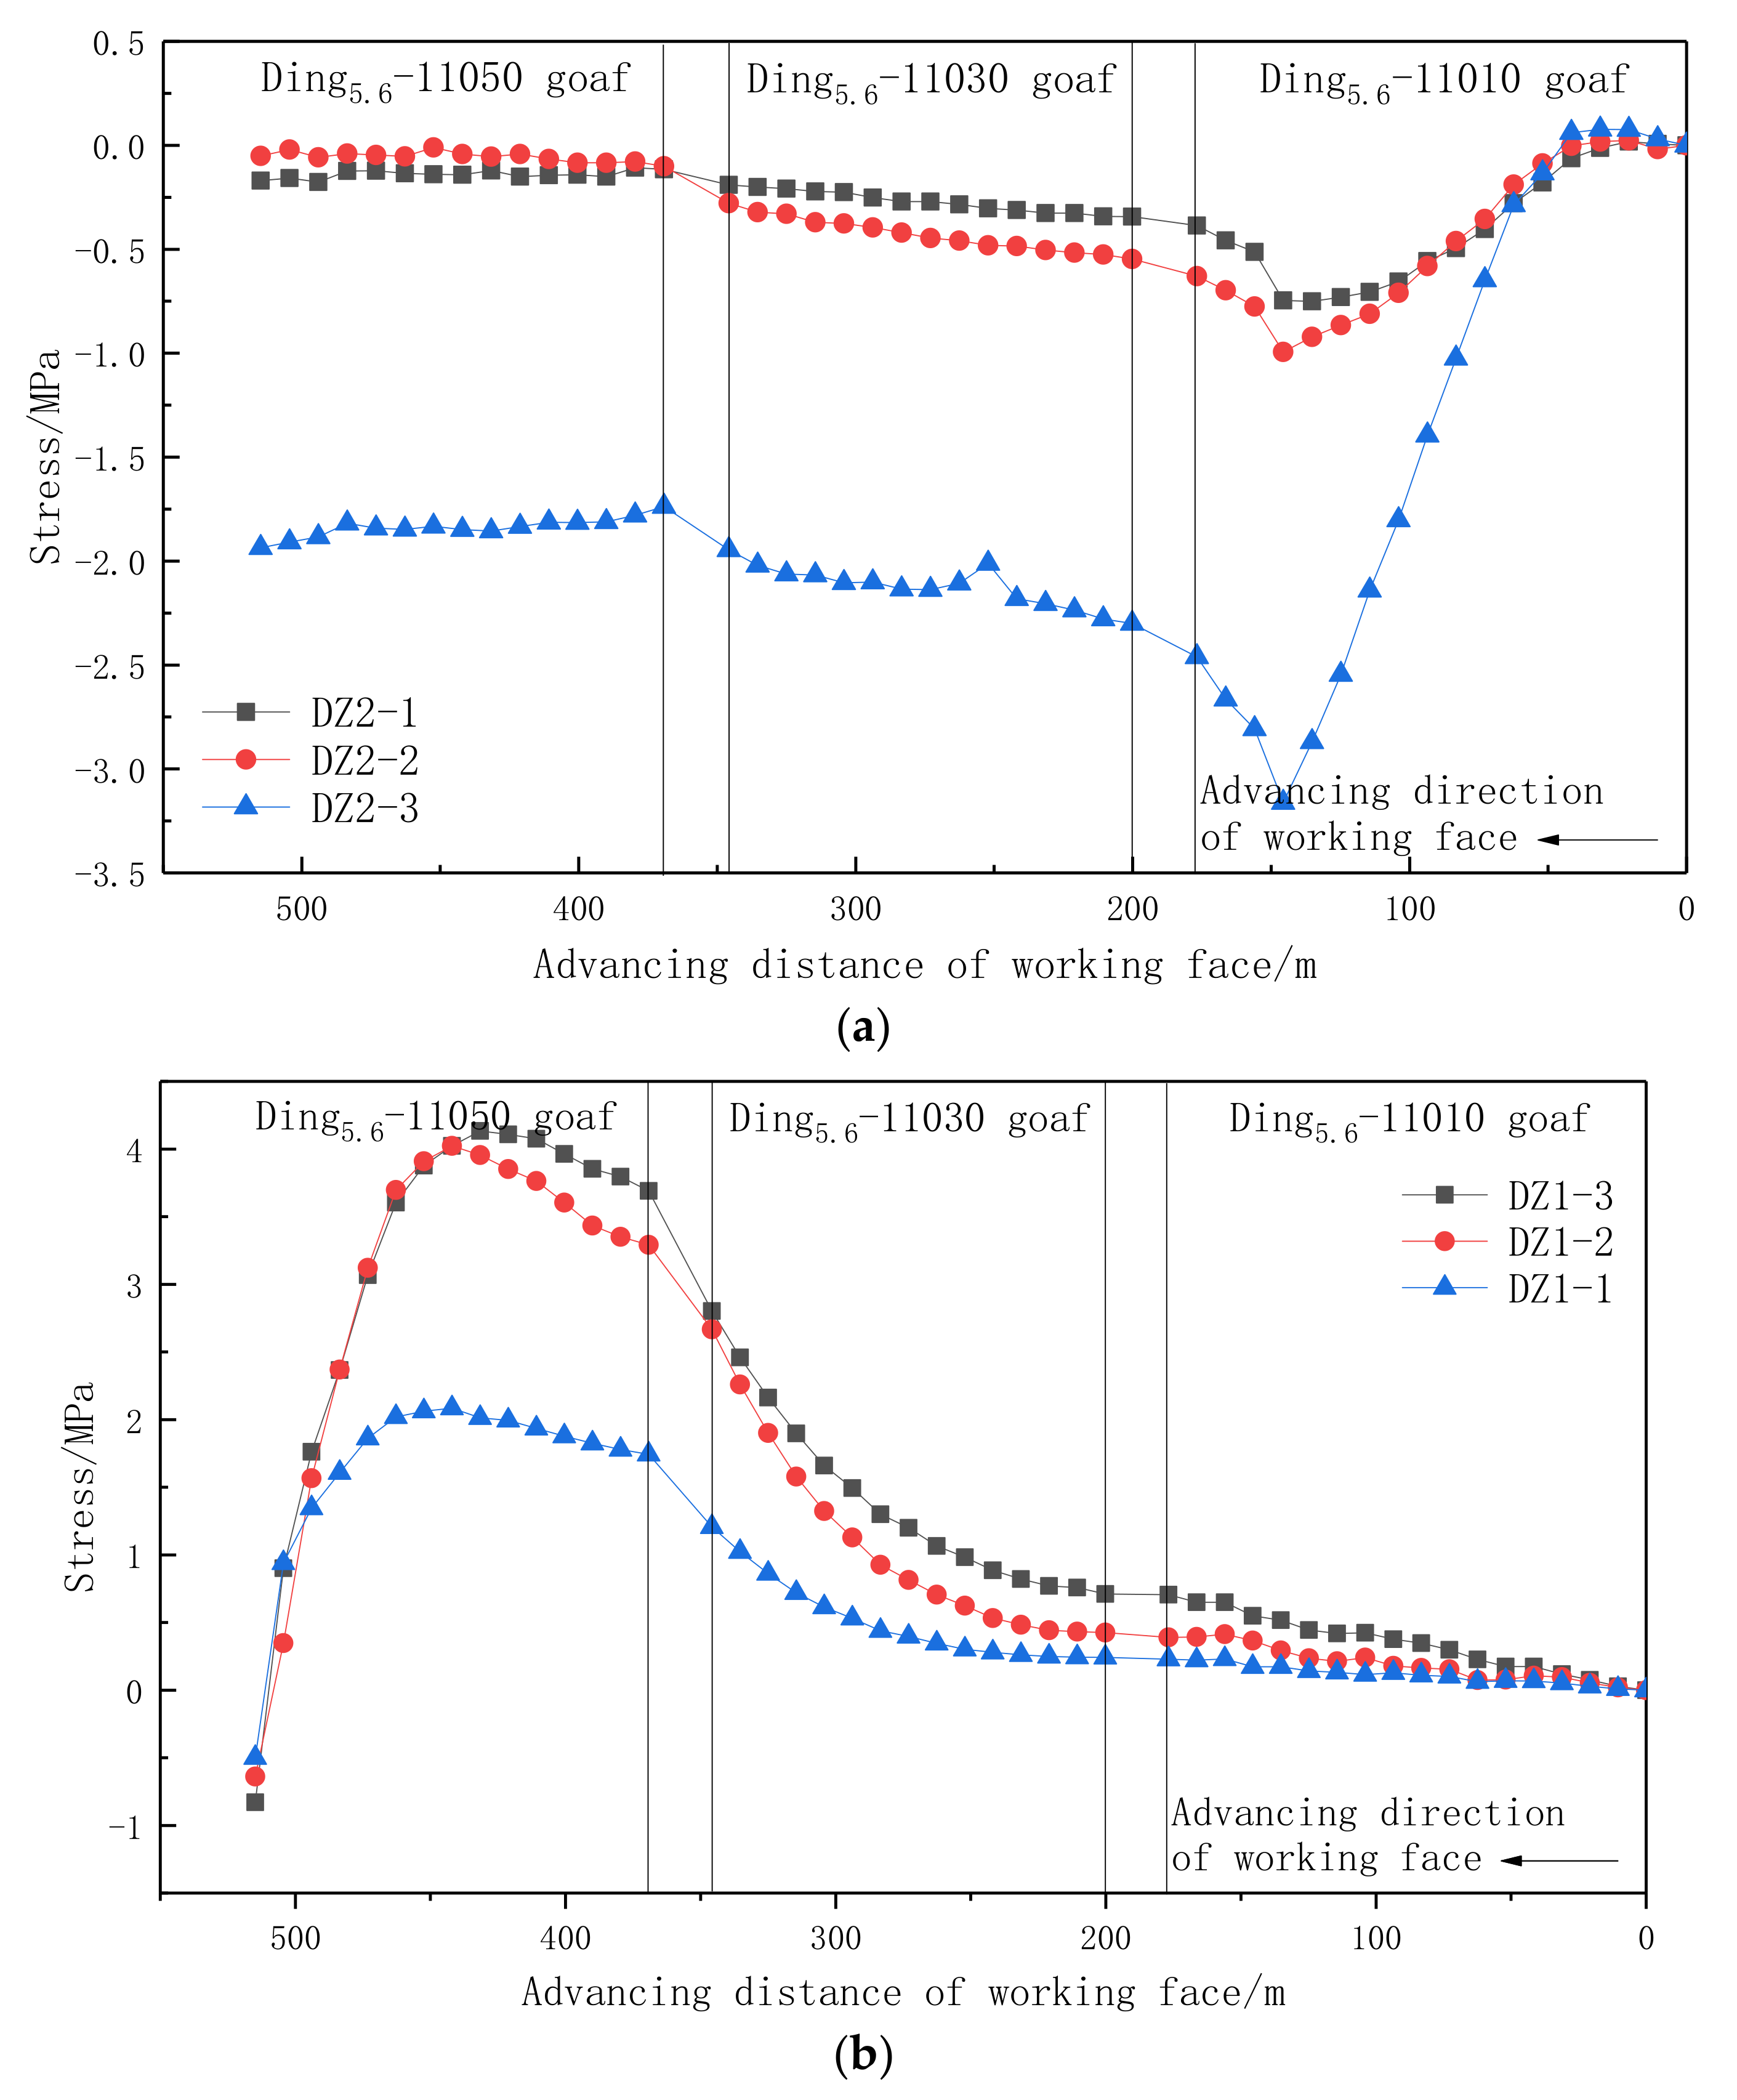
3.4. Field Verification

In order to verify the correctness of the simulation experiment results of similar materials, the field test of coal seam gas parameters was carried out according to the protection effect of different protection forms of coal seams. The original gas parameters of Group E and Group F coal seams and the gas parameters after the mining of the protective layer were tested, respectively. The protection effect of the protective layer after the mining of the double upper protective layer was determined by comparing the gas parameters. The test results are shown in Table 3.
According to the test results, when Group D coal seam protects Group E coal seam, the gas content was reduced by 40.6%, the gas pressure was reduced by 54.5%, and the permeability of coal seam was increased by 12.4 times. When the Group D and E coal seam protects the Group F coal seam, the gas content was reduced by 34.7%, the gas pressure was reduced by 23.5%, and the permeability of the coal seam was increased by 4.3 times. In order to achieve the purpose of gas control, it is necessary to grasp the pressure-relief window period and cooperate with gas drainage to control the gas in the working face of the protected layer.

4. Treatment and Mining Optimization Scheme of Protected Layer

(1)
Enhanced Extraction
Taking advantage of the dynamic pressure-relief opportunity of protective layer mining, densified boreholes were arranged in advance within 60 m behind the vertical projection of the working face of Group E coal seam to increase the negative pressure of drainage, grasp the pressure-relief window period, strengthen drainage, and improve the effect of gas control.
(2)
Optimization of working face layout
In order to ensure the safe production of the working face of the protective layer, when designing the working face position, on the premise of ensuring normal mining, the working face position should avoid the coal pillar stress influence area, so as to prevent the additional stress brought by the coal pillar from overlapping with the supporting pressure formed during the advancement of the working face of the protective layer, resulting in coal and gas outburst accidents.
(3)
Optimization of Roadway layout
In order to avoid the roadway in the area with large, superimposed stress, before roadway layout, measure the stress around the location, adjust it appropriately according to the situation, and select the location with low stress value but no change of other factors. Reduce the risk of coal and gas outburst in the process of roadway excavation.
(4)
Strengthen monitoring
In the stress superposition area, an on-line stress-monitoring system shall be installed in the roadway to monitor the stress change in the roadway in real time. If there is a trend of stress increase during the advancement of the working face and roadway excavation, the mining speed shall be reduced to ensure safe production.

5. Conclusions

Taking the No. 1 mining area of Pingmei 8th coal mine as the research background, through the simulation experiment of long-distance superposition mining of similar materials in Group D and Group E coal seams, this paper analyzes the overburden collapse structure and the stress evolution law of different layers of the floor after mining of Group D and Group E coal seams, and analyzes the stress evolution law of self-contained coal seams in the whole process of mining of Group D and Group E coal seams. The conclusions are as follows:
(1)
Pressure relief is a dynamic process. The goaf formed after the rock movement is stable after the mining of the working face promote the stress of the existing coal seam to return to the original in situ stress value. Under the condition of superposition and staggered mining of working faces of Group D and Group E, the stress concentration phenomenon of coal pillar between working faces of Group D or Group E in the mining process of upper and lower layers of working face is weakened, playing the effect of mutual shielding.
(2)
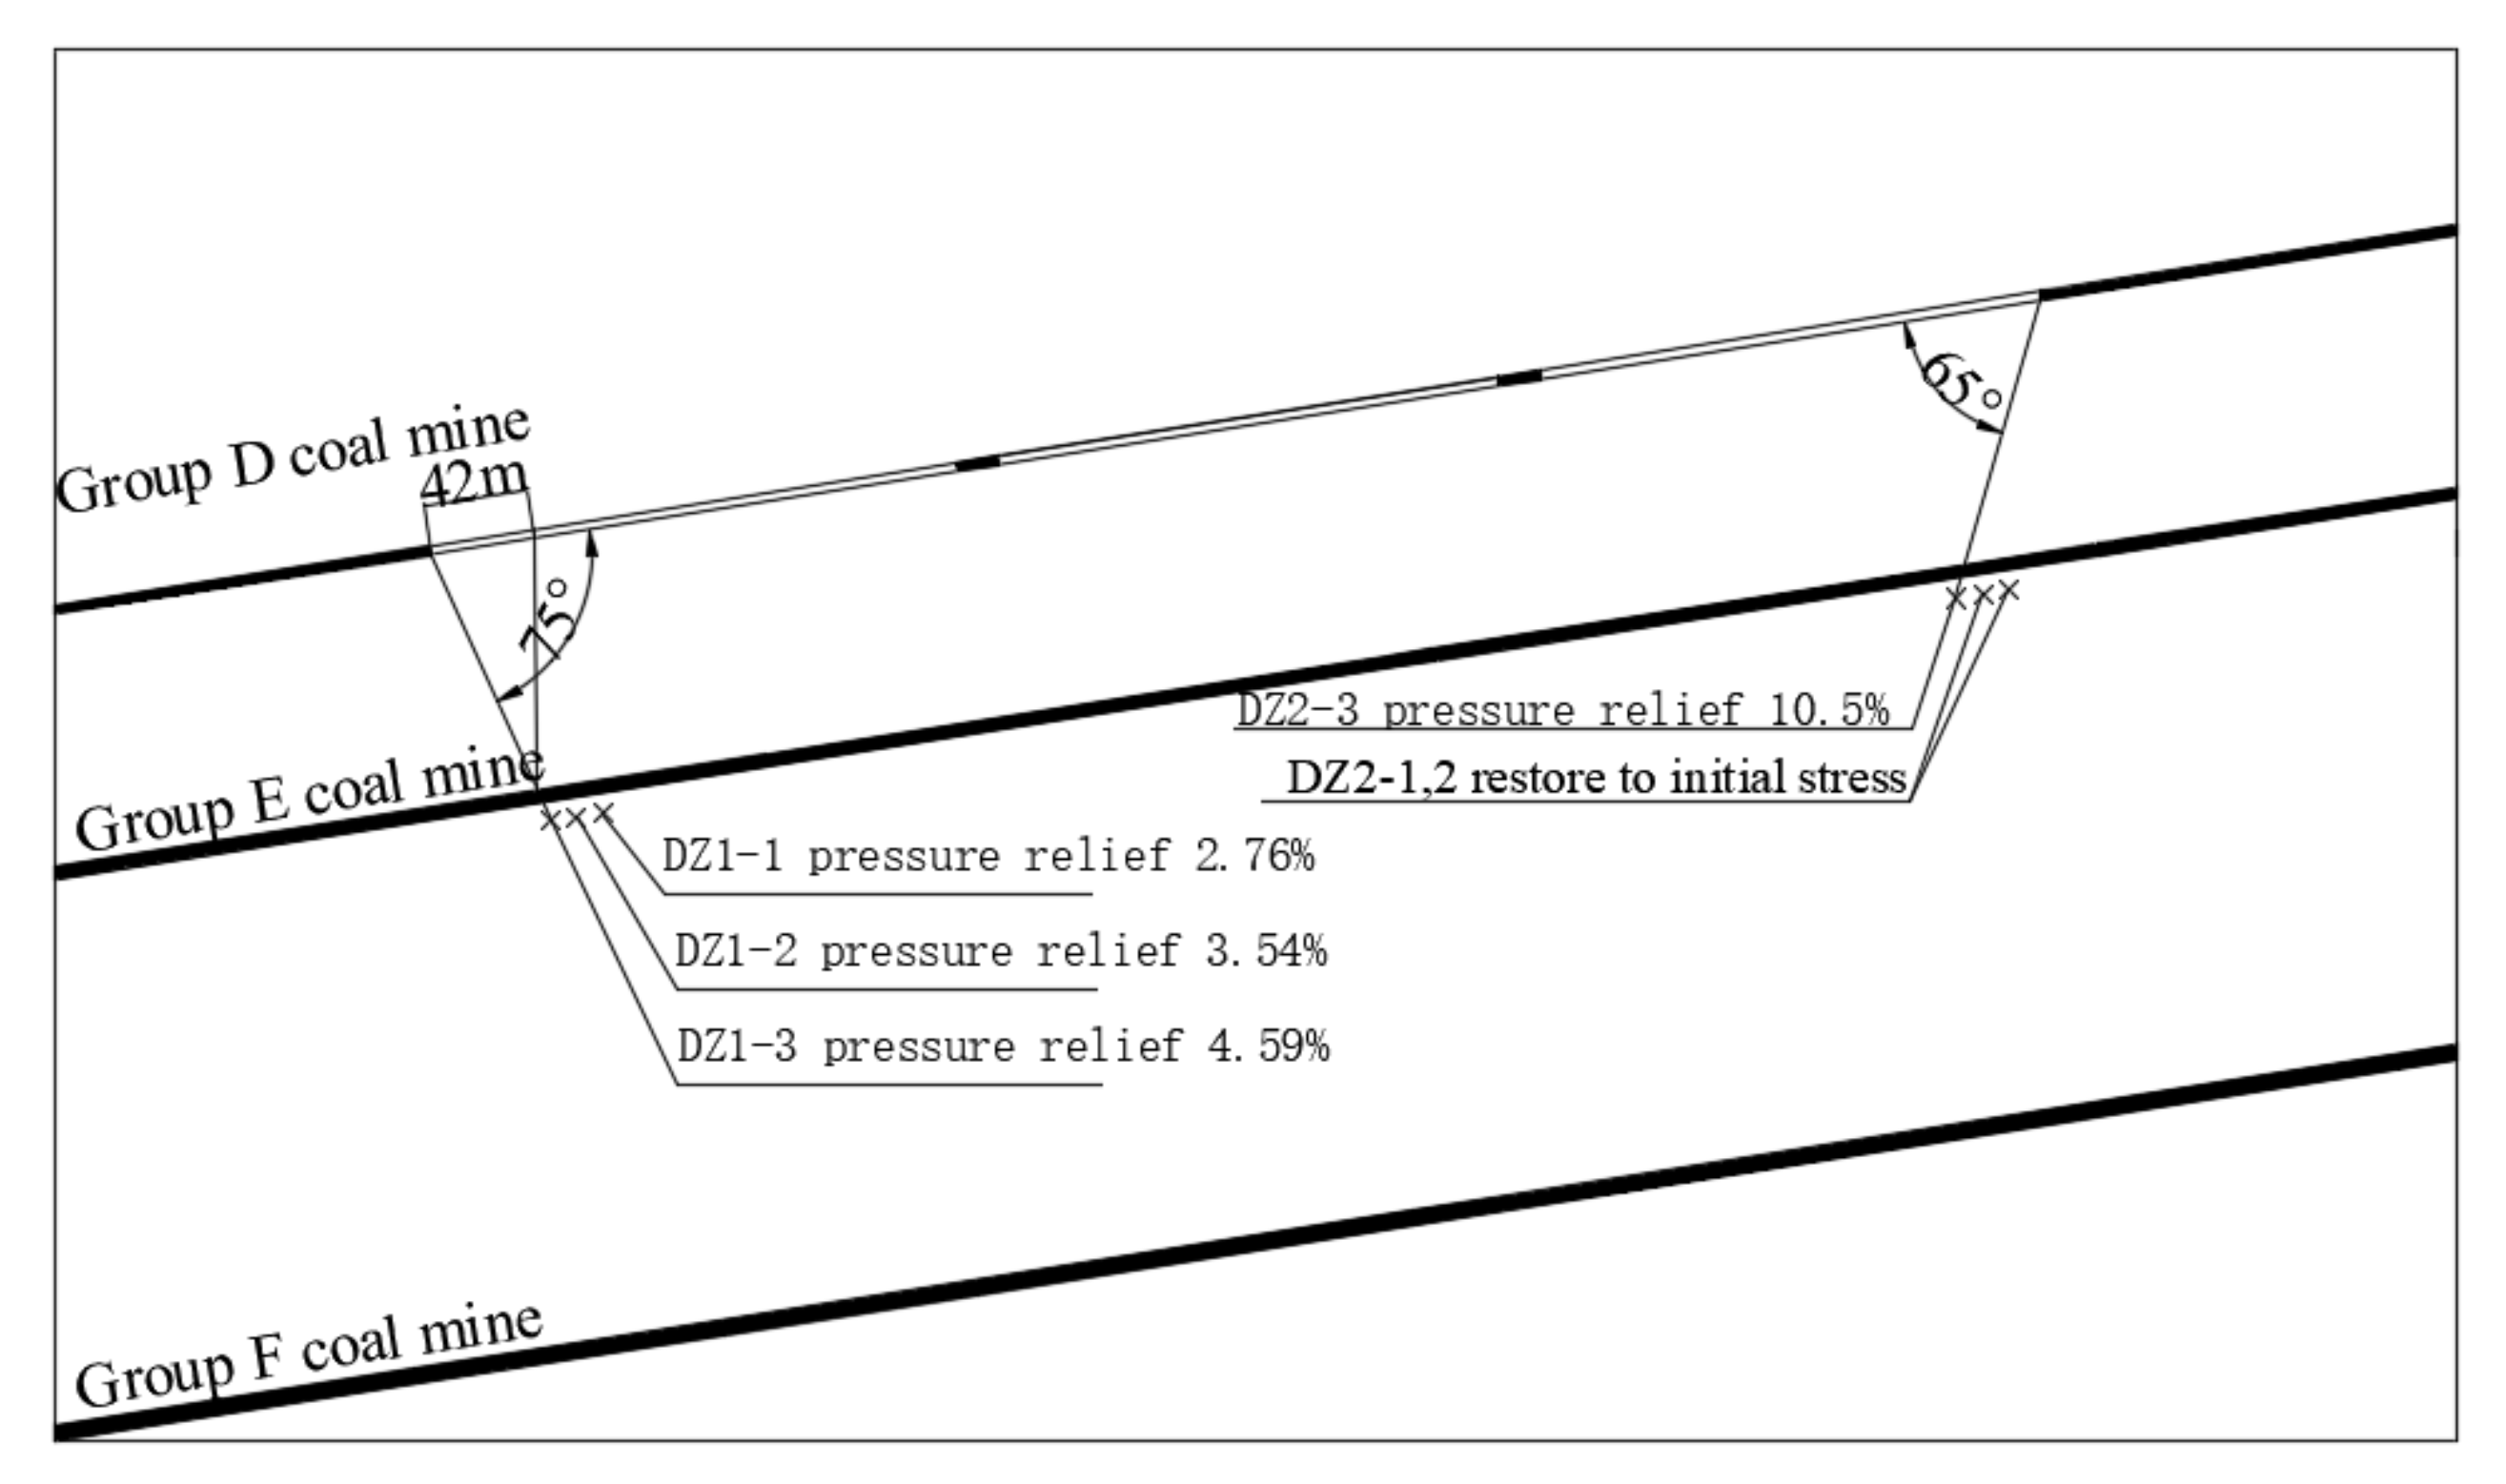
The mining of Group D coal seam has a certain impact on Group E coal seam. The maximum pressure-relief ratio is 4.7%. The coal pillar left after mining causes stress concentration in Group E coal seam, and the maximum stress concentration factor is 1.37. The maximum influence depth of the floor can reach 182 m. After the mining of Group D coal seam is completed, the pressure-relief angle of Group E coal seam in the protective layer is 65° on the upper side and 75° on the lower side. The distance behind the vertical projection of Group D working face is 42 m.
(3)
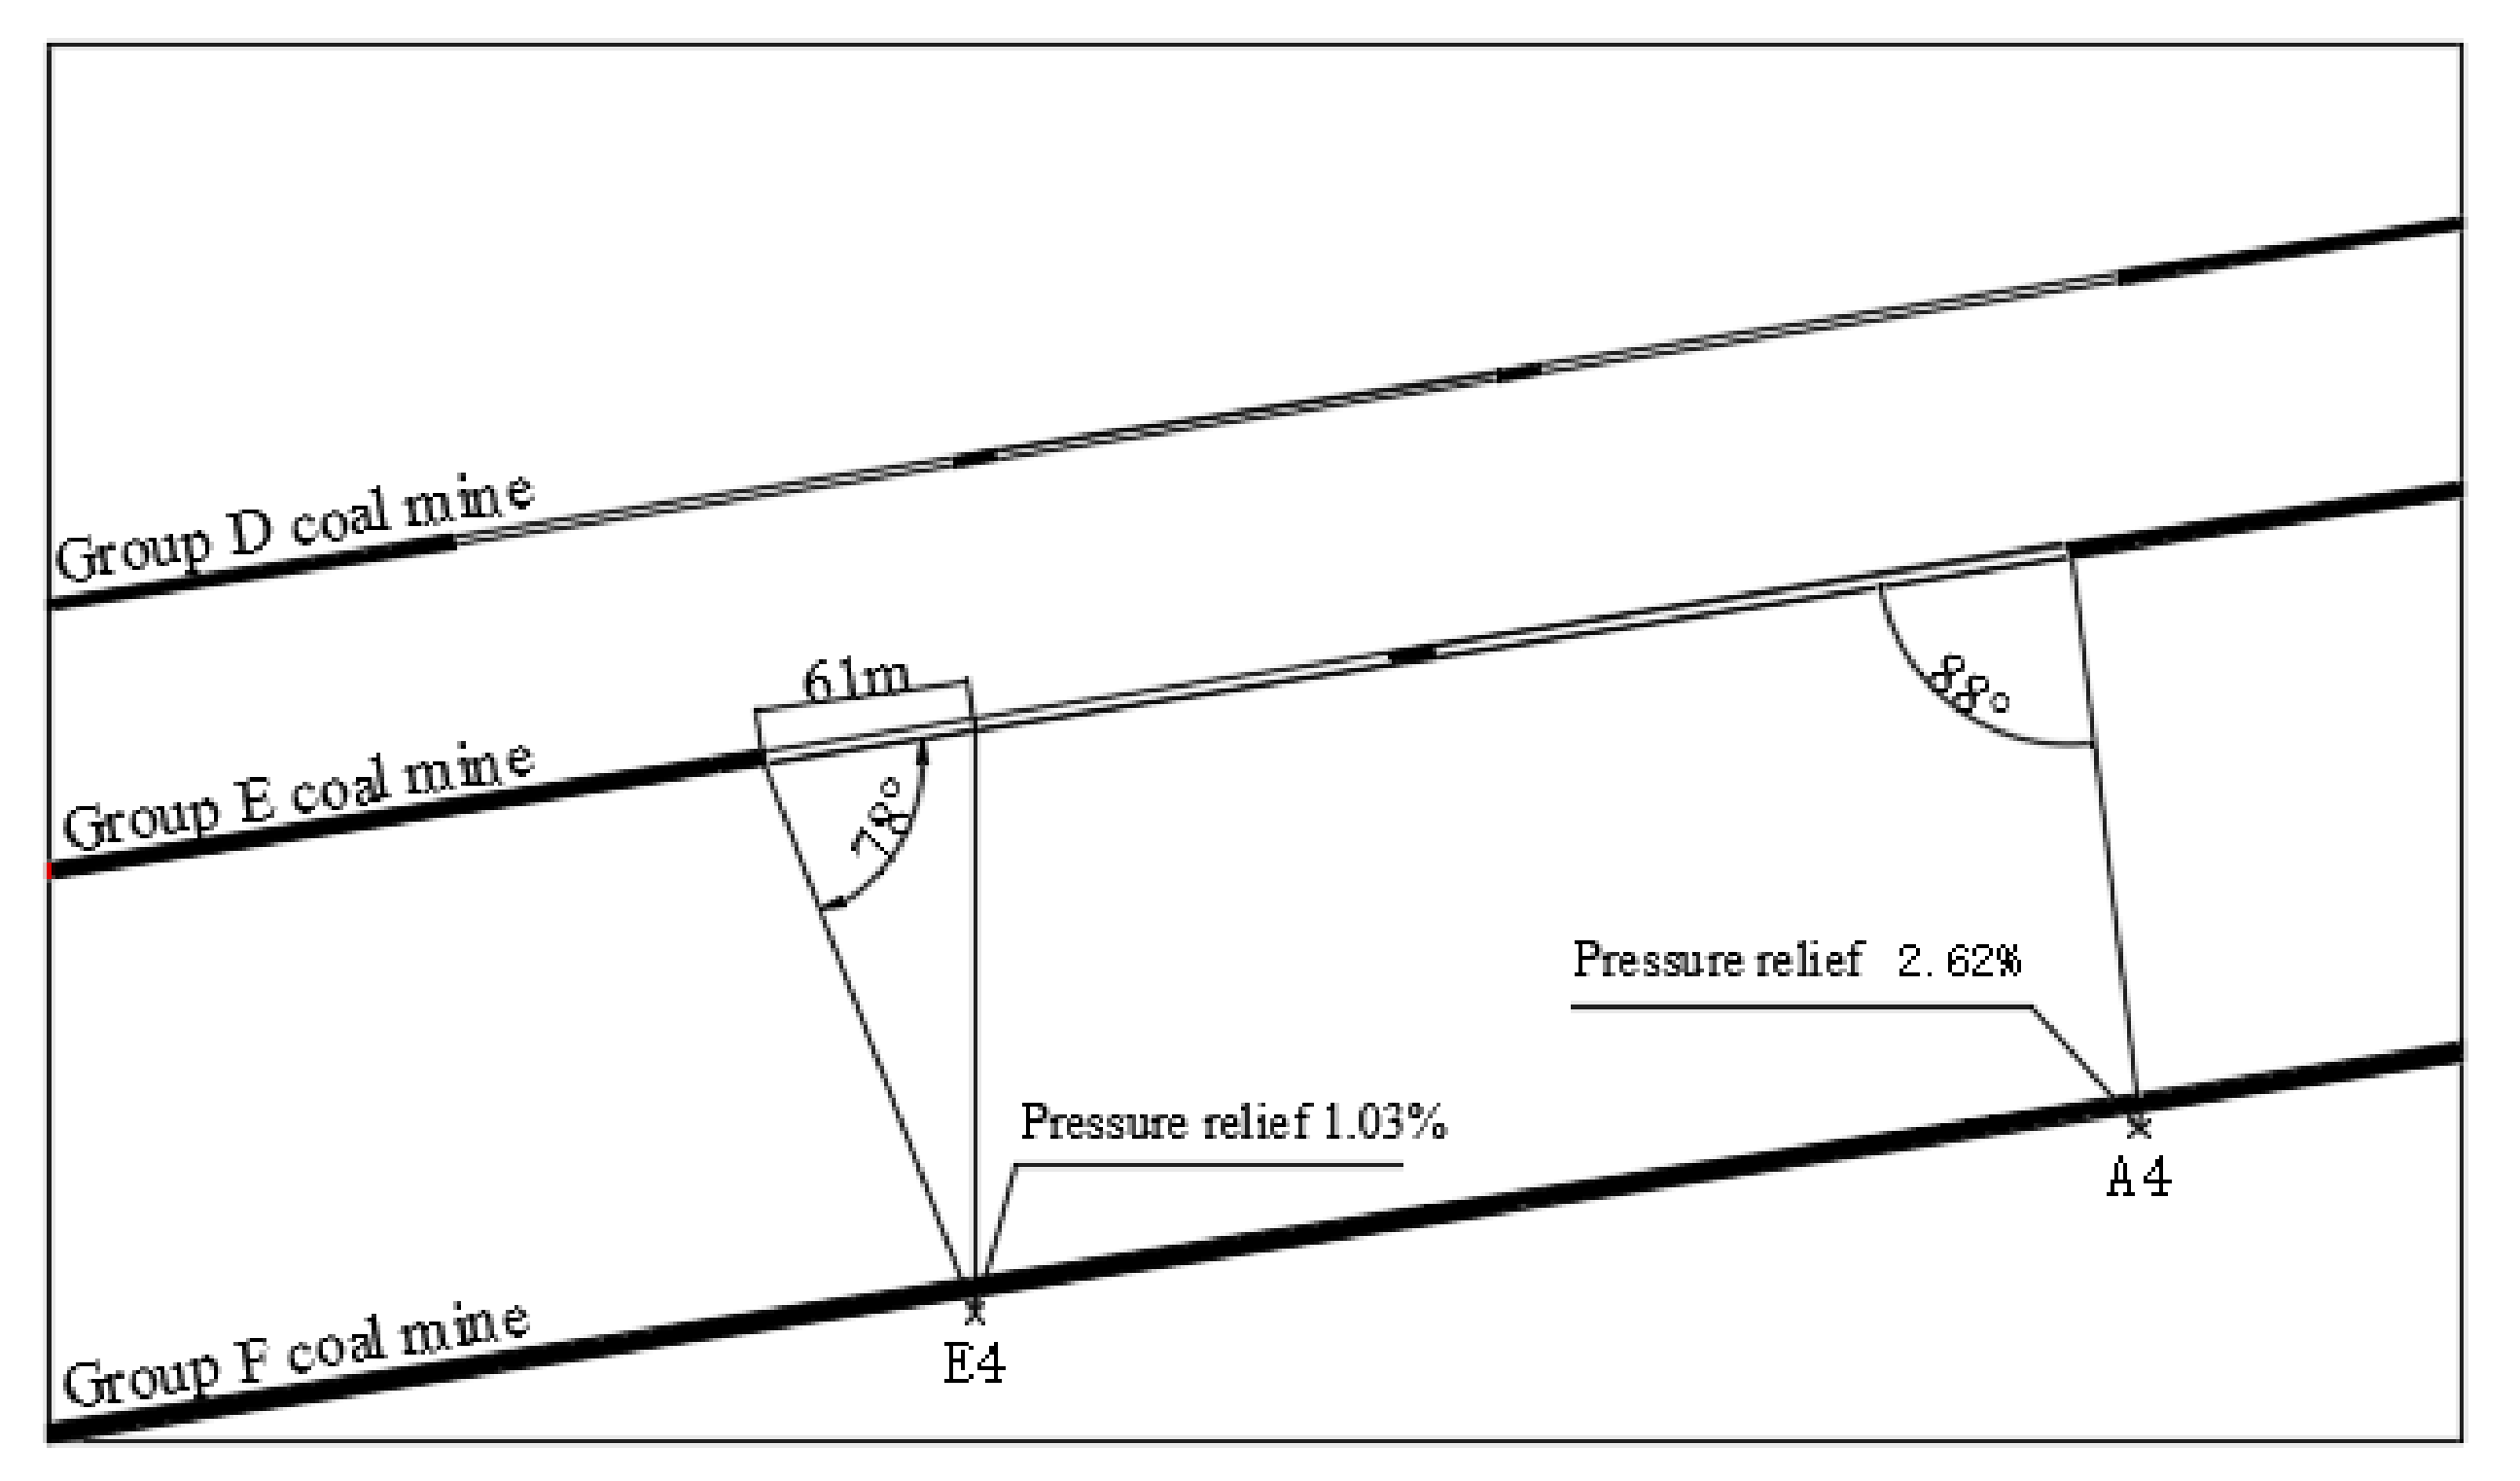
The superimposed mining of Group D and Group E will affect the stress distribution of Group F coal seam. In the mining process of Group E coal seam, 101 m of the floor is affected by the different structure of the overlying superimposed goaf and coal pillar. The maximum pressure-relief ratio is 5.3%. The overlying coal pillar has little impact on Group I coal seam. After the mining of Group E coal seam is completed, the upper side of the protective layer has been affected by the protection of the double protective layer. The pressure-relief angle can reach 88°, the pressure-relief angle of the lower side is greater than 78°, and the distance behind the vertical projection of the working face of Group E is less than 61 m. The mining of the double protective layer can expand the protective layer.
(4)
Through field verification, it can be seen that when the coal seam of Group D protects the coal seam of Group E, the gas content is reduced by 40.6%, the gas pressure is reduced by 54.5%, and the coal seam permeability is increased by 12.4 times. When the coal seam of Group D and E protect the coal seam of Group F, the gas content is reduced by 34.7%, the gas pressure is reduced by 23.5%, and the coal seam permeability is increased by 4.3 times.

Author Contributions

Validation, X.-Y.Z.; Writing—original draft, S.-J.F.; Writing—review & editing, B.L., W.-J.S., Z.-S.S., J.-F.H. and B.-F.W. All authors have read and agreed to the published version of the manuscript.

Funding

National Natural Science Foundation of China: 51874166; National Natural Science Foundation of China: 52004118; Project supported by discipline innovation team of Liaoning Technical University: LNTU20TD-11.

Conflicts of Interest

The authors declare no conflict of interest.

References

  1. Yang, W.; Lin, B.Q.; Qu, Y.A.; Zhao, S.; Zhai, C.; Jia, L.L.; Zhao, W.Q. Mechanism of strata deformation under protective seam and its application for relieved methane control. Int. J. Coal Geol. 2011, 85, 300–306. [Google Scholar] [CrossRef]
  2. Liu, Z.; Cheng, Y.; Liu, Q.; Jiang, J.; Li, W.; Zhang, K. Numerical assessment of CMM drainage in the remote unloaded coal body: Insights of geostress-relief gas migration and coal permeability. J. Nat. Gas Sci. Eng. 2017, 45, 487–501. [Google Scholar] [CrossRef]
  3. Sun, P.; Sun, H.; Lin, F.; Yang, X.; Jiang, W.; Wu, W.; Jia, Q. Experimental study on the ratio model of similar materials in the simulation test of coal and gas outburst. Sci. Rep. 2021, 11, 13513. [Google Scholar] [CrossRef] [PubMed]
  4. Tian, X.; Song, D.; He, X.; Li, Z.; Liu, H.; Wang, W. Investigation on micro-surface adhesion of coals and implications for gas occurrence and coal and gas outburst mechanism. J. Nat. Gas Sci. Eng. 2021, 94, 104115. [Google Scholar] [CrossRef]
  5. Wang, L.; Lu, Z.; Chen, D.P.; Liu, Q.Q.; Chu, P.; Shu, L.Y.; Wen, Z.J. Safe strategy for coal and gas outburst prevention in deep-and-thick coal seams using a soft rock protective layer mining. Saf. Sci. 2020, 129, 104800. [Google Scholar] [CrossRef]
  6. Zhang, Z.; Zhang, R.; Xie, H.; Gao, M.; Xie, J. Mining-induced coal permeability change under different mining layouts. Rock Mech. Rock Eng. 2016, 49, 3753–3768. [Google Scholar] [CrossRef]
  7. Yang, M.Q.; Xie, H.P.; Gao, M.Z.; He, Z.Q.; Li, C.; Xie, J.; Yang, B.G. On distribution characteristics of the temperature field and gas seepage law of coal in deep mining. Therm. Sci. 2020, 24, 3923–3931. [Google Scholar] [CrossRef]
  8. State Administration of Coal Mine Safety. Detailed Rules for Prevention and Control of Coal and Gas Outburst; China Coal Industry Publishing House: Beijing, China, 2019. [Google Scholar]
  9. Gao, R.; Yu, B.; Xia, H.; Duan, H. Reduction of stress acting on a thick, deep coal seam by protective-seam mining. Energies 2017, 10, 1209. [Google Scholar] [CrossRef] [Green Version]
  10. Sun, Q.; Zhang, J.; Zhang, Q.; Yin, W.; Germain, D. A protective seam with nearly whole rock mining technology for controlling coal and gas outburst hazards: A case study. Nat. Hazards 2016, 84, 1793–1806. [Google Scholar] [CrossRef]
  11. Jin, K.; Cheng, Y.; Wang, W.; Liu, H.; Liu, Z.; Zhang, H. Evaluation of the remote lower protective seam mining for coal mine gas control: A typical case study from the Zhuxianzhuang Coal Mine, Huaibei Coalfield, China. J. Nat. Gas Sci. Eng. 2016, 33, 44–55. [Google Scholar] [CrossRef] [Green Version]
  12. Jia, T.; Zhang, Z.; Tang, C.; Zhang, Y. Numerical simulation of stress-relief effects of protective layer extraction. Arch. Min. Sci. 2013, 58, 521–540. [Google Scholar]
  13. Wang, H.; Cheng, Y.; Yuan, L. Gas outburst disasters and the mining technology of key protective seam in coal seam group in the Huainan coalfield. Nat. Hazards 2013, 67, 763–782. [Google Scholar] [CrossRef]
  14. Noack, K. Control of gas emissions in underground coal mines. Int. J. Coal Geol. 1998, 35, 57–82. [Google Scholar] [CrossRef]
  15. Flores, R.M. Coalbed methane: From hazard to resource. Int. J. Coal Geol. 1998, 35, 3–26. [Google Scholar] [CrossRef]
  16. Li, Q.M. The Damage and Seepage Flow Characteristics of Coal under Conditions of Poly-Protection and the Rationality Evaluation of the Coal Mining and Excavation Deployment. Ph.D. Thesis, Chongqing University, Chongqing, China, 2019. [Google Scholar]
  17. Li, S.Q.; He, X.Q.; Li, S.Q.; Zhang, S.J.; Yan, Z.; Jie, Q.X. Experimental research on strata movement and fracture dynamic evolution of double pressure-relief mining in coal seams group. J. China Coal Soc. 2013, 38, 2146–2152. [Google Scholar]
  18. Li, M.; Qu, C.; Lin, B.Q.; Liao, K.B.; Jia, H.Q.; Zhang, J. Study on space-time evolution of stress under double pressure relief in composite coal seam group. Saf. Coal Mines 2015, 46, 39–43. [Google Scholar]
  19. Kong, X.Y.; Yang, K.; Lu, W. Floor failure mechanism and engineering application of downward mining of the large dip angle coal seam group. Chin. J. Undergr. Space Eng. 2015, 11, 394–400. [Google Scholar]
  20. Cheng, Z.H.; Qi, Q.X.; Li, H.Y.; Zhang, L.; Liu, X.G. Evolution of the superimposed mining induced stress-fissure field under extracting of close distance coal seam group. J. China Coal Soc. 2016, 41, 367–375. [Google Scholar]
  21. Yang, W.; Lin, B.Q.; Qu, Y.A.; Li, Z.W.; Zhai, C.; Jia, L.L.; Zhao, W.Q. Stress evolution with time and space during mining of a coal seam. Int. J. Rock Mech. Min. Sci. 2011, 48, 1145–1152. [Google Scholar] [CrossRef]
  22. Xiong, Y.; Kong, D.; Wen, Z.; Wu, G.; Liu, Q. Analysis of coal face stability of lower coal seam under repeated mining in close coal seams group. Sci. Rep. 2022, 12, 509. [Google Scholar] [CrossRef]
  23. Zhang, C.; Feng, R.; Zhang, X.; Shen, W. Numerical Study on Stress Relief and Fracture Distribution Law of Floor in Short-Distance Coal Seams Mining: A Case Study. Geotech. Geol. Eng. 2021, 39, 437–450. [Google Scholar] [CrossRef]
  24. Jiang, J.; Cheng, Y.; Zhang, P.; Jin, K.; Cui, J.; Du, H. CBM drainage engineering challenges and the technology of mining protective coal seam in the Dalong Mine, Tiefa Basin, China. J. Nat. Gas Sci. Eng. 2015, 24, 412–424. [Google Scholar] [CrossRef]
  25. Tu, Q.; Cheng, Y. Stress evolution and coal seam deformation through the mining of a remote upper protective layer. Energy Sources Part A Recovery Util. Environ. Eff. 2019, 41, 338–348. [Google Scholar] [CrossRef]
  26. Yuan, Z.; Shao, Y.; Zhu, Z. Similar material simulation study on protection effect of steeply inclined upper protective layer mining with varying interlayer distances. Adv. Civ. Eng. 2019, 2019, 9849635. [Google Scholar] [CrossRef] [Green Version]
  27. Cheng, Y.P.; Wang, H.F.; Wang, L.; Zhou, H.X.; Liu, H.Y.; Liu, H.B.; Li, W. Theories and Engineering Applications on Coal Mine Gas Control; China University of Mining and Technology Press: Xuzhou, China, 2010. [Google Scholar]
  28. Wang, Y.Q.; Wang, X.; Zhang, J.S.; Yang, B.S.; Zhu, W.J.; Wang, Z.P. Similar experimental study on retaining waterproof coal pillar in composite strata mining. Sci. Rep. 2022, 12, 1366. [Google Scholar] [CrossRef] [PubMed]
  29. Ma, J.; Hou, C.; Hou, J. Numerical and similarity simulation study on the protection effect of composite protective layer mining with gently inclined thick coal seam. Shock. Vib. 2021, 2021, 6679199. [Google Scholar] [CrossRef]
  30. Kissell, F.N.; Diamond, W.P.; Beiter, D.A.; Taylor, C.D.; Goodman, G.V.R.; Cecala, A.B.; Urosek, J.E.; Francart, W.J.; Thakur, P.C.; Ulery, J.P.; et al. Handbook for Methane Control in Mining; Pittsburgh Research Laboratory (National Institute for Occupational Safety and Health): Cincinnati, OH, USA, 2006. Available online: https://stacks.cdc.gov/view/cdc/6882 (accessed on 27 April 2022).
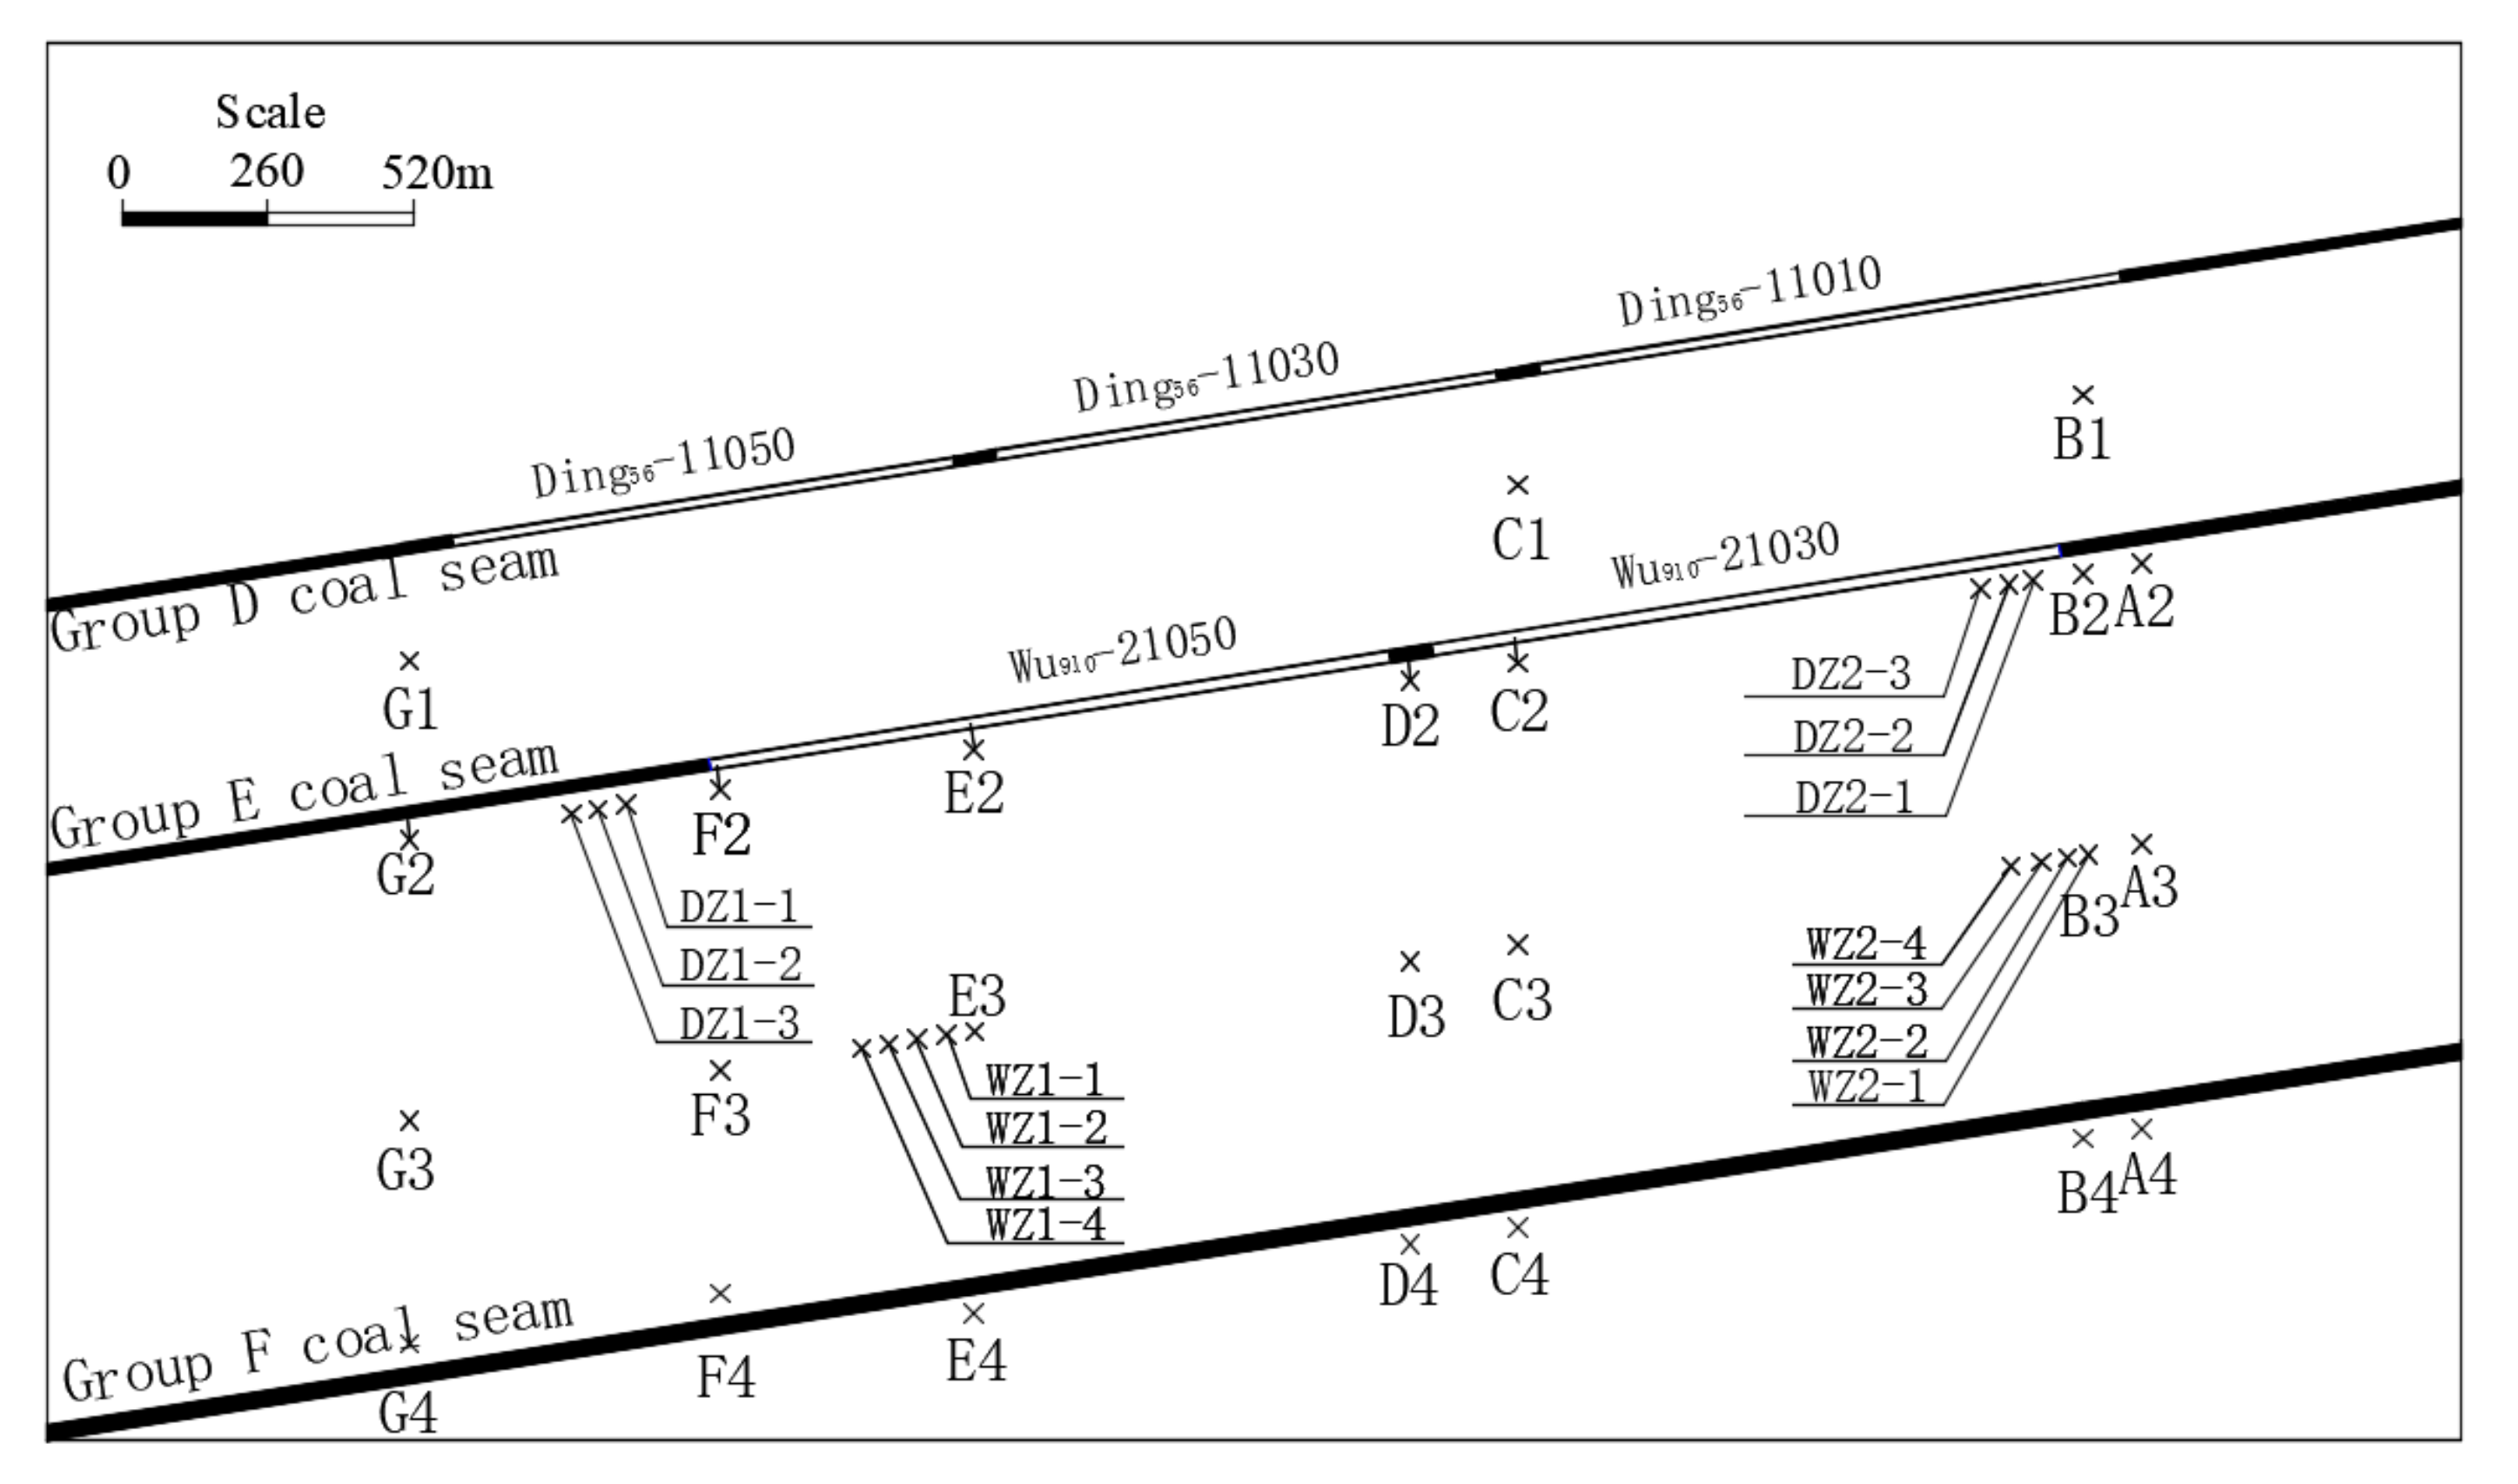
Figure 1. Spatial distribution of the working face.
Energies 15 04459 g001
Figure 2. Arrangement of stress measurement points.
Energies 15 04459 g002
Figure 3. Similar material model.
Energies 15 04459 g003
Figure 4. Drawing of roof caving and displacement in mining of Group D coal seam: (a) Displacement vector diagram at the end of mining in the Group D working face; (b) Overburden collapse at the end of the Group D workings.
Energies 15 04459 g004
Figure 5. Drawing of roof caving and displacement in mining of Group E coal seam: (a) Wu 9.10-21030 working face advancing 197.6 m; (b) Wu 9.10-21030 working face advancing 208 m; (c) Wu 9.10-21050 working face advancing 124.8 m; (d) Wu 9.10-21050 working face advancing 135.2 m; (e) Wu 9.10-21050 working face advancing 145.6 m; and (f) partial drawing of coal pillar collapse.
Energies 15 04459 g005
Figure 6. Drawing of roof caving and displacement in mining of Group E coal seam.
Energies 15 04459 g006
Figure 7. Stress system distribution of the protective layer under the influence of the coal pillar.
Energies 15 04459 g007
Figure 8. Stress transfer diagram of the coal pillar.
Energies 15 04459 g008
Figure 9. Stress evolution law of different layers of floor during the mining of Group D coal seam: (a) Evolution law of floor 33 m stress in the mining process of Group D coal seam; (b) Evolution law of floor 87 m stress in the mining process of Group D coal seam; (c) Evolution law of floor 182 m stress in the mining process of Group D coal seam; and (d) Evolution law of floor 260 m stress in the mining process of Group D coal seam.
Energies 15 04459 g009aEnergies 15 04459 g009b
Figure 10. Stress evolution law of different layers of floor during mining of Group E coal seam: (a) Evolution law of floor 6 m stress in the mining process of Group E coal seam; (b) Evolution law of floor 6 m stress in the mining process of Group E coal seam; (c) Evolution law of floor 101 m stress in the mining process of Group E coal seam; and (d) Evolution law of floor 179 m stress in the mining process of Group E coal seam.
Energies 15 04459 g010aEnergies 15 04459 g010b
Figure 11. Model pressure-relief range.
Energies 15 04459 g011
Figure 12. Evolution diagram of pressure-relief angular stress in coal seam of Group E: (a) Pressure-relief angle of the upper slope of Group E coal seam; and (b) Pressure-relief angle of the lower slope of Group E coal seam.
Energies 15 04459 g012
Figure 13. Pressure-relief range of Group E coal seam.
Energies 15 04459 g013
Figure 14. Pressure-relief range of Group F coal seam.
Energies 15 04459 g014
Table 1. Description table of arrangement of the stress-monitoring points.
Group1234Vertical Line Position
A——A2A3A4Ding5.6-11010 opening line projection right 30 m
BB1B2B3B4Wu9.10-21030 opening line projection left 6 m
CC1C2C3C4Coal pillar between Ding5.6-11010 and Ding5.6-11030
D——D2D3D4Coal pillar between Wu9.10-21030 and Wu9.10-21050
E——E2E3E4Coal pillar between Ding5.6-11030 and Ding5.6-11050
F——F2F3F4Wu9.10-21030 stopping line projection left 13.5 m
GG1G2G3G4Ding5.6-11050 stopping line projection left 13.5 m
Location of survey line along the floorGroup D coal seam floor 40 mGroup E coal seam floor 6 mGroup E coal seam floor 101 mGroup F coal seam roof or floor 6 mRemarks: DZ, WZ are stress-monitoring points for pressure-relief angle inspection
Table 2. Mechanical parameter of protolith and model.
Rock CharacterModel Thickness
/cm
Prototype Compressive Strength
/MPa
Model Compressive Strength
/MPa
Model Density
/cm3
Ratio Number
Sandy mudstone12400.131.6437
Fine sandstone4600.201.6437
Mudstone10200.071.6573
Sandy mudstone3300.101.6437
Medium sandstone4900.301.6337
Sandy mudstone2300.101.6437
Ding5.6 coal seam1.15.290.021.6773
Medium sandstone457.50.191.6437
Sandy mudstone8850.281.6437
Medium sandstone21050.351.6437
Sandy mudstone5200.071.6437
Medium sandstone21050.351.6437
Sandy mudstone2200.071.6437
Medium sandstone4450.151.6437
Wu9.10 coal seam1.35.290.021.6773
Mudstone2150.051.6573
Medium sandstone61050.351.6437
Mudstone4150.051.6573
Medium sandstone21050.351.6437
Mudstone12150.051.6573
Fine sandstone6950.321.6437
Mudstone16150.051.6573
Medium sandstone21050.351.6437
Mudstone2150.051.6573
Fine sandstone8950.321.6437
Sandy mudstone6250.081.6473
Ji15 coal seam1.75.290.021.6773
Sandy mudstone2400.131.6437
Fine sandstone2500.171.6437
Muddy tuff18450.151.6573
Limestone18600.201.6537
Table 3. Investigation results of gas parameters.
Test ContentGas Content (m3/t)Gas Pressure (MPa)Coal Seam Permeability Coefficient
(m2/(MPa·d))
Original area of coal seam in Group E9.91.10.157
Original area of coal seam in Group F9.713.40.012
Group D protected area5.880.51.945
Group D and E protected area6.342.60.052
Publisher’s Note: MDPI stays neutral with regard to jurisdictional claims in published maps and institutional affiliations.

