Article

What Car for Car-Sharing? Conventional, Electric, Hybrid or Hydrogen Fleet? Analysis of the Vehicle Selection Criteria for Car-Sharing Systems

1
Department of Road Transport, Faculty of Transport and Aviation Engineering, Silesian University of Technology, 8 Krasińskiego Street, 40-019 Katowice, Poland
2
Sino-US Global Logistics Institute, Shanghai Jiao Tong University, Shanghai 200240, China
*
Authors to whom correspondence should be addressed.
Energies 2022, 15(12), 4344; https://doi.org/10.3390/en15124344
Submission received: 19 May 2022 / Revised: 6 June 2022 / Accepted: 13 June 2022 / Published: 14 June 2022
(This article belongs to the Special Issue Sustainable Shared Mobility: Current Status and Future Prospects)

Abstract

:
Short-term car rental services called “car-sharing” or “carsharing” are systems that in recent years have been an alternative form of transport by individual car in an increasing number of cities around the world. With the growing popularity of services, new decision-making problems have arisen among system operators. Among the challenges faced by operators, due to the constantly growing environmental requirements, is the fleet of vehicles for car-sharing systems-appropriate selection. Noticing this research gap, this article was dedicated to determining the criteria that are important when choosing a fleet of vehicles for car-sharing and to indicate the best suited to the needs of car-sharing vehicles. Own research was proposed, considering desk research, expert research and analyses using the multi-criteria decision support method (ELECTRE III). This research was carried out for the Polish market of car-sharing services. Studying the Polish market is appropriate due to the occurrence of significant difficulties with the fleet incorrectly adjusted to the needs of urban conditions. This study covers vehicles with conventional, electric, hybrid and hydrogen propulsion. The analyses allowed for the determination of the vehicles best suited to the needs of car-sharing. The results show the dominance of hydrogen-powered vehicles over conventional, hybrid and electric vehicles. What is more, it was determined that the most important criteria are the purchase price of the vehicle and energy/fuel consumption per 100 km. The obtained results are a guide to proceeding when making decisions regarding the implementation or modernization of the fleet in car-sharing systems. The results also support achieving more sustainable urban mobility in the zero-emission trend through hydrogen mobility.

1. Introduction

Short-term car rental services called “car-sharing” or “carsharing” are systems that in recent years have been an alternative form of transport by individual car in an increasing number of cities around the world. The car-sharing market size surpassed USD 2 billion in 2020 [1], and it is expected to grow in 2022 with a Compound Annual Growth Rate (CAGR) of 17.4% [2]. Car-sharing systems have undergone many modifications along with their development. Over the years, system management, the location and relocation of vehicles, price lists and service packages, infrastructure and vehicles have changed [3,4,5,6]. These changes resulted from many different factors due to the gradual adaptation of society to new forms of transport [7], and thus changing demand [8,9], due to new legislation or municipal car-sharing regulations being implemented [10,11], changes in environmental requirements [12,13,14], etc.
Evaluating car-sharing systems has become an interesting topic for scientists. A frequently studied topic is the car-sharing fleet. However, there are several leading topics in the field of fleet research. The first of the leading themes is the size of the fleet in car-sharing systems. For example, fleet size considerations are among the main motives; Xu et al. dedicated their research to electric vehicle fleet size for car-sharing services considering on-demand charging strategy and battery degradation [15]. In comparison, Monteiro et al. optimized car-sharing fleet size to maximize the number of clients served [16]. In turn, Hu and Liu analyzed the joint design of parking capacities and fleet size for one-way station-based car-sharing systems with road congestion constraints [4]. The second leading topics regarding the car fleet are aspects of vehicle location and relocation. For example, the Chang et al. dealt with the subject of location design and relocation of a mixed car-sharing fleet with a CO2 emission constraint [17]. Yoon et al. investigated car-sharing demand estimation and fleet simulation with electric vehicle adoption [18]. In turn, Fan et al. dealt with car-sharing dynamic decision-making obstacles for vehicle allocation [19]. There is, however, a literature gap in the research on the car-sharing fleet. The gap concerns analyses directly related to the type of vehicles used in the systems and their use. In our previous works, we dealt with the determination of the fleet which is most often used in car-sharing systems [20] and we analyzed the operational factors of vehicle use [21]. Receiving signals from operators of Polish car-sharing systems that they need to make changes to vehicle fleets, we have dedicated this article to the selection of vehicles for car-sharing systems.
From the point of view of common mobility services, the Polish market is a very interesting field. Although vehicle sharing services appeared relatively late to other European countries, e.g., bike-sharing in 2008 [22,23,24,25,26], car-sharing in 2016 [27], moped-sharing in 2017 [28], and scooter-sharing in 2018 [28], this market is characterized as dynamic and valuable [28]. A significant development of shared mobility services in Poland has been observed since 2017, when more and more car-sharing service operators appeared on the market [29]. At the peak of shared mobility systems development, there were 17 car-sharing operators available in 250 cities [29]. Revenues from car-sharing services in Poland in 2019 amounted to over 50 million PLN, and they achieved a double increase in 2021, reaching over 100 million PLN [30]. However, the market boom of new car-sharing operators has not lasted long. After the opening of many systems, the rapid disappearance of many systems from the market has occurred. The most spectacular closures included closure of the Vozilla electric car-sharing system with a fleet of 240 cars [31], closure of the InnogyGo system! with a fleet of 500 electric cars [32], and a few other operators who had pilot schemes have withdrawn from offering short-term car rental to long-term rental. It is worth mentioning that during the boom, the offered vehicle fleets and rental regulations were very chaotic and contradictory. For example, operators have implemented electric cars without having to consider the presence of infrastructure for electric vehicles in a given area [21]. Moreover, many system regulations prevented the efficient use of electric cars. For example, it was necessary to terminate the rental of a vehicle with an energy level in the car’s battery that would allow another user to drive a further 30 km, where in practice there was no charging station in the area of the rental zone up to 30 km. What is more, many regulations forbid the user to connect cars to chargers by themselves, while others ordered the vehicle to be returned only under the charger. In practice, the idea of free-floating electric car-sharing did not take place at that time. The difficulties were not only with electric vehicles fleets. Conventionally fueled cars, on the other hand, were targeted at one car model, which discouraged some users from using the cars [20]. Despite the many challenges that Polish car-sharing has had to face in recent years, it is predicted that Polish car-sharing revenues will reach a value of over 265 million PLN in 2025 [30]. Currently, many Polish cities, striving to limit transport by individual cars [33,34,35], are implementing new transport policies, leading to a significant development of car-sharing service systems, which will result in the creation of new systems and modernization of existing systems over several years; therefore, it is particularly important to determine the appropriate fleet to supply car-sharing systems to meet the expectations of stakeholders.
The aim of this study is to determine the criteria that are important when choosing a fleet of vehicles for car-sharing and to indicate the best suited to the needs of car-sharing vehicles. This research was carried out for the Polish market. This study covers vehicles with conventional, electric and hydrogen propulsion.
This article consists of four main sections. The first chapter presents a general description of the research problem and characterizes the Polish car-sharing market along with a historical outline. The second chapter presents information on the methods of multi-criteria decision support, as well as a detailed description of the ELECTRE III method used, together with a test plan. The third chapter shows a detailed analysis and the obtained results. The fourth chapter discusses the obtained results and confronts them with the research of other authors. This article is a guide when making decisions regarding the implementation or modernization of the fleet in car-sharing systems. The results also support achieving more sustainable urban mobility in the zero-emission trend through hydrogen mobility.

2. Materials and Methods

Deciding which vehicle fleet to choose is a problem that requires consideration of many different criteria. In this case, we use multi-criteria decision support methods. Multi-criteria decision making (MCDM), multi-criteria decision analysis (MCDA) or multi-criteria data analysis methods are a sub-discipline of operations research [36]. Their task is to provide a wide range of mathematical tools that can be used in the analytical process of decision making. MCDM means the process of determining the best feasible solution according to established criteria and problems that are common occurrences in everyday life [37]. Their specificity enables defining criteria, their weights and actors appearing in the decision-making process, i.e., stakeholders [38]. With their use, it is possible to obtain the final rankings of scenarios for the analyzed research questions [36,37,38,39]. MCDM is used to solve decision-making problems at the strategic, tactical, and operational levels [40].
MCDA is widely used to solve various transport problems, including for solving the problem of selecting projects to build the Paris metro [41], choosing the best transport connection between the city of Pittsburgh and international airport [42], or assessing transport solutions for the metropolitan area of Istanbul [43]. Moreover, these methods have also been applied to car-sharing systems. For example, they were used to determine the location of base stations of the EVCARD car-sharing system operator in the area of Shanghai [44], to analyze the selection of the location of car-sharing stations in Beijing [45] and to determine the location of car-sharing stations in the French city of La Rochelle [46]. Since MCDA is commonly used in decision-making aspects, one of the methods was included in the research process.
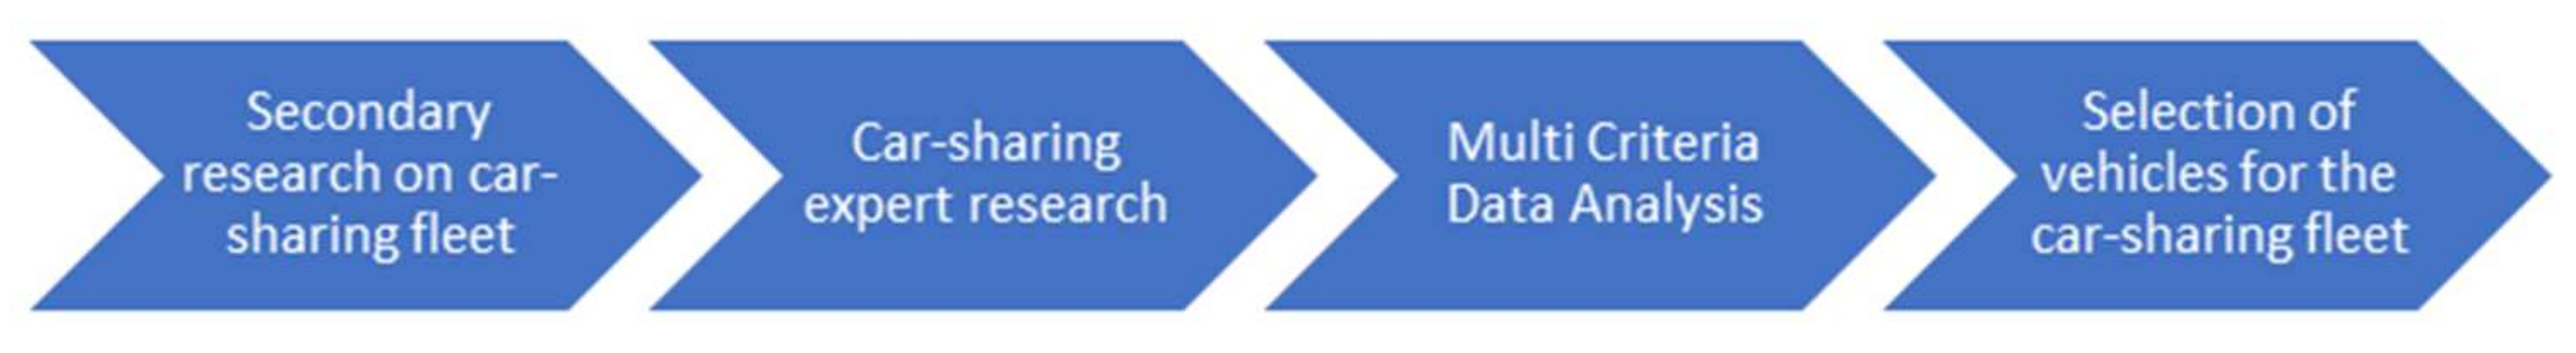
The research process considered secondary research on vehicles used in car-sharing systems, expert research among car-sharing service operators and the performance of mathematical analyses, considering the multi-criteria decision support method. The detailed procedure of the procedure is presented in Figure 1.
Secondary research was carried out on a group of operators functioning in Poland in May 2022.They concerned the analysis of vehicle fleets in car-sharing systems in order to identify the most frequently used cars. Successively, the most popular and commercially available hydrogen-powered vehicles were added to conventional, electric and hybrid vehicles. Secondary research allowed the building of a database of vehicles that were considered in the calculations.
The next step was to conduct expert research on a group of car-sharing operators present in Poland. The aim of the research was to indicate the importance of individual criteria considered when selecting a vehicle for car-sharing systems. In accordance with the MCDA methodology, the respondents made pairwise comparisons of individual criteria on a scale from 1 to 9, where 1—same meaning; 2—very weak advantage; 3—weak advantage; 4—more than weak advantage, less than strong; 5—strong advantage; 6—more than a strong advantage, less than very strong; 7—a very strong advantage; 8—more than a very strong advantage, less than an extreme; 9—extreme, total advantage. The weights obtained were included in the analyses using the MCDA method.
The last step was to perform analyses using one of the MCDA methods. Among the group of methods frequently used in transport problems is the set of ELECTRE [47]. ELECTRE is an acronym for Elimination Et Choix Traduisant la Realitè and represents a set of multi-criteria decision support methods (ELECTRE I, II, III, IV, IS, and TRI), which are based on partial preference aggregation by overrun [47,48,49,50,51,52,53]. Different types of ELECTRE methods have different approaches to decision-making problems. The first method produces elections, the others provide ranking [47,48,49,50,51,52,53]. The ELECTRE III method is the most popular of the ELECTRE family methods [39]. The ELECTRE III method is most often combined with expert research (e.g., Delphi method) [54]. The method introduces a two-level preference for a given criteria. This means that they may be strongly or slightly better than each other, which means situations when the decision variants differ very or little from each other [39].
The algorithm in the ELECTRE III method includes 3 stages [24]:
(1)
Constructing the evaluation matrix and defining the preferences of decision makers,
(2)
Building the surpassing relationship,
(3)
Using the exceedance relationship to generate an ordered ranking of decision variants.
The first stage of the analysis begins with the definition of a set of criteria that will be used to evaluate the set of decision variants [47,48,49,50,51,52,53]. Each criterion from the set is assigned an appropriate weight. Subsequently, by comparing the two decision variants, the exceedance index is calculated [47,48,49,50,51,52,53].
In the second step, based on the exceedance index, the answer is whether the first variant is not worse than the second one due to a given criterion. Subsequently, a computation of the compliance rate is performed to be able to obtain a response with the advantage of one option over the other in terms of all criteria [47,48,49,50,51,52,53]. The compliance rate is the sum of the weights of the criteria for which the evaluation value of one variant is greater than or equal to the evaluation value of the other variant [47,48,49,50,51,52,53].
In the second stage, based on the exceedance index, the answer is whether the first option is not worse than the second one due to the given criterion. Subsequently, a computation of the compliance rate is performed to be able to obtain a response with the advantage of one option over the other in terms of all criteria [47,48,49,50,51,52,53]. The compliance rate is the sum of the weights of the criteria for which the evaluation value of one variant is greater than or equal to the evaluation value of the other variant [47,48,49,50,51,52,53].
The third stage is based on creating an altitude difference matrix. The scenarios should be ranked sequentially, which begins with their initial ordering by means of the classification procedures: ascend distillation and descend distillation [47,48,49,50,51,52,53]. Both distillations rank the best to worst scenarios [47,48,49,50,51,52,53].
Ascend distillation is a scheduling process that begins with selecting the best scenario and placing it at the top of the classification [47,48,49,50,51,52,53]. The best scenario is then selected again from among the remaining scenarios and placed in the next position in the classification. This procedure is repeated until the set of scenarios is exhausted [47,48,49,50,51,52,53].
For descend distillation, the scheduling process begins with the worst-case selection and placement at the end of the ranking. The sequence is the same as in the ascend distillation procedure, with the difference that in subsequent iterations of the remaining scenarios to be considered, the worst scenario is always selected and placed on the next positions “from the bottom” [47,48,49,50,51,52,53].
Then, we create the final ranking based on the top-down and bottom-up ordering. The result is a final ranking of the scenarios. The results are presented in the next chapter.

3. Results

When determining which car-sharing vehicle to choose, in the first step, the most frequently used vehicle models on the Polish market, valid as of May 2022, were determined. The most frequently repeated cars are marked in green. The summary is presented in Table 1.
The most common vehicle models with conventional, electric and hybrid drive were selected successively. In line with global trends in reducing transport emissions, hydrogen-powered vehicles were also included. A total of 12 different vehicle models were included, representing a diverse set of vehicle classes. A detailed list of vehicles considered in the analysis is presented in Table 2.
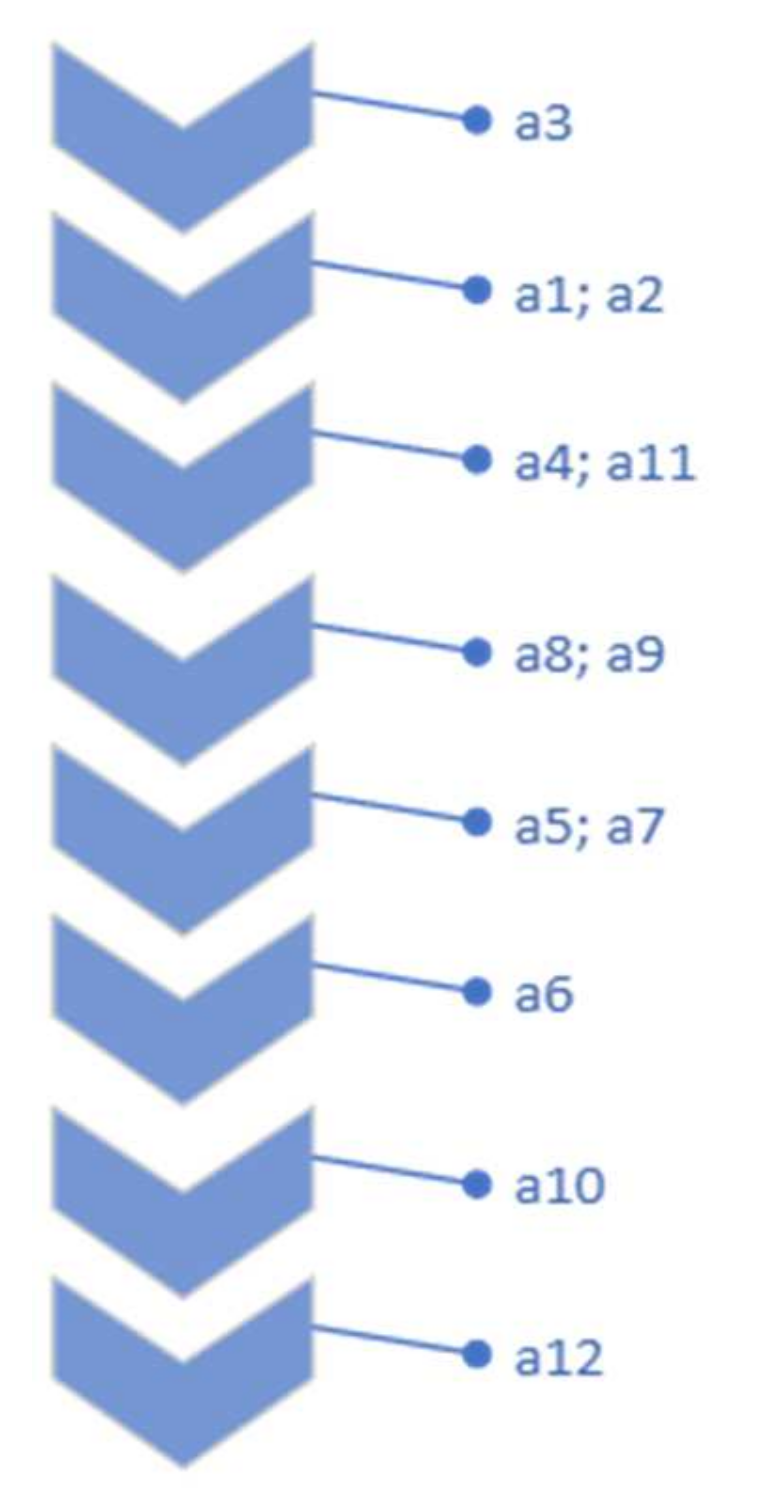
The criteria for selecting the vehicles that have been considered are successively defined. The list of critics is presented in Table 3.
The preferences of experts were directed towards vehicles with the highest possible comfort of movement, with relatively high engine power, luggage compartment capacity, and the lowest possible exhaust emissions due to possible restrictions on access to city centers in the future. The values of individual criteria have been presented in sequence for a selected fleet of vehicles that can be implemented in car-sharing systems. The results are presented in Table 4.
Then, in accordance with the guidelines of the ELECTRE III method, the equivalence, preference, and veto thresholds were determined for each of the criteria, which are presented in Table 5.
In the next step, the values of the concordance matrix were determined, which are presented in Table 6.
The non-compliance indicators were successively determined for each of the seven considered criteria, which are presented in Table A1, Table A2, Table A3, Table A4, Table A5, Table A6 and Table A7. Based on the non-compliance indicators, the values of reliability indicators were determined, which are presented in Table A8.
The next step was to perform the ascend and descend distillation. The results are presented in the form of a dominance matrix in Table 7.
Based on the value of the exceedance relation matrix, the final ranking of decision values was created, depending on the type of distillation, which are presented in Table 8. The final ranking presented in Table 8 defines which of the considered scenarios is the most optimal in terms of the assumed criteria and the assessment of the preferences of experts.
Based on the value of the exceedance relation matrix, the final ranking of decision values was created, depending on the type of distillation, which are presented in Figure 2.

4. Discussion and Conclusions

The research carried out with the use of the ELECTRE III multi-criteria decision support method was used to determine the best selection of vehicles for car-sharing systems based on the criteria established and assessed by experts. The obtained results indicate that of the analyzed car models, Honda Clarity achieved the top ranking and is the optimal vehicle that meets the expectations of experts.
Moreover, the conducted research shows that hydrogen-powered vehicles are on the podium in the obtained ranking. When analyzing the obtained results in detail, it can be noticed that electric vehicles occupy the last places in the ranking. An interesting finding is that conventionally powered vehicles rank better than electric vehicles. This result is mainly caused by a large disproportion between the purchase prices of an electric vehicle and a vehicle with a conventional drive.
Based on the obtained results, it was found that the most important criteria are the purchase price of the vehicle, energy/fuel consumption per 100 km and the time of refueling/charging the vehicle’s battery. The results, therefore, indicate that it is the economic and operational criteria that are of greatest importance for shared mobility cars.
It is worth mentioning that vehicles in car-sharing systems generate profits in terms of traffic. Unfortunately, all vehicles whose battery charging process requires a large amount of time have limited transport availability for users, reducing the often-insufficient vehicle fleet in car-sharing systems.
Therefore, despite the widespread interest in electric vehicles for car-sharing, if the fleet of vehicles is not so large that cars that are being charged cannot be replaced with ready-to-use vehicles, and the infrastructure will not allow the charging time to be reduced to the level of conventional or hydrogen vehicles, electric cars in a car-sharing model will not be the optimal choice.
When translating the obtained results into business practices of car-sharing systems, it is worth emphasizing that hydrogen-powered vehicles are not currently used in systems both in Poland and Europe, and the current trends are directed towards electric vehicles. Unfortunately, the analysis of the market activities of companies shows that most companies with a fleet of electric vehicles in Poland failed, and the systems were closed after several months of operation. This type of practice was also visible in the case of the Paris car-sharing system and the American system in San Diego. Currently, especially in the Polish market, infrastructure for servicing electric vehicles is still too little for individual cars, let alone for servicing car-sharing systems [55]. As Poland is looking for solutions for the development of low-emission transport, more and more hopes are placed on hydrogen. Currently, hydrogen refueling stations are already being created with plans to expand by 2025, when the number of stations will increase by 3200% [56]. Therefore, the dissemination of a hydrogen-powered car for Polish car-sharing is a future-proof scenario.
Due to the area character of the research and the results being limited to the Polish market, the authors plan to expand future research to a larger scale and conduct research considering other European countries. Due to the lack of scientific research on the selection of the vehicle fleet, no direct reference was made in the discussion to the results of other authors’ research.
The obtained results support the operators of car-sharing systems in the decision-making process when selecting vehicles for the fleet of their systems.

Author Contributions

Conceptualization, K.T.; methodology, K.T. and A.K.; validation, F.C.; resources, K.T., A.K., and F.C.; data curation, K.T. and A.K.; writing—original draft preparation, K.T., and A.K.; writing—review and editing, K.T. and A.K.; supervision, F.C.; project administration, K.T.; funding acquisition, K.T. All authors have read and agreed to the published version of the manuscript.

Funding

This research received no external funding. Research conducted as part of the Silesian University of Technology subsidy for the maintenance and development of the research potential of early career researchers—BKM-692/RT1/2022, 12/010/BKM22/1058 and BKM-693/RT1/2022 12/010/BKM22/1059.

Institutional Review Board Statement

Not applicable.

Informed Consent Statement

Not applicable.

Data Availability Statement

The data presented in this study are available on request from the authors.

Conflicts of Interest

The authors declare no conflict of interest.

Appendix A

Table A1. Values of the non-compliance indicators according to the 1st criterion.
Discordance Matrix (f1):a1a2a3a4a5a6a7a8a9a10a11a12
a1000000000000
a2000000000000
a3000000000000
a40.69690.88930.4375000000000
a50.71180.90420.4524000000000
a60.807610.5482000000000
a70.58860.78110.3292000000000
a80.48320.67560.2238000000000
a90.49050.6830.2311000000000
a100.07120.26360000000000
a110.49890.69140.2395000000000
a120.53580.72820.2764000000000
Table A2. Values of the non-compliance indicators according to the 2nd criterion.
Discordance Matrix (f2):a1a2a3a4a5a6a7a8a9a10a11a12
a1000000000000
a2000000000000
a3000000000000
a40.56440.30690.505000000000
a50.7030.44550.6436000000000
a60.40590.14850.3465000000000
a70.188100.1287000000000
a8000000000000
a9000000000000
a100.069300.0099000000000
a110.46530.20790.4059000000000
a1210.74260.940600000.12870.1287000
Table A3. Values of the non-compliance indicators according to the 3rd criterion.
Discordance Matrix (f3):a1a2a3a4a5a6a7a8a9a10a11a12
a100000000.14080.2026000
a200000000.11470.1766000
a300000000.05940.1212000
a400000000.14080.2026000
a5000000000000
a6000000000000
a7000000000000
a8000000000000
a9000000000000
a1000000.256300.03170.55570.6176000
a1100000.63870.23840.41420.93821000
a1200000.52480.12450.30020.82420.8861000
Table A4. Values of the non-compliance indicators according to the 4th criterion.
Discordance Matrix (f4):a1a2a3a4a5a6a7a8a9a10a11a12
a1000000000000
a20000.208500000000
a3000000000000
a4000000000000
a50000.112400000000
a60000.023400000000
a70000.156900000000
a80000.067900000000
a90000.112400000000
a100.082400.4248100000000
a11000.31430.889500000000
a120.042400.38480.960100000000
Table A5. Values of the non-compliance indicators according to the 5th criterion.
Discordance Matrix (f5):a1a2a3a4a5a6a7a8a9a10a11a12
a100000000000.97390
a200000000000.97770
a300000000000.96650
a400000000000.99630
a500000000000.99630
a6000000000010
a7000000000010
a800000000000.99260
a900000000000.99260
a1000000000000.50470
a11000000000000
a1200000000000.34080
Table A6. Values of the non-compliance indicators according to the 6th criterion.
Discordance Matrix (f6):a1a2a3a4a5a6a7a8a9a10a11a12
a100.01450000000000
a2000000000000
a3000000000000
a400.10140000000000
a5000000000000
a6010.840600.4928000.39130.27540.108700
a700.26810.1087000000000
a8000000000000
a9000000000000
a10000000000000
a1100.45650.2971000000000
a1200.16670.0072000000000
Table A7. Values of the non-compliance indicators according to the 7th criterion.
Discordance Matrix (f7):a1a2a3a4a5a6a7a8a9a10a11a12
a1000000000000
a2000000000000
a3000000000000
a4000000000000
a5000000000000
a6000000000000
a7000000000000
a8000000000000
a9000000000000
a10000000000000
a11111111111101
a12000000000000
Table A8. Credibility matrix values D.
Credibility Matrix:a1a2a3a4a5a6a7a8a9a10a11a12
a100.950.96450.74940.93110.97660.90.910.23460.9734
a2100.920.70.936910.98190.90.910.20110.9726
a31100.95490.94810.99290.90.910.30170.9749
a40.45470.13530.555800.922310.97660.86140.86140.92460.03350.9689
a50.3210.14320.48750.7010.9970.93370.93370.88890.03350.9689
a60.236600.19480.66010.9500.97680.90310.89080.808200.9348
a70.60.28310.5010.70.9739100.97930.97850.989500.9682
a80.62570.64790.63760.71110110.0670.9696
a90.62570.60130.60880.71111010.0670.9696
a100.30.42360.367400.66750.64290.69420.64080.667500.91
a11000000000000
a1200.06050.01010.07870.67550.61920.65570.22270.16490.91390.89310

References

  1. Global Market Insights. Car Sharing Market Size by Model (P2P, Station-Based, Free-Floating), By Business Model (Round Trip, One Way), By Application (Business, Private), COVID-19 Impact Analysis, Regional Outlook, Application Potential, Price Trend, Competitive Market Share & Forecast, 2021–2027. Available online: https://www.gminsights.com/industry-analysis/carsharing-market (accessed on 16 May 2022).
  2. 360 Research Reports. Global Carsharing Market Insights and Forecast to 2028. Available online: https://360researchreports.com/global-carsharing-market-19963041 (accessed on 16 May 2022).
  3. Esfandabadi, Z.S.; Diana, M.; Zanetti, M.C. Carsharing services in sustainable urban transport: An inclusive science map of the field. J. Clean. Prod. 2022, 357, 131981. [Google Scholar] [CrossRef]
  4. Hu, L.; Liu, Y. Joint design of parking capacities and fleet size for one-way station-based carsharing systems with road congestion constraints. Transp. Res. Part B Methodol. 2016, 93, 268–299. [Google Scholar] [CrossRef]
  5. Zhang, S.; Zhao, X.; Li, X.; Yu, H. Heterogeneous fleet management for one-way electric carsharing system with optional orders, vehicle relocation and on-demand recharging. Comput. Oper. Res. 2022, 145, 105868. [Google Scholar] [CrossRef]
  6. Wu, C.; Le Vine, S.; Philips, S.; Tang, W.; Polak, J. Free-floating carsharing users’ willingness-to-pay/accept for logistics management mechanisms. Travel Behav. Soc. 2020, 21, 154–166. [Google Scholar] [CrossRef] [PubMed]
  7. Aguilera-García, A.; Gomez, J.; Antoniou, C.; Vassallo, J.M. Behavioral factors impacting adoption and frequency of use of carsharing: A tale of two European cities. Transp. Policy 2022, 123, 55–72. [Google Scholar] [CrossRef]
  8. Huang, W.; Huang, W.; Jian, S. One-way carsharing service design under demand uncertainty: A service reliability-based two-stage stochastic program approach. Transp. Res. Part E Logist. Transp. Rev. 2022, 159, 102624. [Google Scholar] [CrossRef]
  9. Yao, Z.; Gendreau, M.; Li, M.; Ran, L.; Wang, Z. Service operations of electric vehicle carsharing systems from the perspectives of supply and demand: A literature review. Transp. Res. Part C Emerg. Technol. 2022, 140, 103702. [Google Scholar] [CrossRef]
  10. Balac, M.; Ciari, F.; Axhausen, K.W. Modeling the impact of parking price policy on free-floating carsharing: Case study for Zurich, Switzerland. Transp. Res. Part C Emerg. Technol. 2017, 77, 207–225. [Google Scholar] [CrossRef]
  11. Repoux, M.; Kaspi, M.; Boyacı, B.; Geroliminis, N. Dynamic prediction-based relocation policies in one-way station-based carsharing systems with complete journey reservations. Transp. Res. Part B Methodol. 2019, 130, 82–104. [Google Scholar] [CrossRef]
  12. Shams Esfandabadi, Z.; Ravina, M.; Diana, M.; Zanetti, M.C. Conceptualizing environmental effects of carsharing services: A system thinking approach. Sci. Total Environ. 2020, 745, 141169. [Google Scholar] [CrossRef]
  13. Meng, Z.; Li, E.Y.; Qiu, R. Environmental sustainability with free-floating carsharing services: An on-demand refueling recommendation system for Car2go in Seattle. Technol. Forecast. Soc. Change 2020, 152, 119893. [Google Scholar] [CrossRef]
  14. Roblek, V.; Meško, M.; Podbregar, I. Impact of Car Sharing on Urban Sustainability. Sustainability 2021, 13, 905. [Google Scholar] [CrossRef]
  15. Xu, M.; Wu, T.; Tan, Z. Electric vehicle fleet size for carsharing services considering on-demand charging strategy and battery degradation. Transp. Res. Part C Emerg. Technol. 2021, 127, 103146. [Google Scholar] [CrossRef]
  16. Monteiro, C.M.; Soares Machado, C.A.; de Oliveira Lage, M.; Berssaneti, F.T.; Davis, C.A.; Quintanilha, J.A. Optimization of carsharing fleet size to maximize the number of clients served. Computers. Environ. Urban Syst. 2021, 87, 101623. [Google Scholar] [CrossRef]
  17. Chang, J.; Yu, M.; Shen, S.; Xu, M. Location Design and Relocation of a Mixed Car-Sharing Fleet with a CO2 Emission Constraint. Serv. Sci. 2017, 9, 205–218. [Google Scholar] [CrossRef]
  18. Yoon, T.; Cherry, C.R.; Ryerson, M.S.; Bell, J.E. Carsharing demand estimation and fleet simulation with EV adoption. J. Clean. Prod. 2019, 206, 1051–1058. [Google Scholar] [CrossRef]
  19. Fan, W.; Machemehl, R.B.; Lownes, N.E. Carsharing: Dynamic Decision-Making Problem for Vehicle Allocation. Transp. Res. Rec. 2008, 2063, 97–104. [Google Scholar] [CrossRef]
  20. Turoń, K.; Kubik, A.; Łazarz, B.; Czech, P.; Stanik, Z. Car-sharing in the context of car operation. IOP Conf. Ser. Mater. Sci. Eng. 2018, 421, 032027. [Google Scholar] [CrossRef]
  21. Turoń, K.; Kubik, A.; Chen, F. Operational Aspects of Electric Vehicles from Car-Sharing Systems. Energies 2019, 12, 4614. [Google Scholar] [CrossRef] [Green Version]
  22. Kwiatkowski, M.A. Bike-sharing-boom—Development of new forms of sustainable transport in Poland on the example of a public bike. Work. Comm. Geogr. Commun. PTG 2018, 21, 60–69. [Google Scholar]
  23. Matyja, T.; Kubik, A.; Stanik, Z. Possibility to Use Professional Bicycle Computers for the Scientific Evaluation of Electric Bikes: Trajectory, Distance, and Slope Data. Energies 2022, 15, 758. [Google Scholar] [CrossRef]
  24. Czech, P.; Turoń, K.; Urbańczyk, R. Bike-sharing as an element of integrated Urban transport system. Advanced Solutions of Transport Systems for Growing Mobility. In Proceedings of the Scientific and Technical Conference Transport Systems Theory and Practice, Katowice, Poland, 18–20 September 2017; Sierpiński, G., Ed.; TSTP: Katowice, Poland, 2017. [Google Scholar]
  25. Matyja, T.; Kubik, A.; Stanik, Z. Possibility to Use Professional Bicycle Computers for the Scientific Evaluation of Electric Bikes: Velocity, Cadence and Power Data. Energies 2022, 15, 1127. [Google Scholar] [CrossRef]
  26. Turoń, K.; Sierpiński, G. Bike-sharing as a possibility to support Vision Zero. In Proceedings of the 12th International Road Safety Conference GAMBIT 2018—“Road Innovations for Safety—The National and Regional Perspective”, GAMBIT 2018, Gdańsk, Poland, 12–13 April 2018. [Google Scholar]
  27. Delloite. Shared Mobility in Poland. Overview. Available online: https://www.teraz-srodowisko.pl/media/pdf/aktualnosci/6982-mobility-in-poland-2019.pdf (accessed on 5 June 2022).
  28. Puzio, E. The development of shared mobility in Poland using the example of a city bike system. Res. Pap. Wrocław Univ. Econ. 2020, 64, 162–170. [Google Scholar] [CrossRef]
  29. Research and Market Portal. Shared Mobility Market Size, Share & Trends Analysis Report by Service Model (Ride Hailing, Bike Sharing, Ride Sharing), by Vehicle Type (Cars, Two-Wheelers), by Region (North America, Europe, APAC, Latin America), and Segment Forecasts, 2022–2030. Available online: https://www.researchandmarkets.com/reports/5595792/shared-mobility-market-size-share-and-trends?utm_source=BW&utm_medium=PressRelease&utm_code=qr3qtb&utm_campaign=1704132+-+World+Shared+Mobility+Market+Analysis+Report+2022-2030+Featuring+Car2Go%2c+Deutsche+Bahn+Connect%2c+Didi+Chuxing%2c+Drive+Now%2c+Evcard%2c+Flinkster%2c+Grab%2c+Greengo%2c+Lyft%2c+Uber%2c+%26+Zipcar&utm_exec=chdo54prd (accessed on 5 June 2022).
  30. Statista. Forecast Revenues from Carsharing Services in Poland from 2019 to 2025. Available online: https://www.statista.com/statistics/1059362/poland-carsharing-revenues/ (accessed on 5 June 2022).
  31. Bankier Portal. Vozilla Wyprzedaje “Elektryki”. Do Kupienia Ponad Sto Aut. Available online: https://www.bankier.pl/moto/vozilla-wyprzedaje-elektryki-do-kupienia-ponad-sto-aut-6367/ (accessed on 28 May 2022).
  32. Rzeczpospolita. Moto Raport. Available online: https://moto.rp.pl/tu-i-teraz/art17350741-innogy-go-konczy-z-elektrycznymi-autami-na-minuty (accessed on 28 May 2022).
  33. Concept of the Strategic Action Program of the Metropolis GZM until 2022. Available online: https://bip.metropoliagzm.pl/artykul/34552/125421/program-dzialan-strategicznych-gornoslasko-zaglebiowskiej-metropolii-do-roku-2022 (accessed on 14 May 2022).
  34. Plan of the Development of the Śląskie Voivodeship 2020+. Available online: https://planzagospodarowania.slaskie.pl/download/content/33 (accessed on 15 May 2022).
  35. Environmental Protection Plan for the Silesian Voivodeship from 2019, including the Perspective until 2024. Available online: https://www.slaskie.pl/download/content/67075 (accessed on 15 May 2022).
  36. Roy, B. How Outranking Relation Halps Multiple Criteria Decision Making; University of South Carolina Press: Columbia, SC, USA, 1973. [Google Scholar]
  37. Jahan, A.; Edwards, K.L. Multi-criteria Decision-Making for Materials Selection. In Multi-Criteria Decision Analysis for Supporting the Selection of Engineering Materials in Product Design; Butterworth-Heinemann: Oxford, UK, 2013; pp. 31–41. [Google Scholar] [CrossRef]
  38. Ishizaka, A.; Nemery, P. Multi-Criteria Decision Analysis, Methods and Software; Wiley and Sons Ltd.: Chichester, UK, 2013. [Google Scholar]
  39. Nermend, K. Methods of Multi-Criteria and Multi-Dimensional Analysis in Decision Suport. [Metody Analizy Wielokryterialnej i Wielowymiarowej we Wspomaganiu Decyzji]; Wydawnictwo PWN: Warszawa, Polska, 2017. [Google Scholar]
  40. Ziemba, P. Multi-Criteria Stochastic Selection of Electric Vehicles for the Sustainable Development of Local Government and State Administration Units in Poland. Energies 2020, 13, 6299. [Google Scholar] [CrossRef]
  41. Dyer, J.S.; Fishburn, P.C.; Steuer, R.E.; Wallenius, J.; Zionts, S. Multiple Criteria Decision Making, Multiattribute Utility Theory: The Next Ten Years. Manag. Sci. 1992, 38, 645–654. [Google Scholar] [CrossRef] [Green Version]
  42. Saaty, T. How to make decision: The analytic hierarchy process. Eur. J. Oper. Res. 1990, 48, 9–26. [Google Scholar] [CrossRef]
  43. Istanbul Metropolitan Municipality & Japan International Cooperation Agency, The Study on Integrated Urban Transport Master Plan for Istanbul Metropolitan Area in the Republic of Turkey. Available online: https://openjicareport.jica.go.jp/pdf/11965720_01.pdf (accessed on 5 June 2022).
  44. Li, W.; Li, Y.; Fan, J.; Deng, H. Siting of Carsharing Stations Based on Spatial Multi-Criteria Evaluation: A Case Study of Shanghai EVCARD. Sustainability 2017, 9, 152. [Google Scholar] [CrossRef] [Green Version]
  45. Lin, M.; Huang, C.; Xu, Z. Multimoora Based Mcdm model for site selection of car sharing station under picture fuzzy environment. Sustain. Cities Soc. 2020, 53, 101873. [Google Scholar] [CrossRef]
  46. Awasthi, A.; Breuil, D.; Singh Chauhan, S.; Parent, M.; Reveillere, T. A Multicriteria Decision Making Approach for Carsharing Stations Selection. J. Decis. Syst. 2007, 16, 57–78. [Google Scholar] [CrossRef]
  47. Figueira, J.R.; Greco, S.; Roy, B.; Słowiński, R. ELECTRE methods: Main features and recent developments. In Handbook of Multicriteria Analysis; Springer: Berlin/Heidelberg, Germany, 2010; pp. 51–89. [Google Scholar]
  48. La Scalia, G.; Micale, R.; Certa, A.; Enea, M. Ranking of shelf life models based on smart logistic unit using the ELECTRE III method. Int. J. Appl. Eng. Res. 2015, 10, 38009–38015. [Google Scholar]
  49. Bottero, M.; Ferretti, V.; Figueira, J.R.; Greco, S.; Roy, B. Dealing with a multiple criteria environmental problem with interaction effects between criteria through an extension of the ELECTRE III method. Eur. J. Oper. Res. 2015, 245, 837–850. [Google Scholar] [CrossRef] [Green Version]
  50. Norese, M.F. ELECTRE III as a support for participatory decision-making on the localisation of waste-treatment plants. Land Use Policy 2006, 23, 76–85. [Google Scholar] [CrossRef]
  51. Certa, A.; Enea, M.; Lupo, T. ELECTRE III to dynamically support the decision maker about the periodic replacements configurations for a multi-component system. Decis. Support Syst. 2013, 55, 126–134. [Google Scholar] [CrossRef]
  52. Buchanan, J.T.; Sheppard, P.J.; Vanderpooten, D. Project Ranking Using ELECTRE III; Department of Management Systems, University of Waikato: Hamilton, New Zealand, 1999. [Google Scholar]
  53. Yu, X.; Zhang, S.; Liao, X.; Qi, X. ELECTRE methods in prioritized MCDM environment. Inf. Sci. 2018, 424, 301–316. [Google Scholar] [CrossRef]
  54. Battisti, F. ELECTRE III for Strategic Environmental Assessment: A “Phantom” Approach. Sustainability 2022, 14, 6221. [Google Scholar] [CrossRef]
  55. Electric Market Portal. Available online: https://www.rynekelektryczny.pl/infrastruktura-ladowania-pojazdow-elektrycznych/ (accessed on 5 June 2022).
  56. Murator Portal. Available online: https://www.muratorplus.pl/technika/oze/stacje-wodoru-w-polsce-gdzie-powstana-ile-punktow-aa-iRpp-S1Ax-VNwG.html (accessed on 5 June 2022).
Figure 1. Research process.
Energies 15 04344 g001
Figure 2. The final ranking of the best vehicles to implement in the car-sharing fleet.
Energies 15 04344 g002
Table 1. Vehicles used in Polish car-sharing systems.
Engine Type
Internal CombustionElectric DriveHybrid Drive
Audi A3BMW i3 (EV)Toyota Yaris HSD
Audi Q2BMW i3s (EV)Toyota Corolla HSD
Citroen Jumper Dacia Spring (EV)Toyota CH-R HSD
Cupra FormentorNissan eNV 200 (EV)
Dacia DokkerNissan Leaf (EV)
Daewoo LanosOpel Ampera (EV)
Ferrari F430Renault Zoe (EV)
Fiat 125pSmart ForTwo EQ (EV)
Fiat 126pTesla Model 3 (EV)
Fiat 500Tesla Model S (EV)
Fiat Ducato VW eGOLF (EV)
Fiat Multipla
FSO Polonez
Mercedes GLA
Mercedes W124
Opel Astra
Opel Corsa
Opel Movano
Porsche 911
Renault Clio
Renault Express
Renault Master
Seat Arona
Skoda CityGo
Skoda Fabia
Skoda Kodiaq
Skoda Octavia
Toyota ProAce
Trabant 1.1
VW Crafter
VW Golf II
VW Scirocco II
Table 2. Cars included in the analysis that can be used in car-sharing systems.
IDVehicle ModelFuel Type
a1Toyota MiraiHydrogen
a2Hyundai NexoHydrogen
a3Honda ClarityHydrogen
a4Opel CorsaPetrol
a5Renault ClioPetrol
a6Fiat 500Petrol
a7Toyota YarisHybrid
a8Toyota C-HRHybrid
a9Toyota CorollaHybrid
a10Renault ZoeElectric
a11Smart Fortwo EQElectric
a12Dacia SpringElectric
Table 3. Criteria for selecting vehicles for the car-sharing fleet.
Factor IDDefinition of the Criterion
f1Vehicle price [€]
f2Motor power [kW]
f3Range on single battery charge/refueling [km]
f4Energy/fuel/hydrogen consumption [kWh/100 km]
f5Battery charging time/refueling time [min]
f6Luggage compartment capacity [L]
f7Number of seats in the vehicle [-]
Table 4. Adopted values for particular criteria.
Definition of the Criterion
IDVehicle PriceMotor PowerRange on Single Battery Charge/Refueling [km]Energy/Fuel/Hydrogen Consumption [kWh/100 km]Battery Charging Time/Refueling Time [min]Luggage Compartment Capacity [L]Number of Seats in the Vehicle
[€][kW][-]
a164,40013465033.112853215
a270,00012166627.751684.54615
a356,85213170039.4264395
a415,0245565050.0223095
a514,59048116729.5223915
a611,8036392131.161.51855
a718,17474102928.71.52865
a821,24290135130.342.53775
a921,02890138929.522.53615
a1033,2318039513.164683385
a1120,7836016015.22702602
a1219,7113323013.9903005
Table 5. Values of the equivalence, preference, and veto thresholds in light of the considered criteria.
Factor IDMaximum Difference of Criteria ValuesEquivalence ThresholdPreference ThresholdVeto Threshold
∆ = max − minQ = 0.25 × ∆p = 0.5 × ∆V = ∆
f158,19714,549.2529,098.558,197
f210125.2550.5101
f31229307.25614.51229
f436.8569.21418.42836.856
f5268.567.125134.25268.5
f627669138276
f730.751.53
Table 6. Concordance matrix C values.
Concordance Matrix:a1a2a3a4a5a6a7a8a9a10a11a12
a100.950.96450.74940.93110.97660.90.910.90.9734
a2100.920.70.936910.98190.90.910.90.9726
a31100.95490.94810.99290.90.910.90.9749
a40.60.550.555800.922310.97660.86140.86140.92460.90.9689
a50.60.59930.57770.7010.9970.93370.93370.88890.90.9689
a60.55140.550.550.66010.9500.97680.90310.89080.80820.89570.9348
a70.60.56390.5010.70.9739100.97930.97850.98950.90.9682
a80.62570.66640.63760.71110110.90.9696
a90.62570.65480.60880.71111010.90.9696
a100.30.42360.38980.70.66750.64290.69420.64080.667500.91
a110.20740.32670.12420.59050.63880.63040.71050.60350.64180.943500.95
a120.26330.35720.1970.66330.67550.61920.65570.55890.59140.91390.89310
Table 7. Dominance matrix L.
Dominance Matrix:a1a2a3a4a5a6a7a8a9a10a11a12
a10IP−P+P+P+P+P+P+P+P+P+
a2I0P−P+P+P+P+P+P+P+P+P+
a3P+P+0P+P+P+P+P+P+P+P+P+
a4P−P−P−0P+P+P+P+P+P+RP+
a5P−P−P−P−0P+IP−P−P+RP+
a6P−P−P−P−P−0P−P−P−P+RP+
a7P−P−P−P−IP+0P−P−P+RP+
a8P−P−P−P−P+P+P+0IP+RP+
a9P−P−P−P−P+P+P+I0P+RP+
a10P−P−P−P−P−P−P−P−P−0RP+
a11P−P−P−RRRRRRR0R
a12P−P−P−P−P−P−P−P−P−P−R0
Where I—a pair of variants is equivalent; P+—the first option is better than the second option; P−—the first option is worse than the second option.
Table 8. Final ranking.
Dominance Matrix:Ascend DistillationDescend DistillationAverage
a1121.5
a2121.5
a3111
a4333
a5544.5
a6555
a7544.5
a8444
a9444
a10655.5
a11274.5
a12766.5
Publisher’s Note: MDPI stays neutral with regard to jurisdictional claims in published maps and institutional affiliations.

