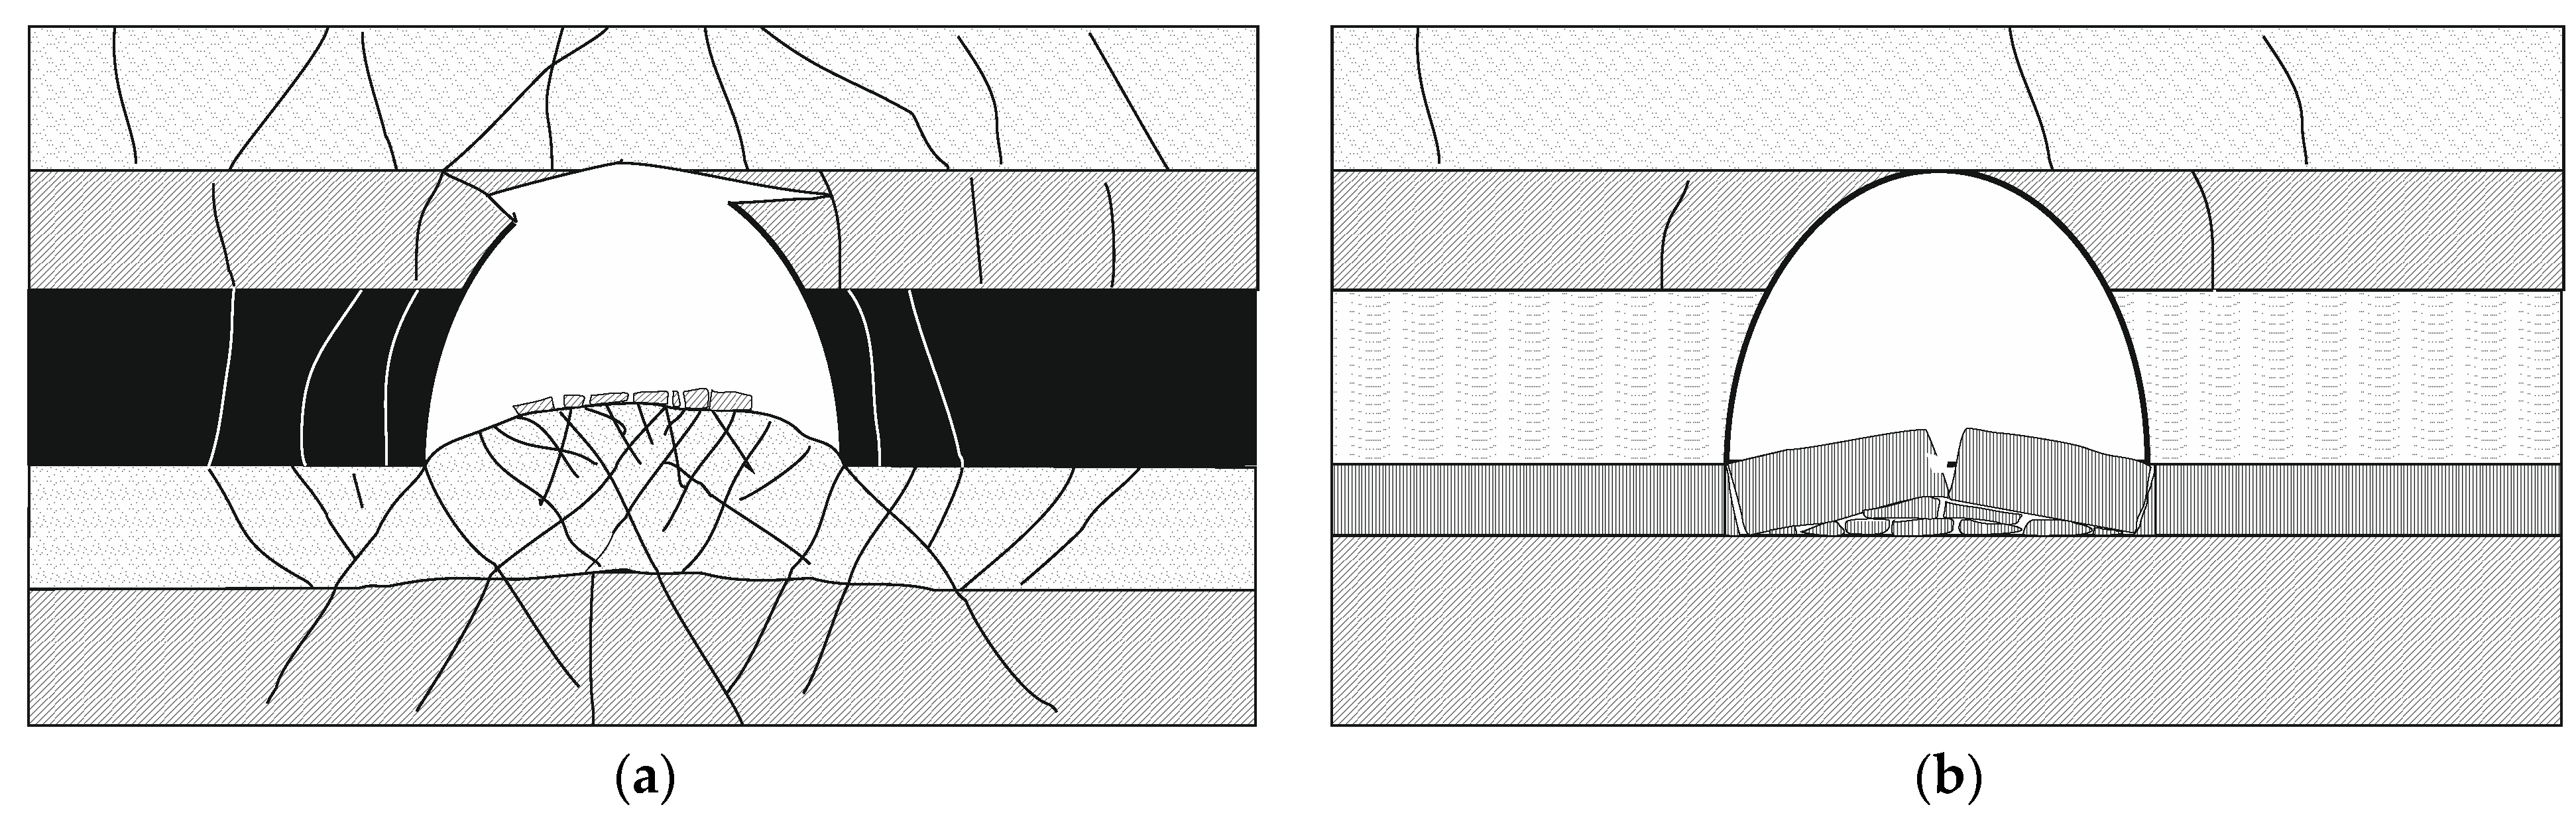
Figure 1.
Heave of floor rocks. (a) Weak rocks, (b) strong rocks.
Figure 1.
Heave of floor rocks. (a) Weak rocks, (b) strong rocks.
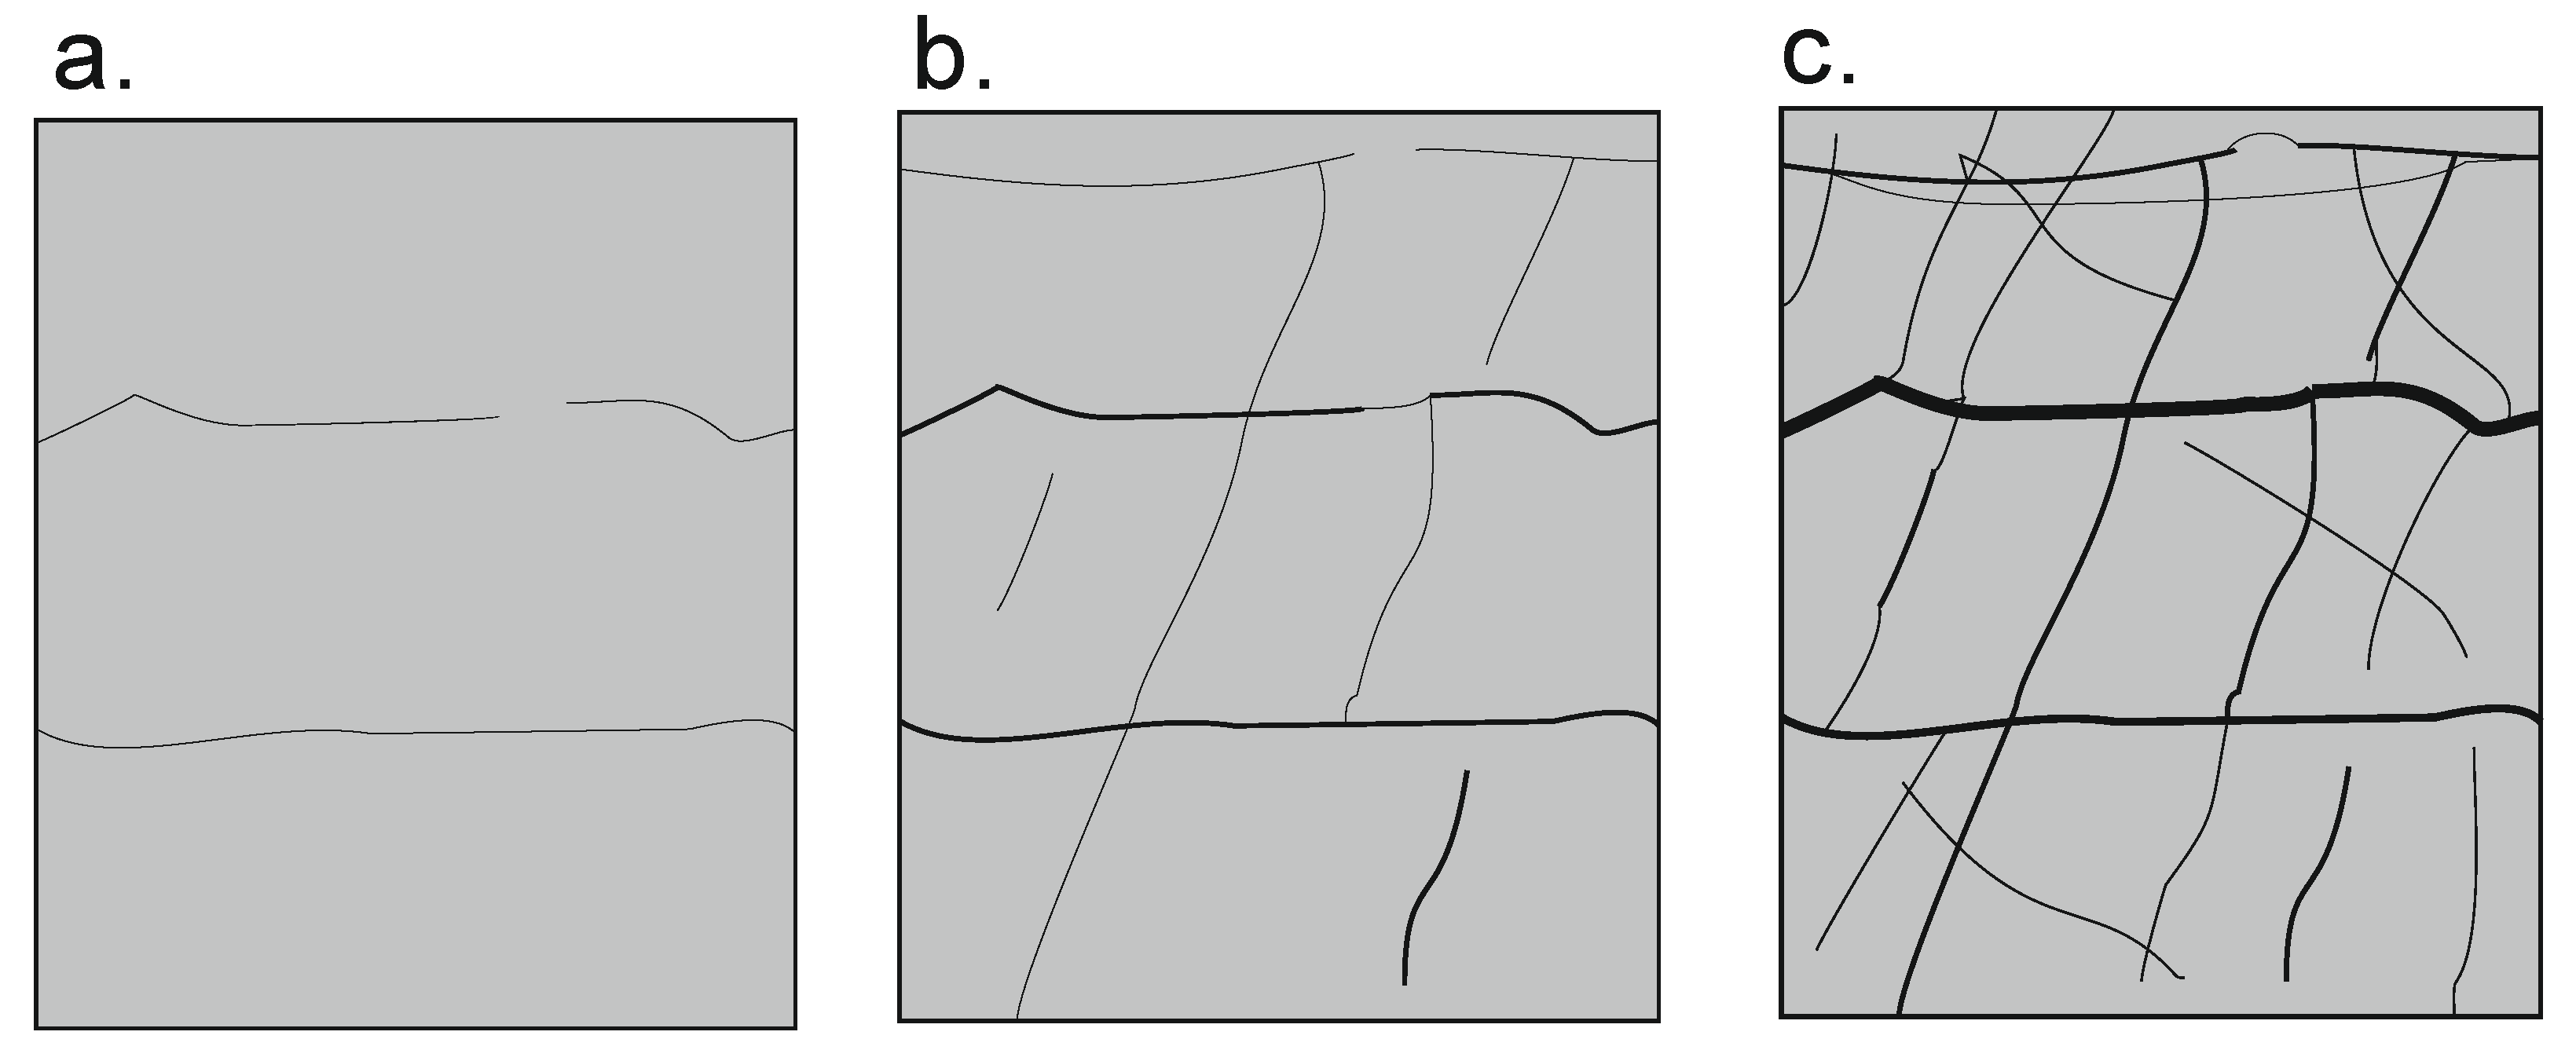
Figure 2.
Propagation of fractures along with stress increase (a) fracture initiation, (b) fracture development, (c) fracture expansion.
Figure 2.
Propagation of fractures along with stress increase (a) fracture initiation, (b) fracture development, (c) fracture expansion.
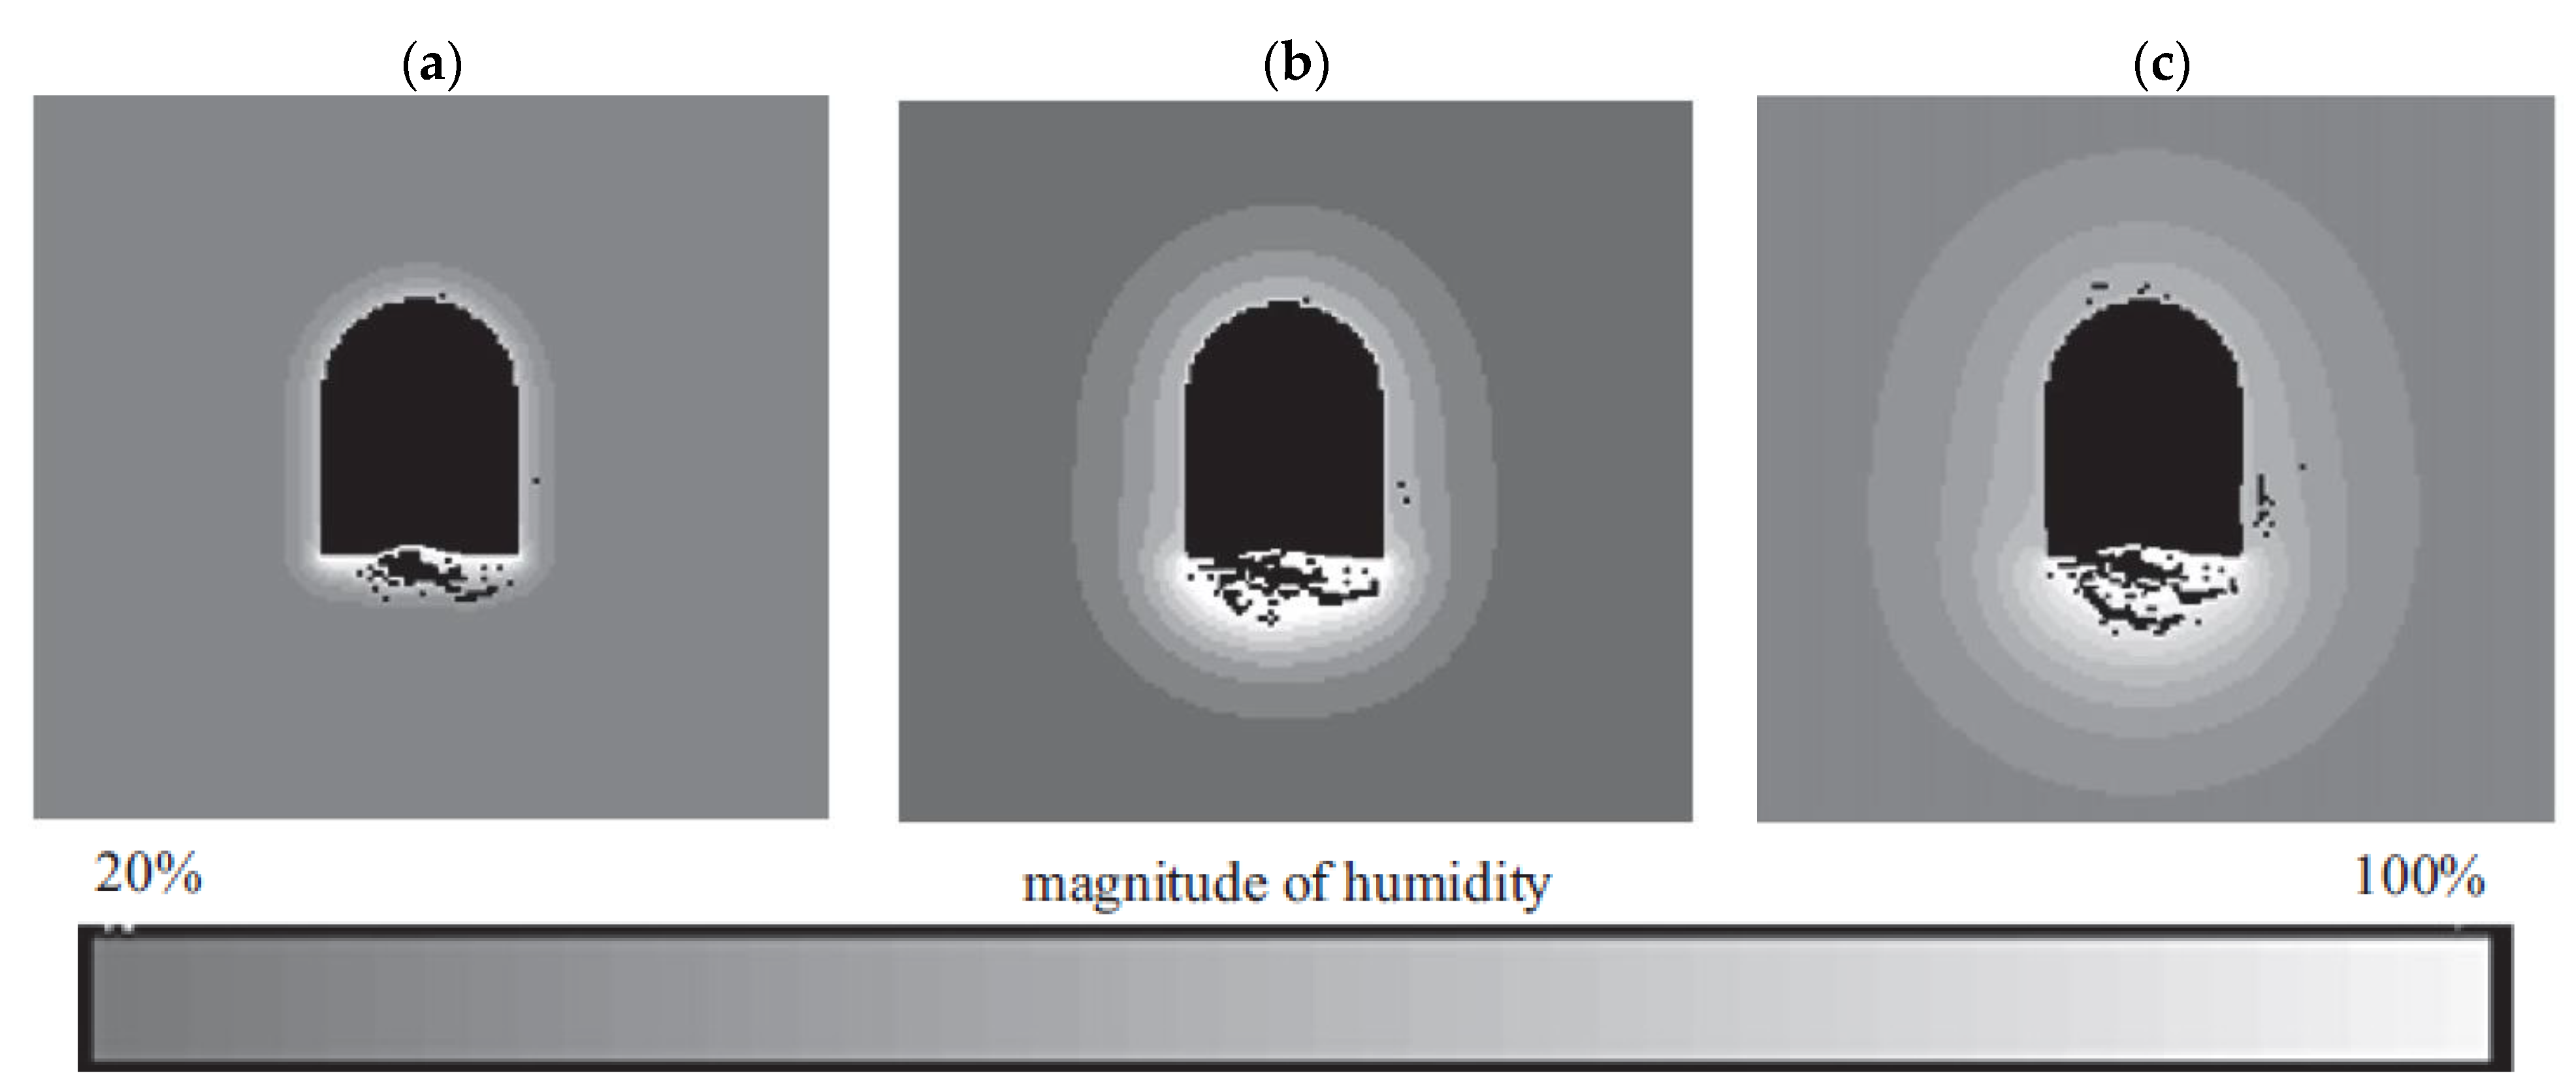
Figure 3.
Moisture diffusion processes during floor heave associated with failure evolution (
a) after 10 days, (
b) after 30 days, and (
c) after 70 days [
28].
Figure 3.
Moisture diffusion processes during floor heave associated with failure evolution (
a) after 10 days, (
b) after 30 days, and (
c) after 70 days [
28].
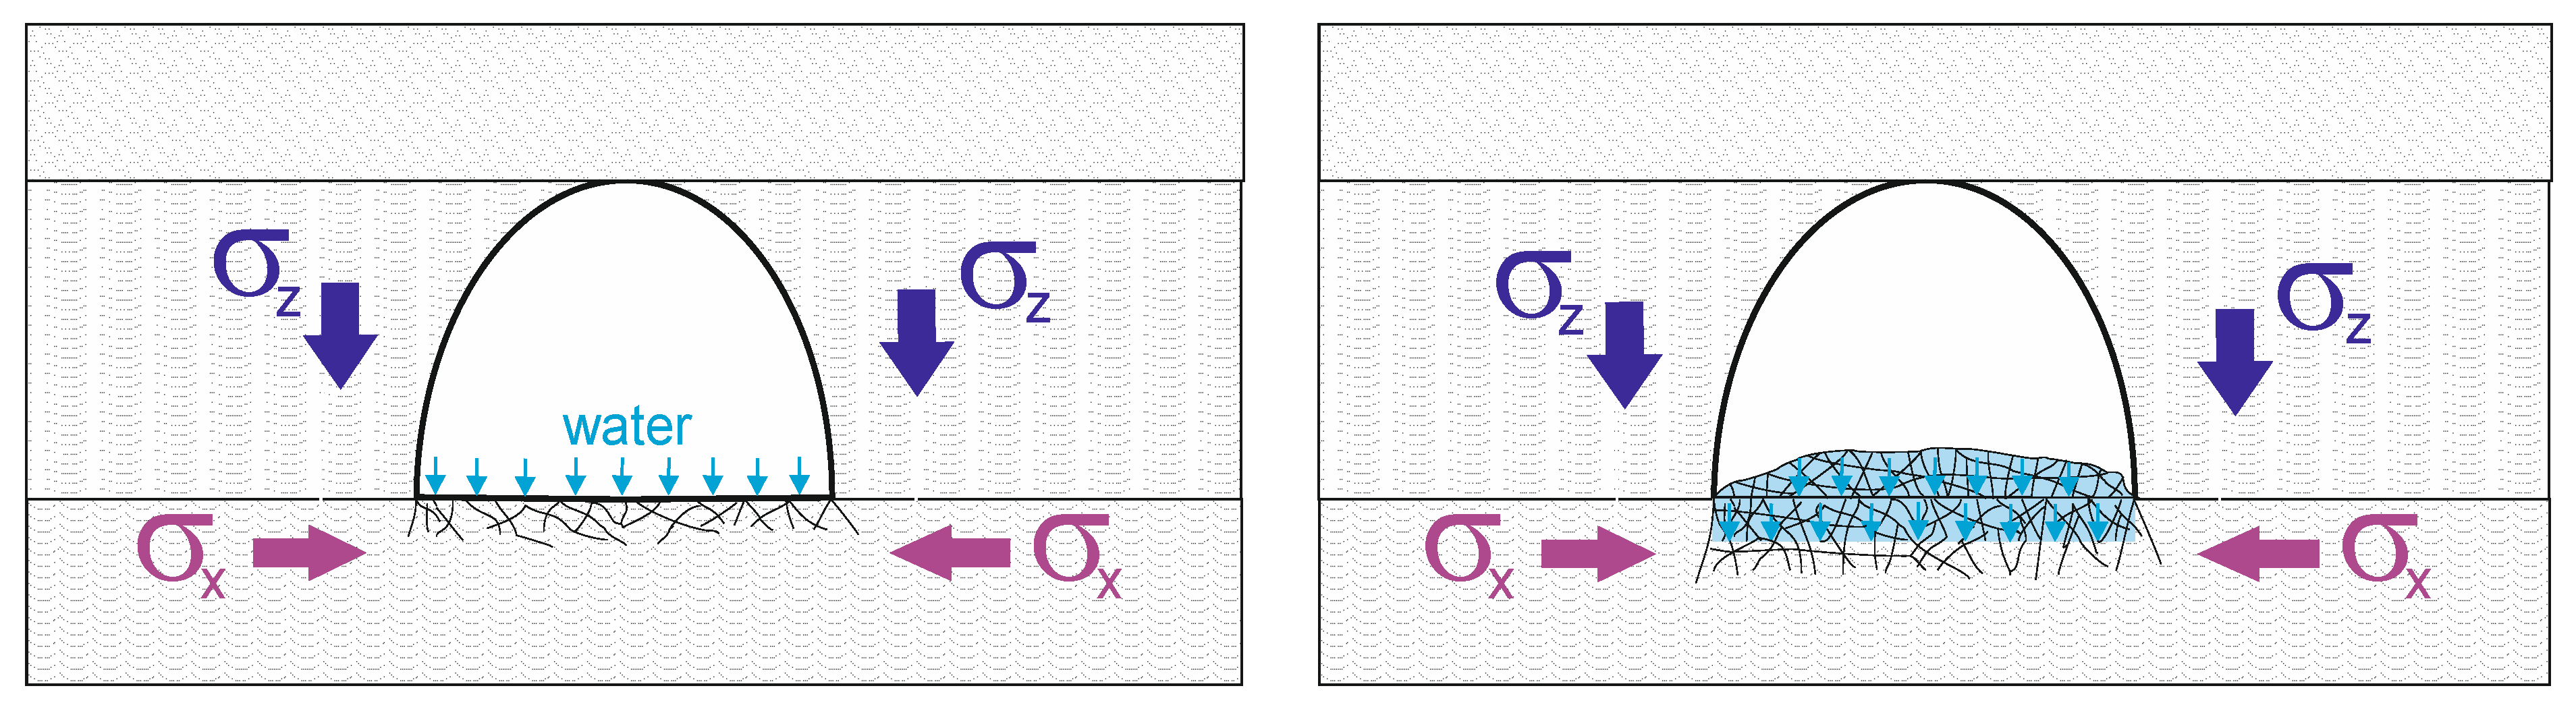
Figure 4.
Gradual permeation of water through fractured zone into the rock mass on the floor.
Figure 4.
Gradual permeation of water through fractured zone into the rock mass on the floor.
Figure 5.
Numerical model section of the roadway D-2.
Figure 5.
Numerical model section of the roadway D-2.
Figure 6.
Numerical model section of roadway F-33.
Figure 6.
Numerical model section of roadway F-33.
Figure 7.
Development of convergence of roadways—underground measurements. (a) The 595th meter of roadway D-2. (b) The 405th meter of roadway F-33.
Figure 7.
Development of convergence of roadways—underground measurements. (a) The 595th meter of roadway D-2. (b) The 405th meter of roadway F-33.
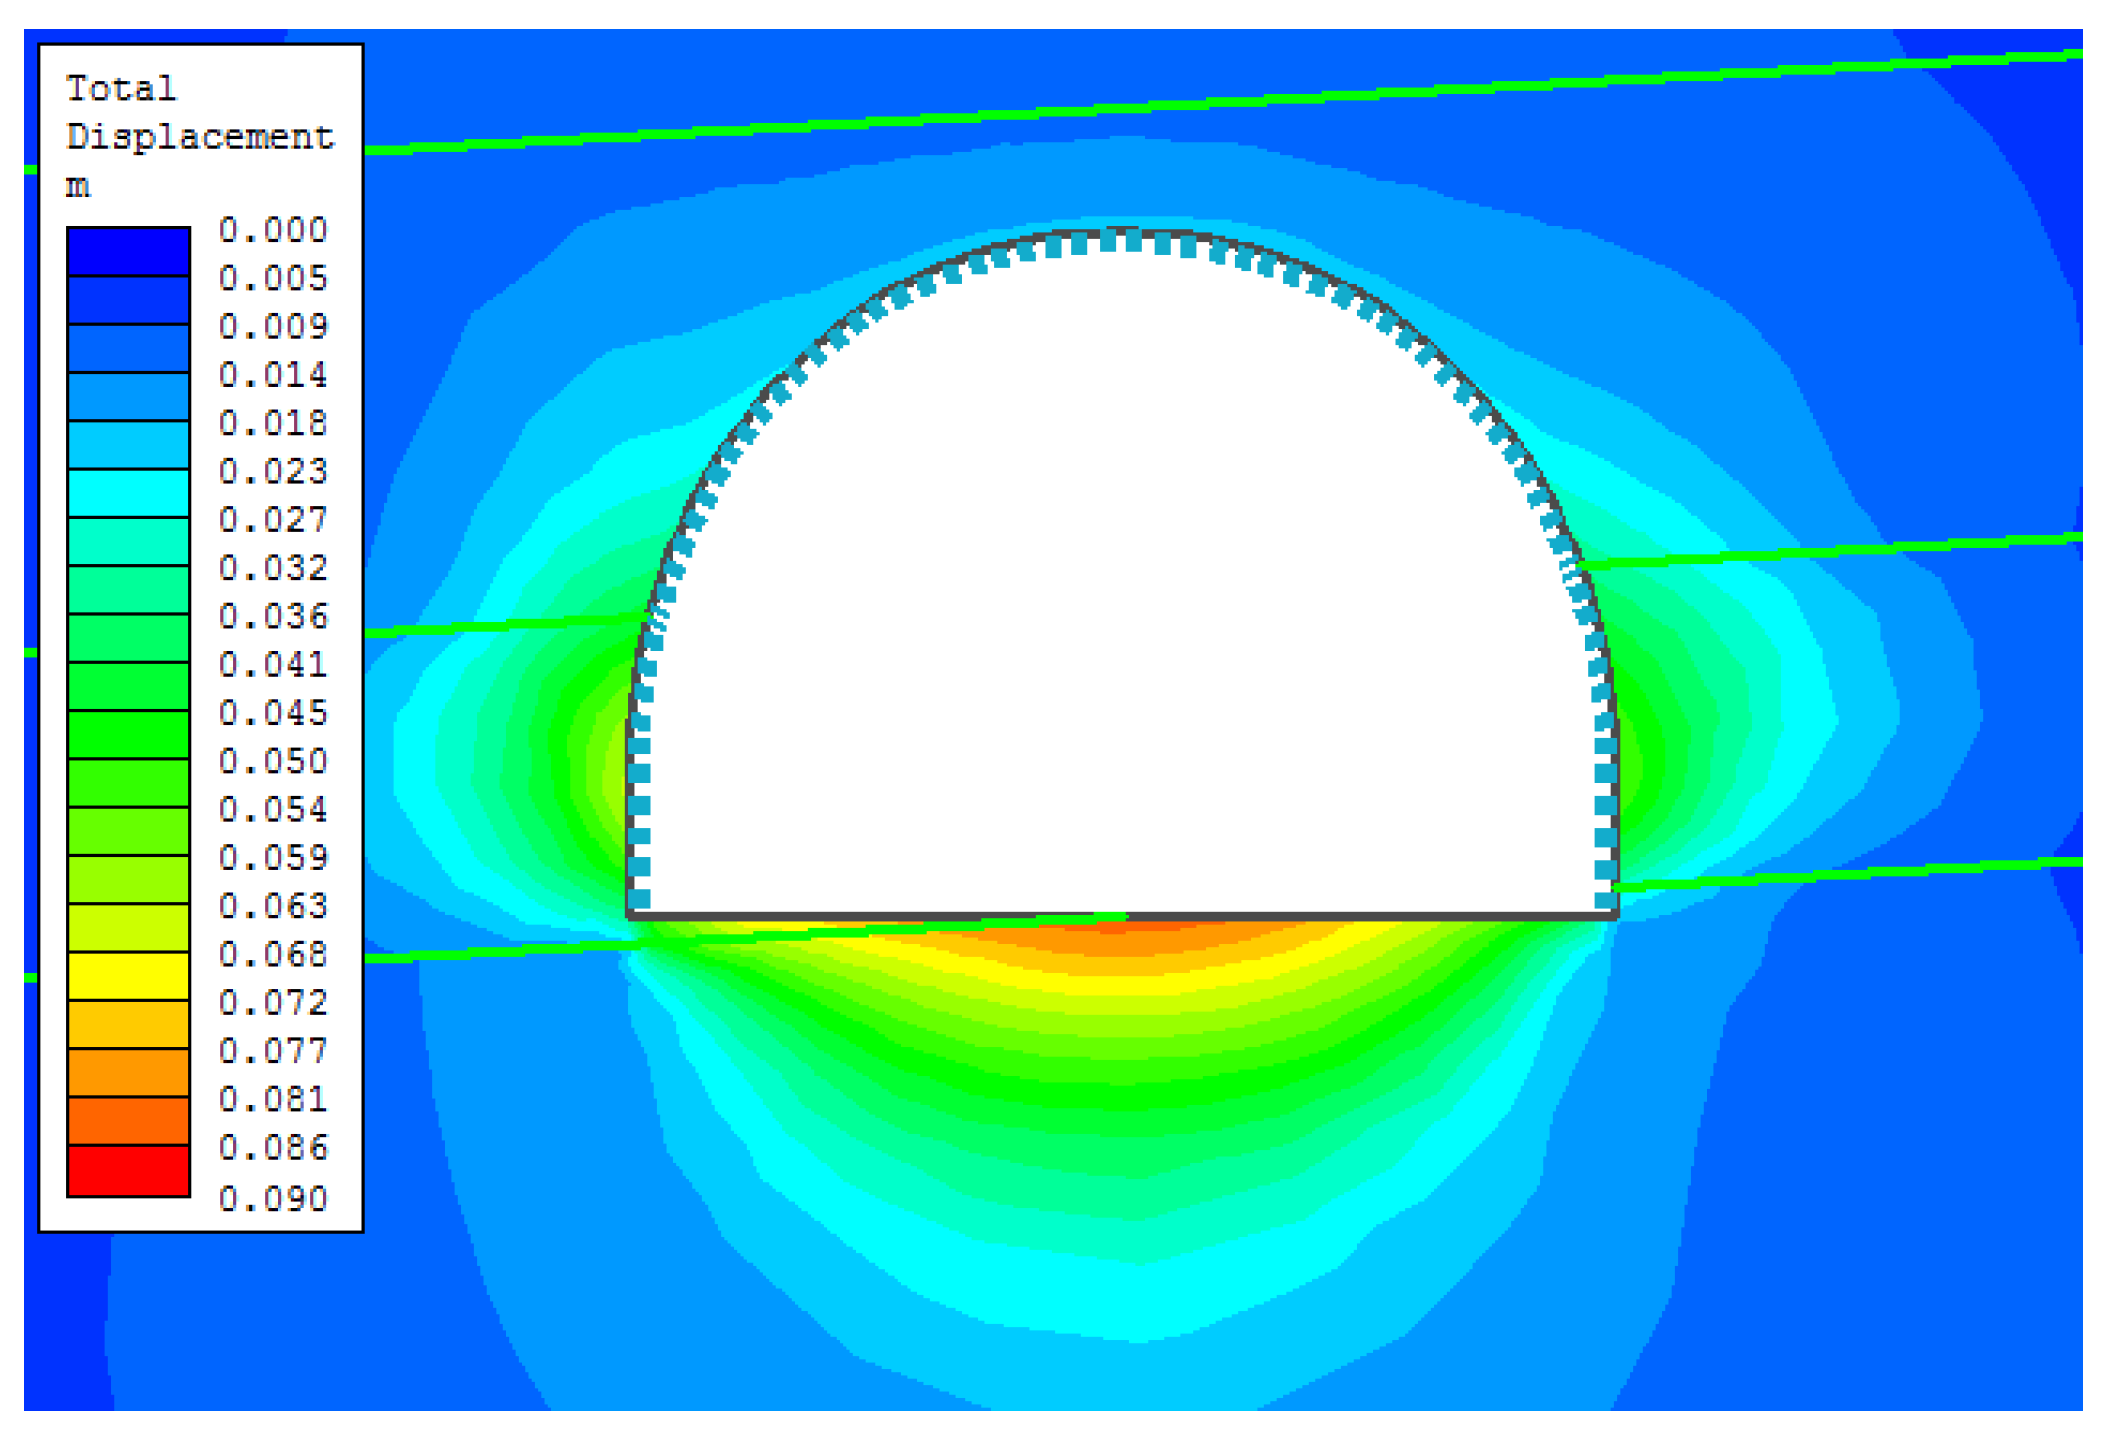
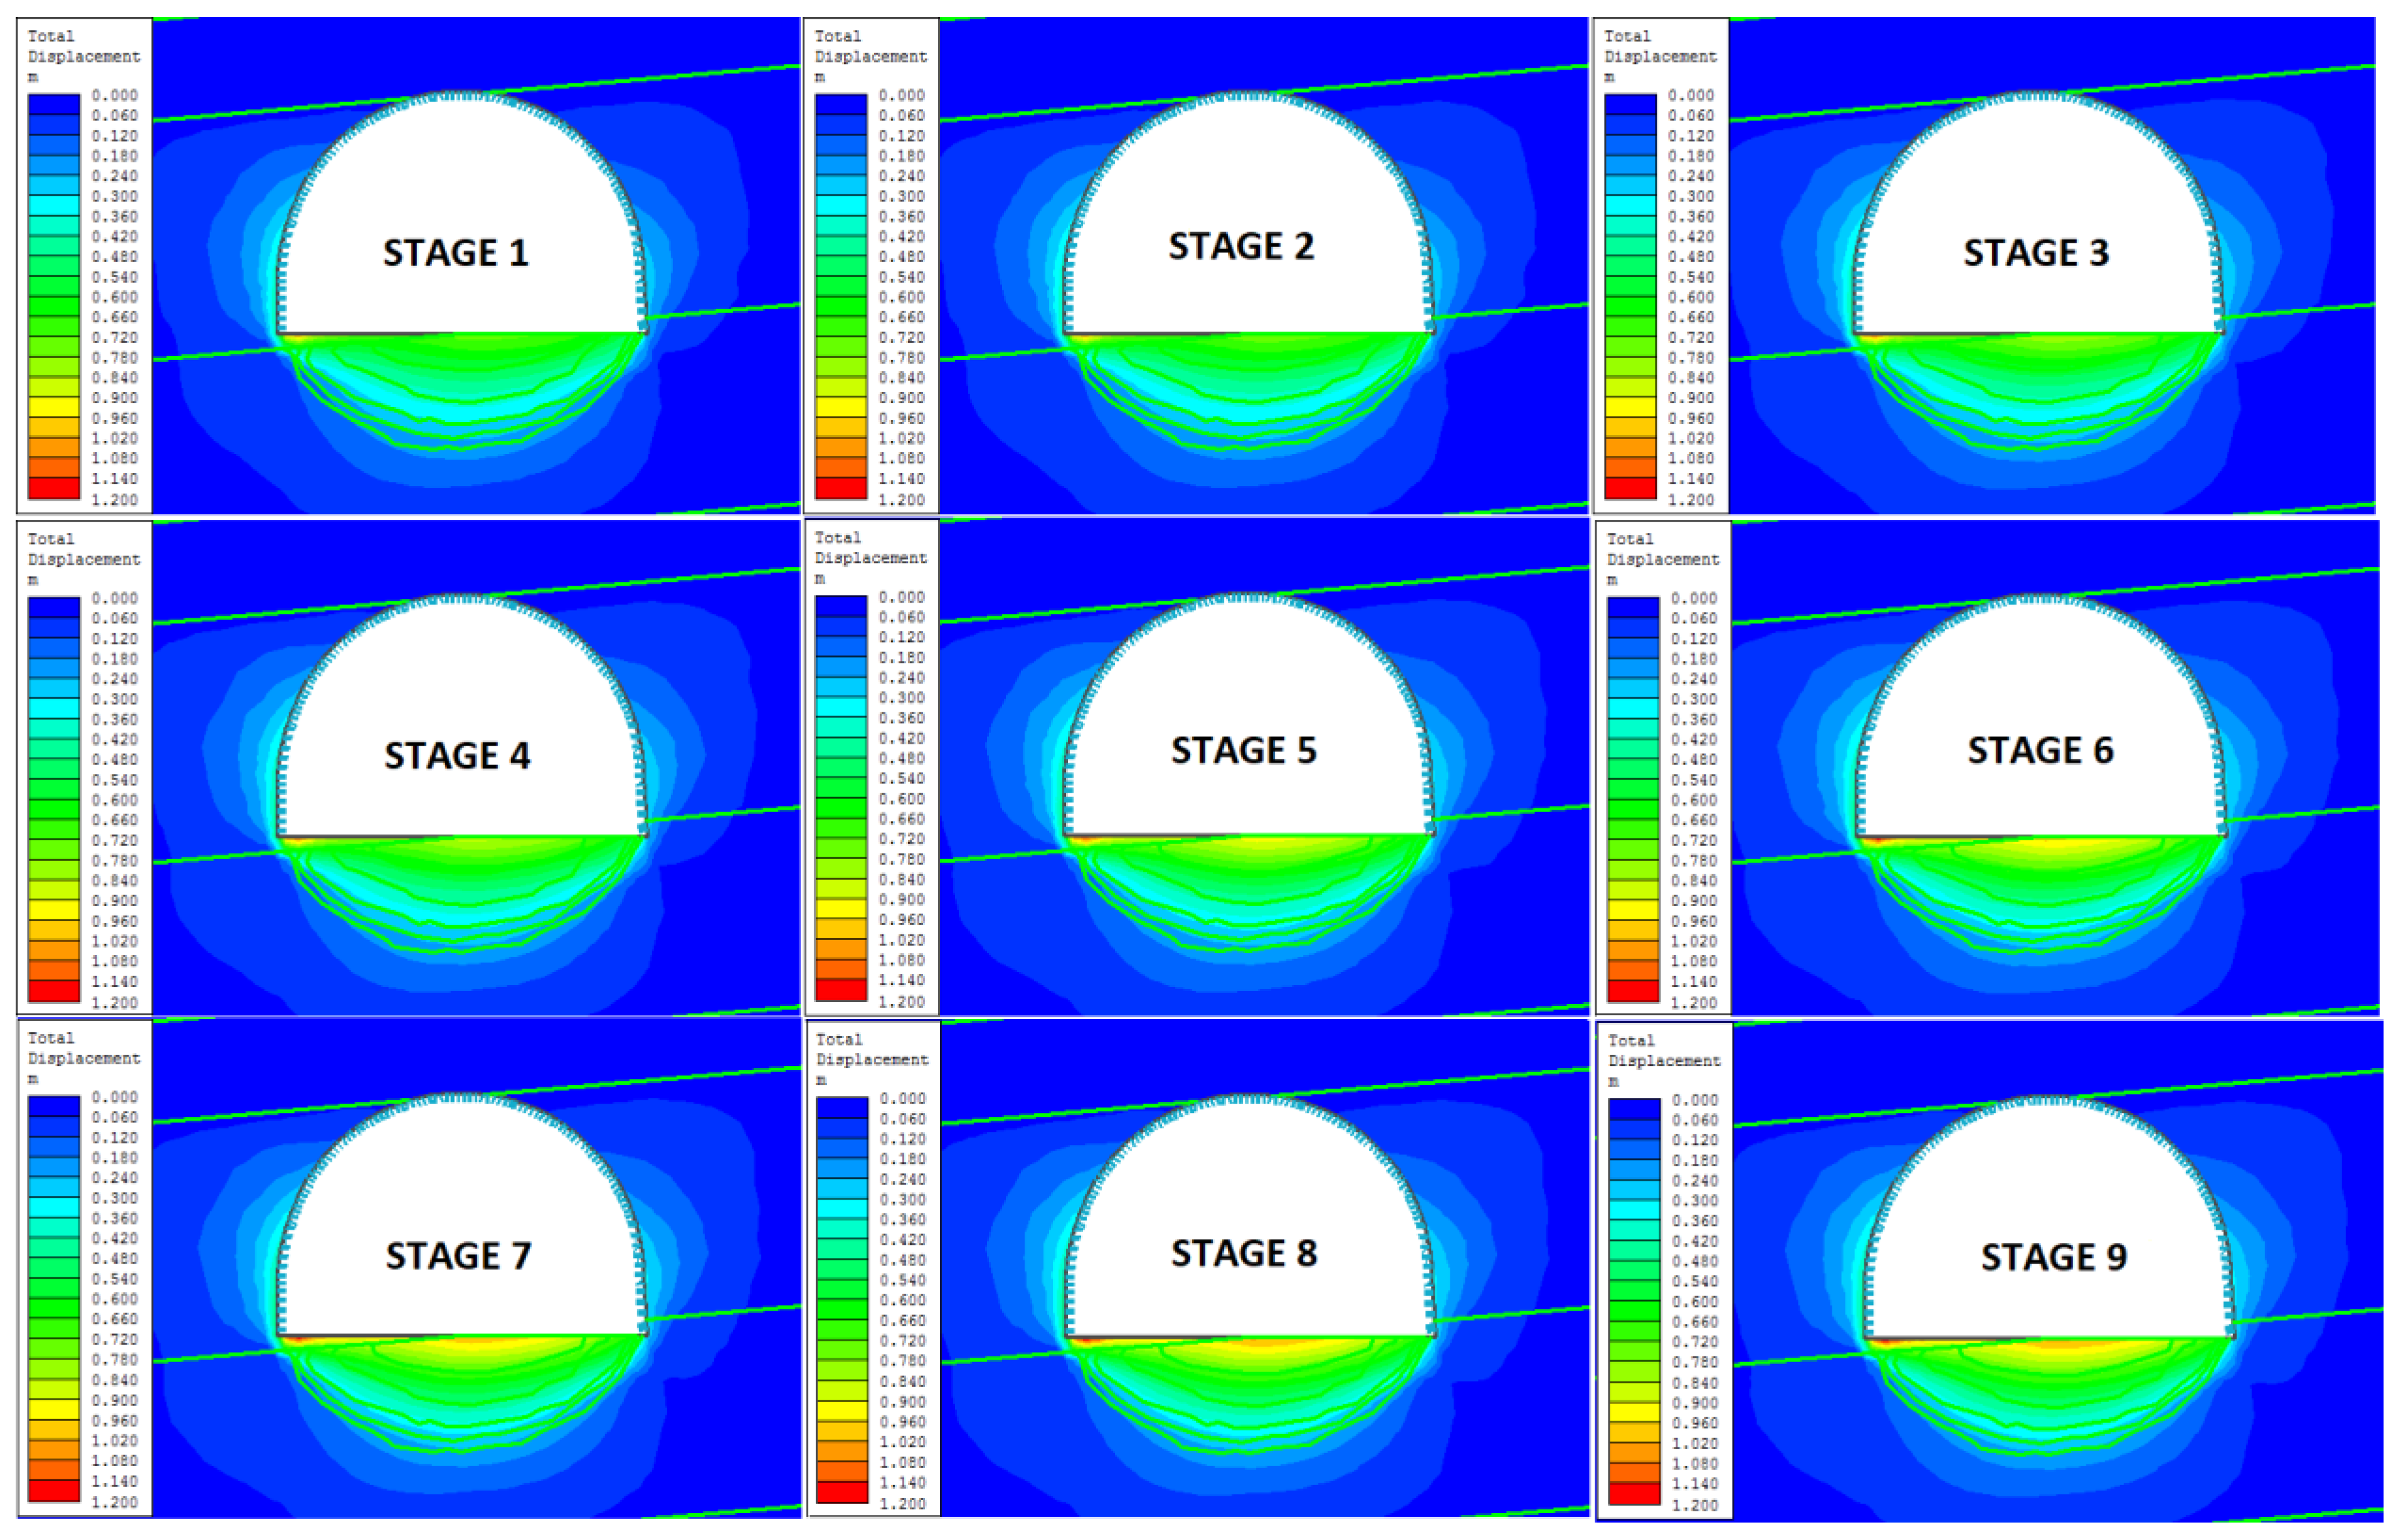
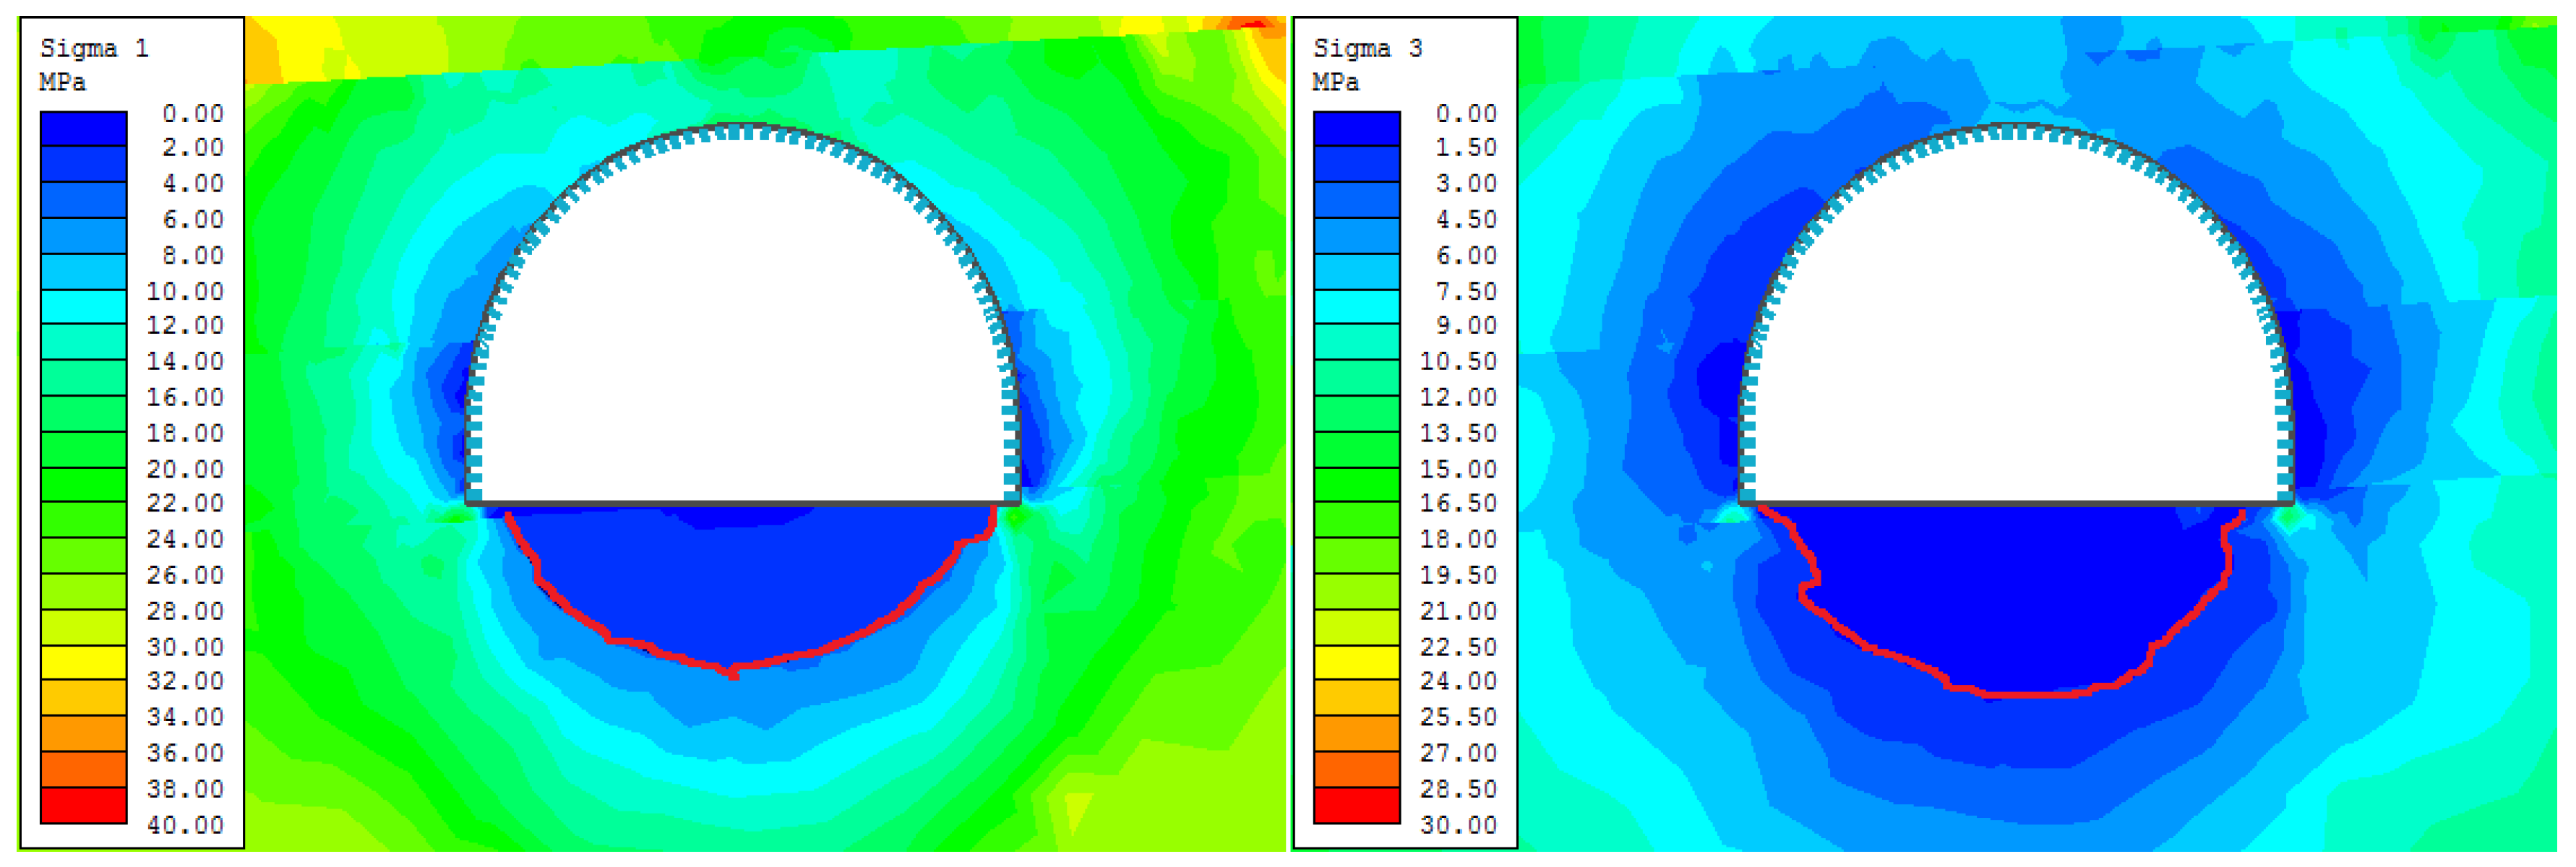
Figure 8.
Results of numerical modeling of rock deformation around roadway D-2 for elasto-plastic rock mass with reinforcement.
Figure 8.
Results of numerical modeling of rock deformation around roadway D-2 for elasto-plastic rock mass with reinforcement.
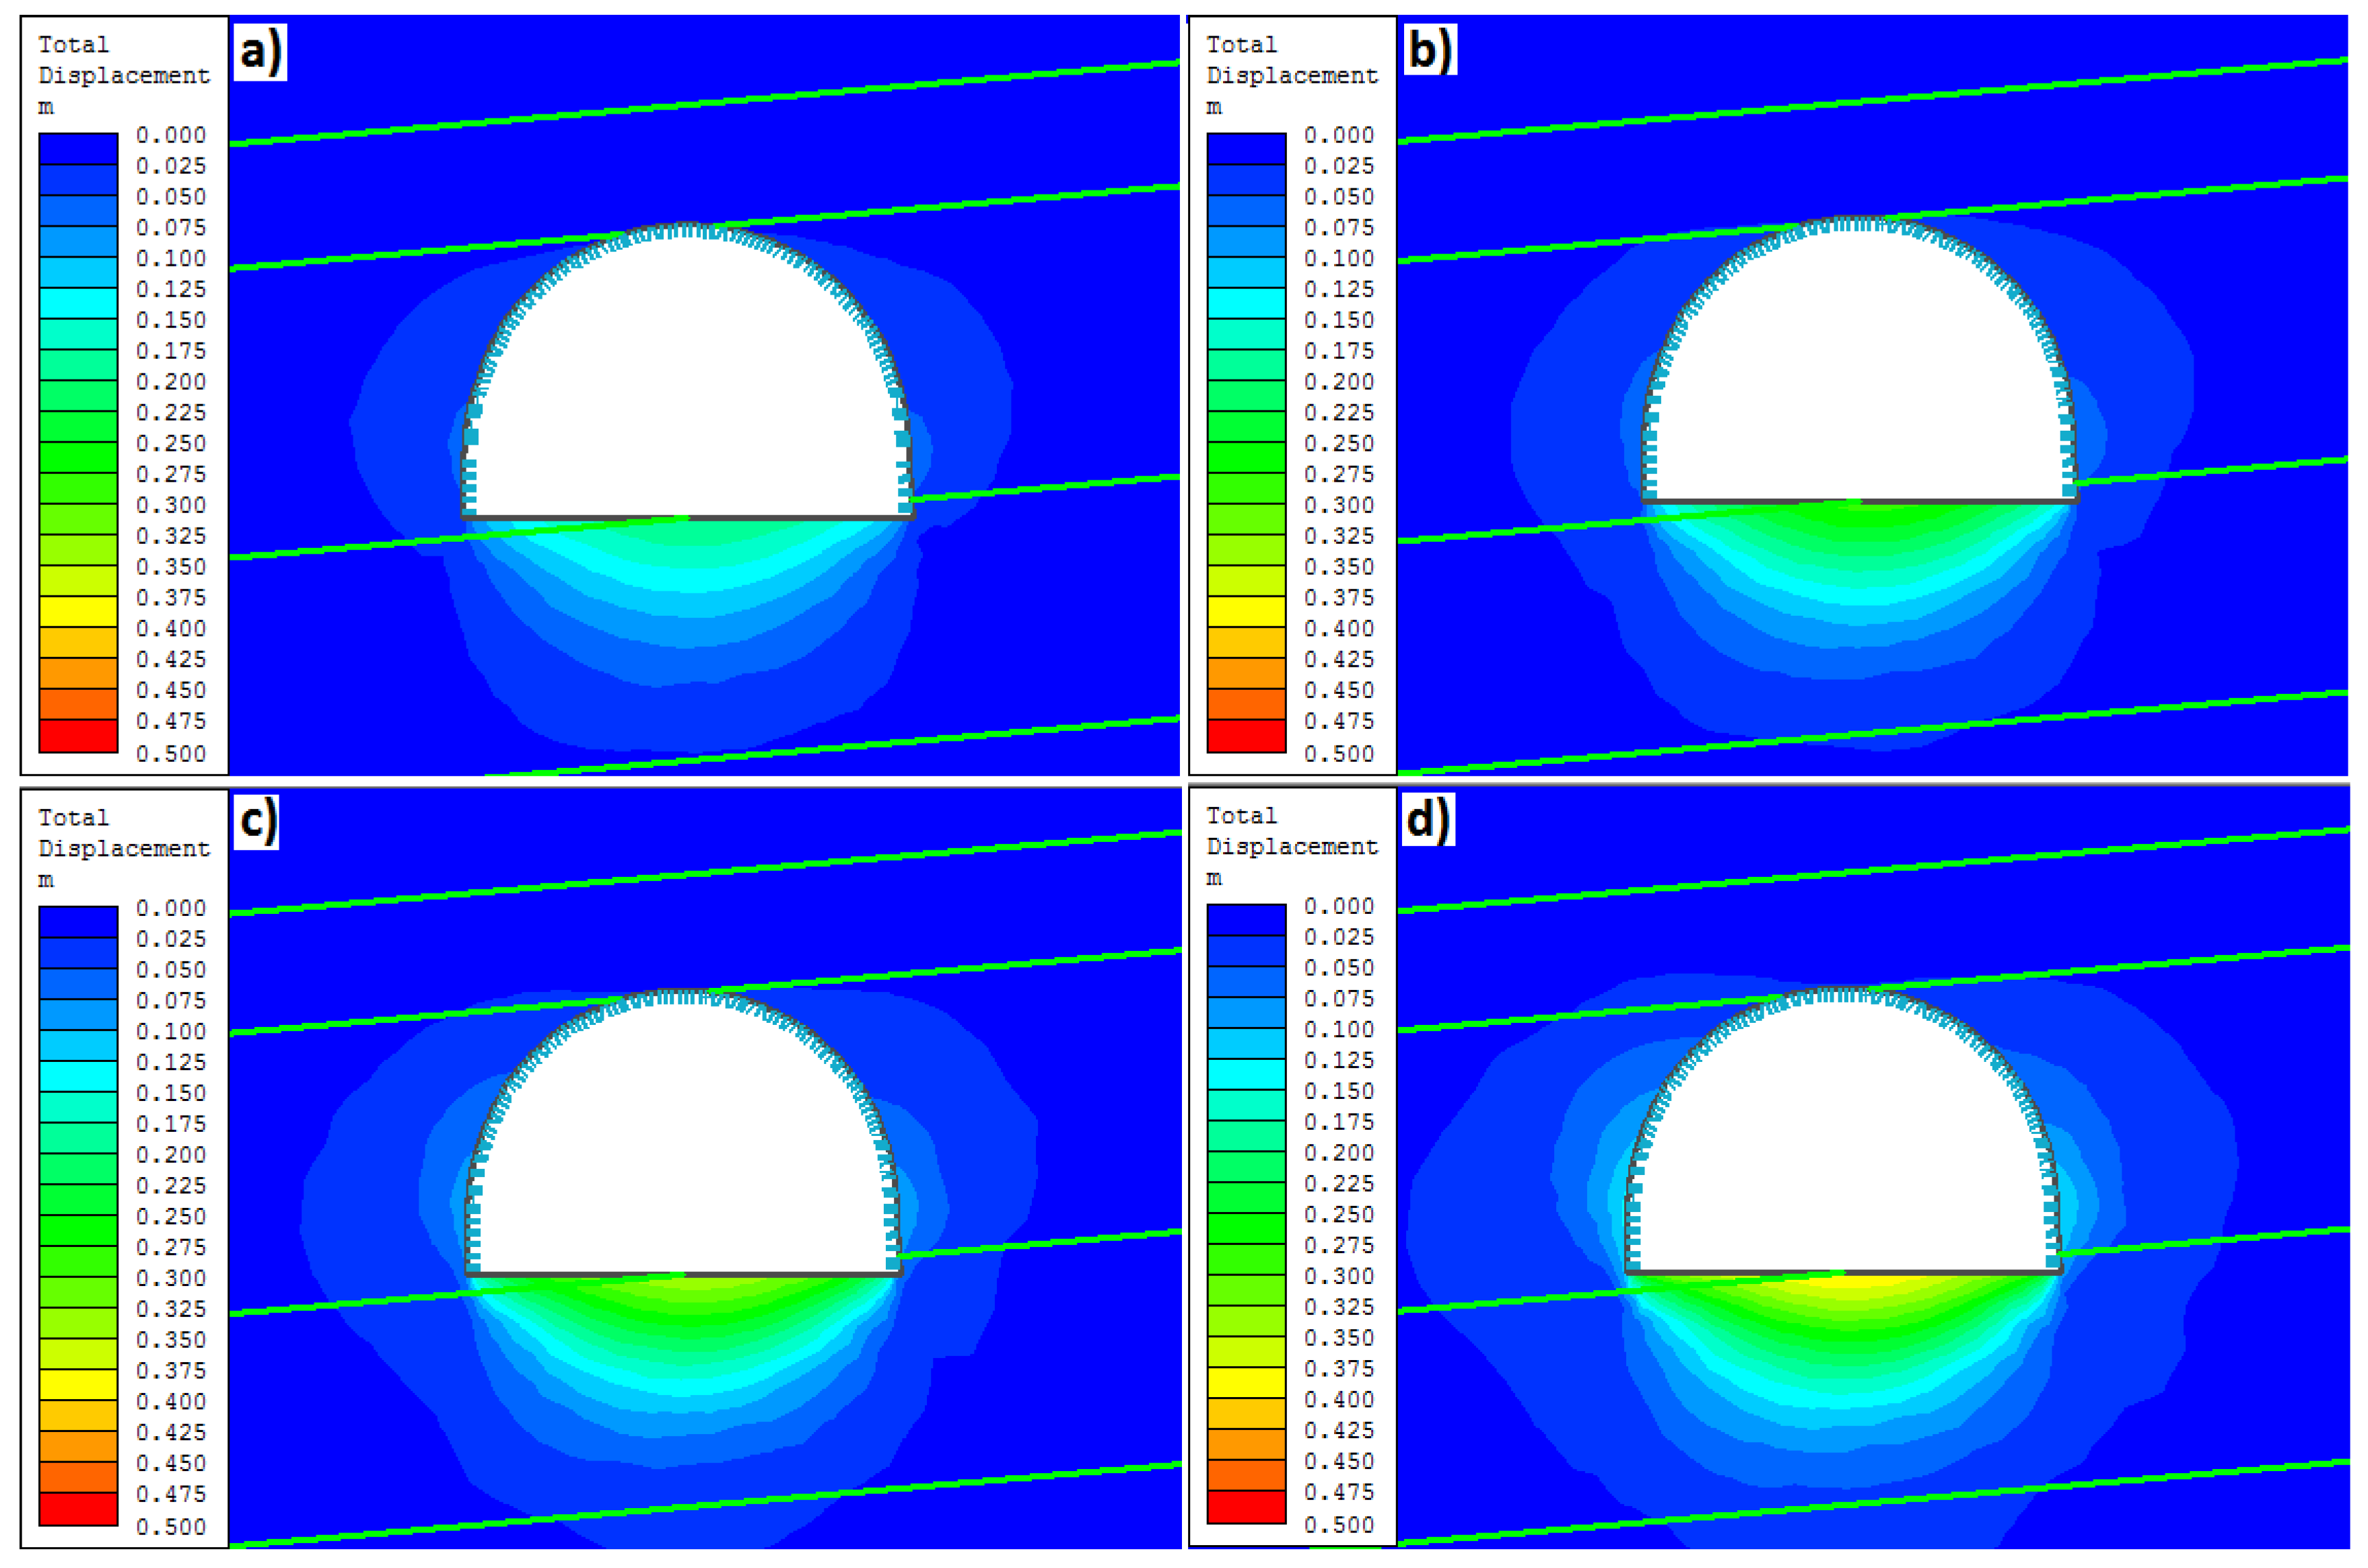
Figure 9.
Charts of rock mass deformation around roadway D-2—chainage 595 m. (a) Deformation corresponding to measurements 180 days after roadway excavation. (b) Deformation corresponding to measurements after 366 days after roadway excavation. (c) Deformation corresponding to measurements after 573 days after roadway excavation. (d) Deformation corresponding to measurements after 724 days after roadway excavation.
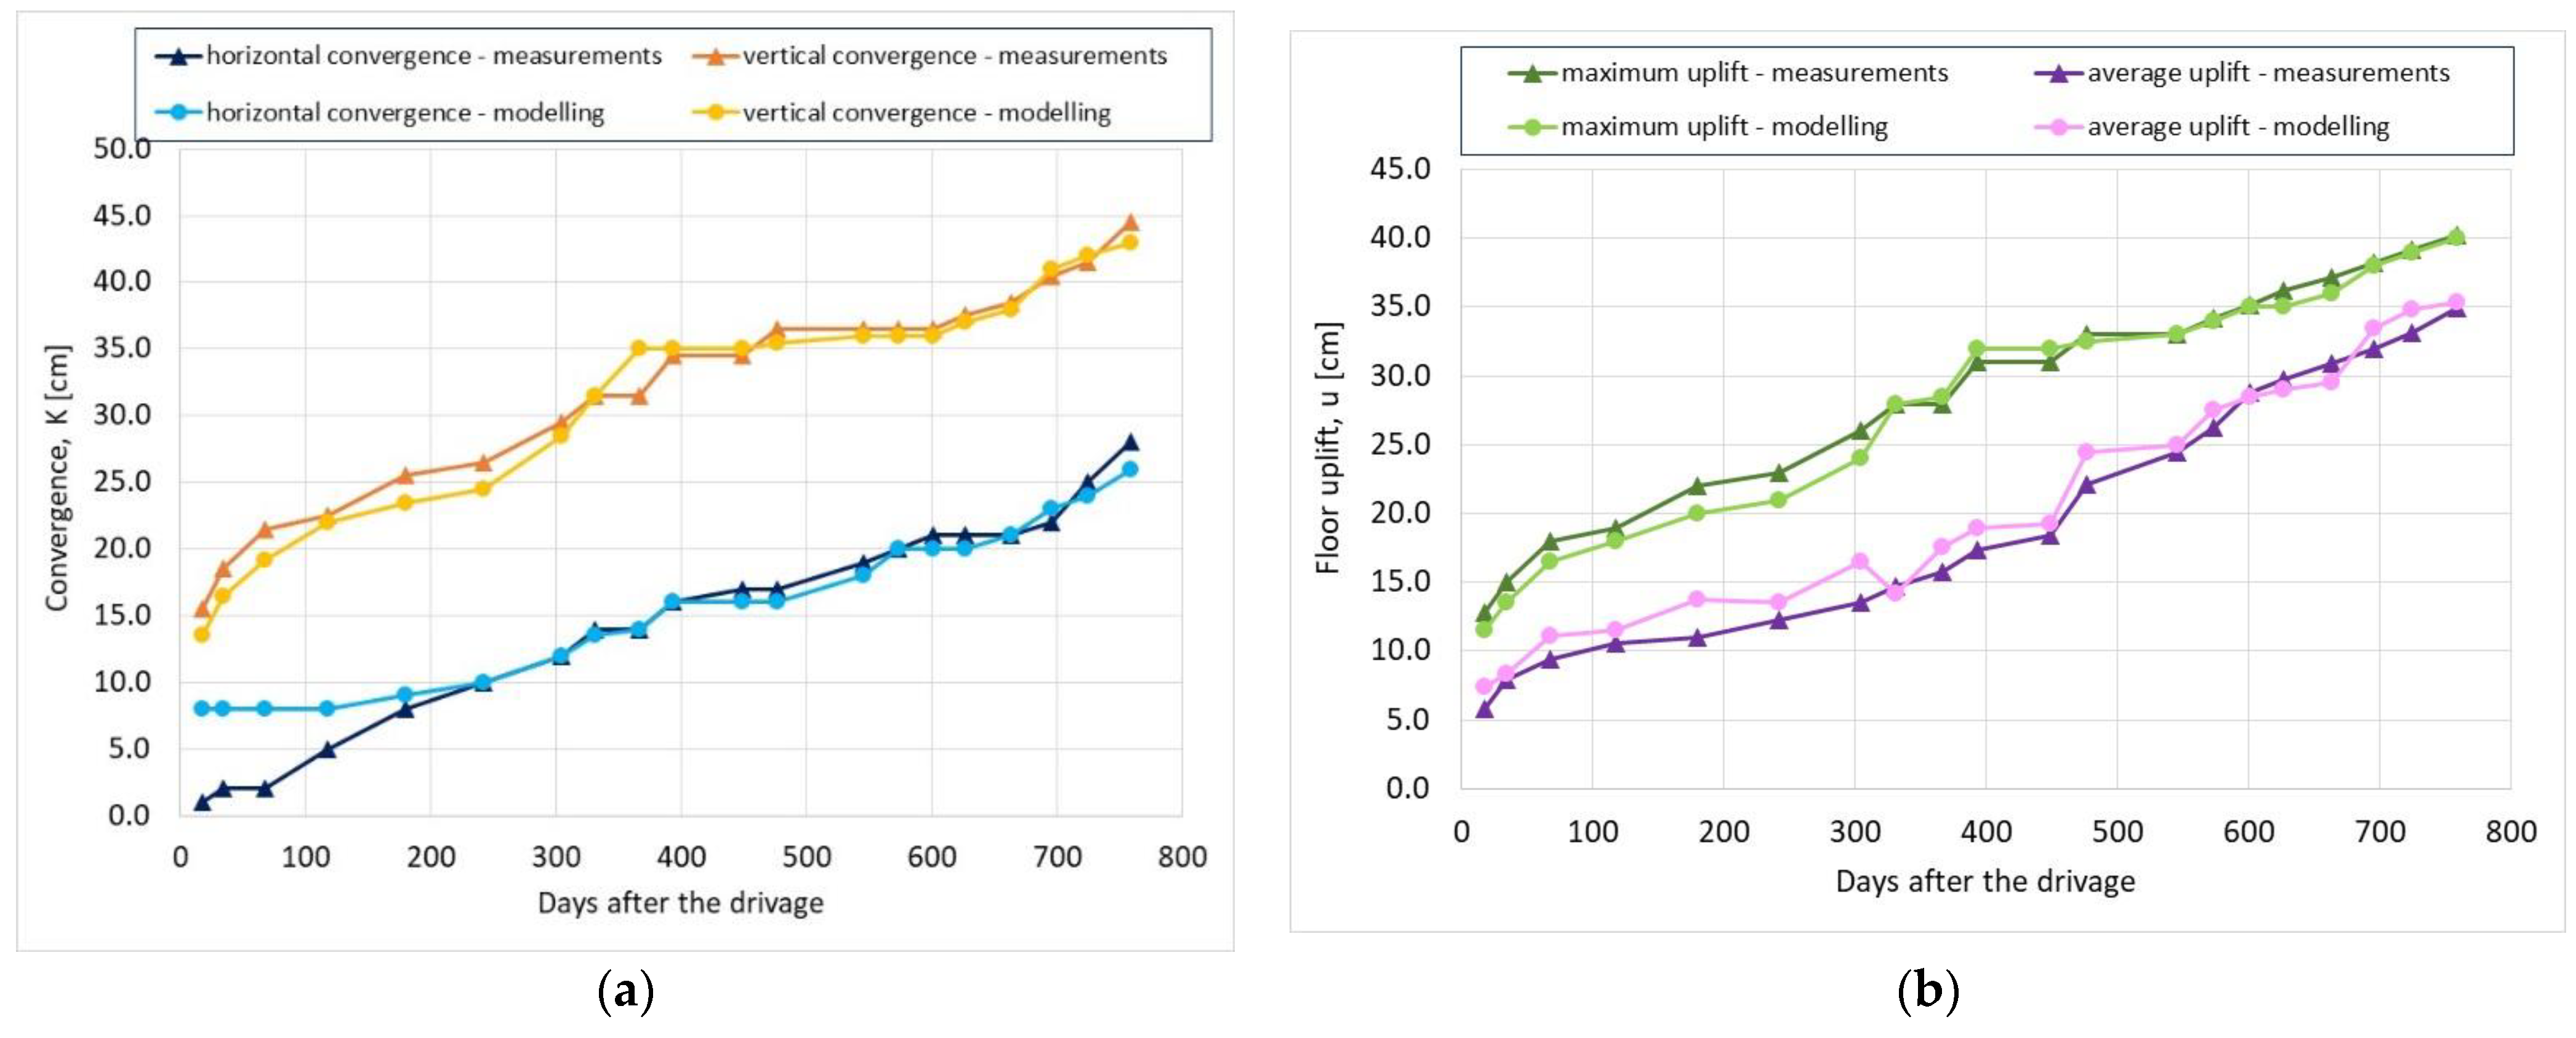
Figure 10.
The consistency between numerical modeling and underground measurements of roadway D-2 deformation—chainage 595 m. (a) Convergence. (b) Floor uplift.
Figure 10.
The consistency between numerical modeling and underground measurements of roadway D-2 deformation—chainage 595 m. (a) Convergence. (b) Floor uplift.
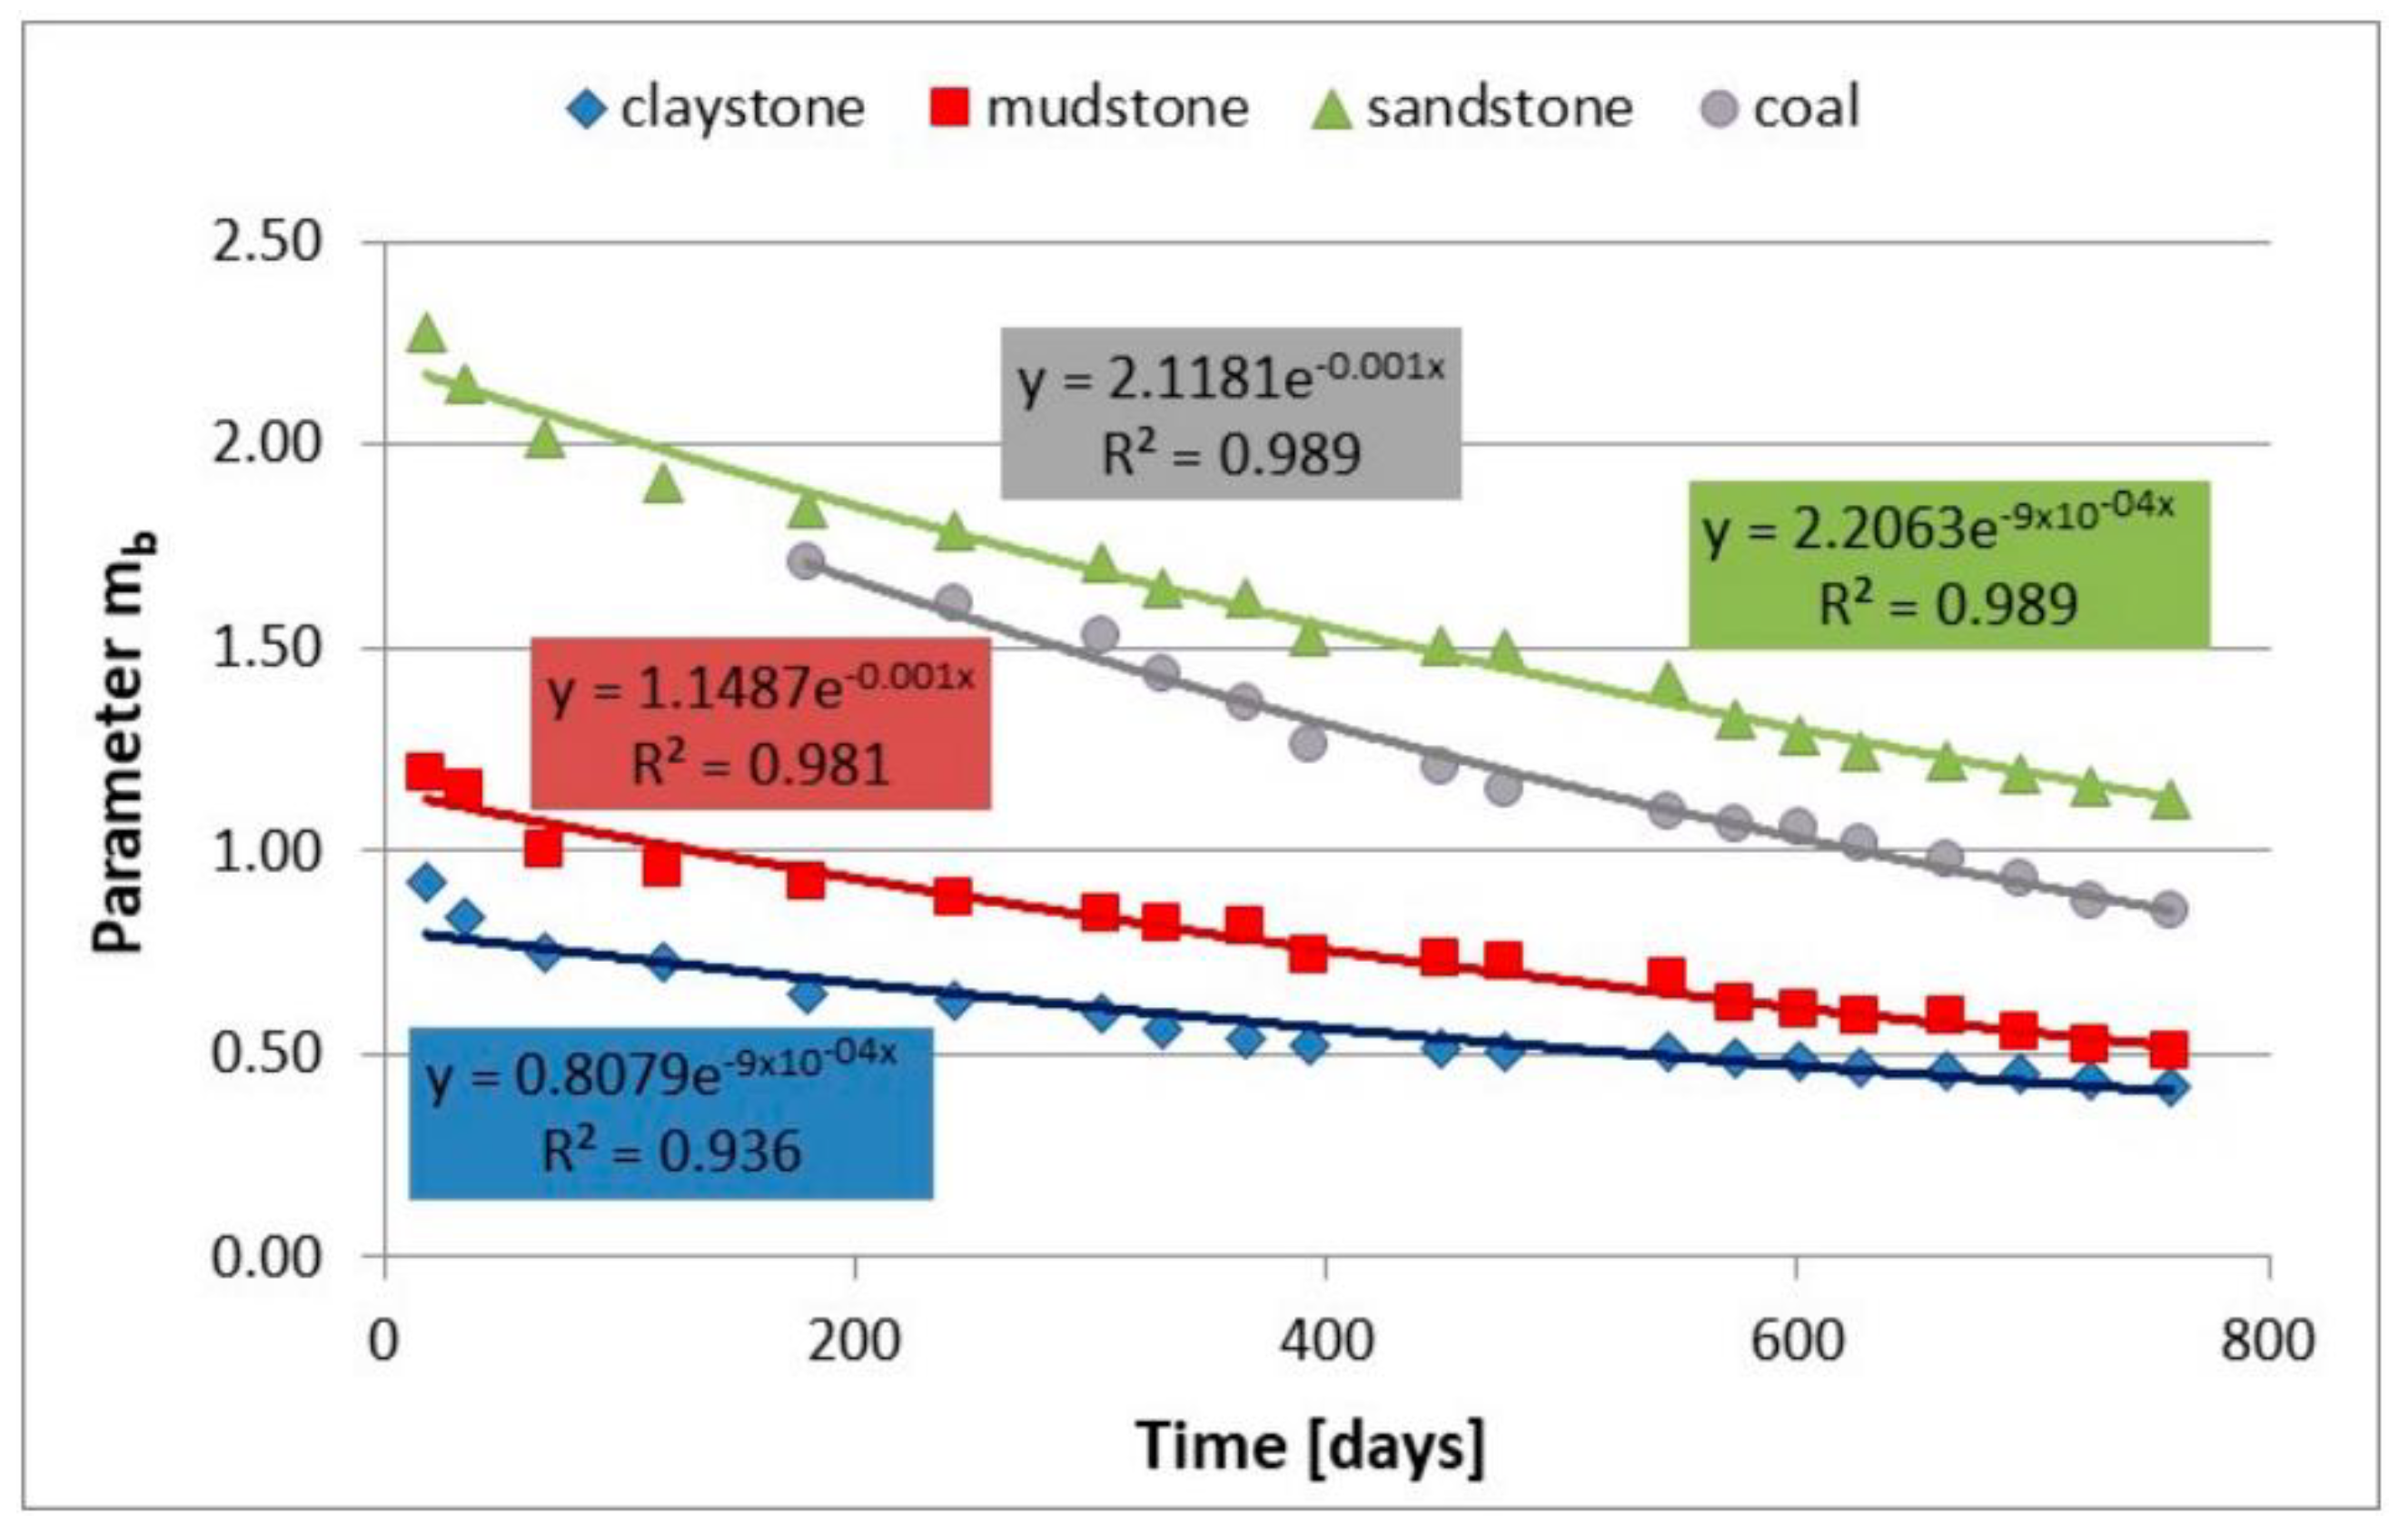
Figure 11.
Changes in Hoek–Brown parameter mb for rocks around roadway D-2, chainage 595 m.
Figure 11.
Changes in Hoek–Brown parameter mb for rocks around roadway D-2, chainage 595 m.
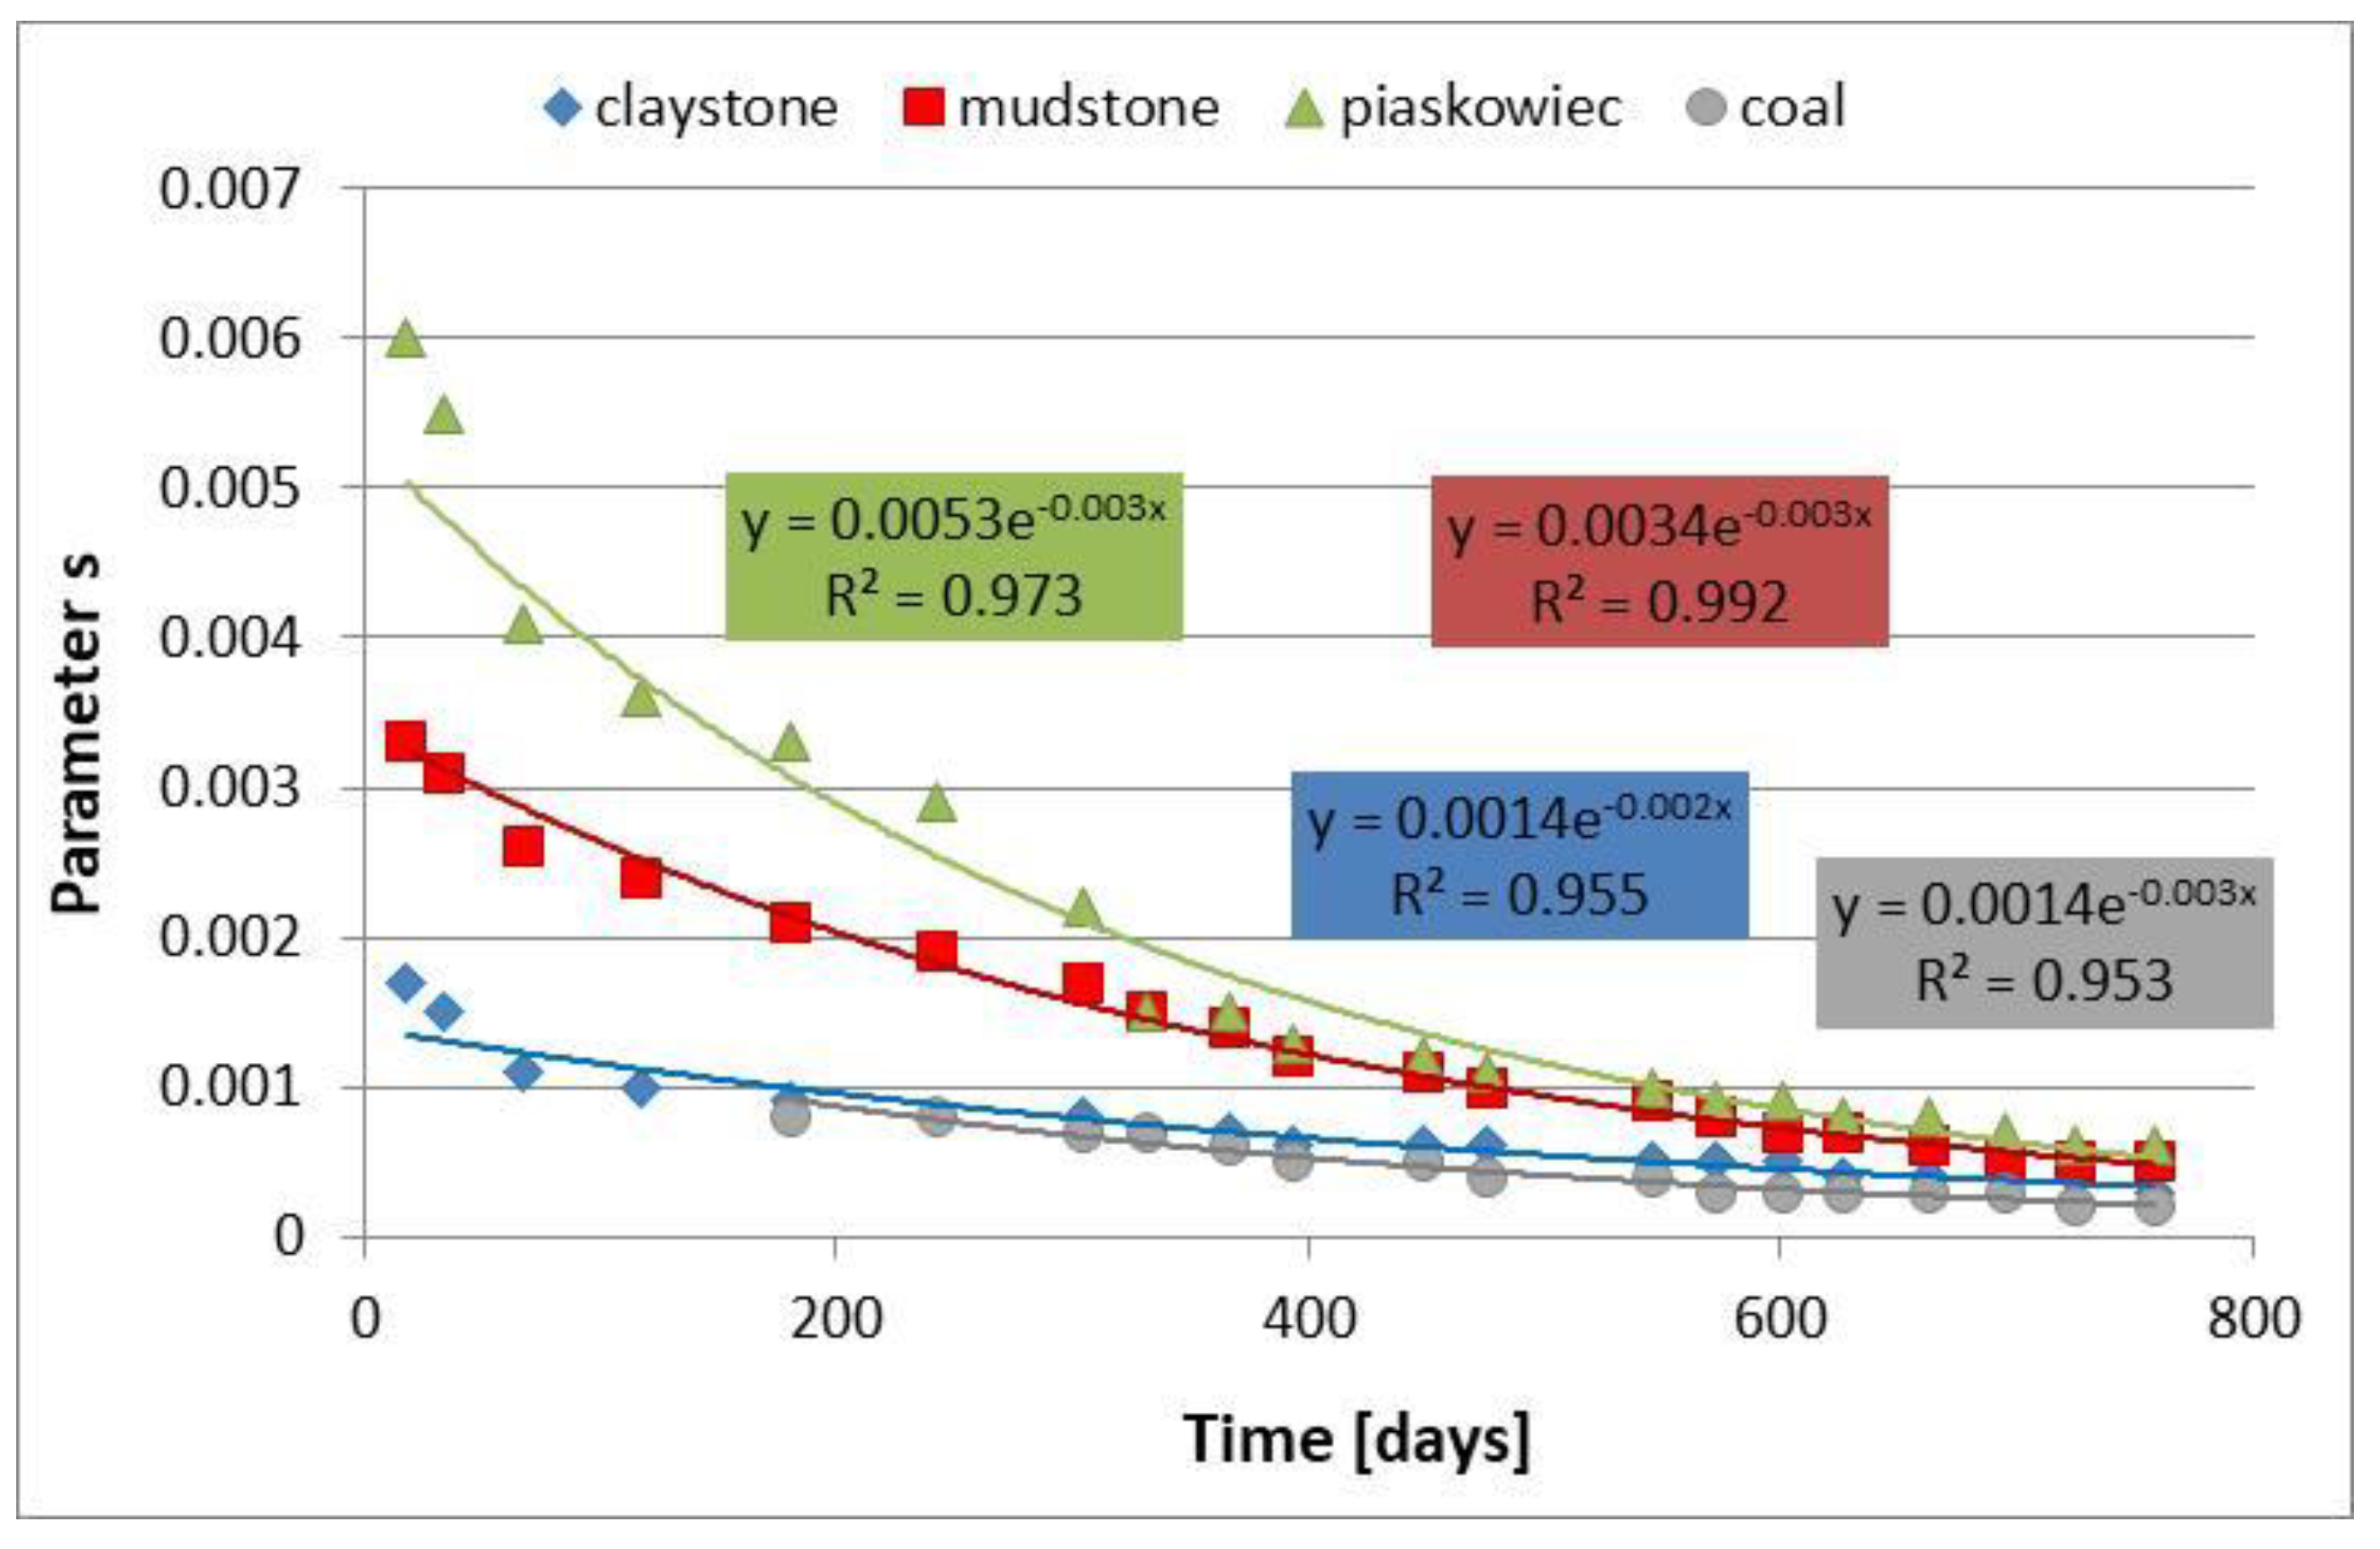
Figure 12.
Changes in Hoek–Brown parameter s for rocks around roadway D-2, chainage 595 m.
Figure 12.
Changes in Hoek–Brown parameter s for rocks around roadway D-2, chainage 595 m.
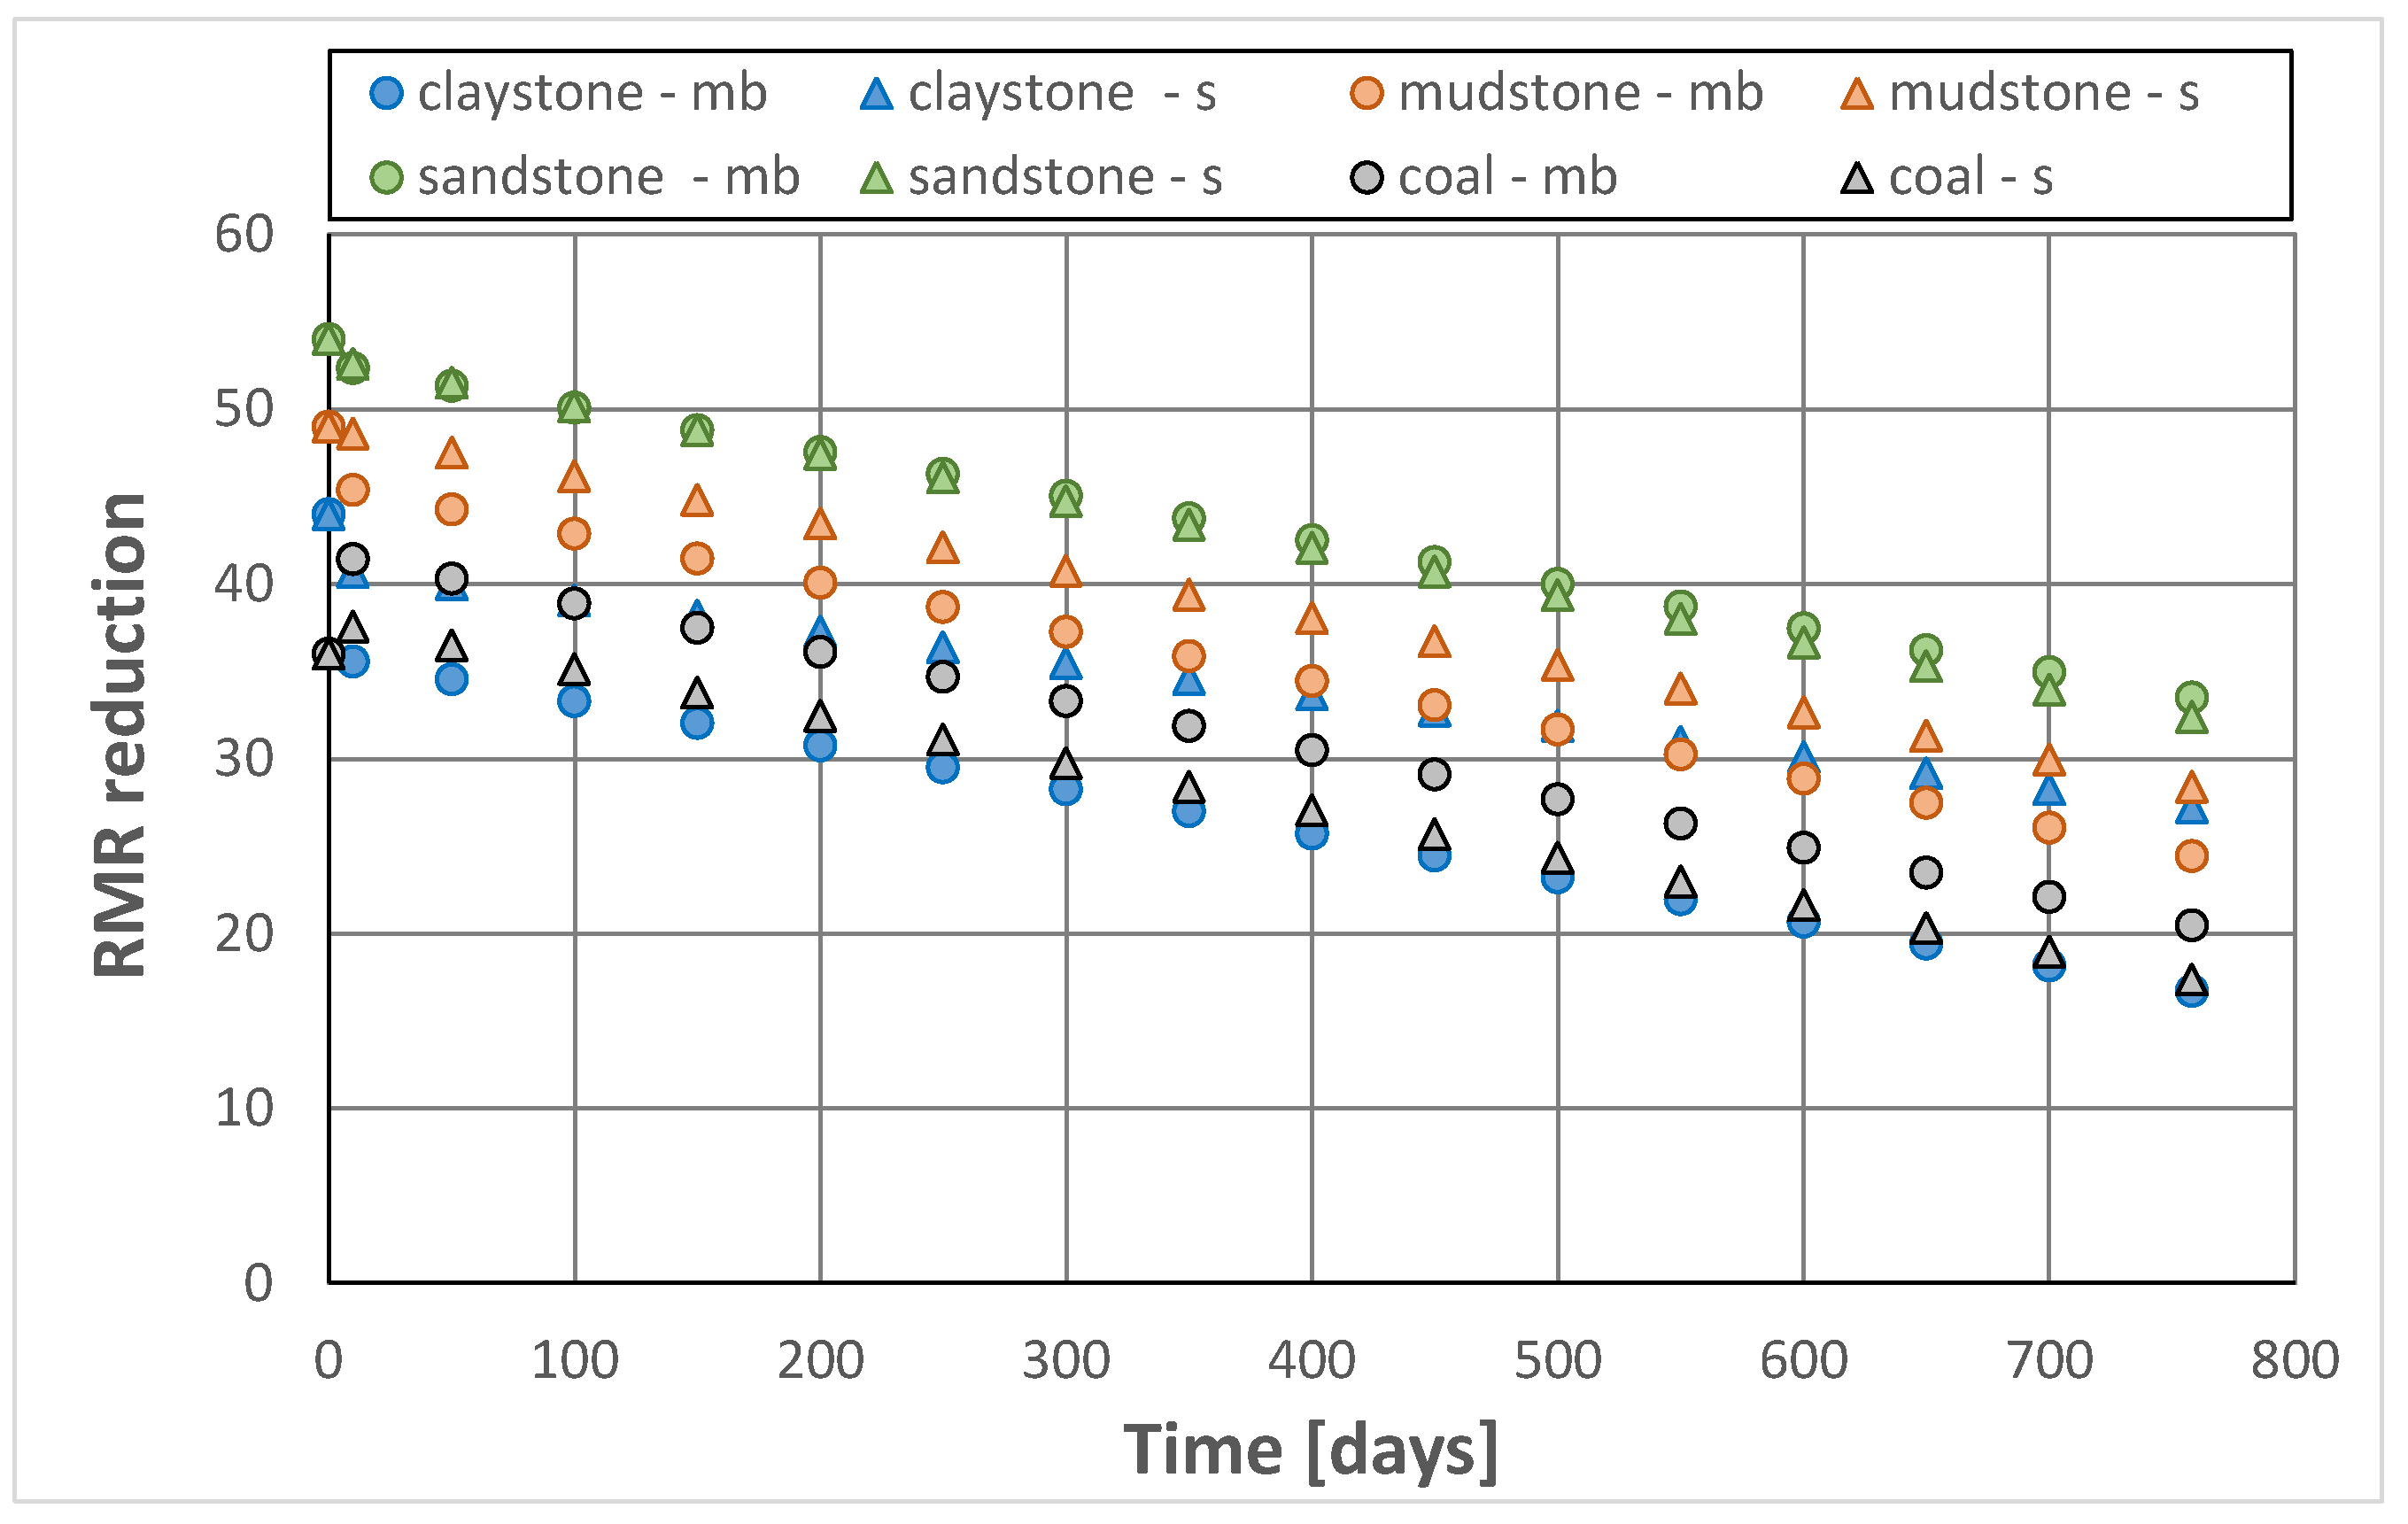
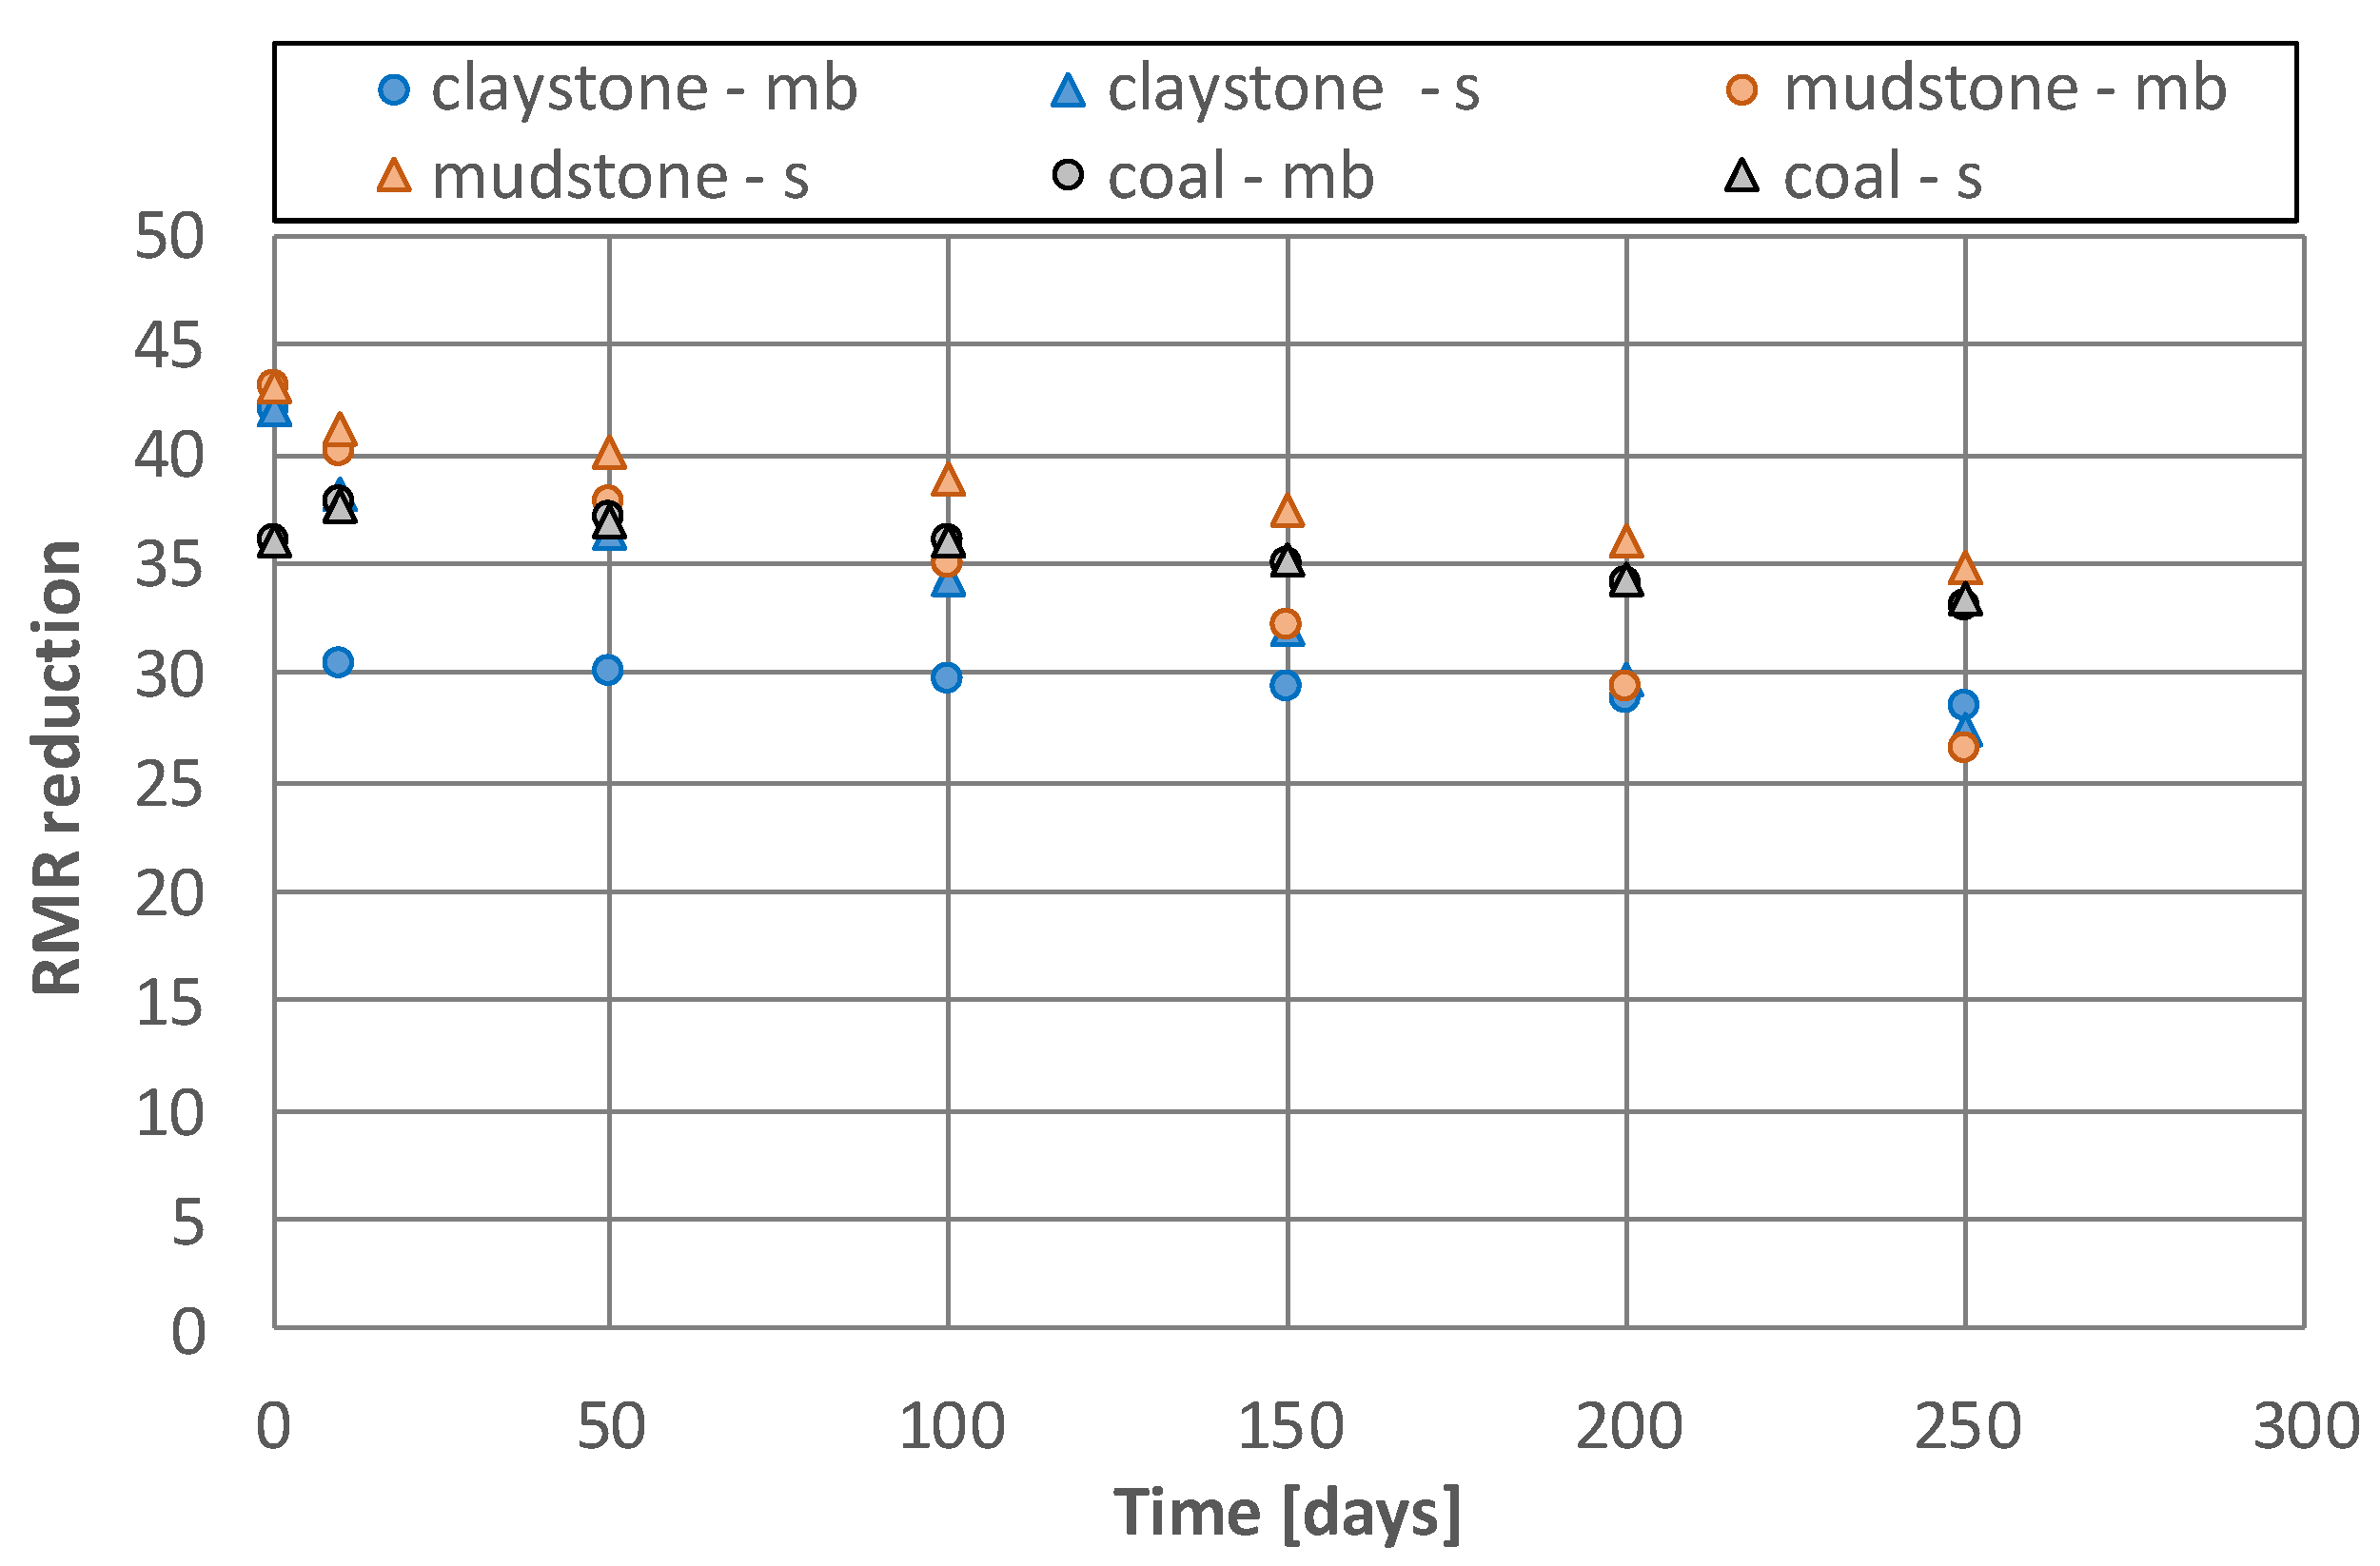
Figure 13.
RMR decrease corresponding to mb and s decrease versus time—rocks around roadway D-2.
Figure 13.
RMR decrease corresponding to mb and s decrease versus time—rocks around roadway D-2.
Figure 14.
Initial convergence results for roadway F-33.
Figure 14.
Initial convergence results for roadway F-33.
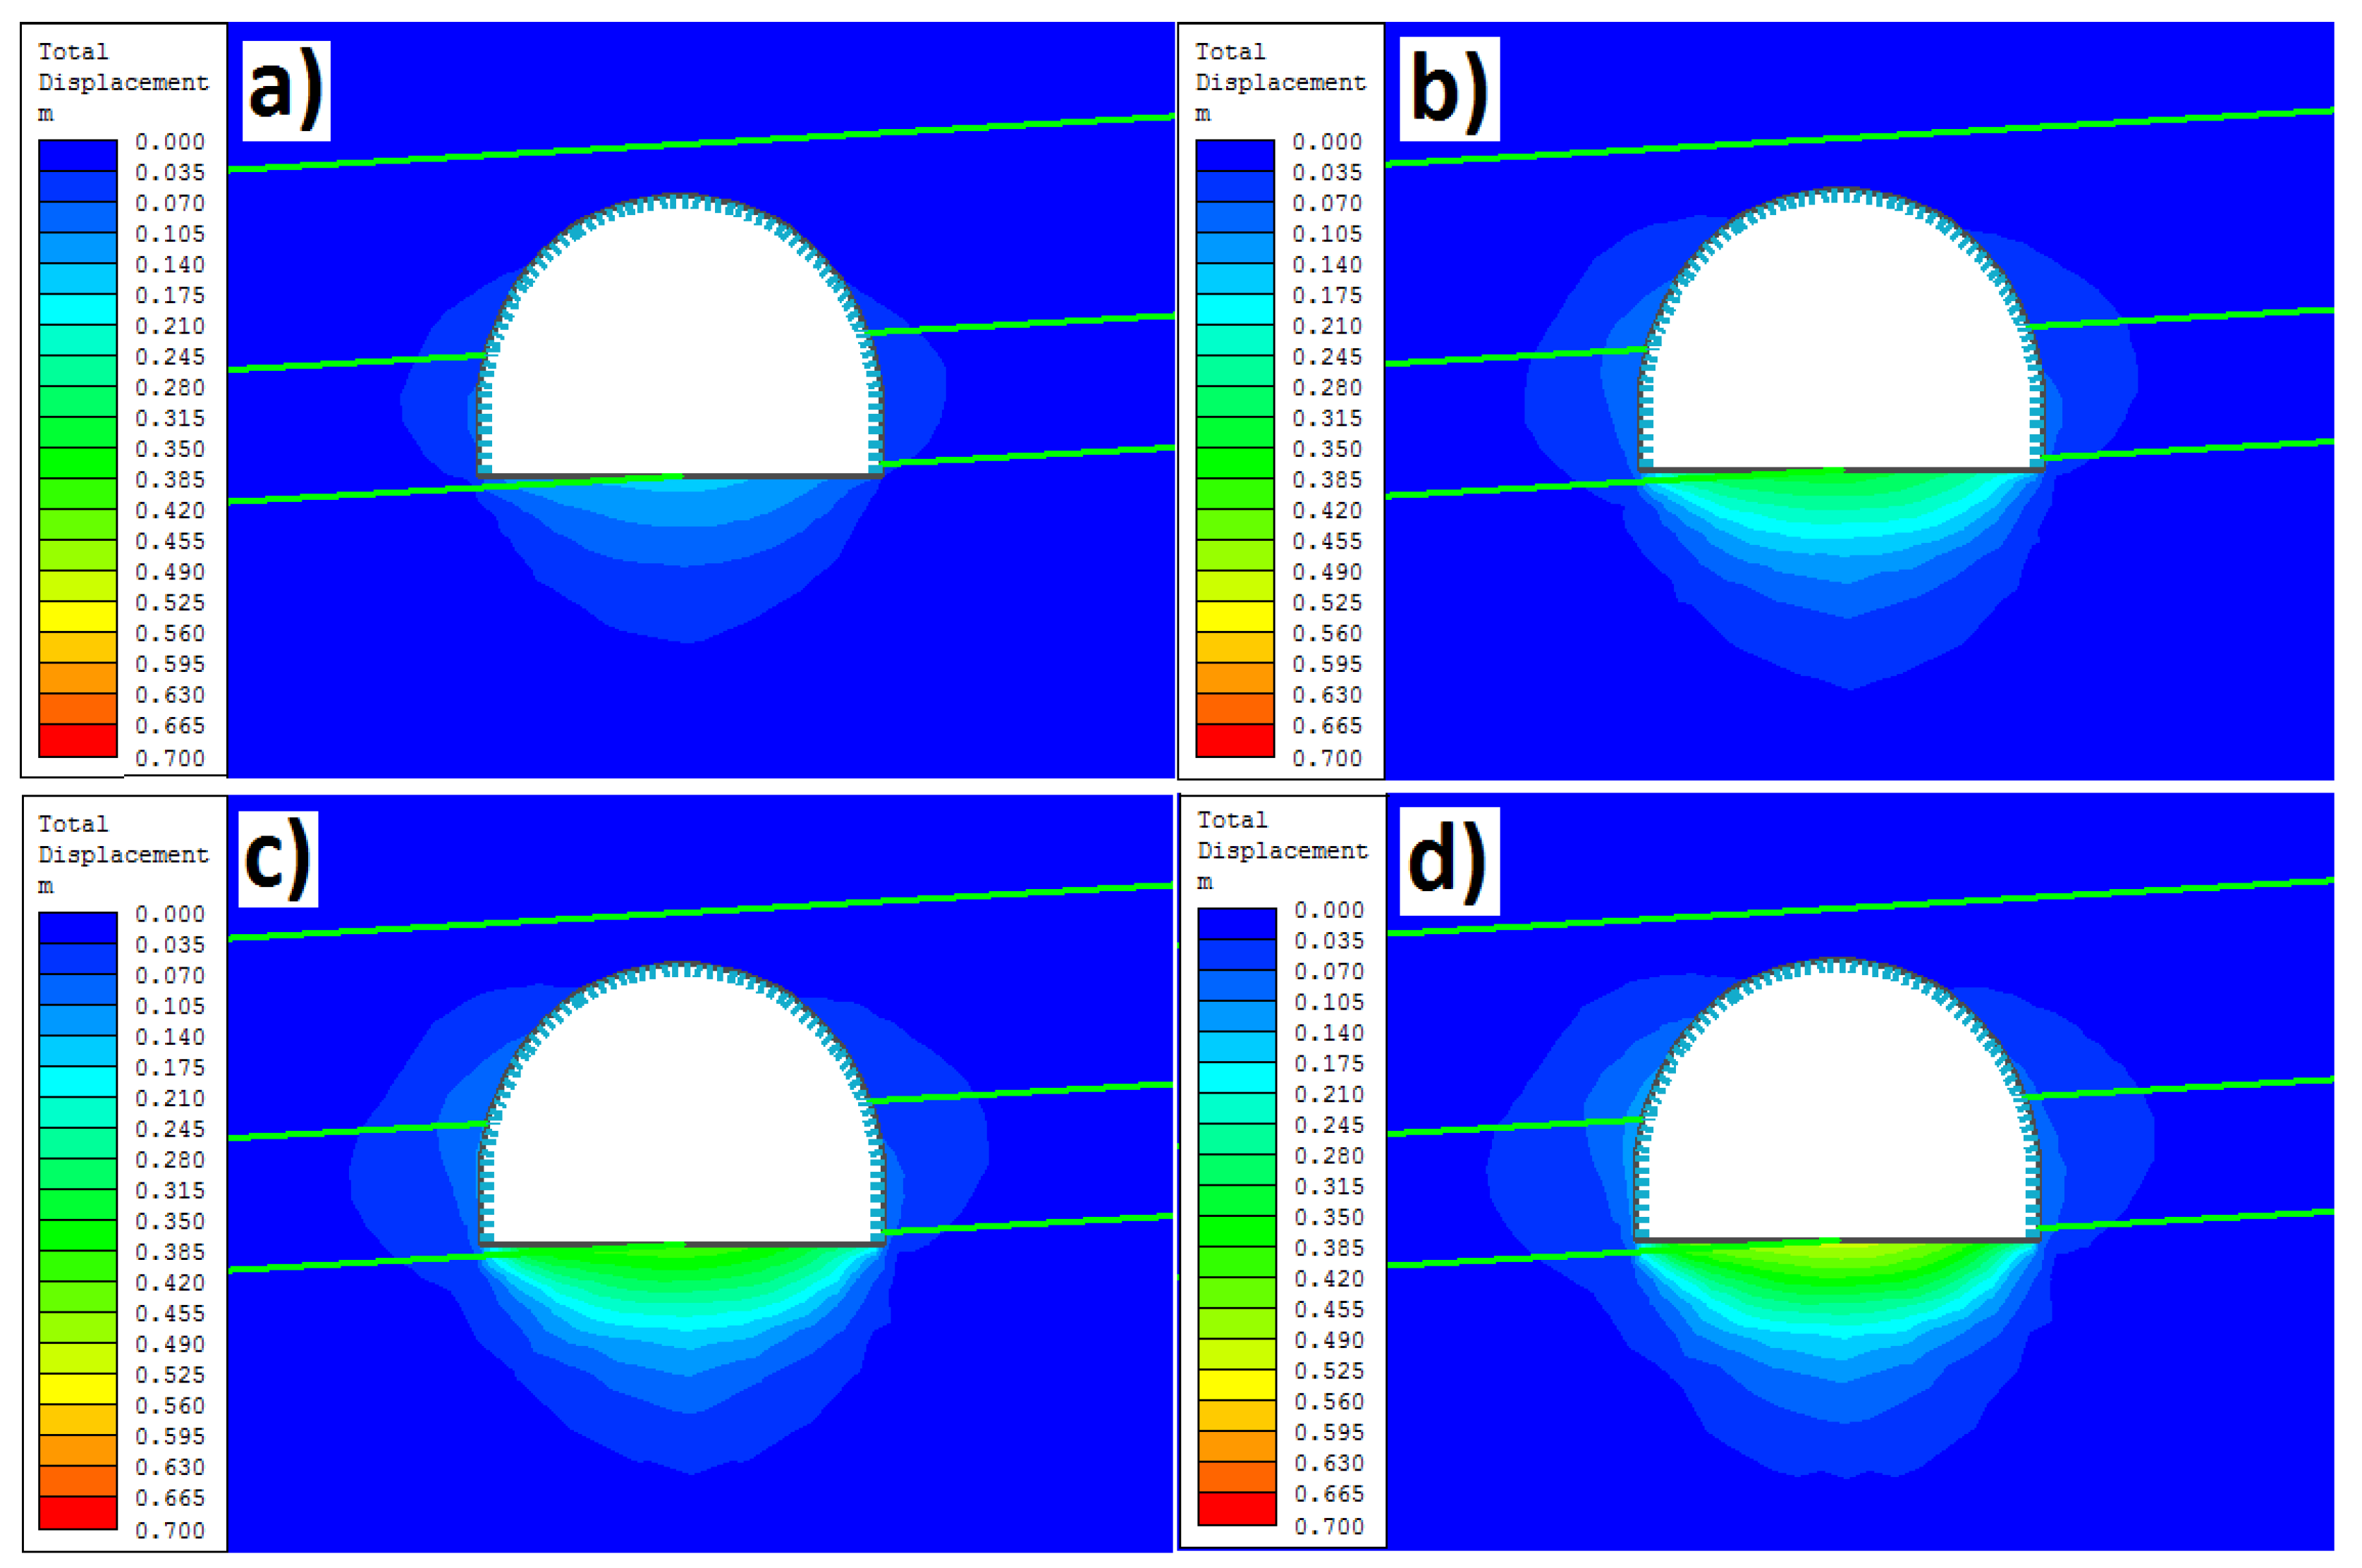
Figure 15.
Charts of rock mass deformation around roadway F-33—chainage 405 m. (a) Deformation corresponding to measurements 36 days after roadway excavation. (b) Deformation corresponding to measurements 91 days after roadway excavation. (c) Deformation corresponding to measurements 153 days after roadway excavation. (d) Deformation corresponding to measurements 209 days after roadway excavation.
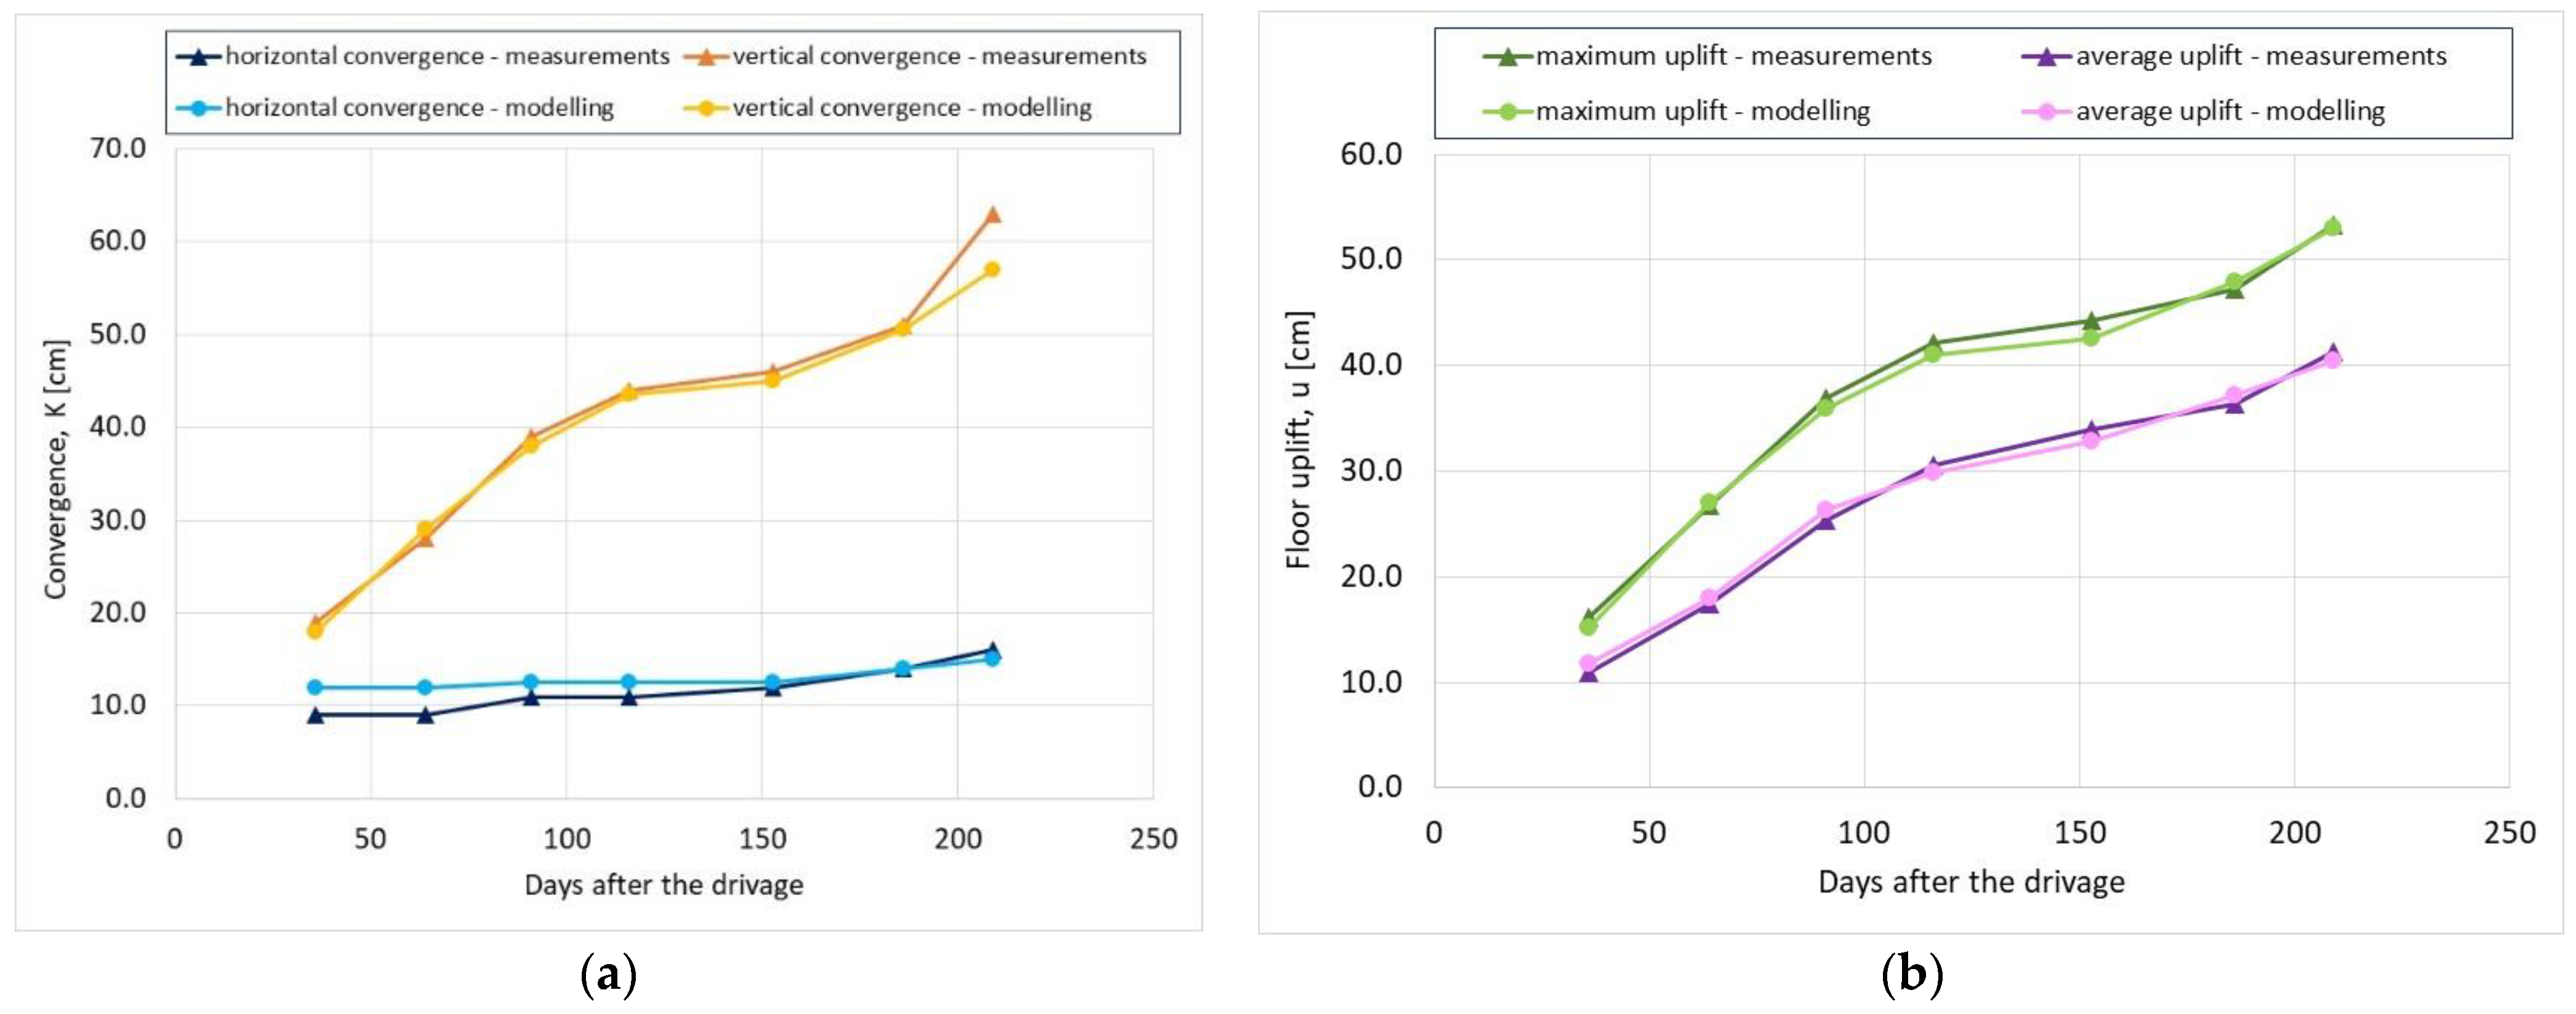
Figure 16.
The consistency between numerical modeling and underground measurements of roadway F-33 deformation at chainage 405 m. (a) Convergence. (b) Floor uplift.
Figure 16.
The consistency between numerical modeling and underground measurements of roadway F-33 deformation at chainage 405 m. (a) Convergence. (b) Floor uplift.
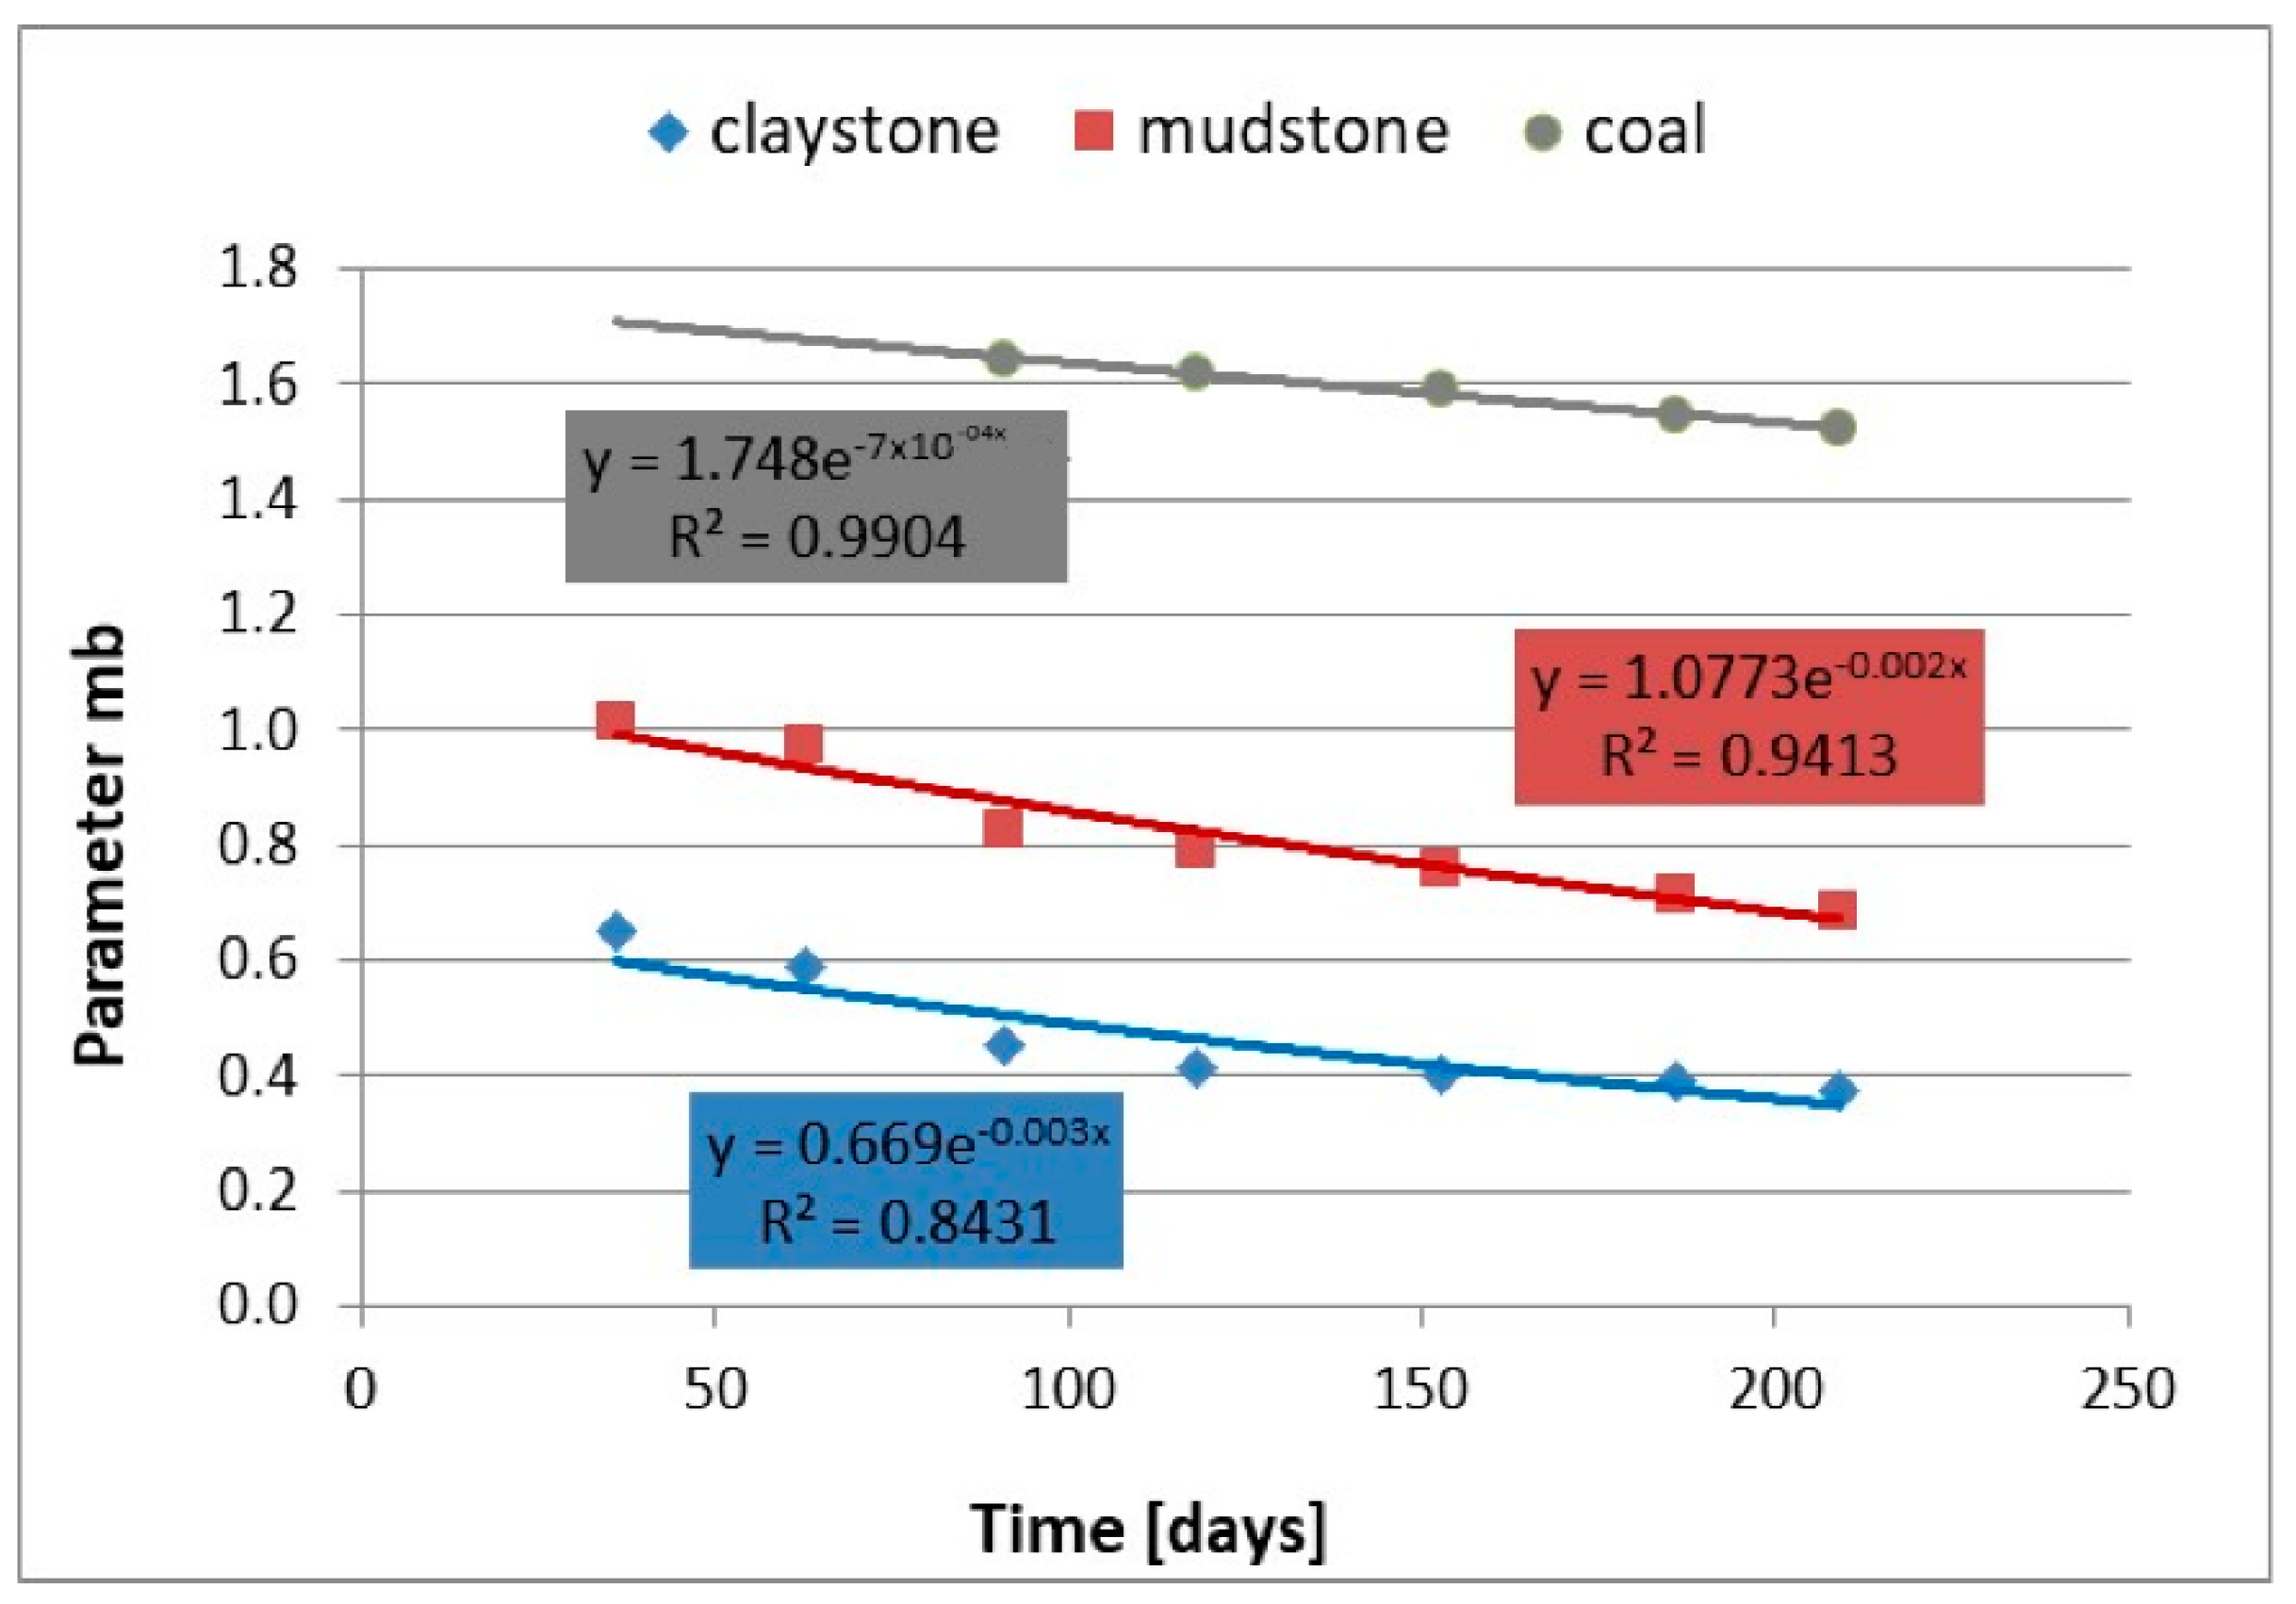
Figure 17.
Changes in the post-failure parameter mb of the rocks around roadway F-33—convergence-monitoring station at chainage 405 m.
Figure 17.
Changes in the post-failure parameter mb of the rocks around roadway F-33—convergence-monitoring station at chainage 405 m.
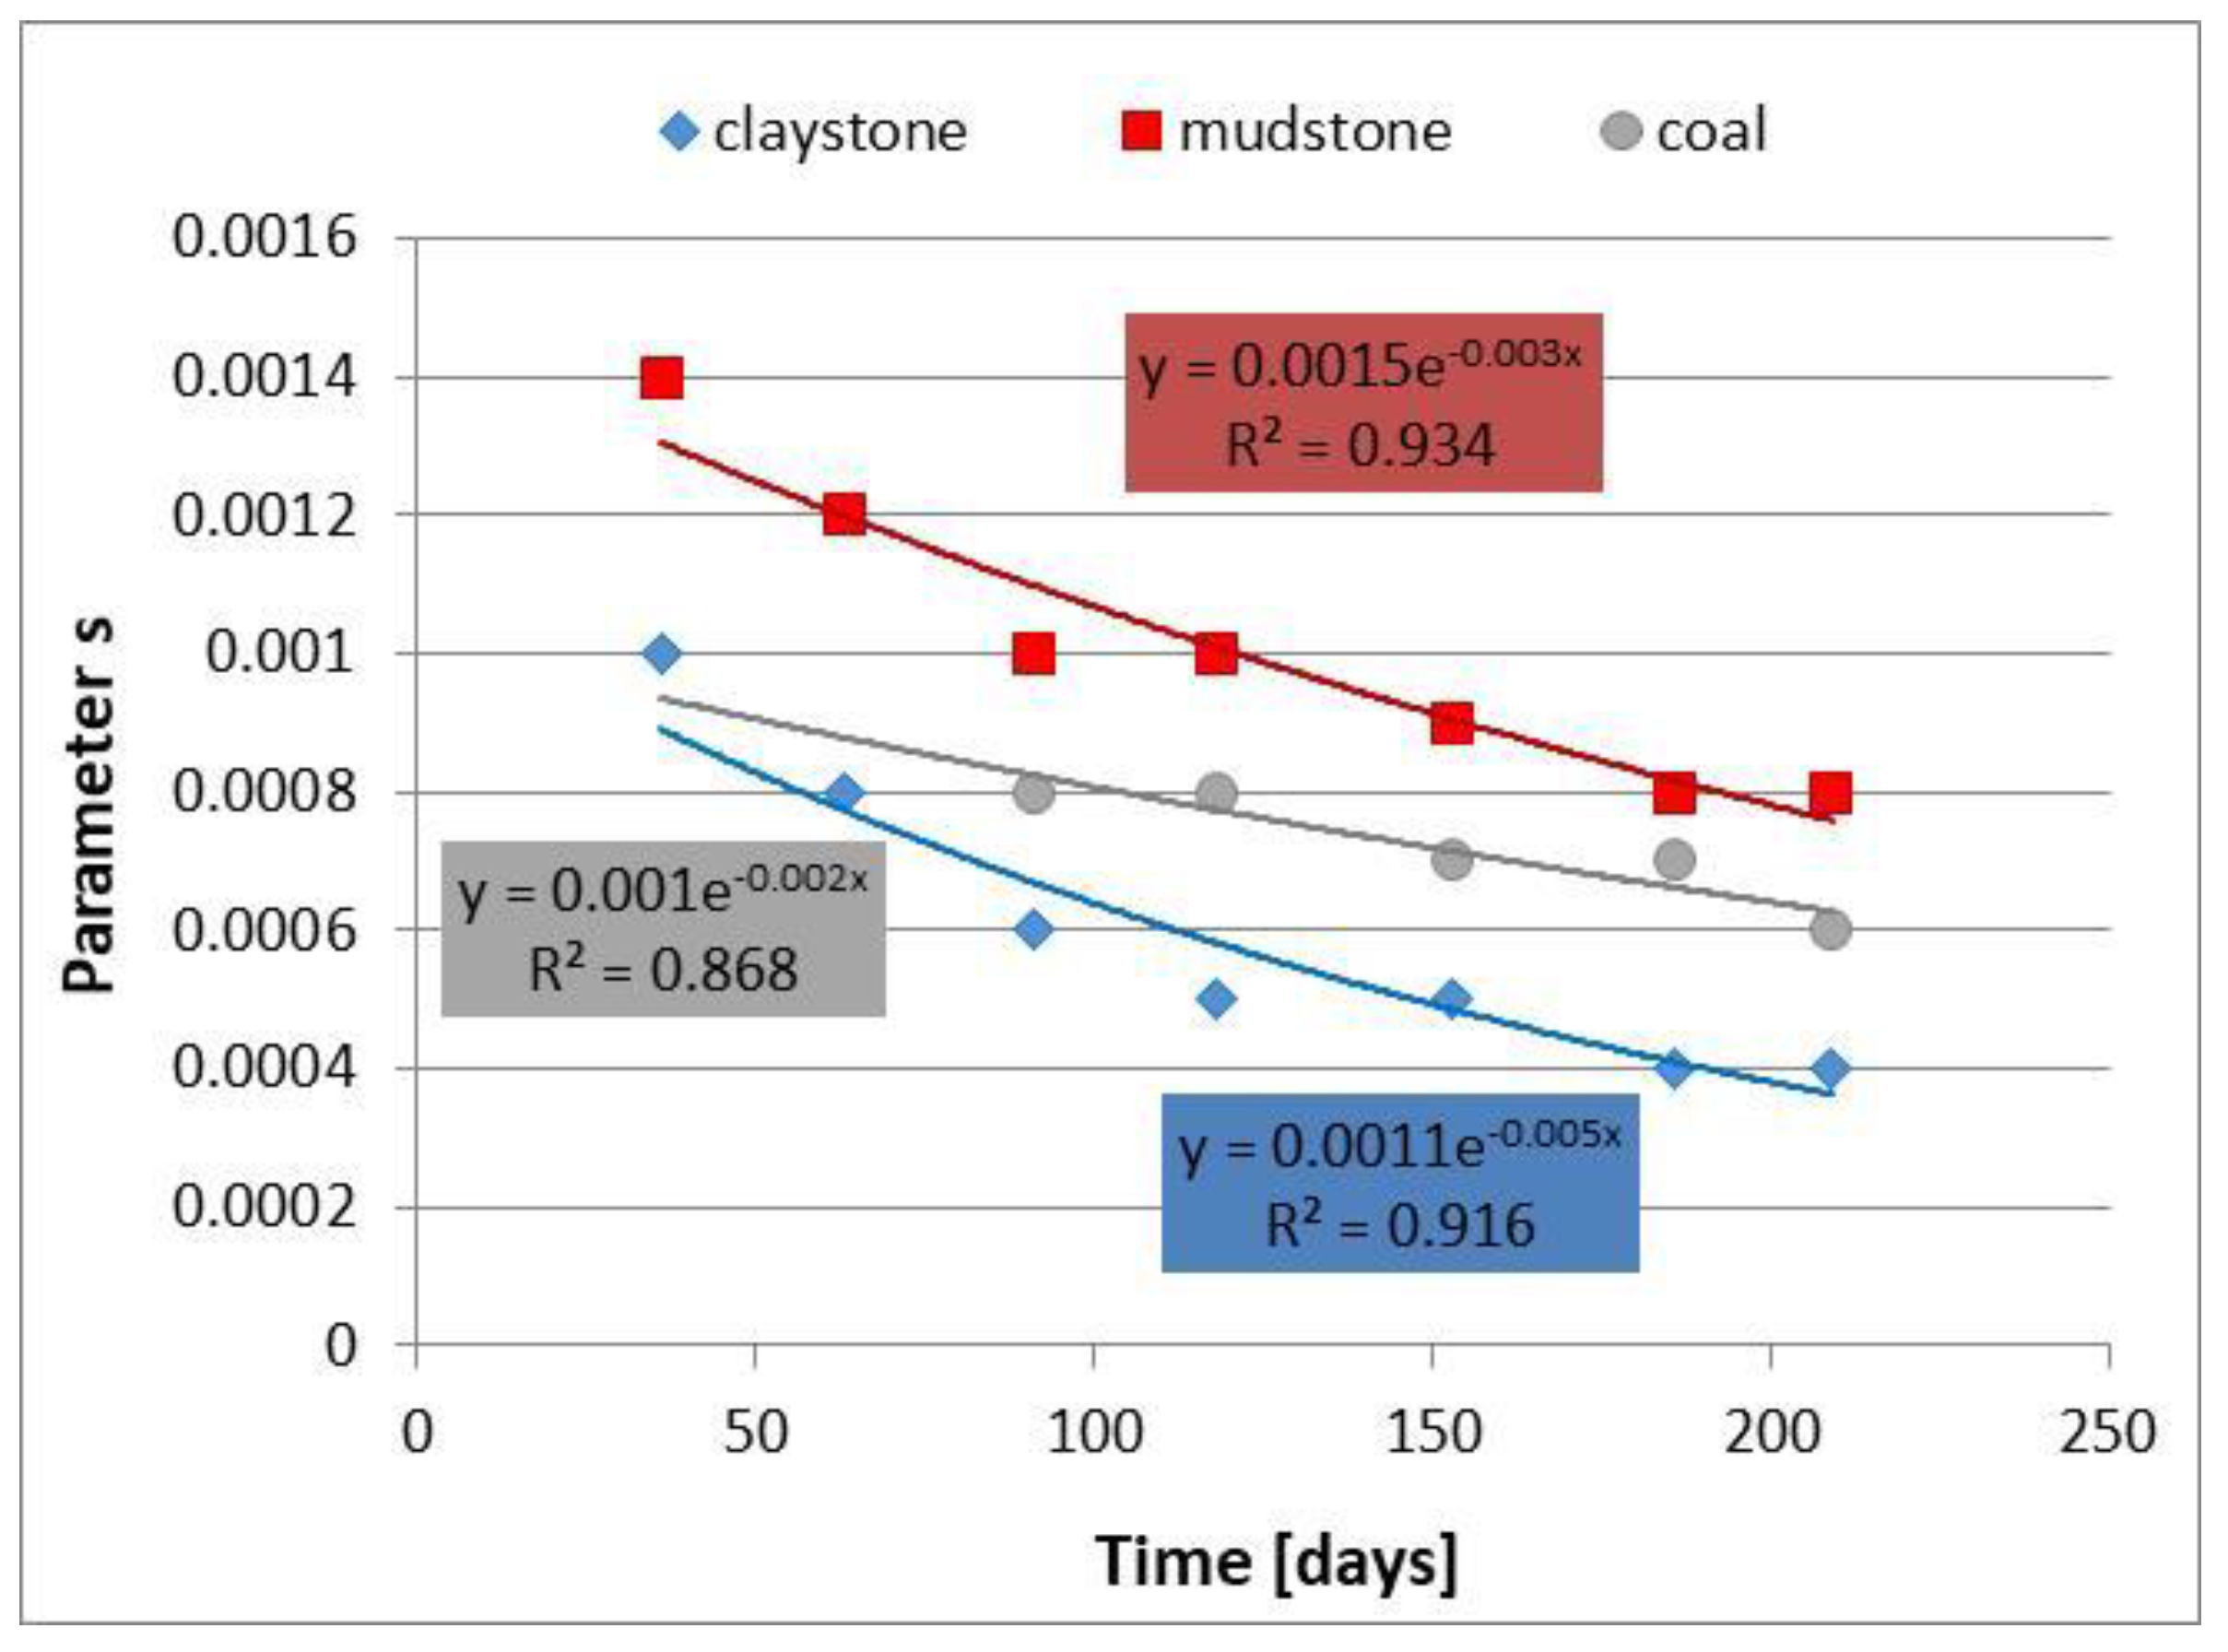
Figure 18.
Changes in the post-failure parameter s of the rocks around roadway F-33—convergence-monitoring station at chainage 405 m.
Figure 18.
Changes in the post-failure parameter s of the rocks around roadway F-33—convergence-monitoring station at chainage 405 m.
Figure 19.
RMR decrease corresponding to mb and s decrease versus time—rocks around roadway F-33.
Figure 19.
RMR decrease corresponding to mb and s decrease versus time—rocks around roadway F-33.
Figure 20.
An example of results of swelling test on claystone from roadway F-33.
Figure 20.
An example of results of swelling test on claystone from roadway F-33.
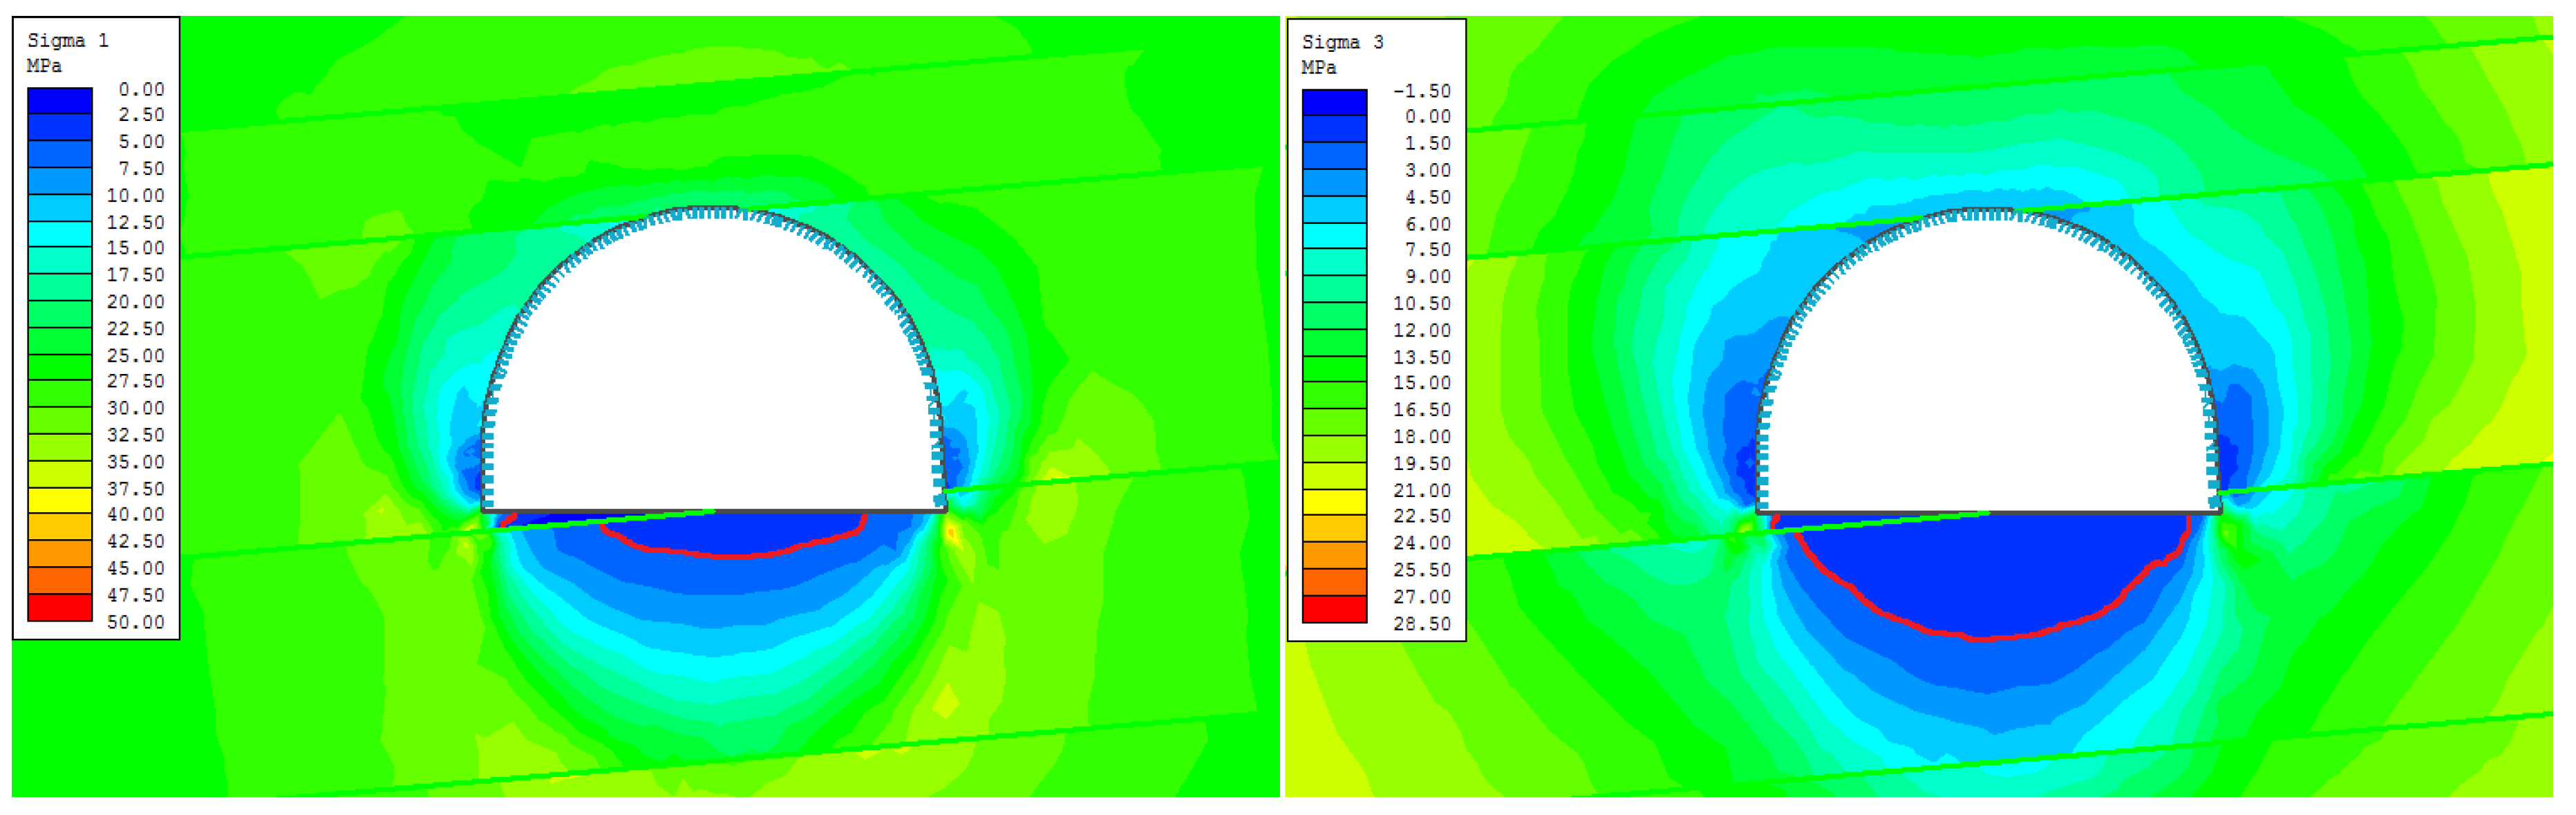
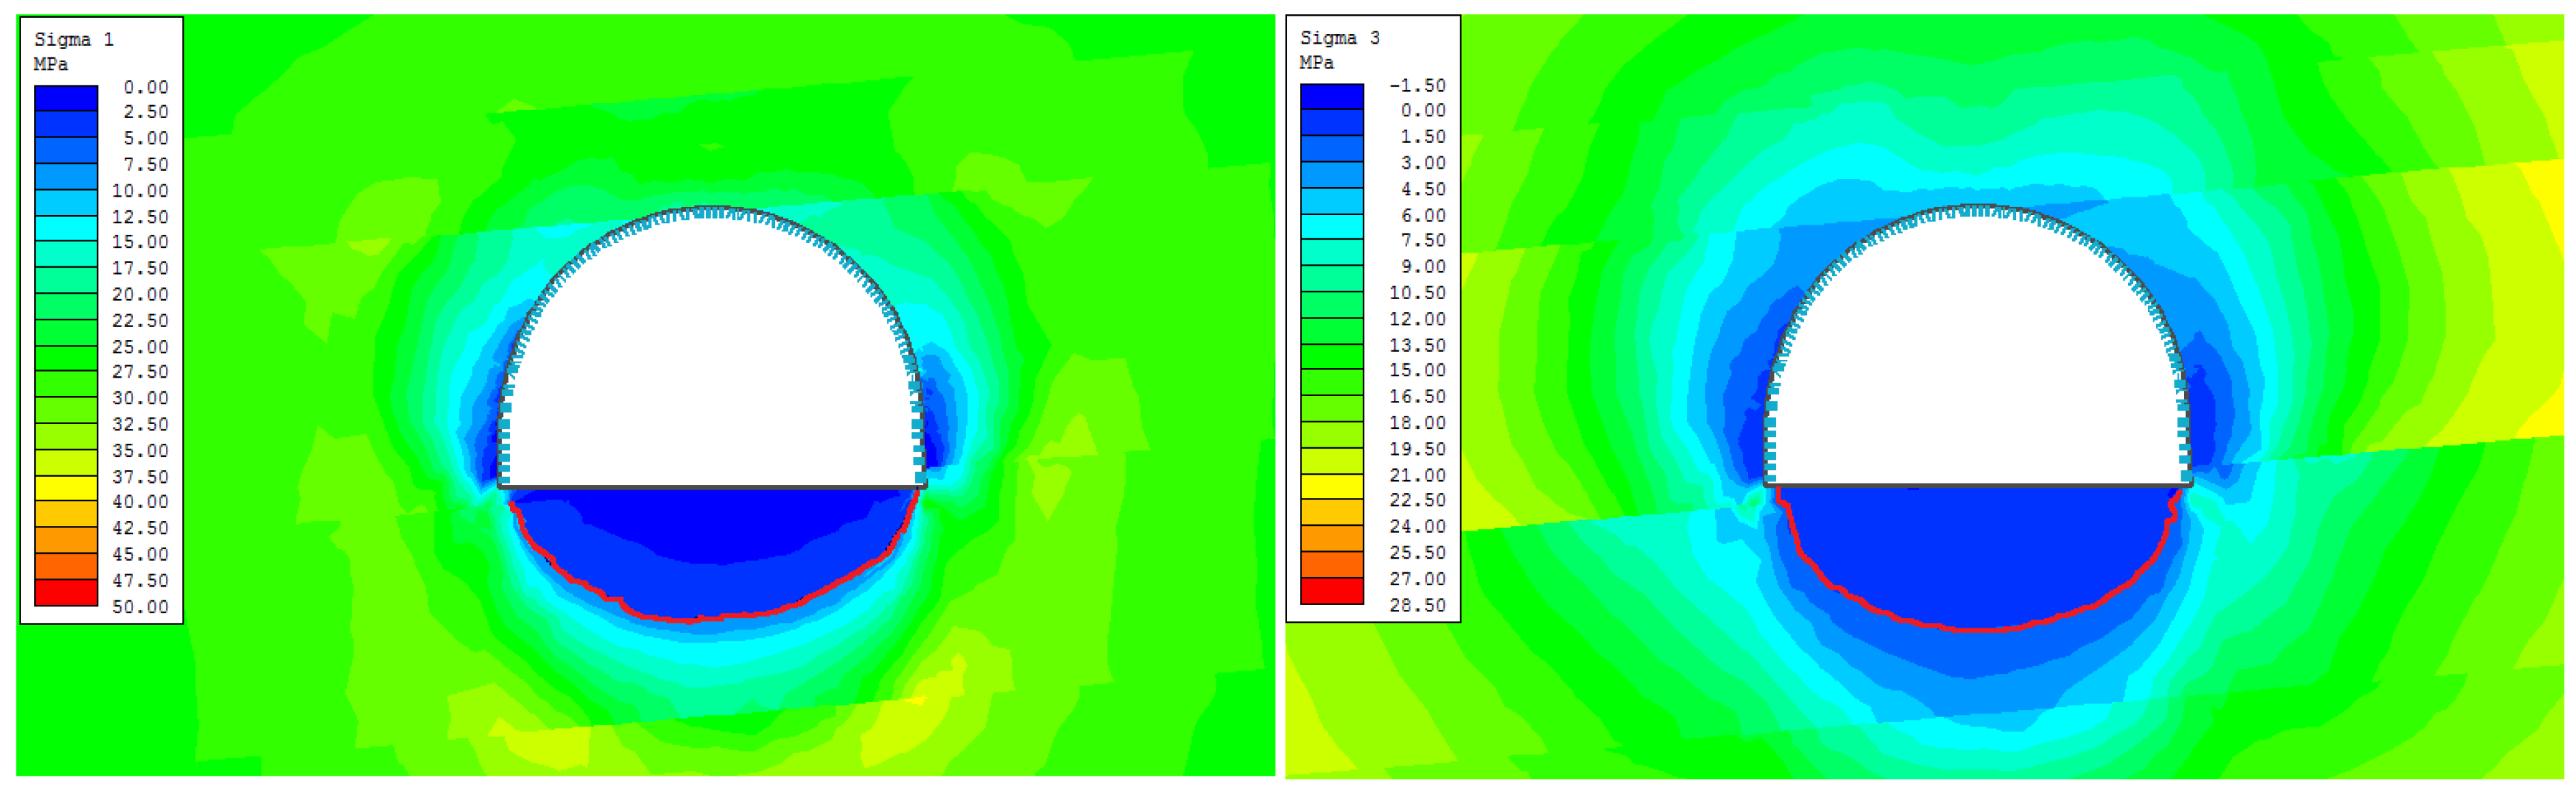
Figure 21.
Extent of the failure zone beneath the dry floor of roadway D-2—stage 1.
Figure 21.
Extent of the failure zone beneath the dry floor of roadway D-2—stage 1.
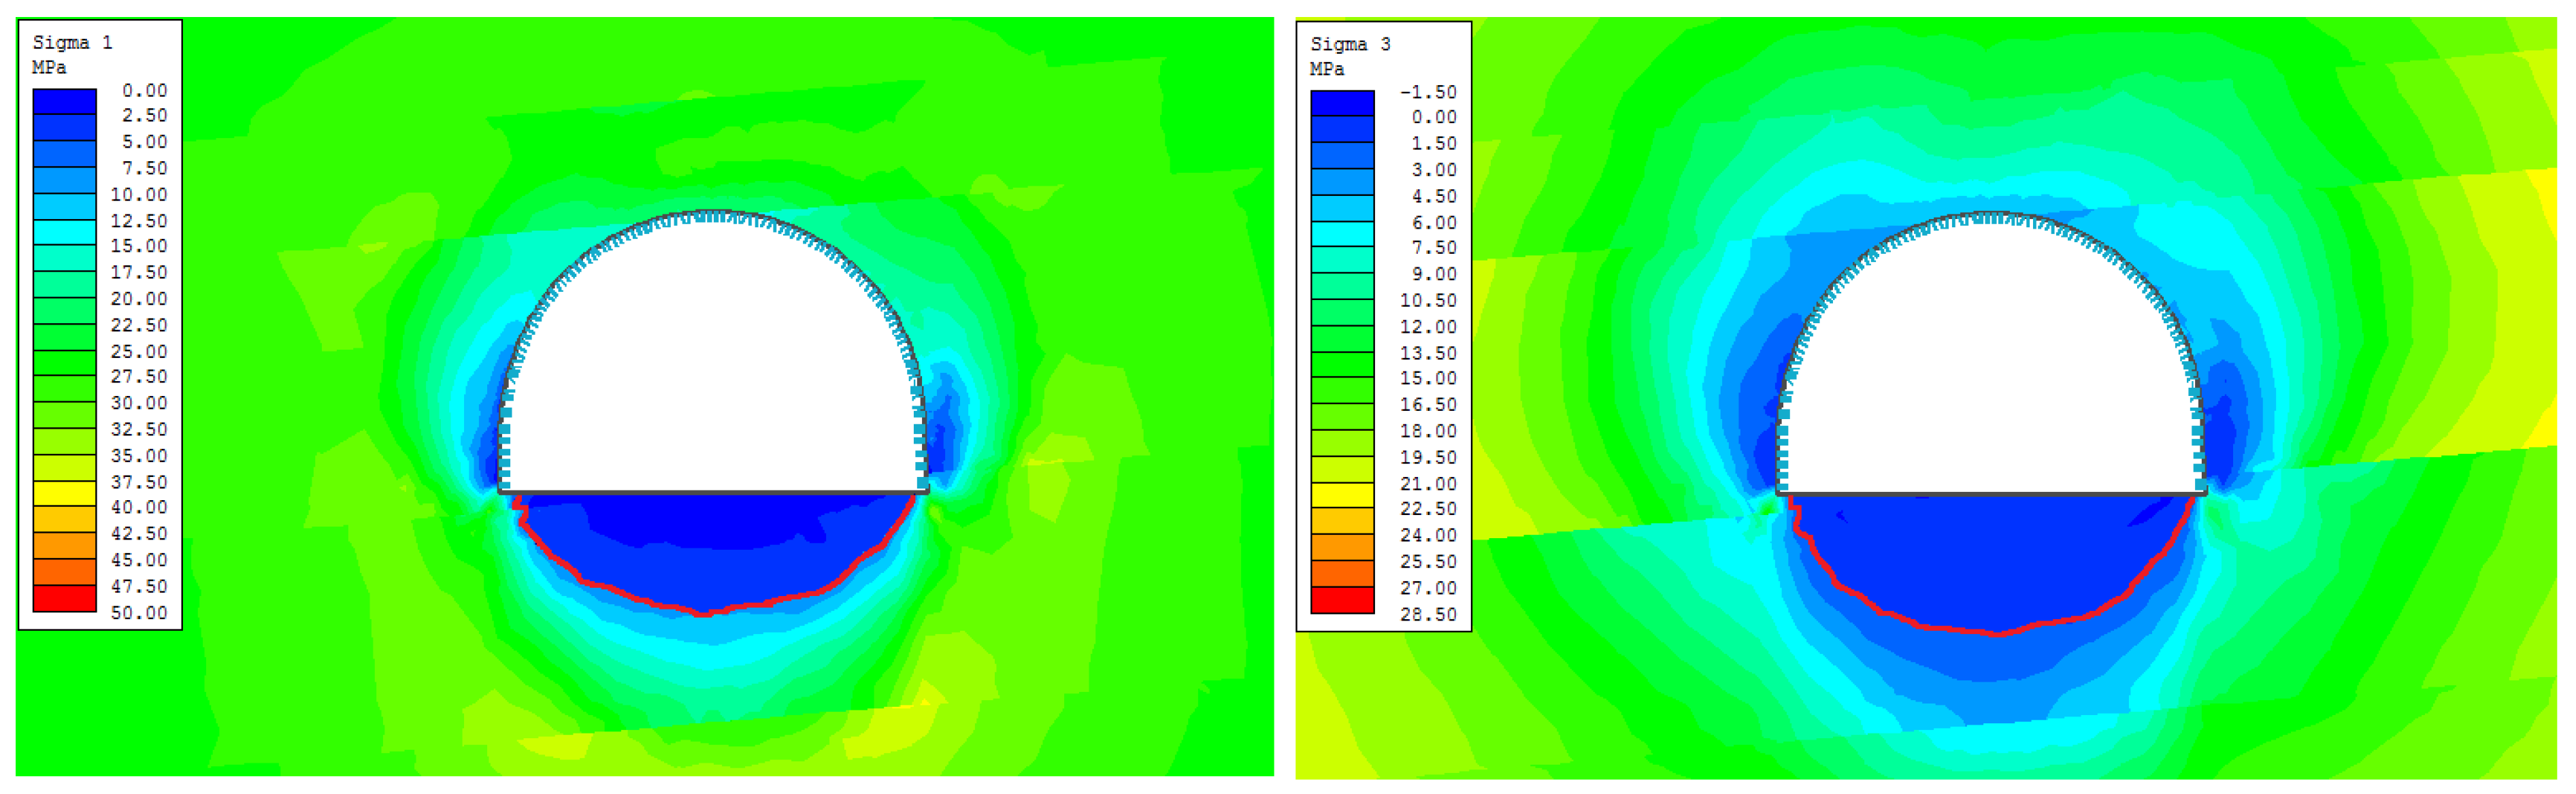
Figure 22.
Extent of the failure zone beneath the waterlogged floor of roadway D-2—stage 2.
Figure 22.
Extent of the failure zone beneath the waterlogged floor of roadway D-2—stage 2.
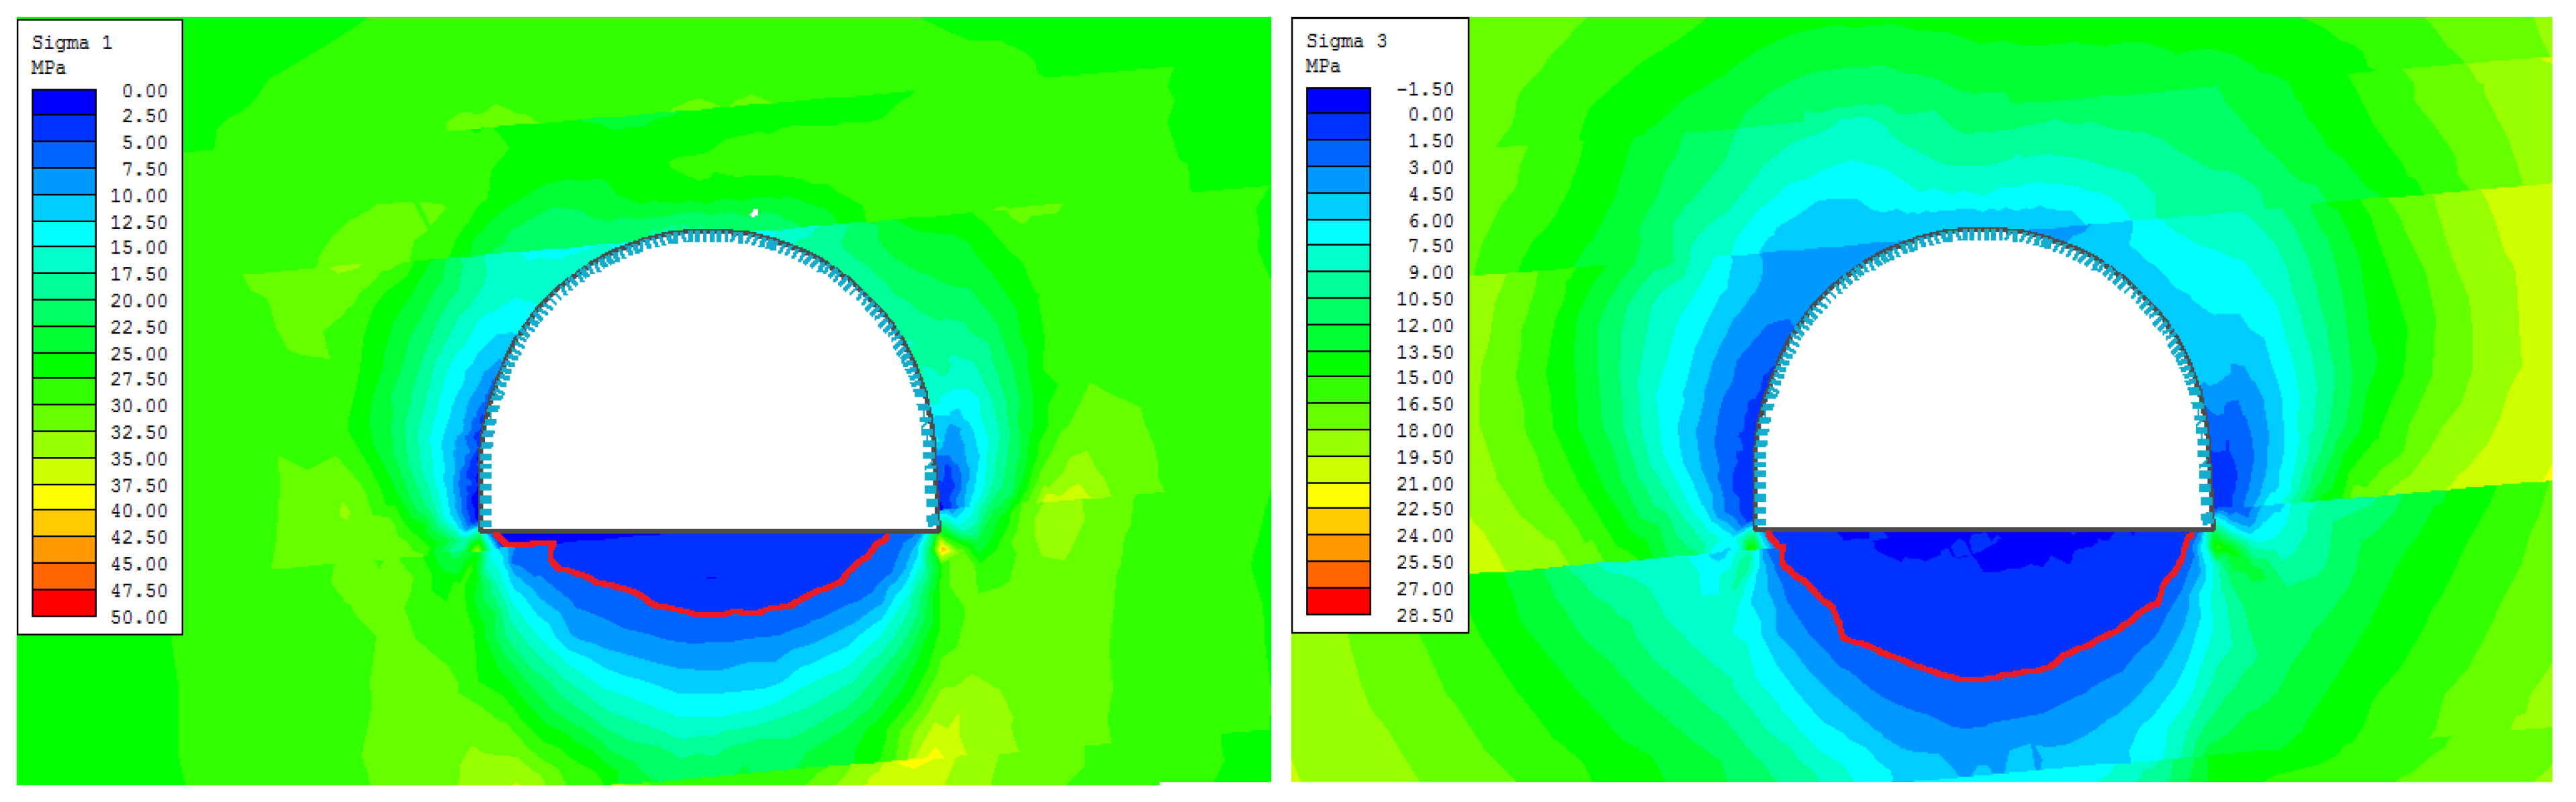
Figure 23.
Extent of the failure zone beneath the waterlogged floor of roadway D-2—stage 3.
Figure 23.
Extent of the failure zone beneath the waterlogged floor of roadway D-2—stage 3.
Figure 24.
Extent of the failure zone beneath the waterlogged floor of roadway D-2—stage 4.
Figure 24.
Extent of the failure zone beneath the waterlogged floor of roadway D-2—stage 4.
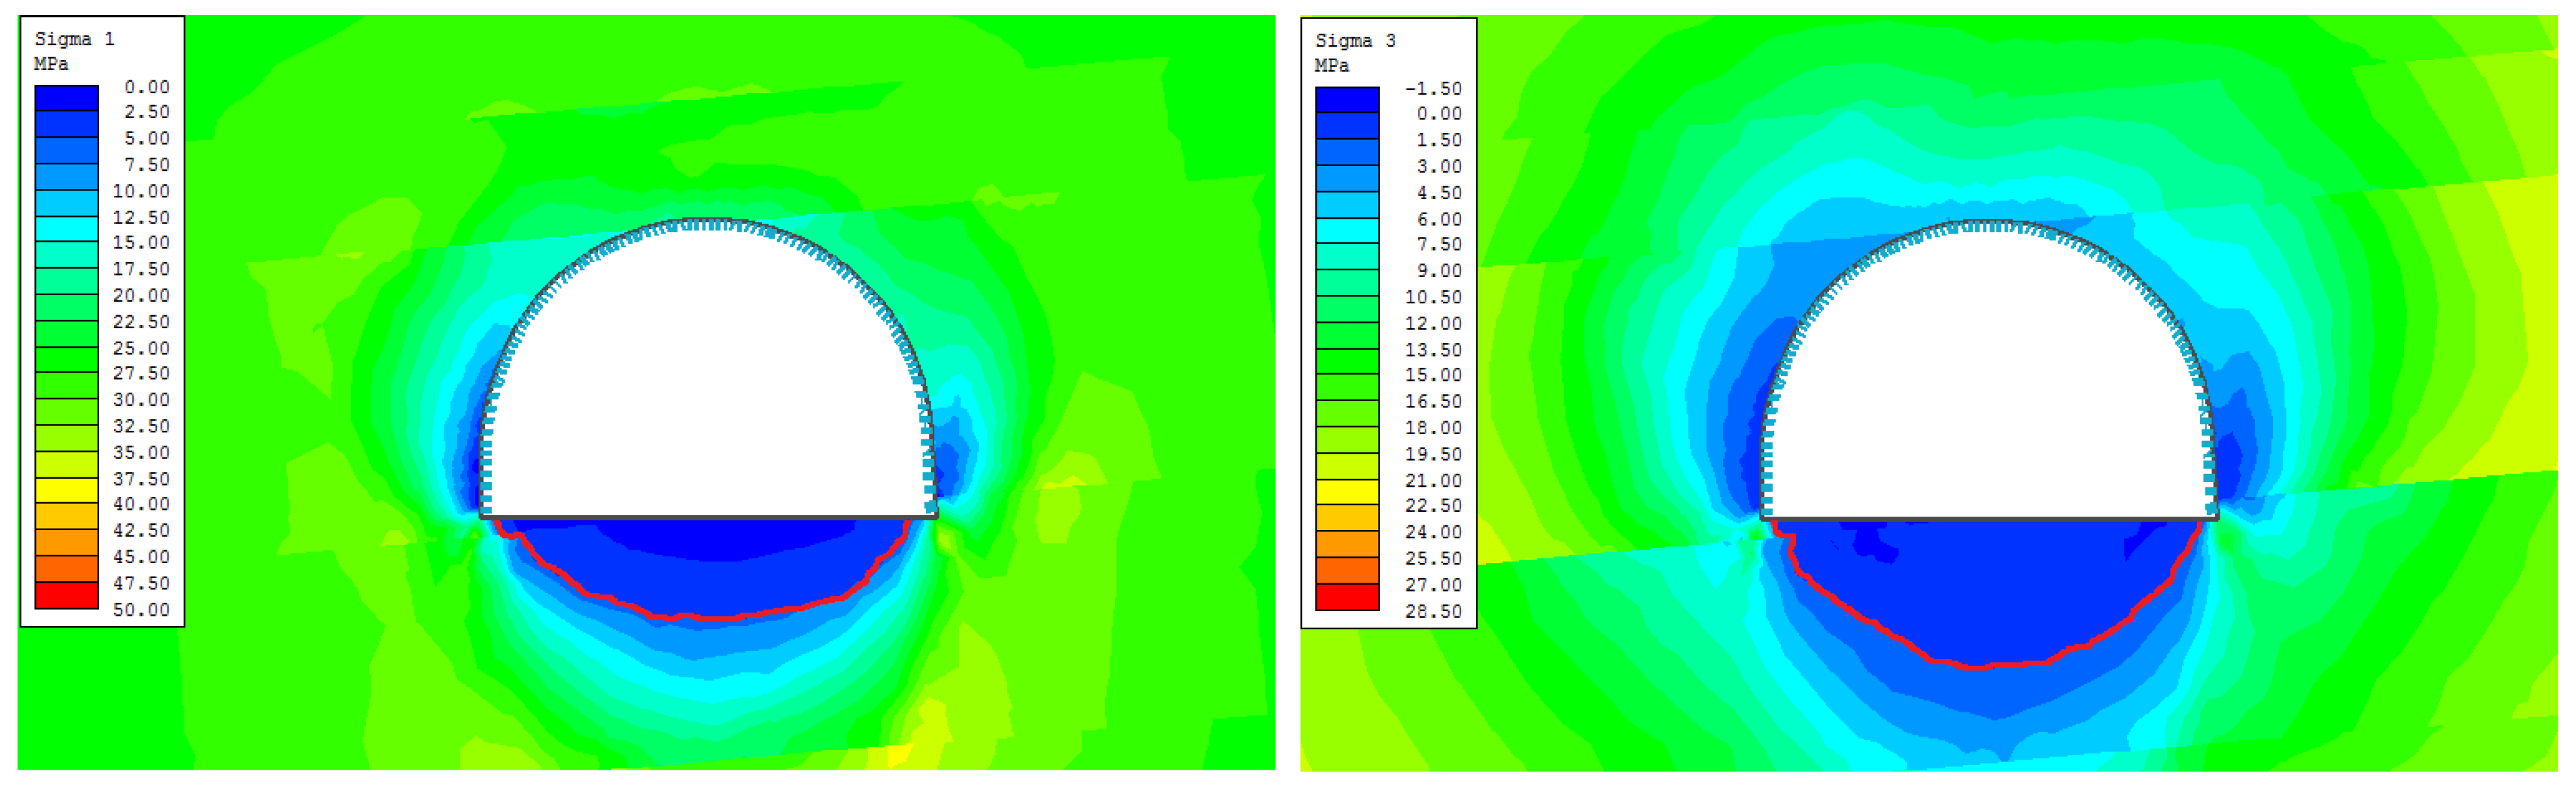
Figure 25.
Extent of the failure zone beneath the waterlogged floor of roadway D-2—stage 5.
Figure 25.
Extent of the failure zone beneath the waterlogged floor of roadway D-2—stage 5.
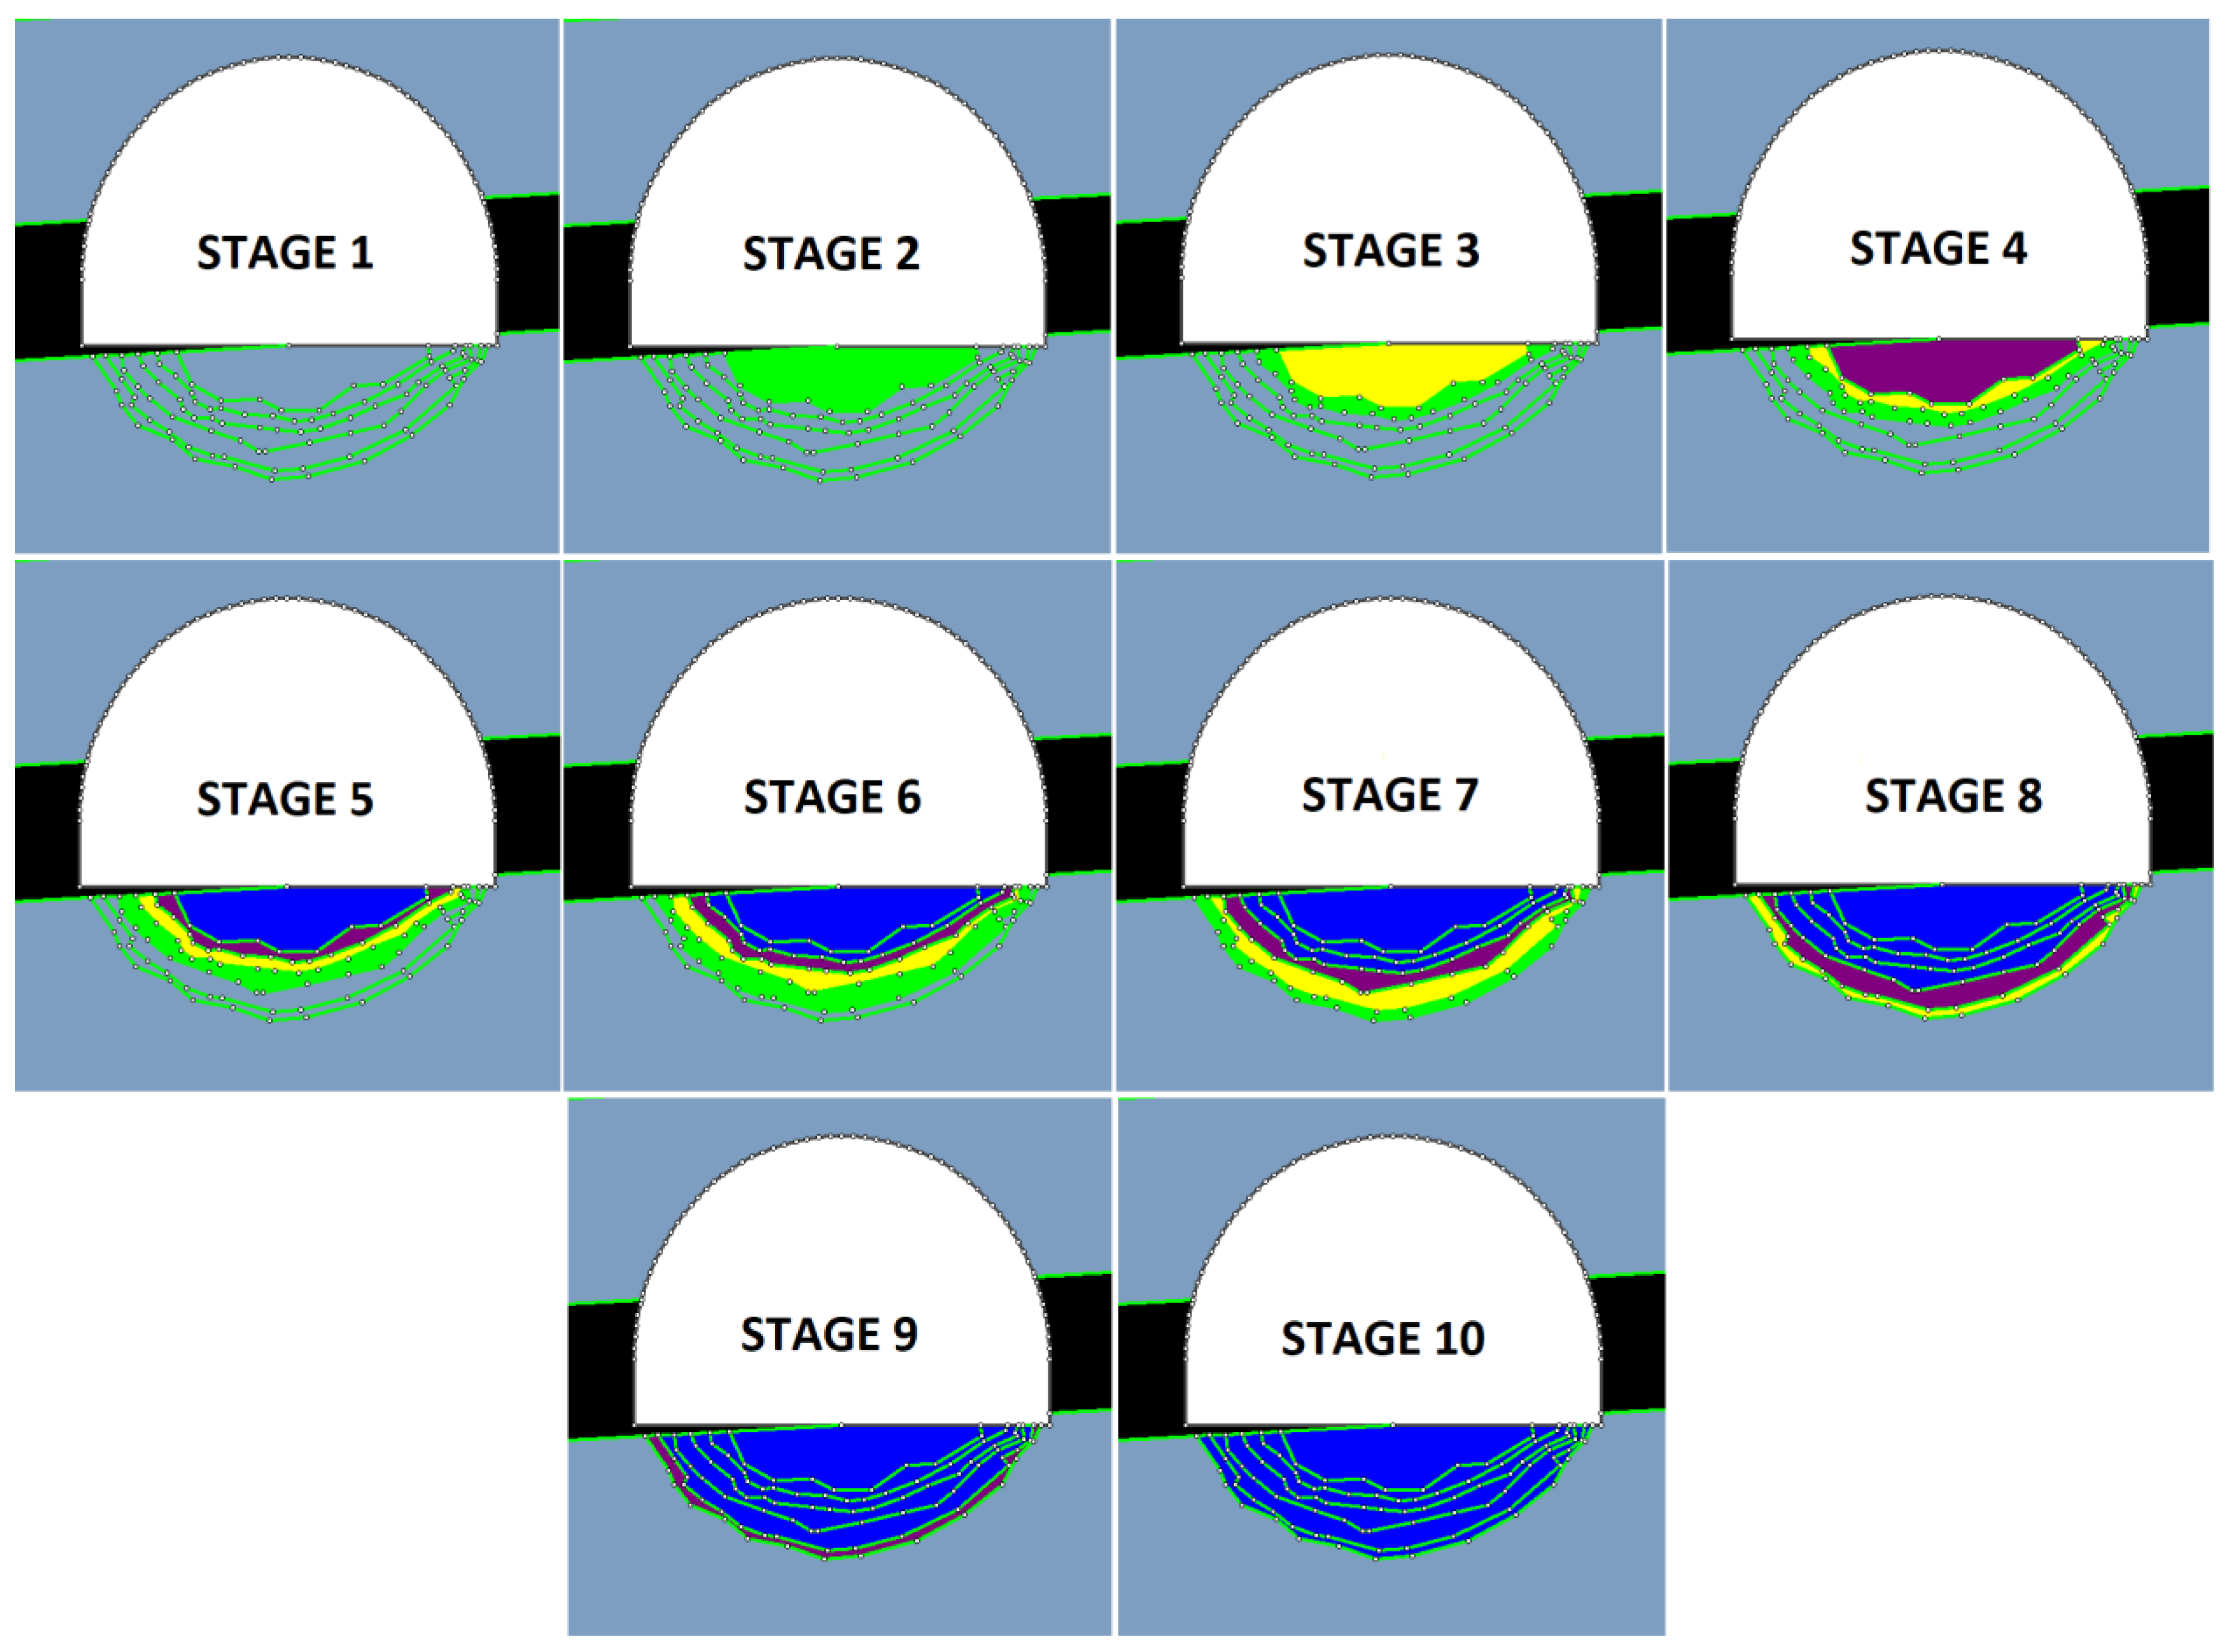
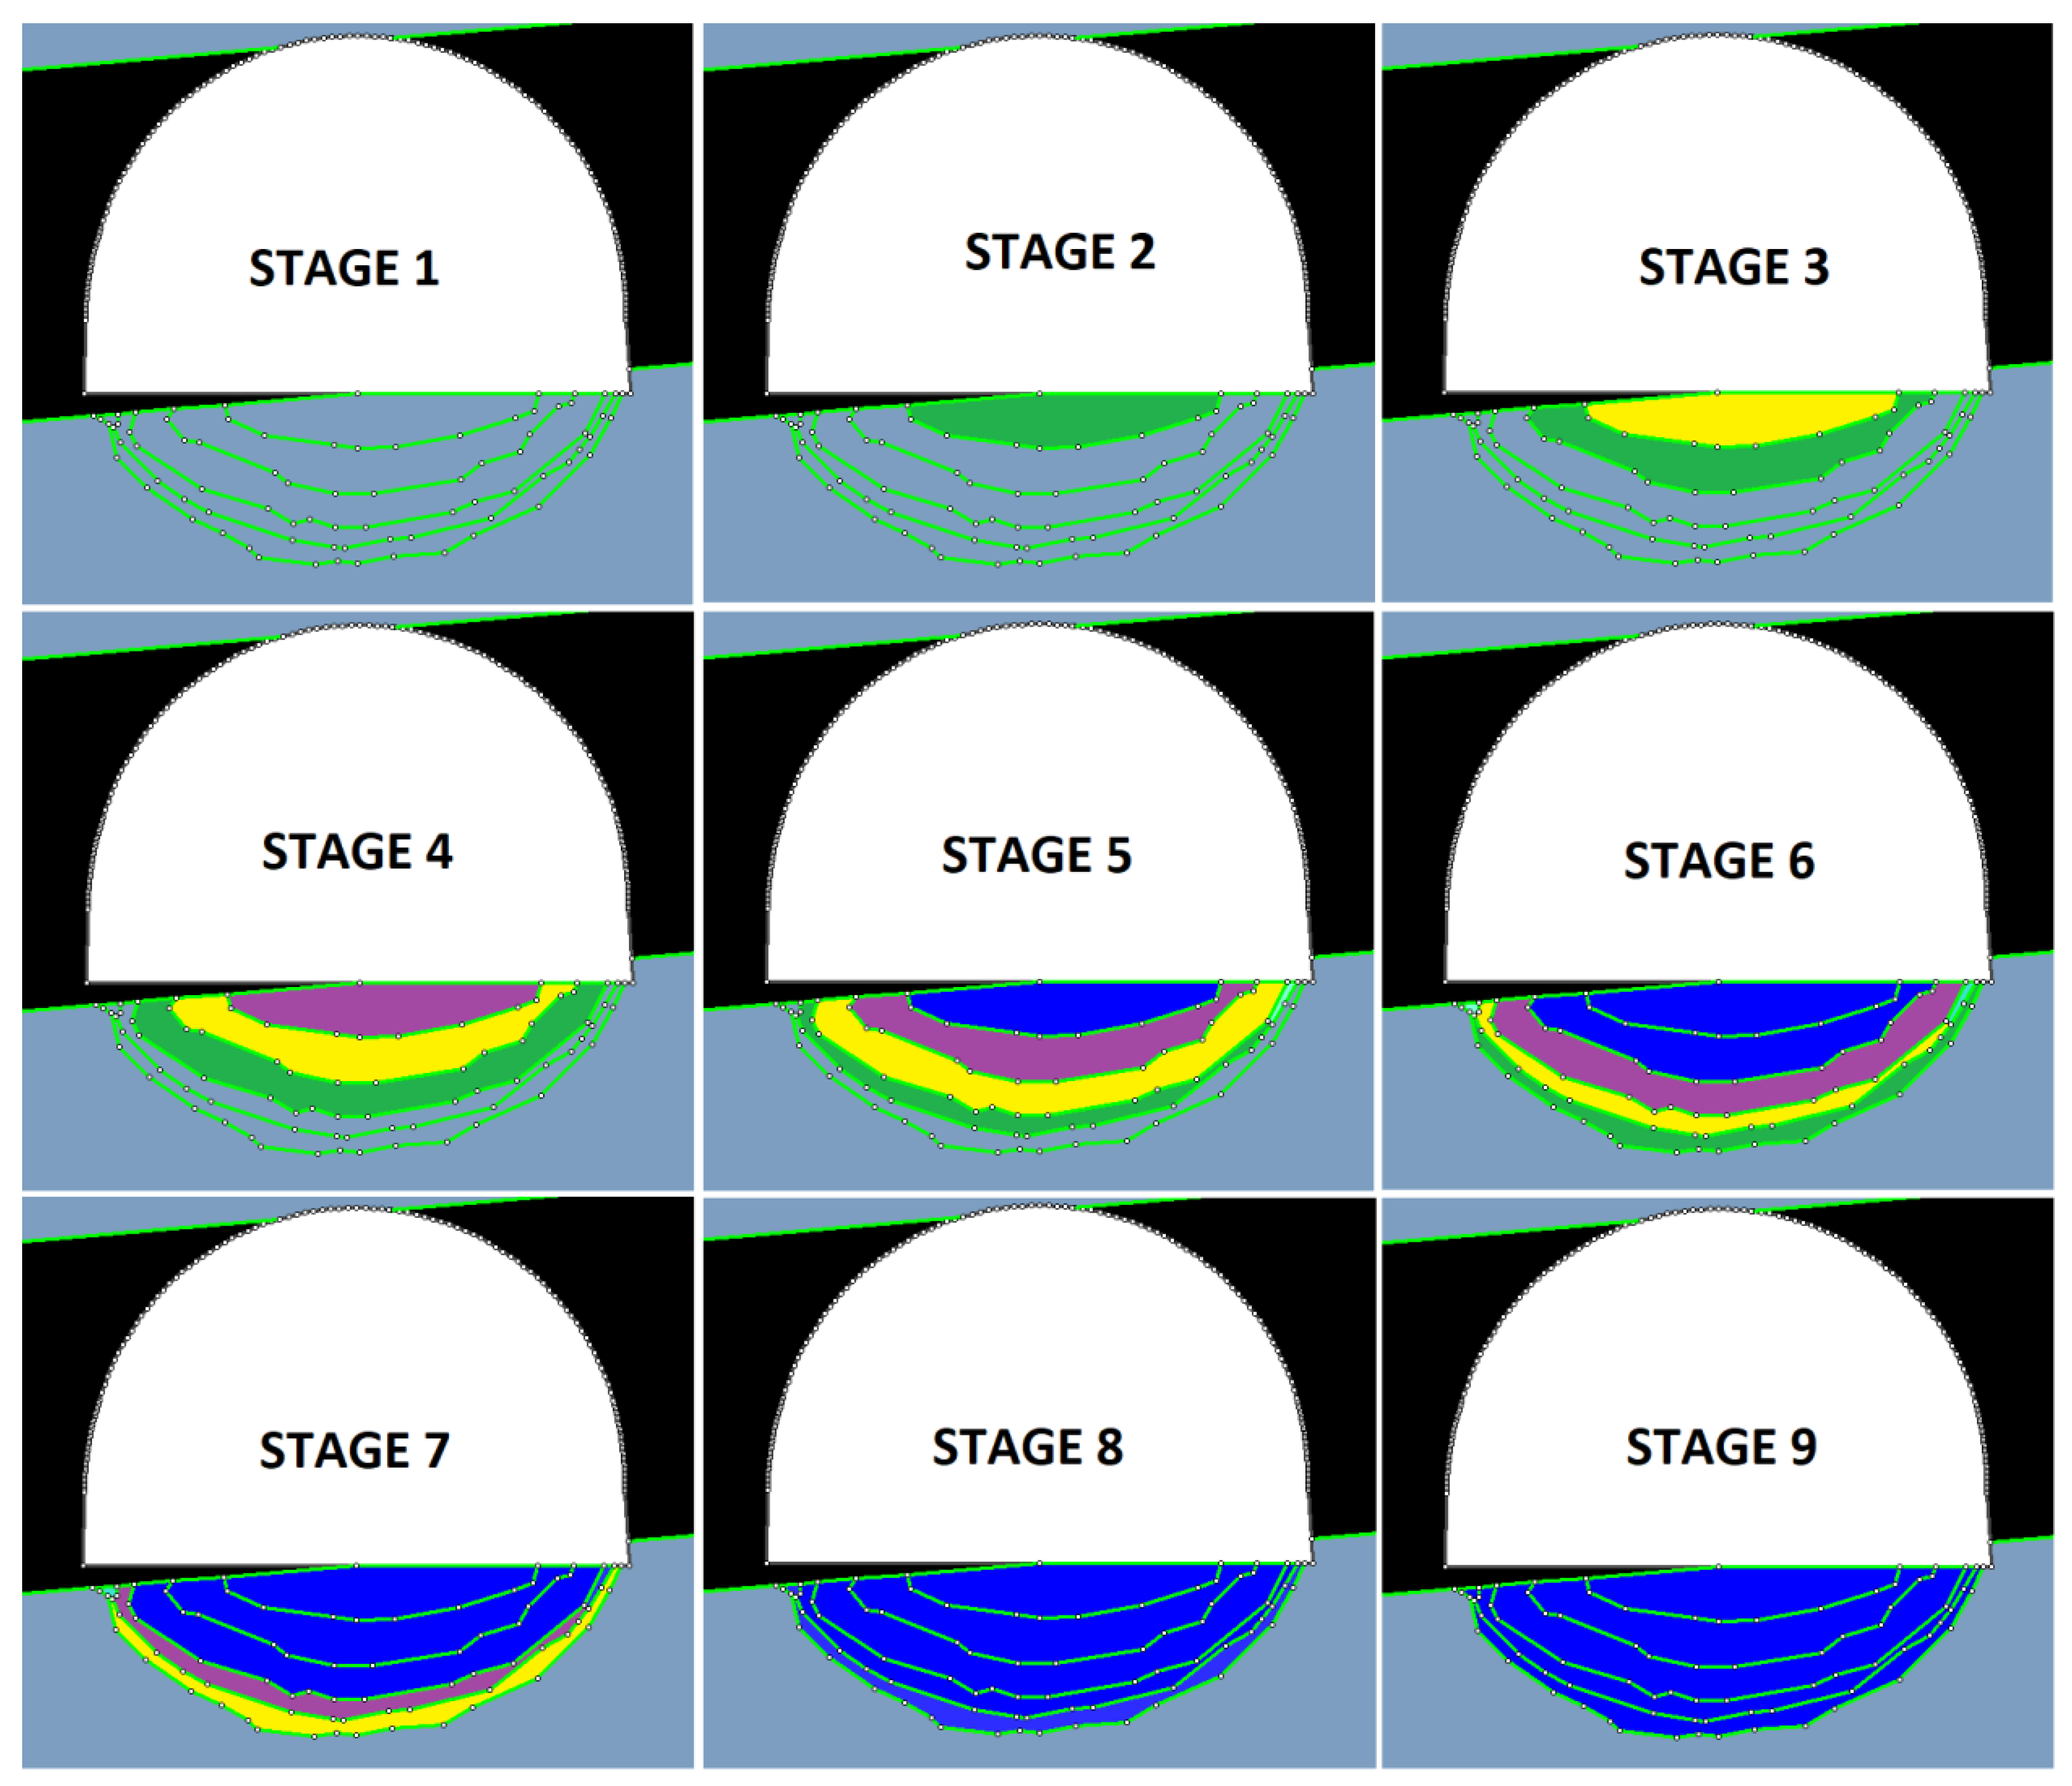
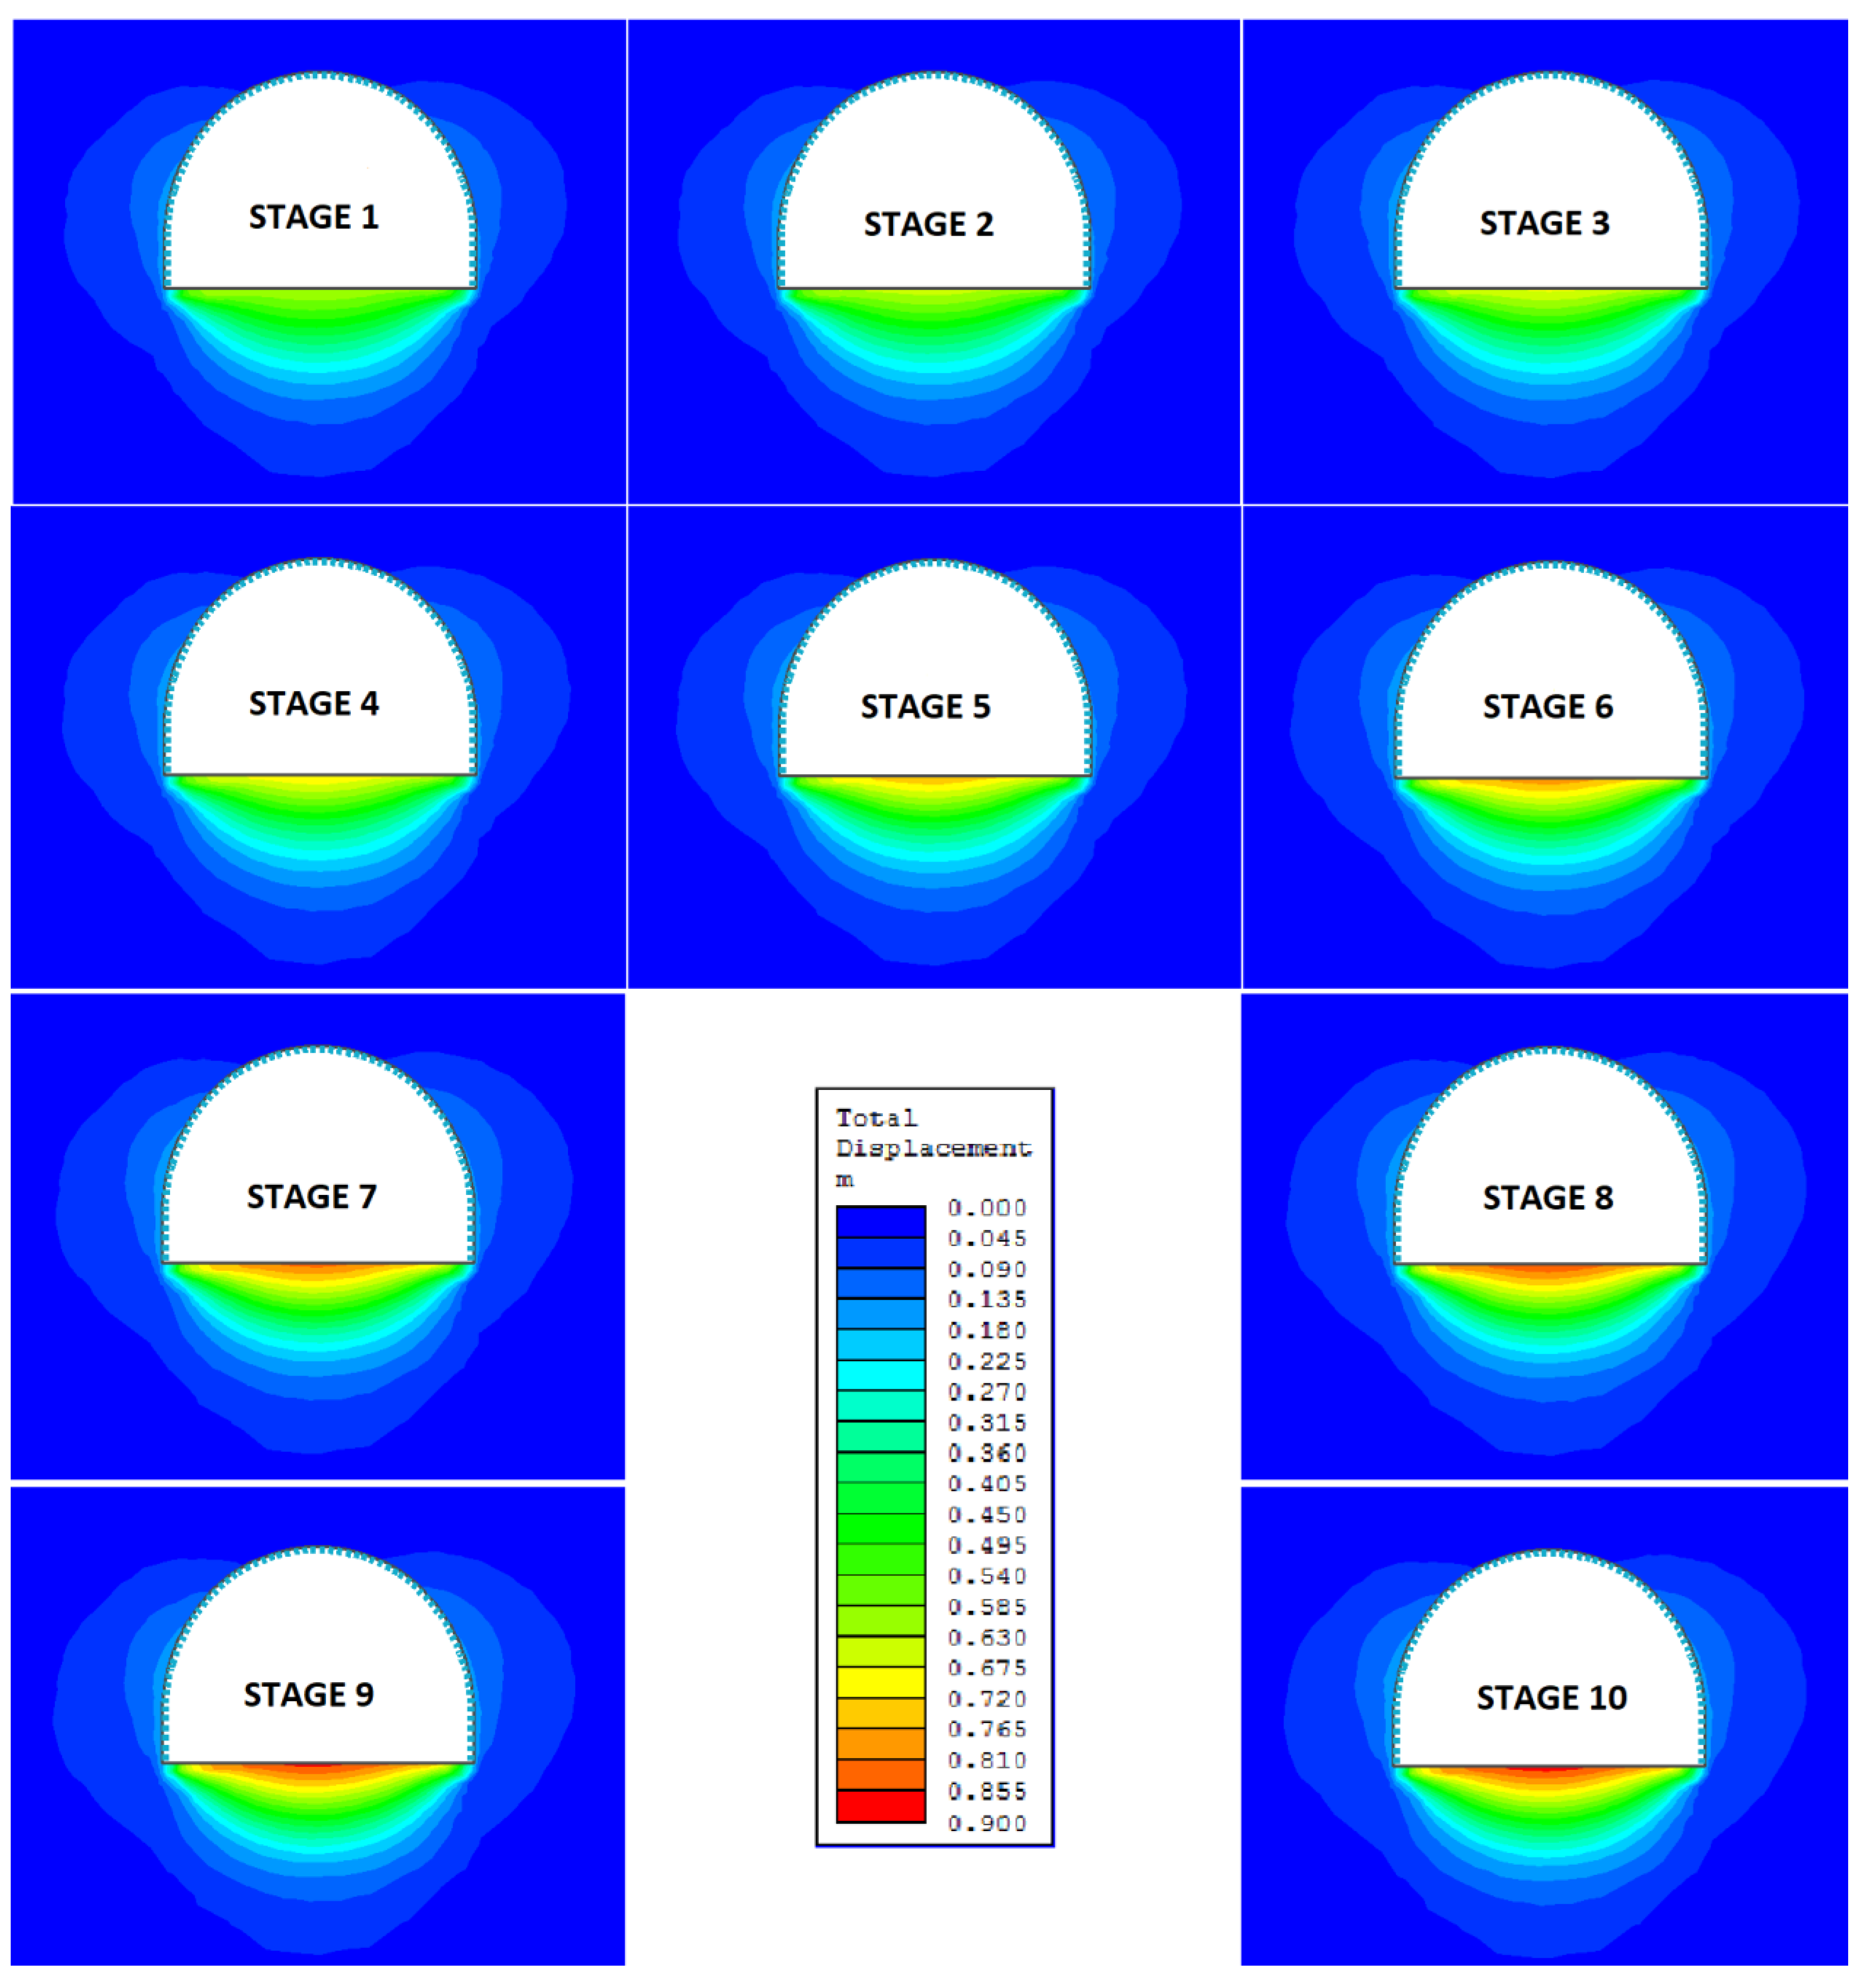
Figure 26.
Stages of the numerical simulation of the impact of water saturation of the rocks beneath the floor of roadway D-2 on the magnitude of the floor heave, and with various geomechanical properties: gray color—dry rocks, green—rocks after 3 h of soaking with water, yellow—rocks after 6 h of soaking, purple—rocks after 12 h of soaking, dark blue—rocks after 24 h of soaking.
Figure 27.
Convergence of the D-2 roadway versus the extent of the saturation zone in the floor rocks.
Figure 27.
Convergence of the D-2 roadway versus the extent of the saturation zone in the floor rocks.
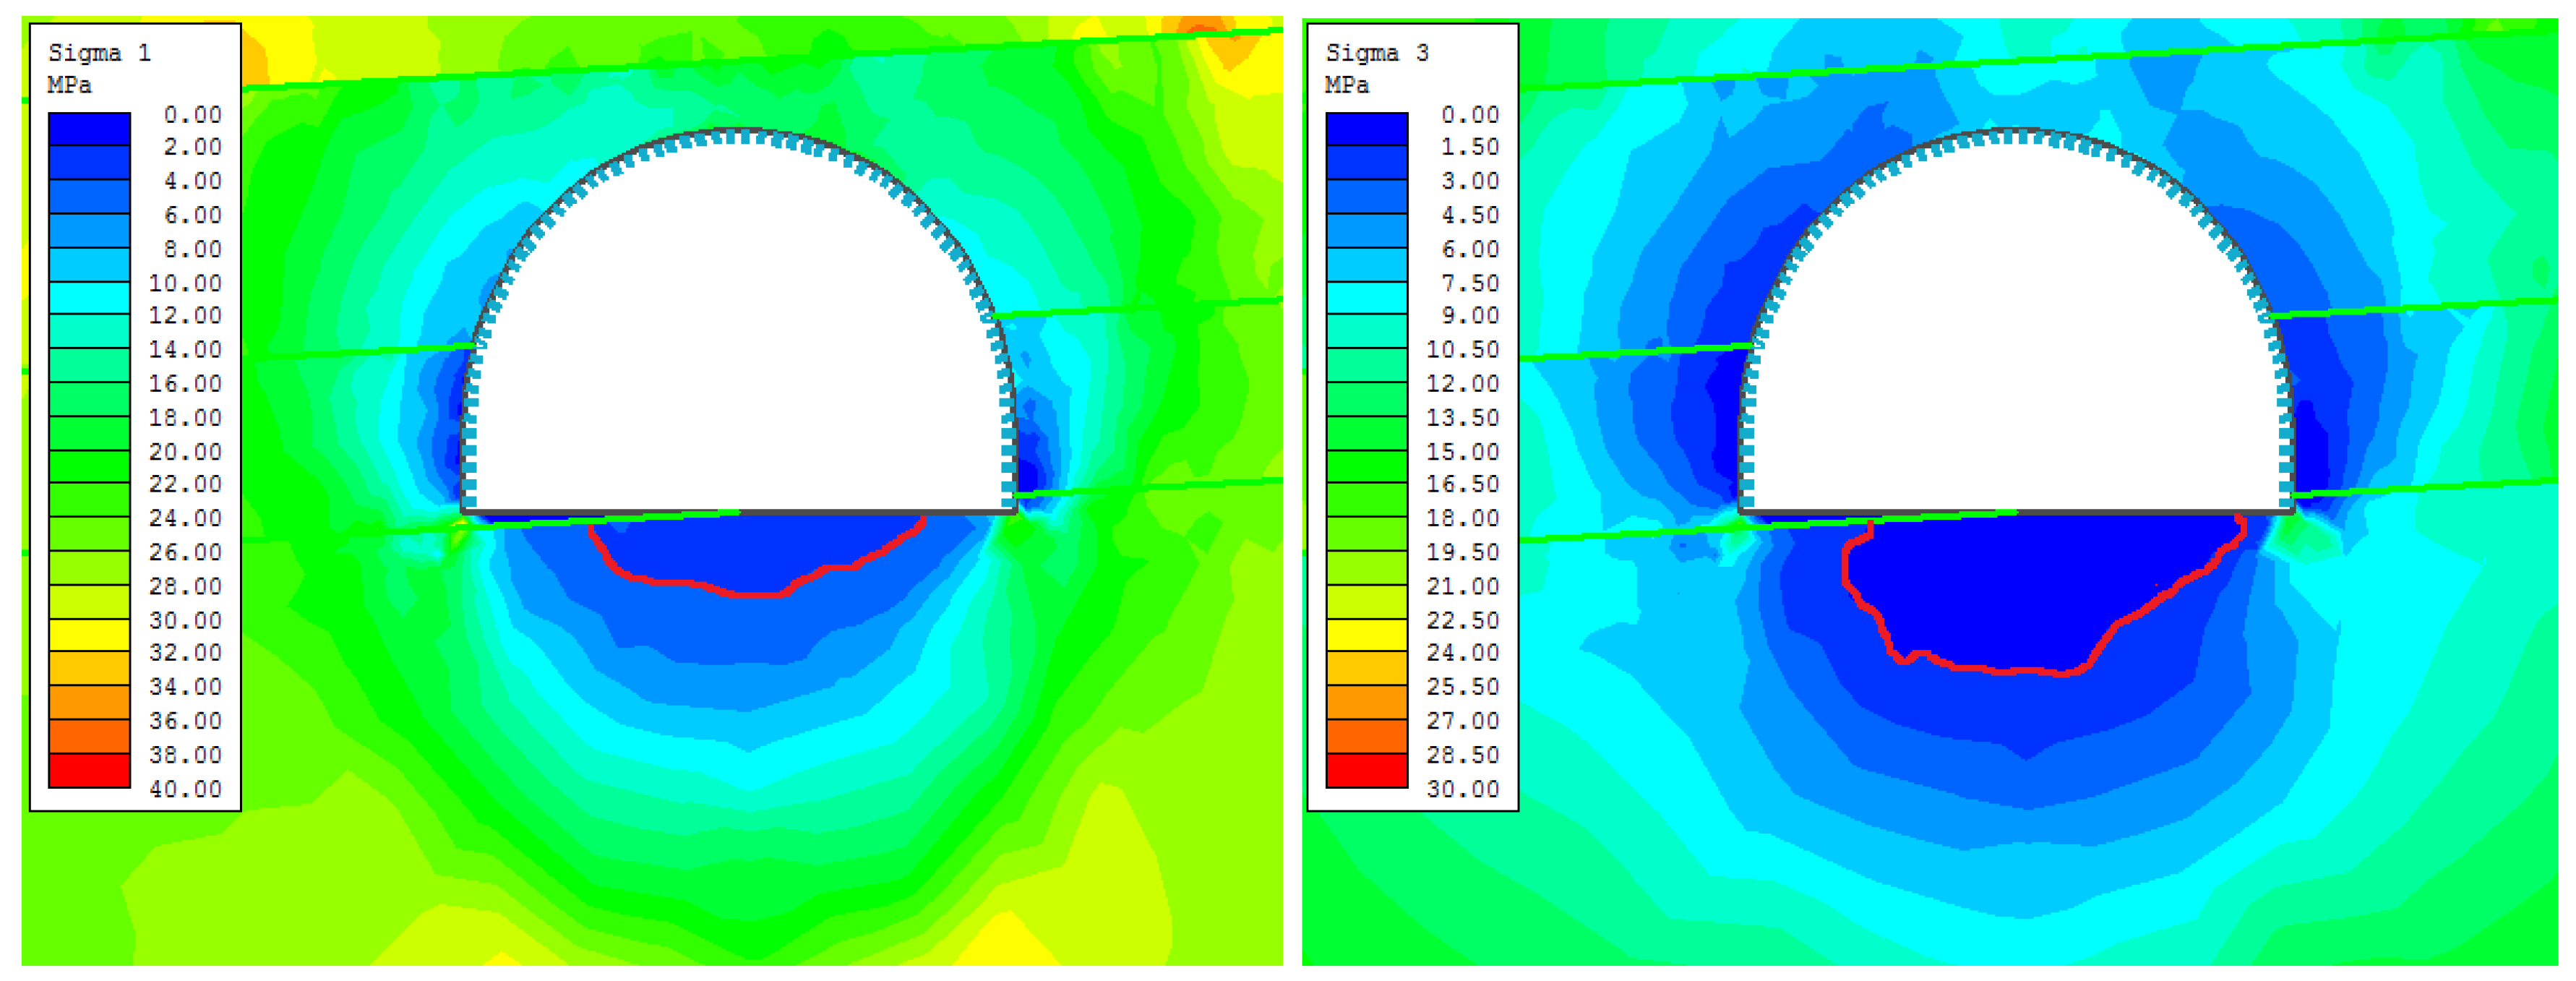
Figure 28.
The extent of the failure zone in the floor of roadway F-33—stage 1.
Figure 28.
The extent of the failure zone in the floor of roadway F-33—stage 1.
Figure 29.
The extent of the failure zone beneath the floor of roadway F-33—stage 5.
Figure 29.
The extent of the failure zone beneath the floor of roadway F-33—stage 5.
Figure 30.
Stages of the numerical simulation of the impact of saturation of the rocks beneath the floor of roadway F-33 on the magnitude of the floor heave, and with various geomechanical properties: gray color—dry rocks, green—rocks after 3 h of soaking with water, yellow—rocks after 6 h of soaking, purple—rocks after 12 h of soaking, dark blue—rocks after 24 h of soaking.
Figure 31.
Convergence of roadway F-33 versus the extent of saturation zone in the floor rocks.
Figure 31.
Convergence of roadway F-33 versus the extent of saturation zone in the floor rocks.
Table 1.
Geomechanical parameters of rocks around roadway D-2.
Table 1.
Geomechanical parameters of rocks around roadway D-2.
| Strata | Rock Bed | Bed Thickness | Bulk Weight | Compressive Strength | Young Modulus | Poisson Ratio |
|---|
| hi (m) | γi (kN/m3) | σci (MPa) | Ei (GPa) | νi (-) |
|---|
| Roof | Sandstone | 2.5 | 25.32 | 75.4 | 9.02 | 0.29 |
| Claystone | 2.0 | 24.19 | 42.5 | 4.89 | 0.32 |
| Mudstone | 2.0 | 25.27 | 46.9 | 7.12 | 0.30 |
| Sandstone | 3.8 | 24.87 | 64.1 | 8.21 | 0.28 |
| Mudstone | 2.7 | 25.01 | 41.2 | 6.98 | 0.32 |
| Claystone | 1.0 | 24.14 | 29.8 | 4.13 | 0.27 |
| Coal seam 411/3 | 0.8 | 13.02 | 10.2 | 1.57 | 0.30 |
| Claystone | 1.0 | 24.74 | 32.5 | 3.26 | 0.32 |
| Sandstone | 8.5 | 25.32 | 85.8 | 11.78 | 0.29 |
| Claystone | 1.4 | 24.47 | 45.4 | 4.48 | 0.23 |
| Sidewall | Coal seam 412 | 4.6 | 12.13 | 21.4 | 2.12 | 0.31 |
| Floor | Claystone | 3.5 | 25.17 | 56.1 | 5.16 | 0.21 |
| Mudstone | 4.8 | 26.33 | 61.3 | 8.19 | 0.31 |
| Claystone | 2.5 | 25.02 | 48.2 | 4.21 | 0.31 |
| Coal seam 413/2 | 2.6 | 12.50 | 8.1 | 2.02 | 0.30 |
| Claystone | 0.5 | 26.73 | 28.2 | 2.19 | 0.32 |
| Mudstone | 8.0 | 25.46 | 71.2 | 8.45 | 0.27 |
| Claystone | 0.4 | 24.78 | 25.6 | 2.09 | 0.35 |
| Coal seam 415 | 0.6 | 12.72 | 11.1 | 1.98 | 0.30 |
| Mudstone | 6.8 | 26.02 | 58.9 | 6.42 | 0.31 |
Table 2.
Parameters of rocks from around roadway D-2.
Table 2.
Parameters of rocks from around roadway D-2.
| Rock Type | σc (MPa) | σt (MPa) | RMR | Rock Mass Class | mi calc | mi model | mb | s |
|---|
| Claystone | 45.38 | 4.51 | 44 | III | 9.02 | 8 | 1.083 | 0.0020 |
| Mudstone | 43.89 | 4.22 | 49 | III | 9.25 | 8 | 1.218 | 0.0035 |
| Sandstone | 69.65 | 5.01 | 54 | III | 11.56 | 12 | 2.301 | 0.0060 |
| Coal | 21.42 | 0.98 | 36 | IV | 16.59 | 17 | 1.729 | 0.0008 |
Table 3.
Geomechanical parameters of rocks around roadway F-33.
Table 3.
Geomechanical parameters of rocks around roadway F-33.
| Strata | Rock Bed | Bed Thickness | Bulk Weight | Compressive Strength | Young Modulus | Poisson Ratio |
|---|
| hi (m) | γi (kN/m3) | σci (MPa) | Ei (GPa) | νi (-) |
|---|
| Roof | Claystone | 3.5 | 25.483 | 45.81 | 4.583 | 0.285 |
| Coal seam 401 | 2.5 | 12.413 | 17.13 | 1.135 | 0.300 |
| Clayey shale | 6.6 | 26.242 | 67.71 | 7.421 | 0.305 |
| Mudstone | 1.7 | 26.129 | 102.73 | 9.506 | 0.270 |
| Claystone | 4.3 | 25.248 | 62.63 | 5.687 | 0.295 |
| Mudstone | 8.4 | 26.008 | 74.39 | 8.423 | 0.270 |
| Claystone | 3.0 | 25.352 | 43.72 | 4.707 | 0.215 |
| Sidewall | Coal seam 403 | 2.0 | 12.066 | 15.89 | 1.018 | 0.310 |
| Floor | Claystone | 15.3 | 30.552 | 59.64 | 5.575 | 0.200 |
| Mudstone | 1.4 | 25.937 | 68.45 | 5.126 | 0.280 |
| Claystone | 11.3 | 25.809 | 54.48 | 4.875 | 0.255 |
Table 4.
Parameters of rocks around roadway F-33.
Table 4.
Parameters of rocks around roadway F-33.
| Rock Type | σc (MPa) | σt (MPa) | RMR | Rock Mass Class | mi calc | mi model | mb | s |
|---|
| Claystone | 43.72 | 4.72 | 42 | III | 8.47 | 8 | 1.083 | 0.0020 |
| Mudstone | 73.49 | 6.84 | 43 | III | 9.49 | 9 | 1.218 | 0.0035 |
| Coal | 20.89 | 1.02 | 36 | IV | 15.73 | 16 | 1.729 | 0.0008 |
Table 5.
Geomechanical parameters of claystone from beneath the D-2 roadway floor, depending on time of exposure to water.
Table 5.
Geomechanical parameters of claystone from beneath the D-2 roadway floor, depending on time of exposure to water.
| Time of Exposure to Water | γ (kN) | ν (-) | E (GPa) | σc (MPa) | mb | s |
|---|
| 0 h | 25.172 | 0.207 | 5.162 | 56.13 | 0.758 | 0.0007 |
| 3 h | 25.295 | 0.252 | 4.844 | 50.57 |
| 6 h | 25.355 | 0.287 | 3.997 | 46.50 |
| 12 h | 25.441 | 0.309 | 3.484 | 42.65 |
| 24 h | 25.466 | 0.343 | 3.179 | 38.52 |
Table 6.
Comparison of the convergence results from numerical model of roadway D-2 with the in situ measurements of the 614th meter of the roadway.
Table 6.
Comparison of the convergence results from numerical model of roadway D-2 with the in situ measurements of the 614th meter of the roadway.
| Research | Stage | ΔS (cm) | umax (cm) | uav (cm) | ΔH (cm) |
|---|
| numerical | I | 72 | 102 | 65 | 84 |
| II | 72 | 102 | 68 | 84 |
| III | 72 | 108 | 71 | 90 |
| IV | 72 | 108 | 73 | 96 |
| V | 72 | 114 | 78 | 102 |
| VI | 78 | 120 | 81 | 108 |
| VII | 78 | 120 | 83 | 108 |
| VIII | 78 | 120 | 88 | 108 |
| IX | 78 | 120 | 92 | 114 |
| in situ | | 79 | 107 | 98 | 116.5 |
| difference (%) | | 1.3 | 10.8 | 6.5 | 2.2 |
Table 7.
Geomechanical parameters of claystone from the floor of the roadway F-33 versus time of soaking with water.
Table 7.
Geomechanical parameters of claystone from the floor of the roadway F-33 versus time of soaking with water.
| Time of Exposure to Water | γ (kN) | ν (-) | E (GPa) | σc (MPa) | mb | s |
|---|
| 0 h | 30.552 | 59.64 | 5.575 | 0.200 | 0.681 | 0.0005 |
| 3 h | 30.718 | 45.66 | 4.557 | 0.231 |
| 6 h | 30.849 | 40.96 | 4.144 | 0.273 |
| 12 h | 30.983 | 37.85 | 3.332 | 0.299 |
| 24 h | 31.126 | 33.73 | 3.095 | 0.316 |
Table 8.
Comparison of the convergence results from numerical model of roadway F-33 with the in situ measurements on the 415th meter of the roadway.
Table 8.
Comparison of the convergence results from numerical model of roadway F-33 with the in situ measurements on the 415th meter of the roadway.
| Research | Stage | ΔS (cm) | umax (cm) | uAv (cm) | ΔH (cm) |
|---|
| numerical | 1 | 31.5 | 63.0 | 50.8 | 67.5 |
| 2 | 31.5 | 67.5 | 52.1 | 72.0 |
| 3 | 31.5 | 67.5 | 53.4 | 72.0 |
| 4 | 31.5 | 72.0 | 55.9 | 76.5 |
| 5 | 31.5 | 76.5 | 57.2 | 81.0 |
| 6 | 31.5 | 81.0 | 60.4 | 85.5 |
| 7 | 31.5 | 85.5 | 63.6 | 90.0 |
| 8 | 36.0 | 85.5 | 64.3 | 90.0 |
| 9 | 36.0 | 85.5 | 65.5 | 90.0 |
| | 10 | 36.0 | 90.0 | 65.8 | 90.0 |
| in situ | | 38.0 | 86.0 | 63.0 | 90.0 |
| difference (%) | | 5.2 | 4.4 | 4.4 | 0 |


