1. Introduction
Energy is the most fundamental driving force for the development of the transportation industry and is also essential to human survival. While energy has brought growth and progress to society, we have also encountered many challenges that threaten human existence, such as an energy crisis, environmental pollution, and other problems [
1,
2,
3,
4,
5,
6]. In today’s world, energy issues have become a common concern for humanity. With the rapid development of China’s transportation system in recent years, the proportion of energy consumption in the total energy consumption of society as a whole is 9.1%. The ensuing problems of energy shortage [
7,
8] and conventional overcapacity [
9,
10] have emerged, and the study of integrated energy systems in the transportation industry is significant in this context.
Studies of traditional energy systems often consider only single energy sources such as electricity, heat, and wind, making it difficult to see the complementary and synergistic capabilities between the various subsystems. Thus, integrated energy systems have become a hot spot for research on energy issues worldwide. With the planning and operation of integrated transportation systems as the core, many studies have been conducted at home and abroad. Wang et al. [
11] established a multi-region integrated power supply system model based on considering the balance of each path flow. They found through analysis that the integrated energy system has apparent advantages in planning and operation. Li et al. [
12] proposed a two-layer optimization model for planning and managing integrated energy systems considering the instability of renewable energy supply and analyzed its supply uncertainty based on robustness. Wang et al. [
13] proposed a partitioning method for integrated energy systems based on the presence and absence of a ring structure. The results showed that the presence or absence of a ring structure has a significant impact on integrated energy systems. Quan et al. [
14] proposed a regional integrated energy system model based on the rational configuration of the power supply network and gas pipeline and simulated and analyzed it for various scenarios. Lei et al. [
15] established an integrated energy system that can be converted to energy based on the consideration of electricity load and proposed a two-stage planning solution method for the complexity of the model.
Based on relevant studies, Lin [
16] first introduced the Petri network model into the grid system. Olsen et al. (2013) propose a multi-objective planning optimization model based on an integrated energy system, taking into account the instability of renewable energy supply and electricity demand because of the need to reduce carbon emissions [
17]. Klyapovskiy et al. (2019) used a two-stage robust optimization model based on the simulation method of a two-layer bus structure to describe the differences between the grid and the renewable energy network. They established a regional integrated energy system model by fully considering the collaborative relationship between the systems; based on this, a new planning method was proposed [
18]. Li et al. (2019) introduced a distributed execution algorithm based on the study of multi-energy systems. They developed a real-time energy management model considering the characteristics of different energy systems [
19]. Xue et al. (2020) evaluated the unique characteristics of the entire energy system, based on which a coupled static and dynamic two-layer model of the energy system was established. A corresponding optimization model was proposed according to the energy consumption rate, which was found to better reflect the particular characteristics of the energy system and help subsequent related research [
20]. Li et al. (2021) studied the problem of distributed cooperative management of multiple energy systems while considering the optimal energy distribution between any pair of subsystems in the energy system. Finally, the effectiveness of the proposed algorithm was verified [
21].
The above results provide a reasonable basis for the research in this paper, but several aspects of the existing research remain. (1) Most of the studies are on the grid combined with another single energy source and cannot fully demonstrate the relevant characteristics of an integrated energy system. (2) Conventional analysis methods cannot represent the module’s operation timing related to each energy system subsystem. (3) The traditional Petri net model has robust process control and graphical representation [
22,
23,
24]. However, it can only be run by Token transfer [
25] simulation and cannot perform dynamic computation with a Petri net library with time dynamics. Therefore, the existing methods cannot reflect the unique spatial cascade and time evolution characteristics of integrated energy systems and cannot be used to model the vulnerability cascade propagation phenomenon of integrated energy systems in the transportation industry.
Based on the above deficiencies, this paper proposes a cascade propagation model of the vulnerability of integrated energy systems in the transportation industry based on the Petri net model, whose contributions are as follows. On the one hand, the Petri net model is established according to the configuration of the integrated energy system in the transportation industry. The triggering rules of Petri net are defined to construct the vulnerability cascade propagation model of the integrated energy system in the transportation industry, which provides a new logical idea and theoretical support for the study of cascade propagation problem. On the other hand, through the study of vulnerability cascade propagation of different subsystems in the integrated energy system, the vulnerability of each subsystem line and the node can be sorted out, which can provide ideas for the scientific planning and construction of the integrated energy system in the future. In addition, the method of constructing the integrated energy system model of the transportation industry using the function Petri net has particular research significance. The available literature lacks studies on the vulnerability of integrated energy systems in the transportation industry. This paper constructs a Petri net-based vulnerability cascade propagation model for an integrated energy system in the transportation industry, constructs vulnerability cascade propagation rules, and simulates the integrated energy system using the Petri net function. It has some innovative and research significance for promoting the practical application of Petri net simulation modelling technology in integrated energy system research and future planning and construction of integrated energy systems.
2. Coupling of Transportation and Energy Systems
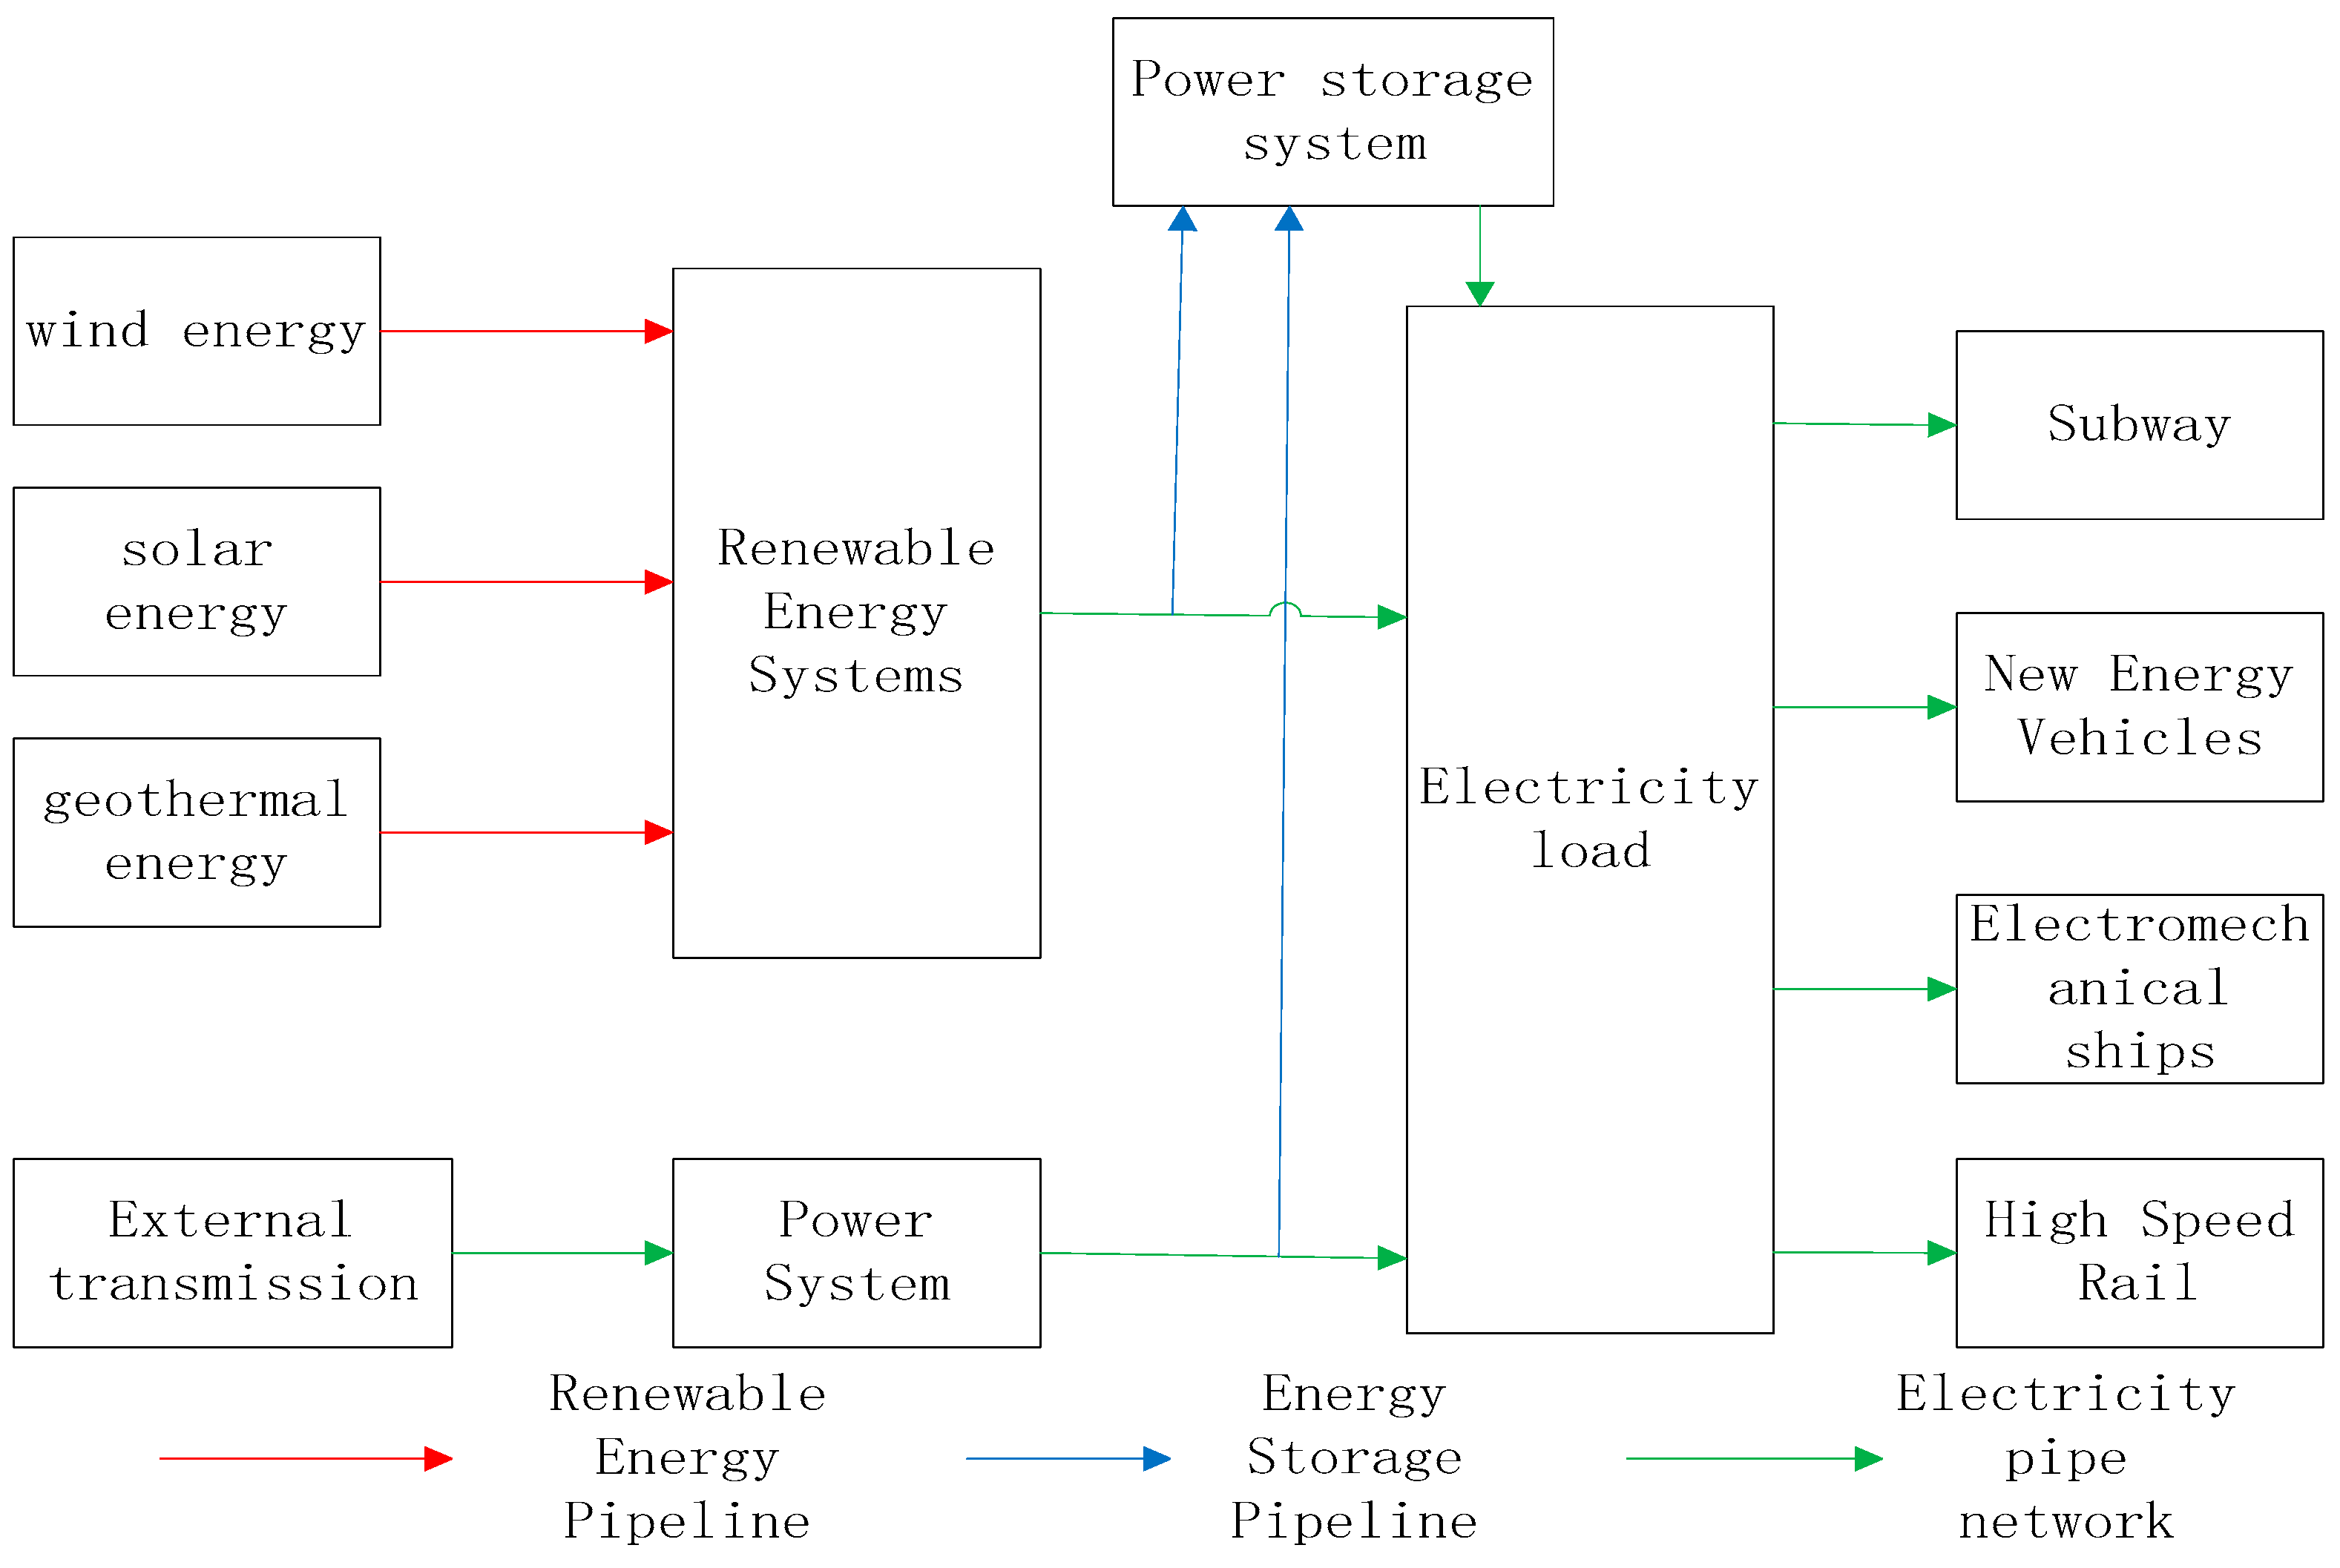
With the development of integrated energy systems, a close coupling between the relatively isolated power supply system and renewable energy system has been created, gradually becoming a unified energy system for the transportation industry. It consists of a renewable energy system, external transmission system, energy storage system, electric load, and other subsystems, with integrity, complexity, and scientific characteristics. The energy system of the transportation industry is shown in
Figure 1, which is conducive to meeting the growing demand for electric energy in the transportation industry by achieving the optimization of electric power through cooperation among different systems.
The transportation industry energy system combines renewable energy sources such as wind, solar, and tidal energy for power generation on the one hand and power supply through external transmission systems on the other. In addition, the storage system can control the electric power system and renewable energy system through converters and transformers and supply the electricity load system according to the demand, which effectively realizes the function of peak-shifting and valley-filling. The power pipeline network transmits the transmitted electricity through transformers to the corresponding ports to provide power for the daily operations of the transportation industry.
Since wind power and solar photovoltaic power generation are influenced by natural conditions and climate, they adopt the “self-generation and surplus storage” model. Compared to the uncertainty of solar and wind energy, geothermal energy is a more stable renewable energy source independent of climate. It is also richer in energy reserves, has a higher utilization rate of generating units, and has a lower environmental impact than other energy sources.
3. Vulnerability Cascade Propagation Modeling of Energy Systems in the Transportation Industry
3.1. Vulnerability Cascade Propagation Model
A standard Petri net is usually a triple (P, T, F). Among them, P = {} is the finite, non-empty set of the library and represents the subsystems in the energy system of the transportation industry. T = {} is a finite, non-empty set of variables, representing the relationships between the subsystems. F = (P × T) ∪ (T × P) is a unidirectional connection from the depot to the variation and the variation to the depot with sufficient necessary conditions for ① P ∩ T = ② P ∪ T ≠ .
The possible assumptions for the front arc from the depot to the variation, indicating the vulnerability cascade propagation run, are {δi|{ < }, { < < }, { > }}. Where specifically refers to the vulnerability, T is the load threshold, and is the crash threshold, γ > 1. The back-arc from the variation to the depot indicates the impact of the variation on the vulnerability of the depot. λ is the cascade propagation rate, which corresponds to the corresponding variation and is the inverse of the time taken for vulnerability transfer to that pool. Where fire: P→T is the state of vulnerability cascade propagation operation, fire() = 1 means cascade propagation occurs, and fire() = 0 means cascade propagation does not occur.
3.2. Vulnerability Cascade Dissemination Rules
3.2.1. Running Rules
In this paper, we classify the operation rules for different forms of variation in Petri nets and make them correspond to other states in the process of vulnerability cascade propagation.
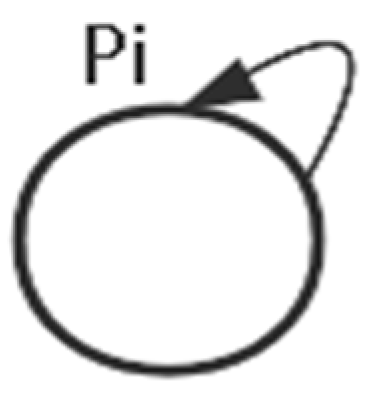
Rule 1: Self-varying rules:
<
. The law is based on the fact that when the library does not reach the specified threshold, there is no logical relationship between any two connected libraries, as shown in
Figure 2.
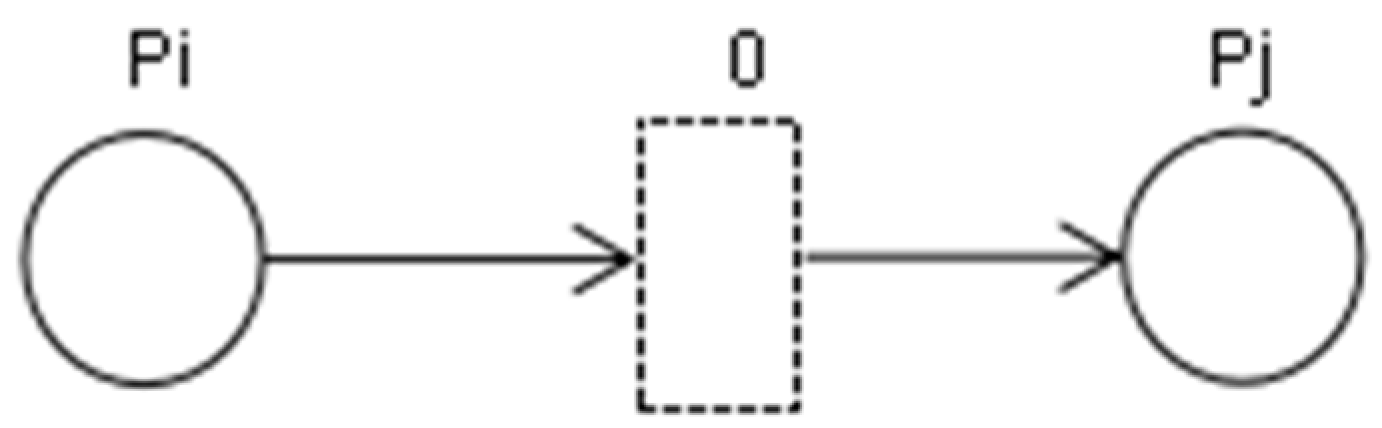
Rule 2: Probabilistic variation rule:
<
<
. The law establishes a fuzzy cascade failure link between
and
for transition purposes. When the previous energy subsystem fails under attack, the temporary failure of this subsystem does not significantly impact the whole transportation industry because the entire energy system is complete and mature, as shown in
Figure 3.
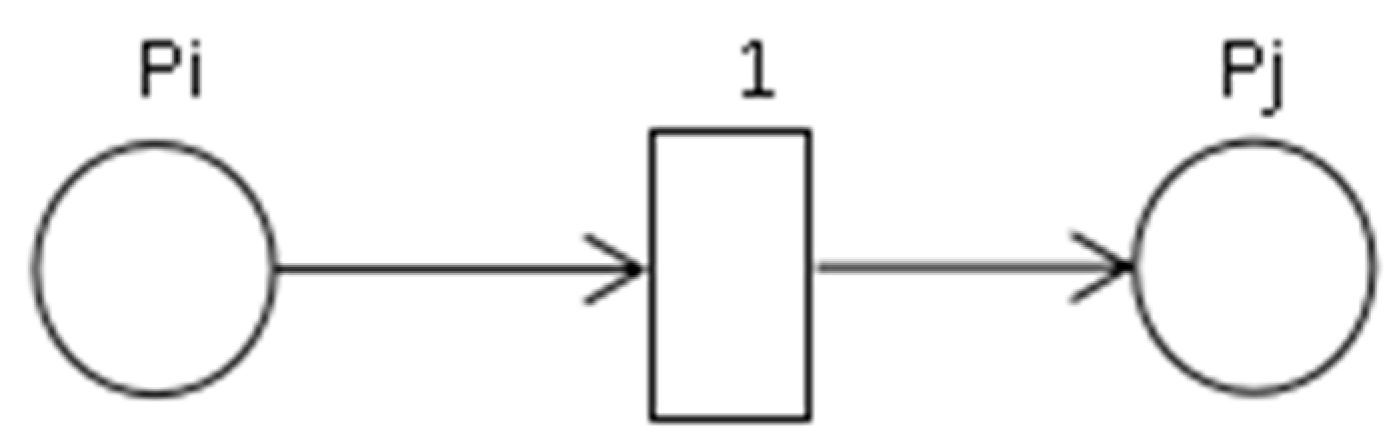
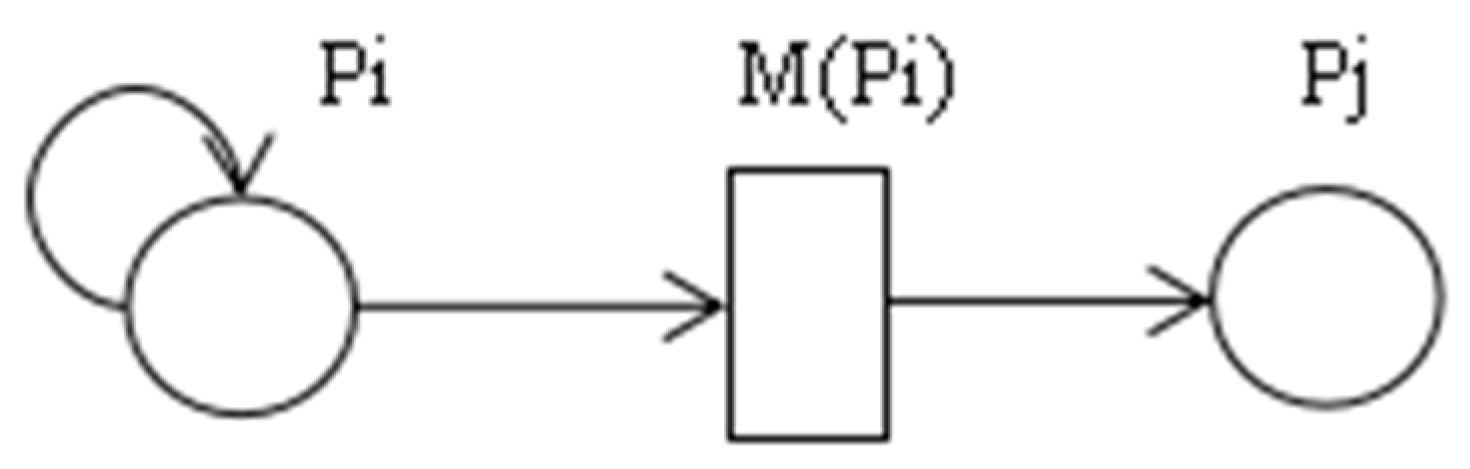
Rule 3: Full variation rule:
>
. This rule applies to the state where cascade propagation starts to run, when the fragility
runs with maximum cascade propagation efficiency, i.e., M(
) = 1, as shown in
Figure 4.
3.2.2. Timing Rules
The Petri net operation rules above are defined from the logical (Rule 1) and spatial (Rules 2 and 3) viewpoints. In the following, both logical and spatial perspectives are considered, and the timing rules of its energy system Petri net are shown in
Figure 5.
In the process of constructing the Petri network model of transportation energy for libraries with multiple associations in the process of cascading propagation, there are multiple triggers which need to be redefined in accordance with the timing rules.
3.3. Petri Net-Based Energy System Model
3.3.1. Energy System Model
Energy system modeling uses logical thinking to depict the network of relationships between a realistic energy system [
26,
27,
28]. Modeling energy systems at all levels help us quantitatively study each subsystem’s energy use in the energy system to achieve energy savings. The industry energy system model is an effective method to measure the industry’s energy status and is a basis for the national implementation of the “carbon neutrality” strategy. Therefore, the study of industry-level energy systems is of great importance. There is no unified classification of energy models internationally, and
Table 1 briefly summarizes several standard types.
Table 1: Any system has its hierarchy, and energy systems are no exception. Therefore, the energy system model used to describe the energy system also has different levels. As shown in
Table 1, for these models, according to Turton et al. [
29], we can classify the models into the global, national, industry, and firm-level energy models. In this paper, we focus on industry-level energy models.
3.3.2. Related Prerequisite Assumptions
The Petri network-based energy system model for the transportation industry constructed in this paper aims to ensure that the energy system risks are under control while saving as much energy as possible. According to the analysis result of the Petri net model, the state of each subsystem of the energy system is judged. If it is in collapse, the subsystem in destruction can be found by searching Petri net. At the same time, the corresponding risk sources are located, and risk control plans are developed as quickly as possible while ensuring the regular operation of the system. Therefore, the following assumptions are made before building the transportation industry energy system model.
- (1)
Control of one risk source does not increase the status value of other risks.
- (2)
There is no interaction between the different structures and the irreversible state transfer.
- (3)
The specific structure of the known energy system model is illustrated.
- (4)
Any power supply line can be abstracted as a Petri network transmission path.
3.3.3. Construction and Analysis of Functional Petri Nets
An object-oriented approach should differentiate an extensive system into information transfer between various subsystems when modelling an integrated energy system using function Petri nets. In this paper, we use Tina 3.7.0 software (The software was developed in OLC by the research team of OLAS/CNRS) to model the Petri network and apply Matlab 2019b software (The software is a commercial mathematical software produced by American MathWorks Company) to simulate vulnerability cascade propagation based on modelling the integrated energy system in the transportation industry. The modelling steps are as follows:
Step 1: Analyze the problem. Determine the objectives of the research problem and analyze the main contents of the research problem; some contents that are not easy to model are not included in the modelling content.
Step 2: Determine the objects to be included in the model. The subjects involved in the research are categorized and abstracted into objects in the model through the research content analysis. According to the transportation industry energy system structure diagram, the modelling objects include wind turbines, geothermal power plants, photovoltaic cells, transmission pipeline network, batteries and their conversion equipment, and energy storage equipment.
Step 3: Analyze the internal connections between objects. Analyze the connections between different objects and construct the information transfer connections between objects for building the Petri net model.
Step 4: Set the identifier for building the Petri net model.
Step 5: Perform dynamic property analysis and structural property analysis on the established Petri net model to determine the correctness and usability of the model.
3.3.4. Modeling of Petri Networks for Energy Systems in the Transportation Industry
The selection function Petri net model has some advantages in modelling energy systems in the transportation industry. On the one hand, studying the vulnerability of integrated energy systems in the transportation industry is to uncover the logical causal relationships that lead to the cascade propagation of system vulnerability to evaluate the possibility that the integrated energy systems in the transportation industry are affected and become vulnerable. Petri nets can precisely deal with the cause–effect parallelism and represent the system model. On the other hand, vulnerability is a function of time describing sustainable development. The function Petri net can respond to each indicator feature’s multi-attribute and dynamic characteristics. The process of transferring each object in the system from one state to another is perfectly presented.
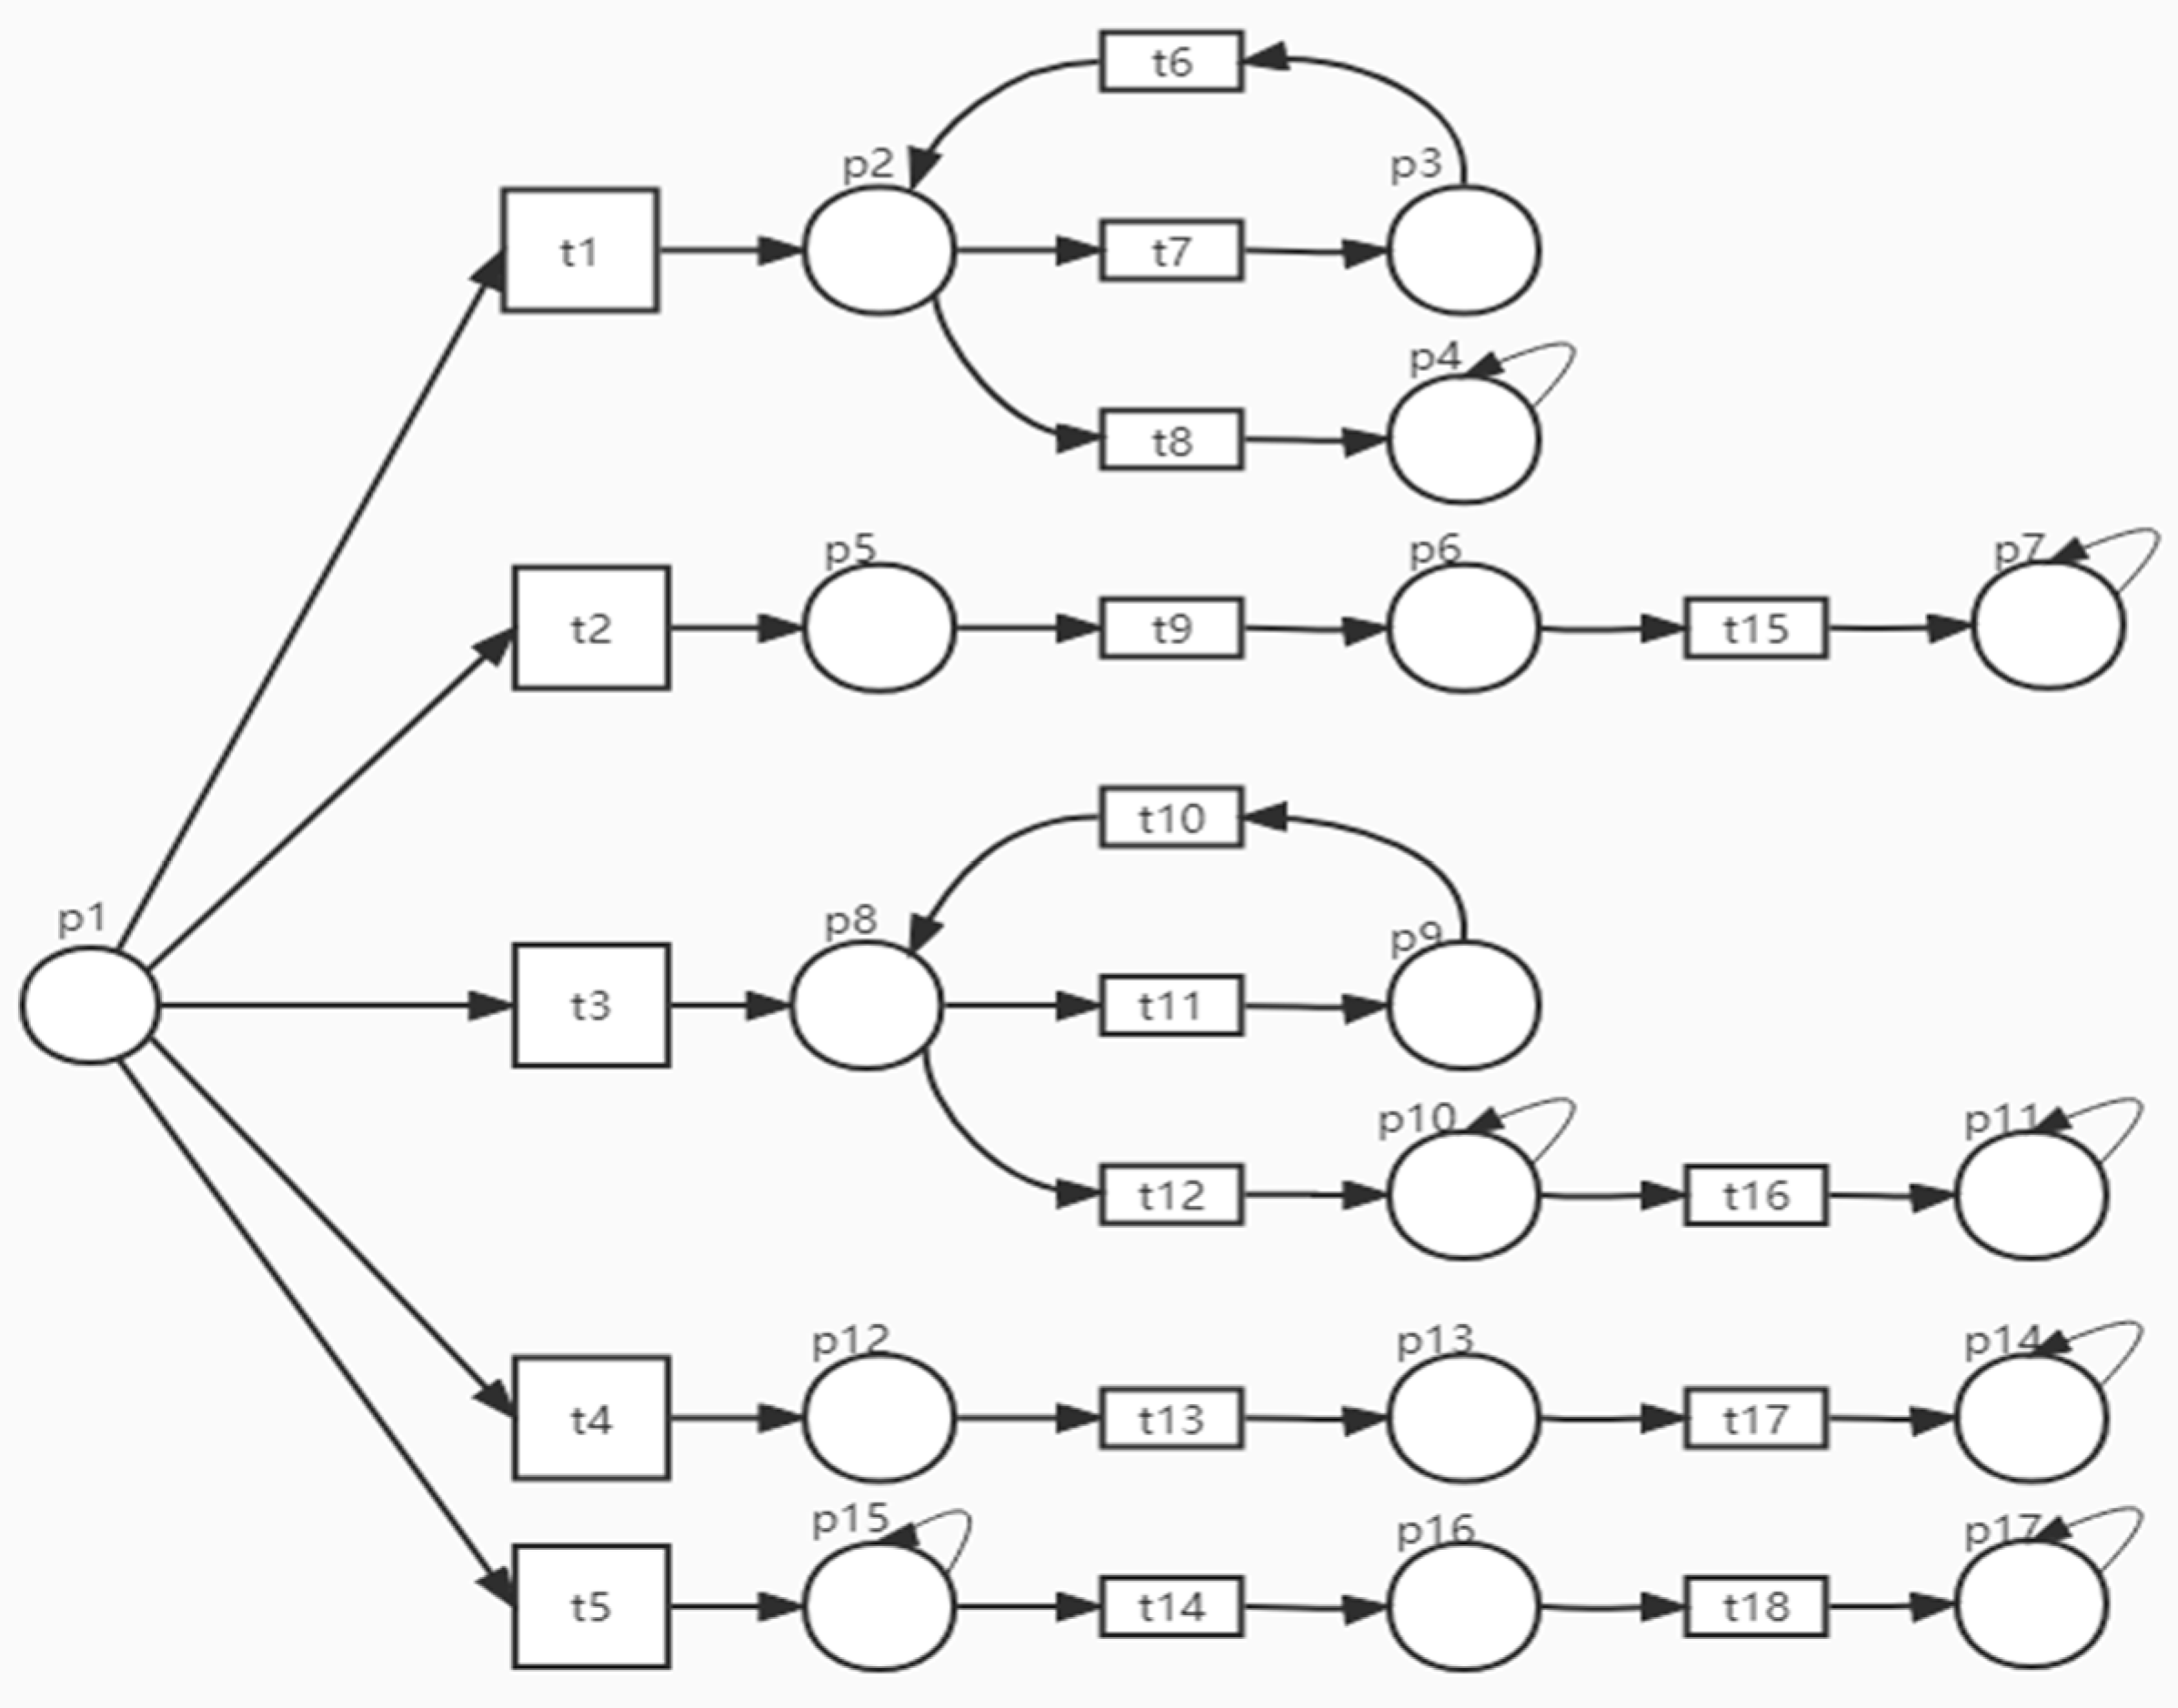
The integrated energy system model for the transportation industry constructed in this paper is structured to reflect only the system’s configuration. Vertically, the model includes five primary levels: wind power generation system, geothermal energy generation system, solar power generation system, external transmission system, and battery transmission system. Horizontally, each type of electrical load contains multiple supply networks, each consisting of supply energy, conversion equipment, energy storage equipment, and electrical loads.
Figure 6 shows the Petri net model of the energy system in the transportation industry, and the layered modeling approach makes the model more normative as a whole.
The place represents the subsystems in the energy system, and the variation means the transitions between different systems. The role of the change is to change the place from one state to another by implementing the change. The prominent locations of the Petri network repositories of the transitions energy system and their descriptions are shown in
Table 2.
3.4. Figu
As shown in
Table 2 and
Figure 6, the operation of an integrated energy system for the transportation industry requires a collaborative effort among the various subsystems, with each part being integral.
4. Vulnerability Cascade Propagation Analysis of Energy Systems in the Transportation Industry
4.1. Algorithm Flow
This paper applies Matlab 2019b software for simulation-based modeling energy systems in the transportation industry using Tina 3.7.0 software. Based on the above theoretical analysis, the specific analysis process of the transportation industry energy system model vulnerability cascade propagation is as follows.
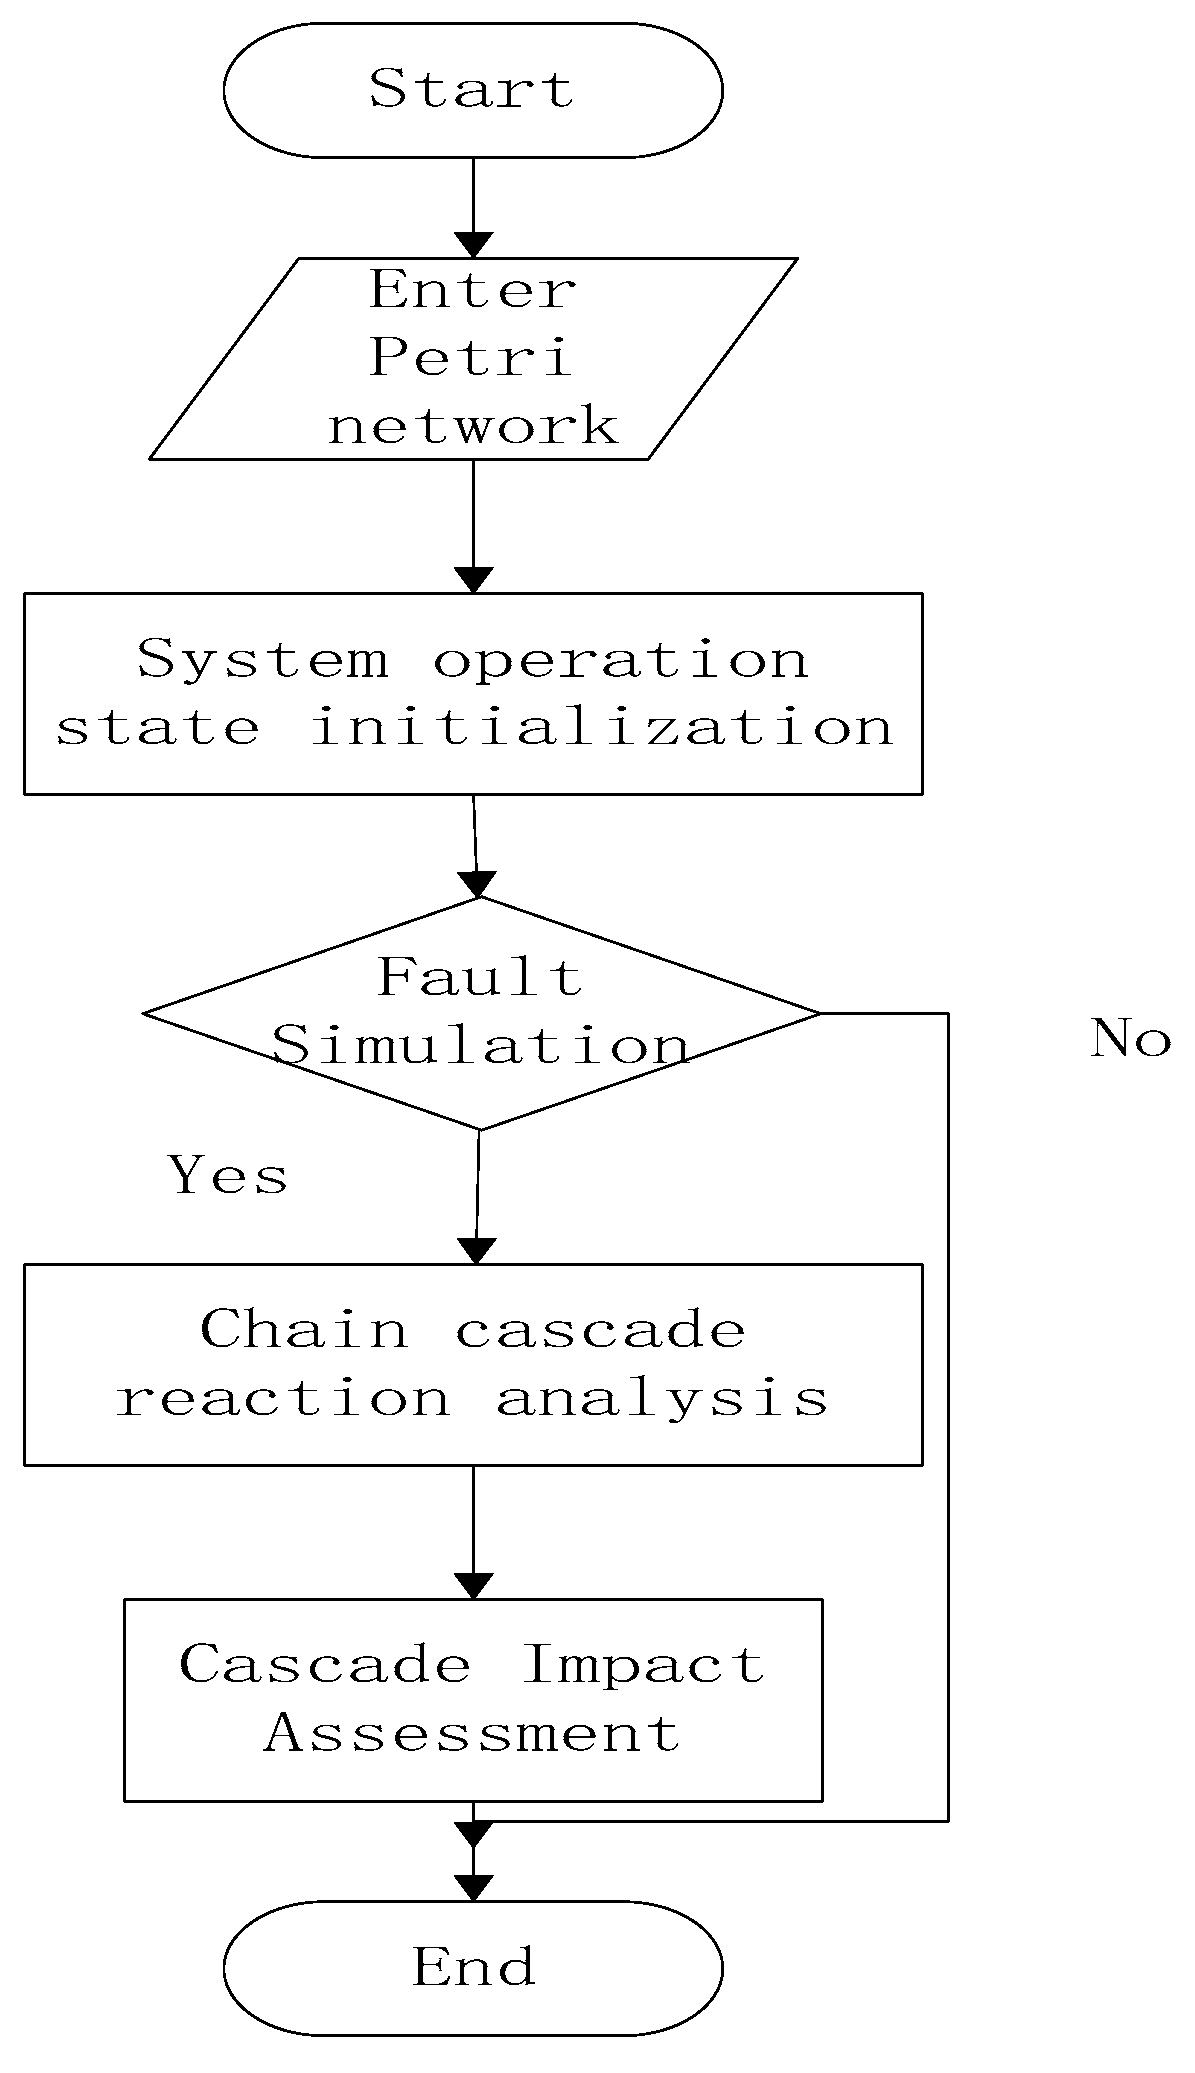
Step 1: Enter Petri net. The Petri net model is entered into Matlab, i.e., the code is used to simulate the iteration of the network.
Step 2: System operation state initialization. Determine the initial energy system parameters based on the given initial conditions of the energy system in the transportation industry.
Step 3: Fault simulation. Simulation of model failure responses for energy systems in the transportation industry.
Step 4: Cascade reaction analysis. Based on the initial state determined in step 2, the impact on the energy system of the transportation industry is integrated and analyzed.
Step 5: Cascade impact assessment. In response to the cascade response analysis in the previous step, a comprehensive impact assessment of the energy system in the transportation industry was conducted.
The specific flow chart is shown in
Figure 7.
4.2. Vulnerability Cascade Propagation Analysis
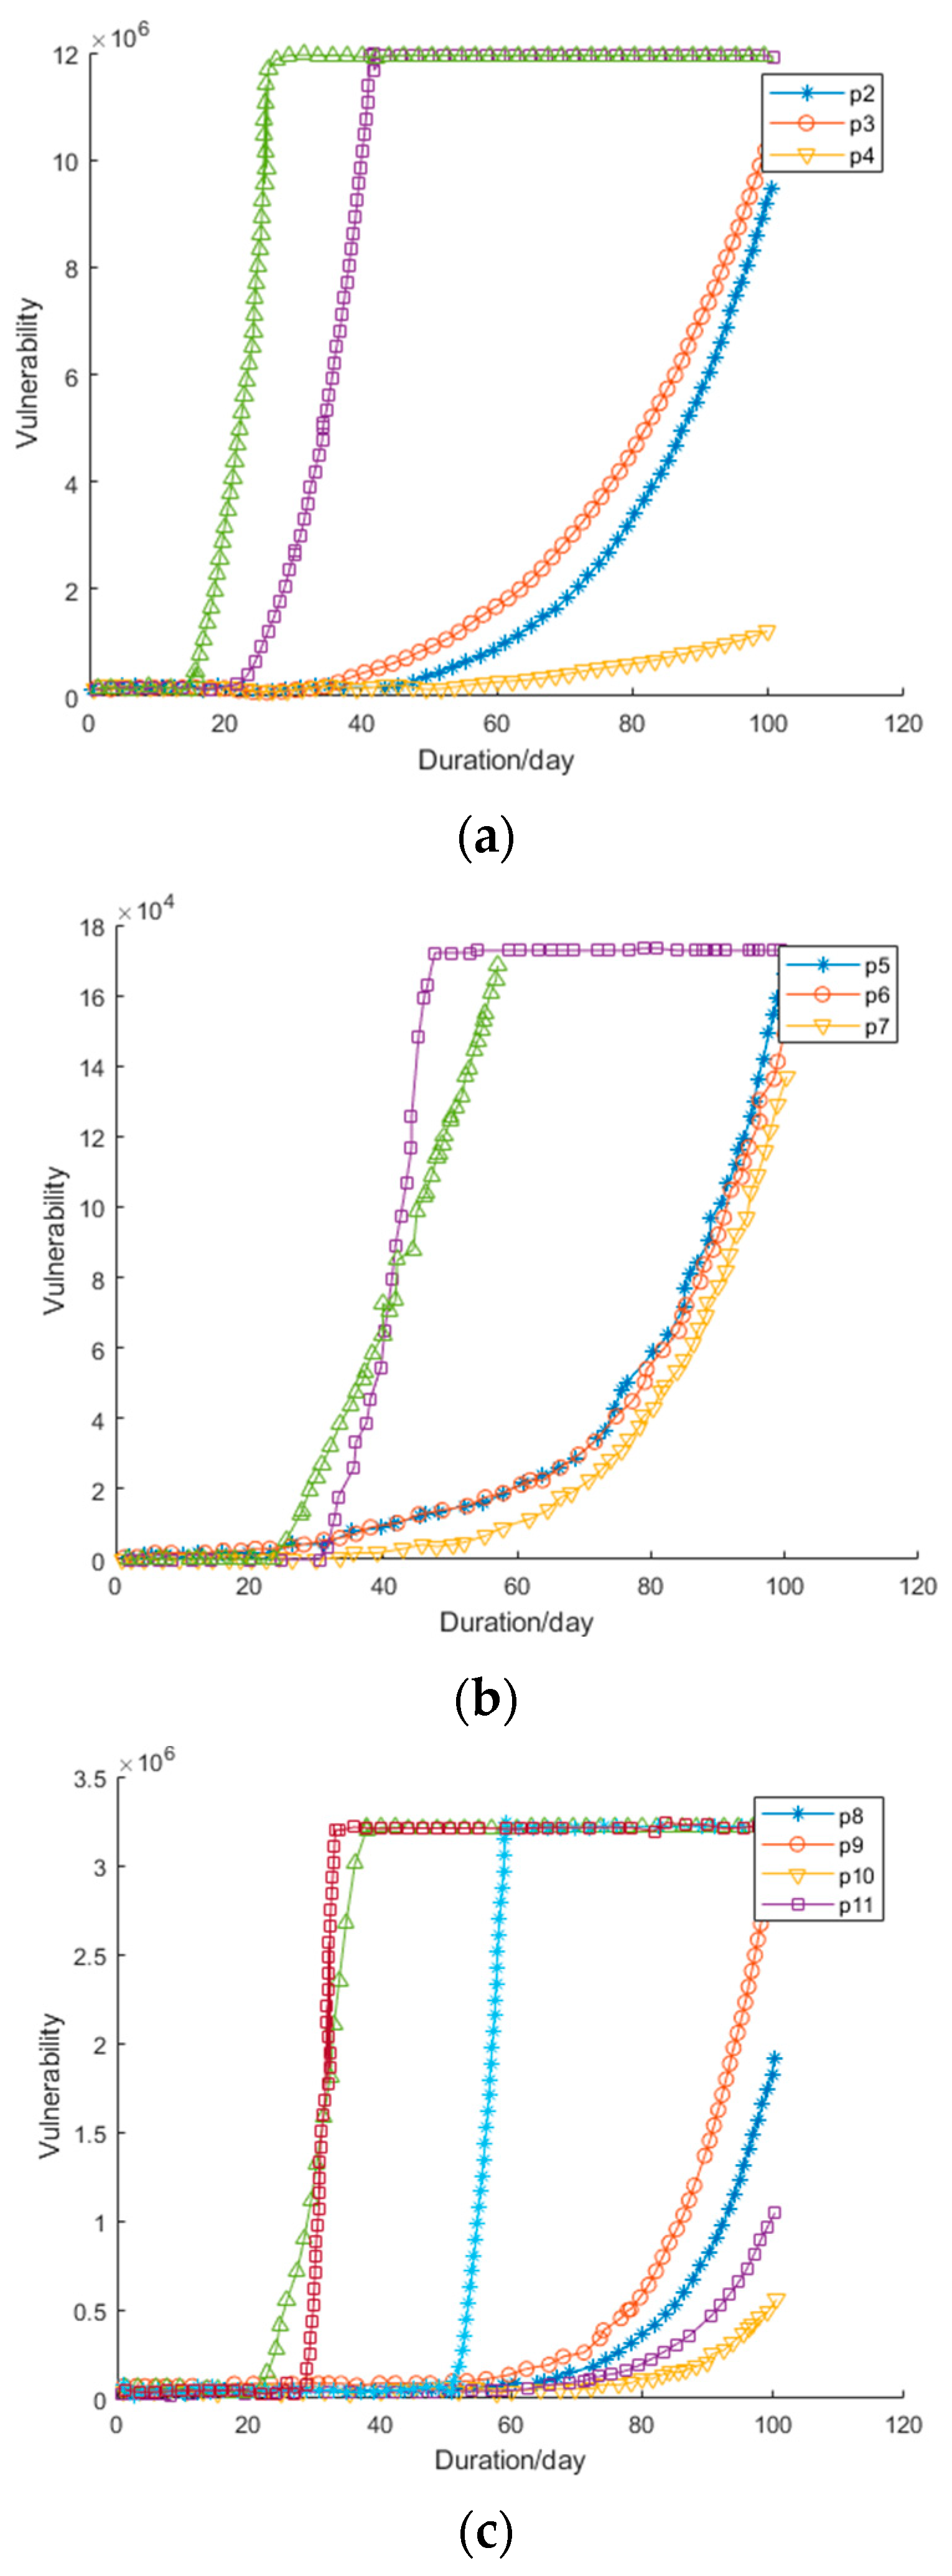
The simulation analysis of the vulnerability cascade propagation state of the energy system in the transportation industry is carried out with the relevant parameters
= 0.2,
= 5,
= 10 in the model, and the simulation results are shown in
Figure 8.
The above figure shows the changing law of the propagation state of the place vulnerability cascade on different lines of the energy system in the transportation industry. According to
Figure 8, it is easy to see that the vulnerability is proportional to when the place is in a steady state. The longer the impact duration, the more vulnerable the energy system is. When cascade propagation occurs, the rate of vulnerability change increases significantly, and the collapse state is larger than the load state. In addition, according to the acyclic Petri nets
Figure 8b,d,e, it can be seen that the fragility of a place has a direct impact on the previous connected place, and its cascade failure response is stronger, leading to a more fragile energy system. Additionally, according to the ringed Petri network
Figure 8a, it can be found that
Figure 8c’s ring nodes, compared with other places on the same path, are more vulnerable. In summary, a ring structure in the Petri network makes the energy system more vulnerable.
5. Research Findings and Discussion
With the widespread use of integrated energy systems in our energy system, the ensuing issue of energy system vulnerability cascade propagation has become particularly important. In this paper, based on the analysis of the Petri net model, we find that the vulnerability cascade propagation direction is the same for the ringed structure and the acyclic structure. Still, the ringed system is more vulnerable than the acyclic structure, and the vulnerability cascade propagation speed of the ringed structure is higher than that of the acyclic structure. This is mainly because the presence of ring nodes increases the system’s connectivity, which leads to a rapid increase in vulnerability.
In addition, the vulnerability of the energy system is changing over time, and the factors that keep the different subsystems in balance vary. When a system is in a steady state, the state that maintains its equilibrium is primarily the system’s ability to self-adjust. When a system is under load, certain disturbance factors can impact its vulnerability. Energy system vulnerability is at its maximum when the system is in a state of collapse, leading to system collapse or even irreversible effects on the energy system. We recommend decision makers to take appropriate early warning and protection measures according to the different states the subsystems are in to improve the service functions and avoid irreversibility or even collapse of the energy system.
The study of vulnerability cascade propagation of integrated energy systems in the transportation industry based on Petri nets is limited due to many subsystems and complex wiring in integrated energy systems in the transportation industry. This paper proposes a Petri net modelling approach for individual subsystems and objects in the integrated energy system to address the problems and limitations of domestic and international literature in this area. The integrated energy system of the transportation industry is divided into several subsystems according to different power supply methods, and the model and data of each subsystem are introduced into the Petri net. In contrast, the number of components in the subsystem is determined by combining relevant information to establish the respective Petri net model. This method is a breakthrough in solving the limitations of Petri net models in complex networks due to their diversity and complexity.
6. Conclusions
This paper introduces Petri nets into Matlab to address the transportation industry cascade’s propagation of energy system vulnerability. A Petri net-based cascade propagation model of energy system vulnerability is proposed. The model forms a one-to-one mapping relationship between the energy system place and transition. Based on the careful consideration of the vulnerability cascade propagation paths and the linkage between each subsystem, the Petri net model of vulnerability cascade propagation of energy systems in the transportation industry is constructed using tina software. In this context, indicators such as vulnerability cascade propagation rules and states are redefined for each subsystem.
The theoretical contribution of this paper exists in the following aspects: On the one hand, the industry integrated energy system is a large-scale complex network system. Each subsystem is interconnected with the corresponding conversion system and power storage system. Therefore, the industry’s simulation modeling process of integrated energy systems is particularly complex. Additionally, Petri network modeling has become a hot issue of research in electric energy in recent years, and related analysis methods are constantly applied to innovation. This paper takes the integrated energy system of the transportation industry as the research object and models each subsystem within the system. The research results can effectively simulate the vulnerability cascade propagation process and further promote the practical application of Petri network simulation modeling technology in the industry’s integrated energy system research. On the other hand, this paper establishes an integrated energy system model for the transportation industry based on the actual situation, which is in line with the operational characteristics of the integrated energy system, and the empirical analysis on this basis can improve the accuracy of the conclusion and provide new ideas for the study of vulnerability cascade propagation of the integrated energy system in the transportation industry.
In terms of practical significance, it provides suggestions for the scientific planning and construction of integrated energy systems in the transportation industry. The complexity of the industry’s integrated energy system poses certain challenges for the planning and maintenance of the integrated energy system. In this paper, we select the integrated energy system of the transportation industry as the research object and sort out the lines and nodes of different subsystems, respectively. On this basis, the research conclusions on the vulnerability cascade propagation of the integrated energy system of the transportation industry can provide a reference for the planning and design of the integrated energy system in the future.
There are several limitations of the study. On the one hand, the indicators to measure the vulnerability cascade propagation of energy systems in the transportation industry are not specified. The study relying on the vulnerability cascade propagation rate alone is slightly thin. On the other hand, the transportation industry is complex and extensive. It is too large and difficult to model the Petri network in all regions of the entire transportation industry, which will be further developed in the subsequent study.
Author Contributions
Conceptualization, X.Y.; methodology, Q.L.; software, L.L.; validation, Q.L. and L.L.; writing—review and editing, X.Y., Q.L. and L.L. All authors have read and agreed to the published version of the manuscript.
Funding
This research is funded by research base of science and technology innovation think tank of Liaoning Province (research base of high-quality development of equipment manufacturing industry, NO.09), 2021 scientific research project of department of education of Liaoning Province (LJKR0225, LJKR0224).
Institutional Review Board Statement
Not applicable.
Informed Consent Statement
Not applicable.
Data Availability Statement
Not applicable.
Conflicts of Interest
The authors declare no conflict of interest. The funders had no role in the design of the study; in the collection, analyses, or interpretation of data; in the writing of the manuscript, or in the decision to publish the results.
References
- Ozawa, A.; Kudo, H.Y.; Murata, A.; Honda, T.; Saita, I.; Takagi, H. Hydrogen in low-carbon energy systems in Japan by 2050: The uncertainties of technology development and implementation. Int. J. Hydrogen Energy 2018, 43, 18083–18094. [Google Scholar] [CrossRef]
- Zeng, M.; Liu, Y.X.; Zhou, P.C.; Wang, Y.C.; Hou, M.X. Review and outlook of integrated energy system modeling and efficiency evaluation system. Power Grid Technol. 2018, 42, 12. [Google Scholar]
- Esmaeili, S.; Anvari-Moghaddam, A.; Jadid, S. Optimal operational scheduling of reconfigurable multi-microgrids considering energy storage systems. Energies 2019, 12, 1766. [Google Scholar] [CrossRef] [Green Version]
- Wang, W.; Wang, D.; Liu, L.; Jia, H.; Zhi, Y.; Meng, Z.; Du, W. Research on modeling and hierarchical scheduling of a generalized multi-source energy storage system in an integrated energy distribution system. Energies 2019, 12, 246. [Google Scholar] [CrossRef] [Green Version]
- Fan, M.; Liu, J.; Zhu, Z. Low-carbon economic dispatch strategy for integrated electricity-gas energy system with electricity-to-gas conversion. Hydropower Energy Sci. 2019, 37, 5. [Google Scholar]
- Alirahmi, S.M.; Dabbagh, S.R.; Ahmadi, P.; Wongwises, S. Multi-objective design optimization of a multi-generation energy system based on geothermal and solar energy. Energy Convers. Manag. 2020, 205, 112426. [Google Scholar] [CrossRef]
- Berntsen, P.B.; Trutnevyte, E. Ensuring diversity of national energy scenarios: Bottom-up energy system model with modeling to generate alternatives. Energy 2017, 126, 886–898. [Google Scholar] [CrossRef] [Green Version]
- Tian, T. Research on the status and development of green ports in China. Environ. Sci. Manag. 2018, 43, 5. [Google Scholar]
- Brown, T.; Schlachtberger, D.; Kies, A.; Schramm, S.; Greiner, M. Synergies of sector coupling and transmission reinforcement in a cost-optimised, highly renewable European energy system. Energy 2018, 160, 720–739. [Google Scholar] [CrossRef] [Green Version]
- Gea-Bermúdez, J.; Jensen, I.G.; Münster, M.; Koivisto, M.; Kirkerud, J.G.; Chen, Y.K.; Ravn, H. The role of sector coupling in the green transition: A least-cost energy system development in northern-central Europe towards 2050. Appl. Energy 2021, 289, 116685. [Google Scholar] [CrossRef]
- Wang, J.; Gu, W.; Lu, S.; Zhang, C.L.; Wang, Z.; Tang, Y. Collaborative planning of multi-regional integrated energy systems combining heat network models. Power Syst. Autom. 2016, 40, 17–24. [Google Scholar]
- Li, B.; Roche, R.; Miraoui, A. Microgrid sizing with combined evolutionary algorithm and milp unit commitment. Appl. Energy 2017, 188, 547–562. [Google Scholar] [CrossRef] [Green Version]
- Wang, J.; Zhong, H.; Ma, Z.; Xia, Q.; Kang, C. Review and prospect of integrated demand response in the multi-energy system. Appl. Energy 2017, 202, 772–782. [Google Scholar] [CrossRef]
- Quan, C.; Dong, X.F.; Jiang, T. Optimal planning of integrated energy system in electricity and natural gas regions based on cchp coupling. Power Grid Technol. 2018, 42, 11. [Google Scholar]
- Lei, X.; Tang, W.Z.; Li, Y.Y.; He, J.Y.; Liu, Q.Y. Distribution grid expansion planning considering optimal operation of regional integrated energy systems. Power Syst. Technol. 2018, 42, 2459–3468. [Google Scholar]
- Lin, S.Y.; Chen, J.F. Distributed optimal power flow for smart grid transmission system with renewable energy sources. Energy 2013, 56, 184–192. [Google Scholar] [CrossRef]
- Olsen, D.J.; Zhang, N.; Kang, C.; Ortega-Vazquez, M.A.; Kirschen, D.S. Planning low-carbon campus energy hubs. IEEE Trans. Power Syst. 2018, 34, 1895–1907. [Google Scholar] [CrossRef] [Green Version]
- Klyapovskiy, S.; You, S.; Cai, H.; Bindner, H.W. Integrated planning of a large-scale heat pump in view of heat and power networks. IEEE Trans. Ind. Appl. 2018, 55, 5–15. [Google Scholar] [CrossRef] [Green Version]
- Li, Y.; Zhang, H.; Liang, X.; Huang, B. Event-triggered based distributed cooperative energy management for multienergy systems. IEEE Trans. Ind. Inf. 2019, 15, 2008–2022. [Google Scholar] [CrossRef]
- Xue, S.H.; Li, N.; Zhou, X.M.; Zhang, J.J.; Zhang, Z.Y.; Wu, F. Optimal operation of integrated energy systems considering integrated demand response. Power Demand Side Manag. 2020, 22, 6. [Google Scholar]
- Li, Y.; Gao, D.W.; Gao, W.; Zhang, H.; Zhou, J. A Distributed Double-Newton Descent Algorithm for Cooperative Energy Management of Multiple Energy Bodies in Energy Internet. IEEE Trans. Ind. Inf. 2021, 17, 5993–6003. [Google Scholar] [CrossRef]
- Peterson, J.L. Petri Net Theory and Modeling of Systems; PrenticeHall: Hoboken, NJ, USA, 2010. [Google Scholar]
- Karmakar, S.; Dasgupta, R. A Petri net Representation of a web-service-based emergency management system in railway station. World Acad. Sci. Eng. Technol. 2011, 59, 2284–2290. [Google Scholar]
- Decun, M.; Qingtian, Z.; Faming, L.; Jian, S.; Jiufang, A. Cross-organization task coordination patterns of urban emergency response systems. Inf. Technol. J. 2011, 10, 250–264. [Google Scholar]
- Zhou, J.F.; Reniers, G. Petri-net based modeling and queuing analysis for resource-oriented cooperation of emergency response actions. Trans. Inst. Chem. Eng. Process Saf. Environ. Prot. Part B 2016, 102, 567–576. [Google Scholar] [CrossRef]
- Zeng, T.; Moura, S. Joint design of electric freight fleet and charging infrastructure network in urban mobility and energy system. IEEE Trans. Intell. Transp. Syst. 2021, 25, 4. [Google Scholar]
- Li, Y.; Gao, D.W.; Gao, W.; Zhang, H.; Zhou, J. Double-Mode Energy Management for Multi-Energy System via Distributed Dynamic Event-Triggered Newton-Raphson Algorithm. IEEE Trans. Smart Grid 2020, 11, 5339–5356. [Google Scholar] [CrossRef]
- Liu, L.; Liu, Y.J.; Chen, A.; Tong, S.; Chen, C.L. Integral barrier Lyapunov function based adaptive control for switched nonlinear systems. Sci. China Inf. Sci. 2020, 63, 132203. [Google Scholar] [CrossRef] [Green Version]
- Turton, H.; Barreto, L. Long-term security of energy supply and climate change. Energy Policy 2006, 34, 2232–2250. [Google Scholar] [CrossRef]
| Publisher’s Note: MDPI stays neutral with regard to jurisdictional claims in published maps and institutional affiliations. |
© 2022 by the authors. Licensee MDPI, Basel, Switzerland. This article is an open access article distributed under the terms and conditions of the Creative Commons Attribution (CC BY) license (https://creativecommons.org/licenses/by/4.0/).


