
Policy Instruments for the Improvement of Customers’ Willingness to Purchase Electric Vehicles: A Case Study in Iran

 ,
,  and
and 
Abstract
:1. Introduction
2. Literature Review
2.1. Previous Studies on EVs Preferences
2.2. Research Gap
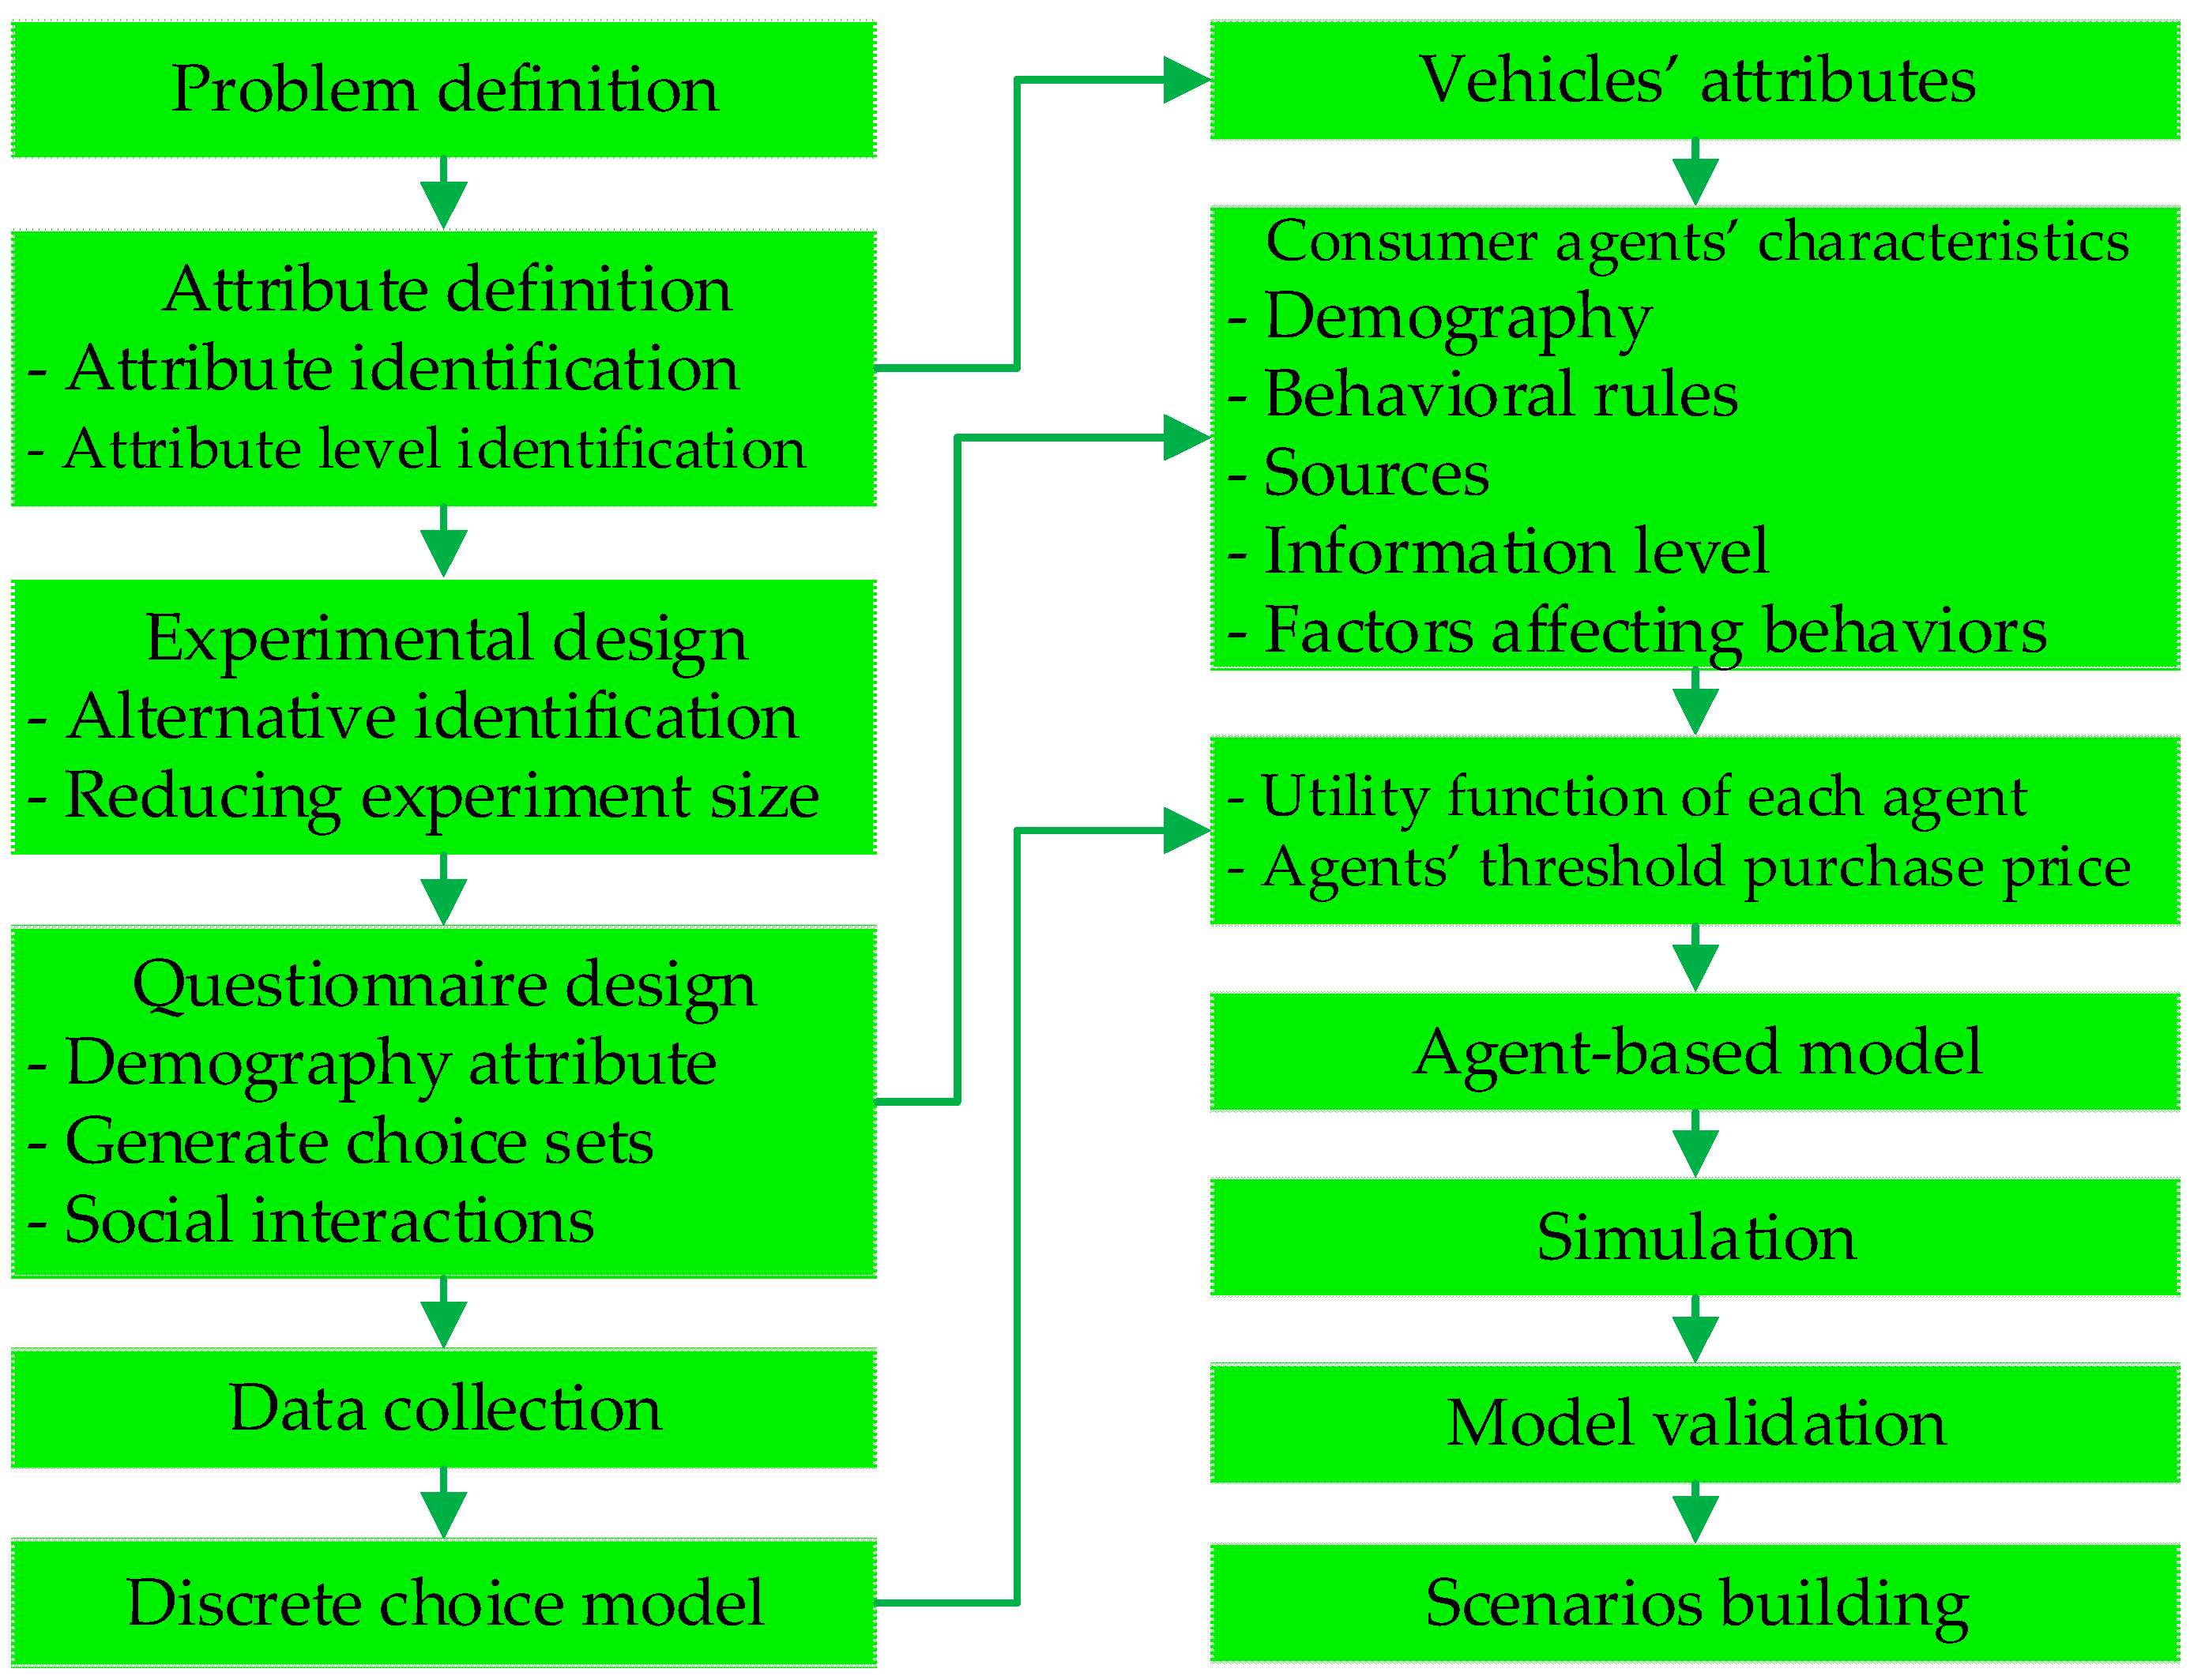
3. Research Methodology
3.1. Formulation of the Model
3.2. Questionnaire Design & Data Collection
3.3. Discrete Choice Model
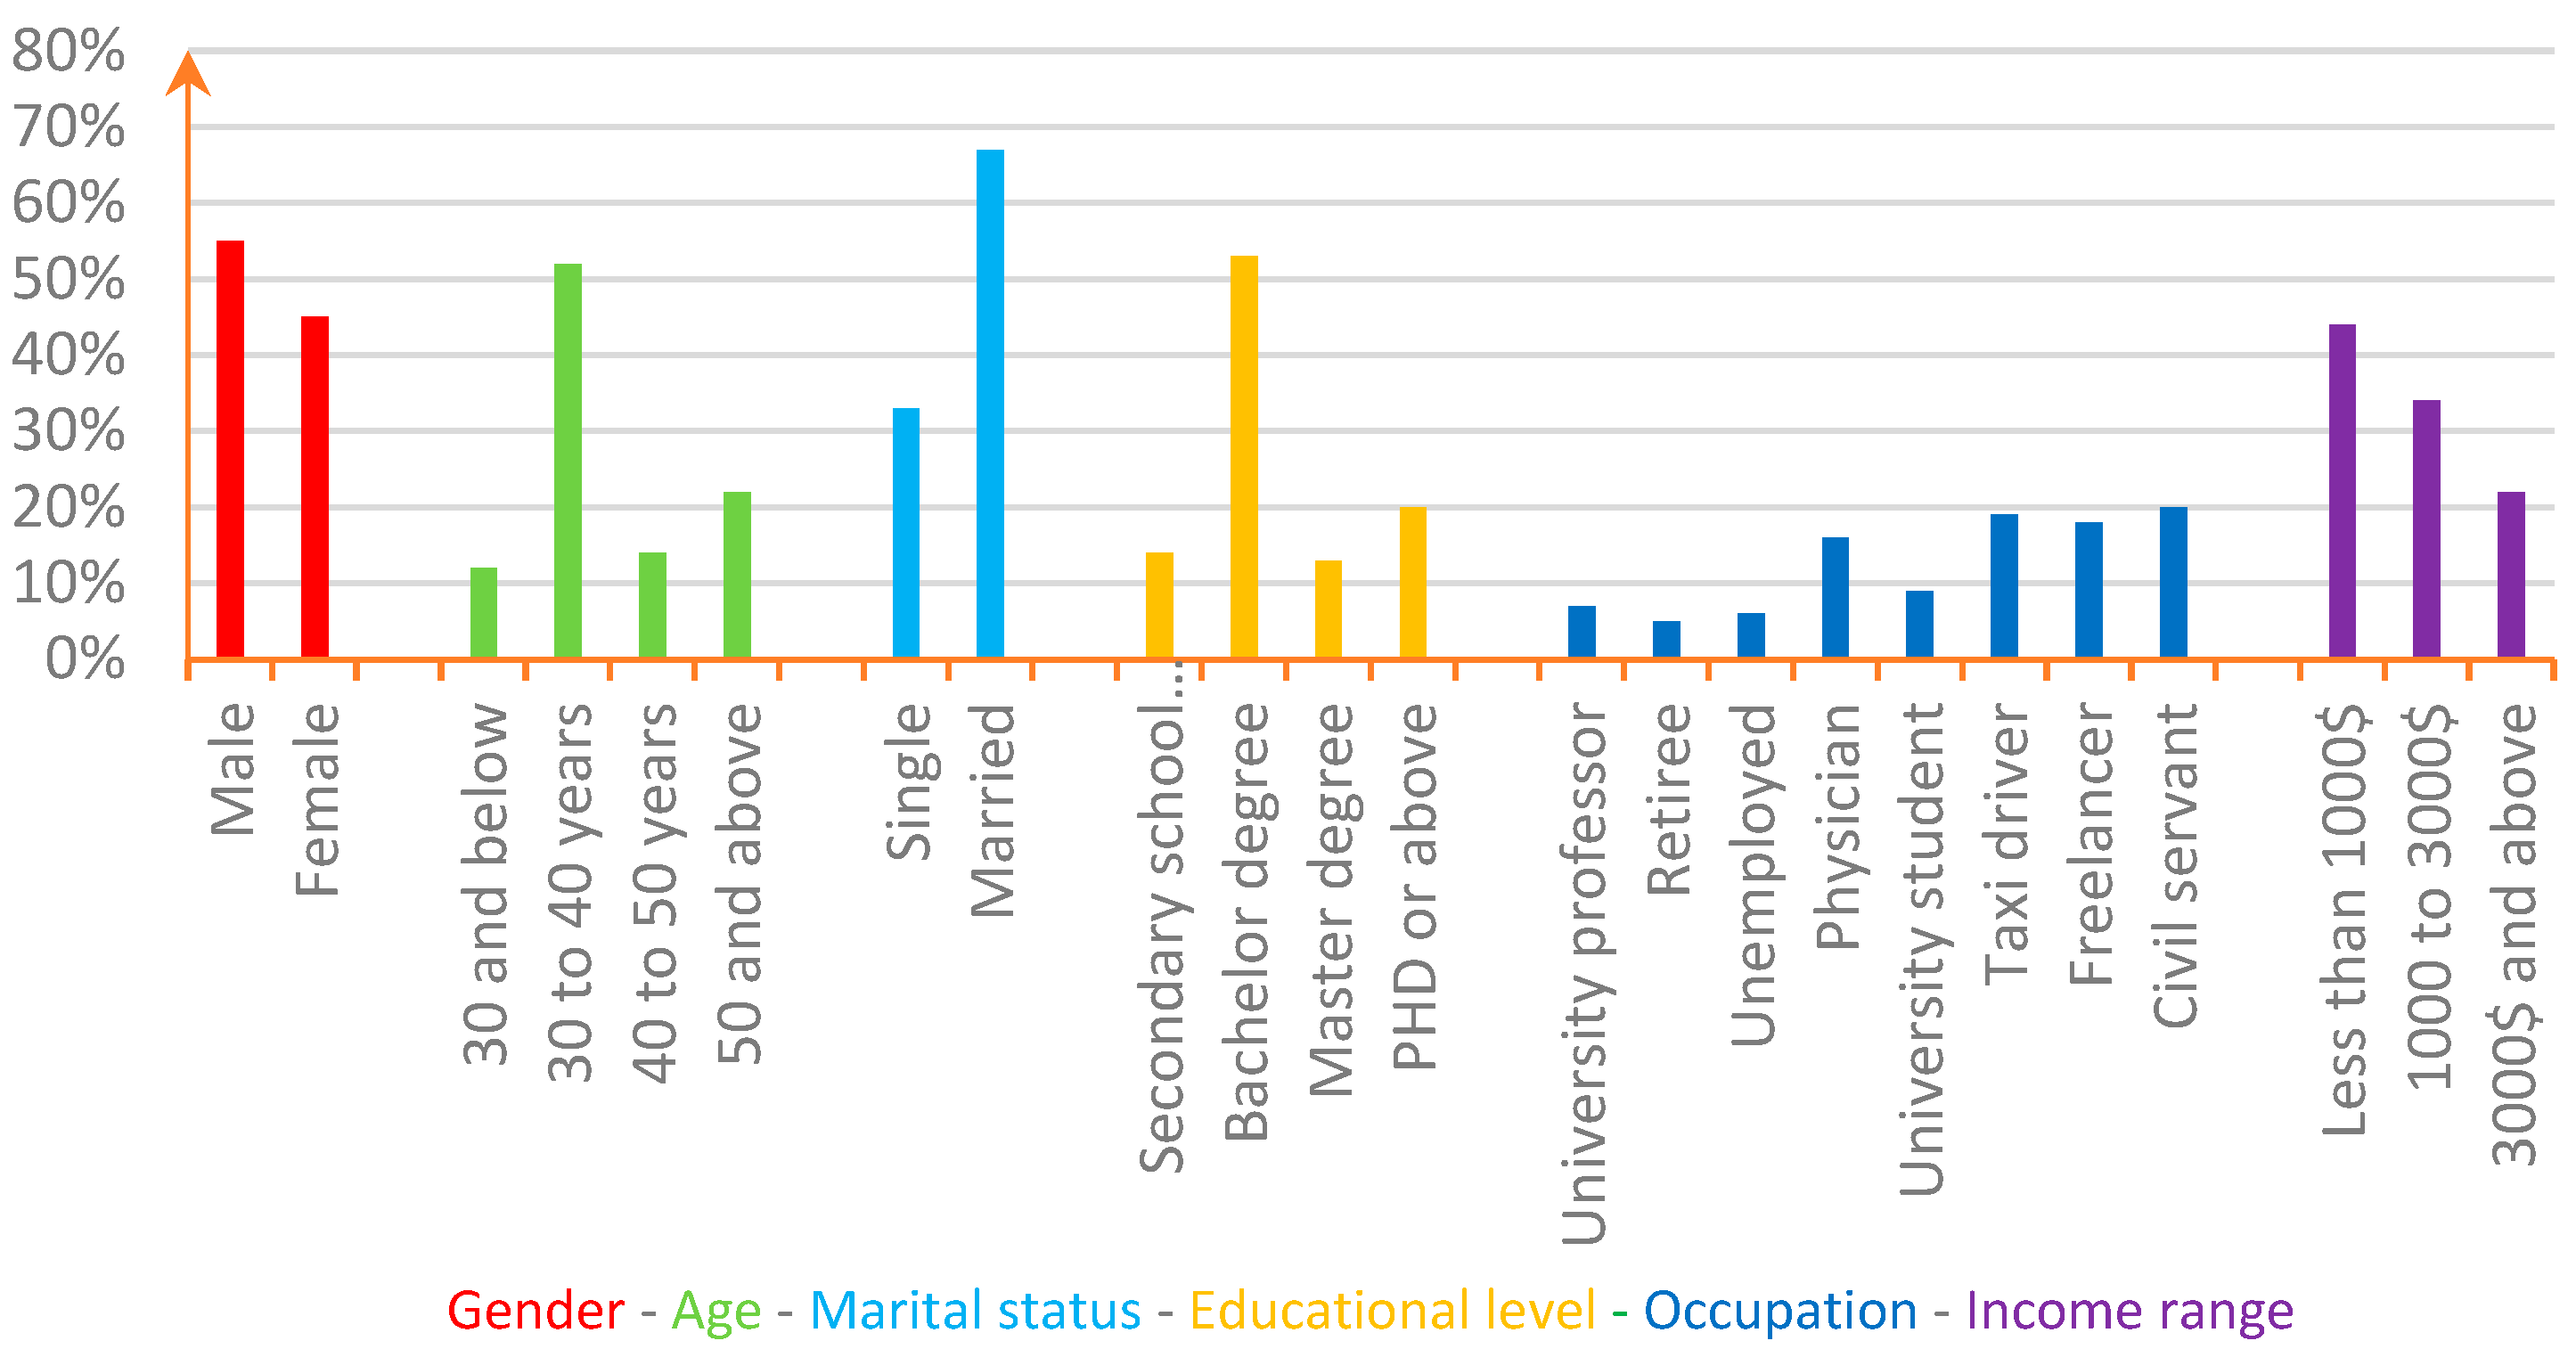
4. Survey
5. Agent-Based Model
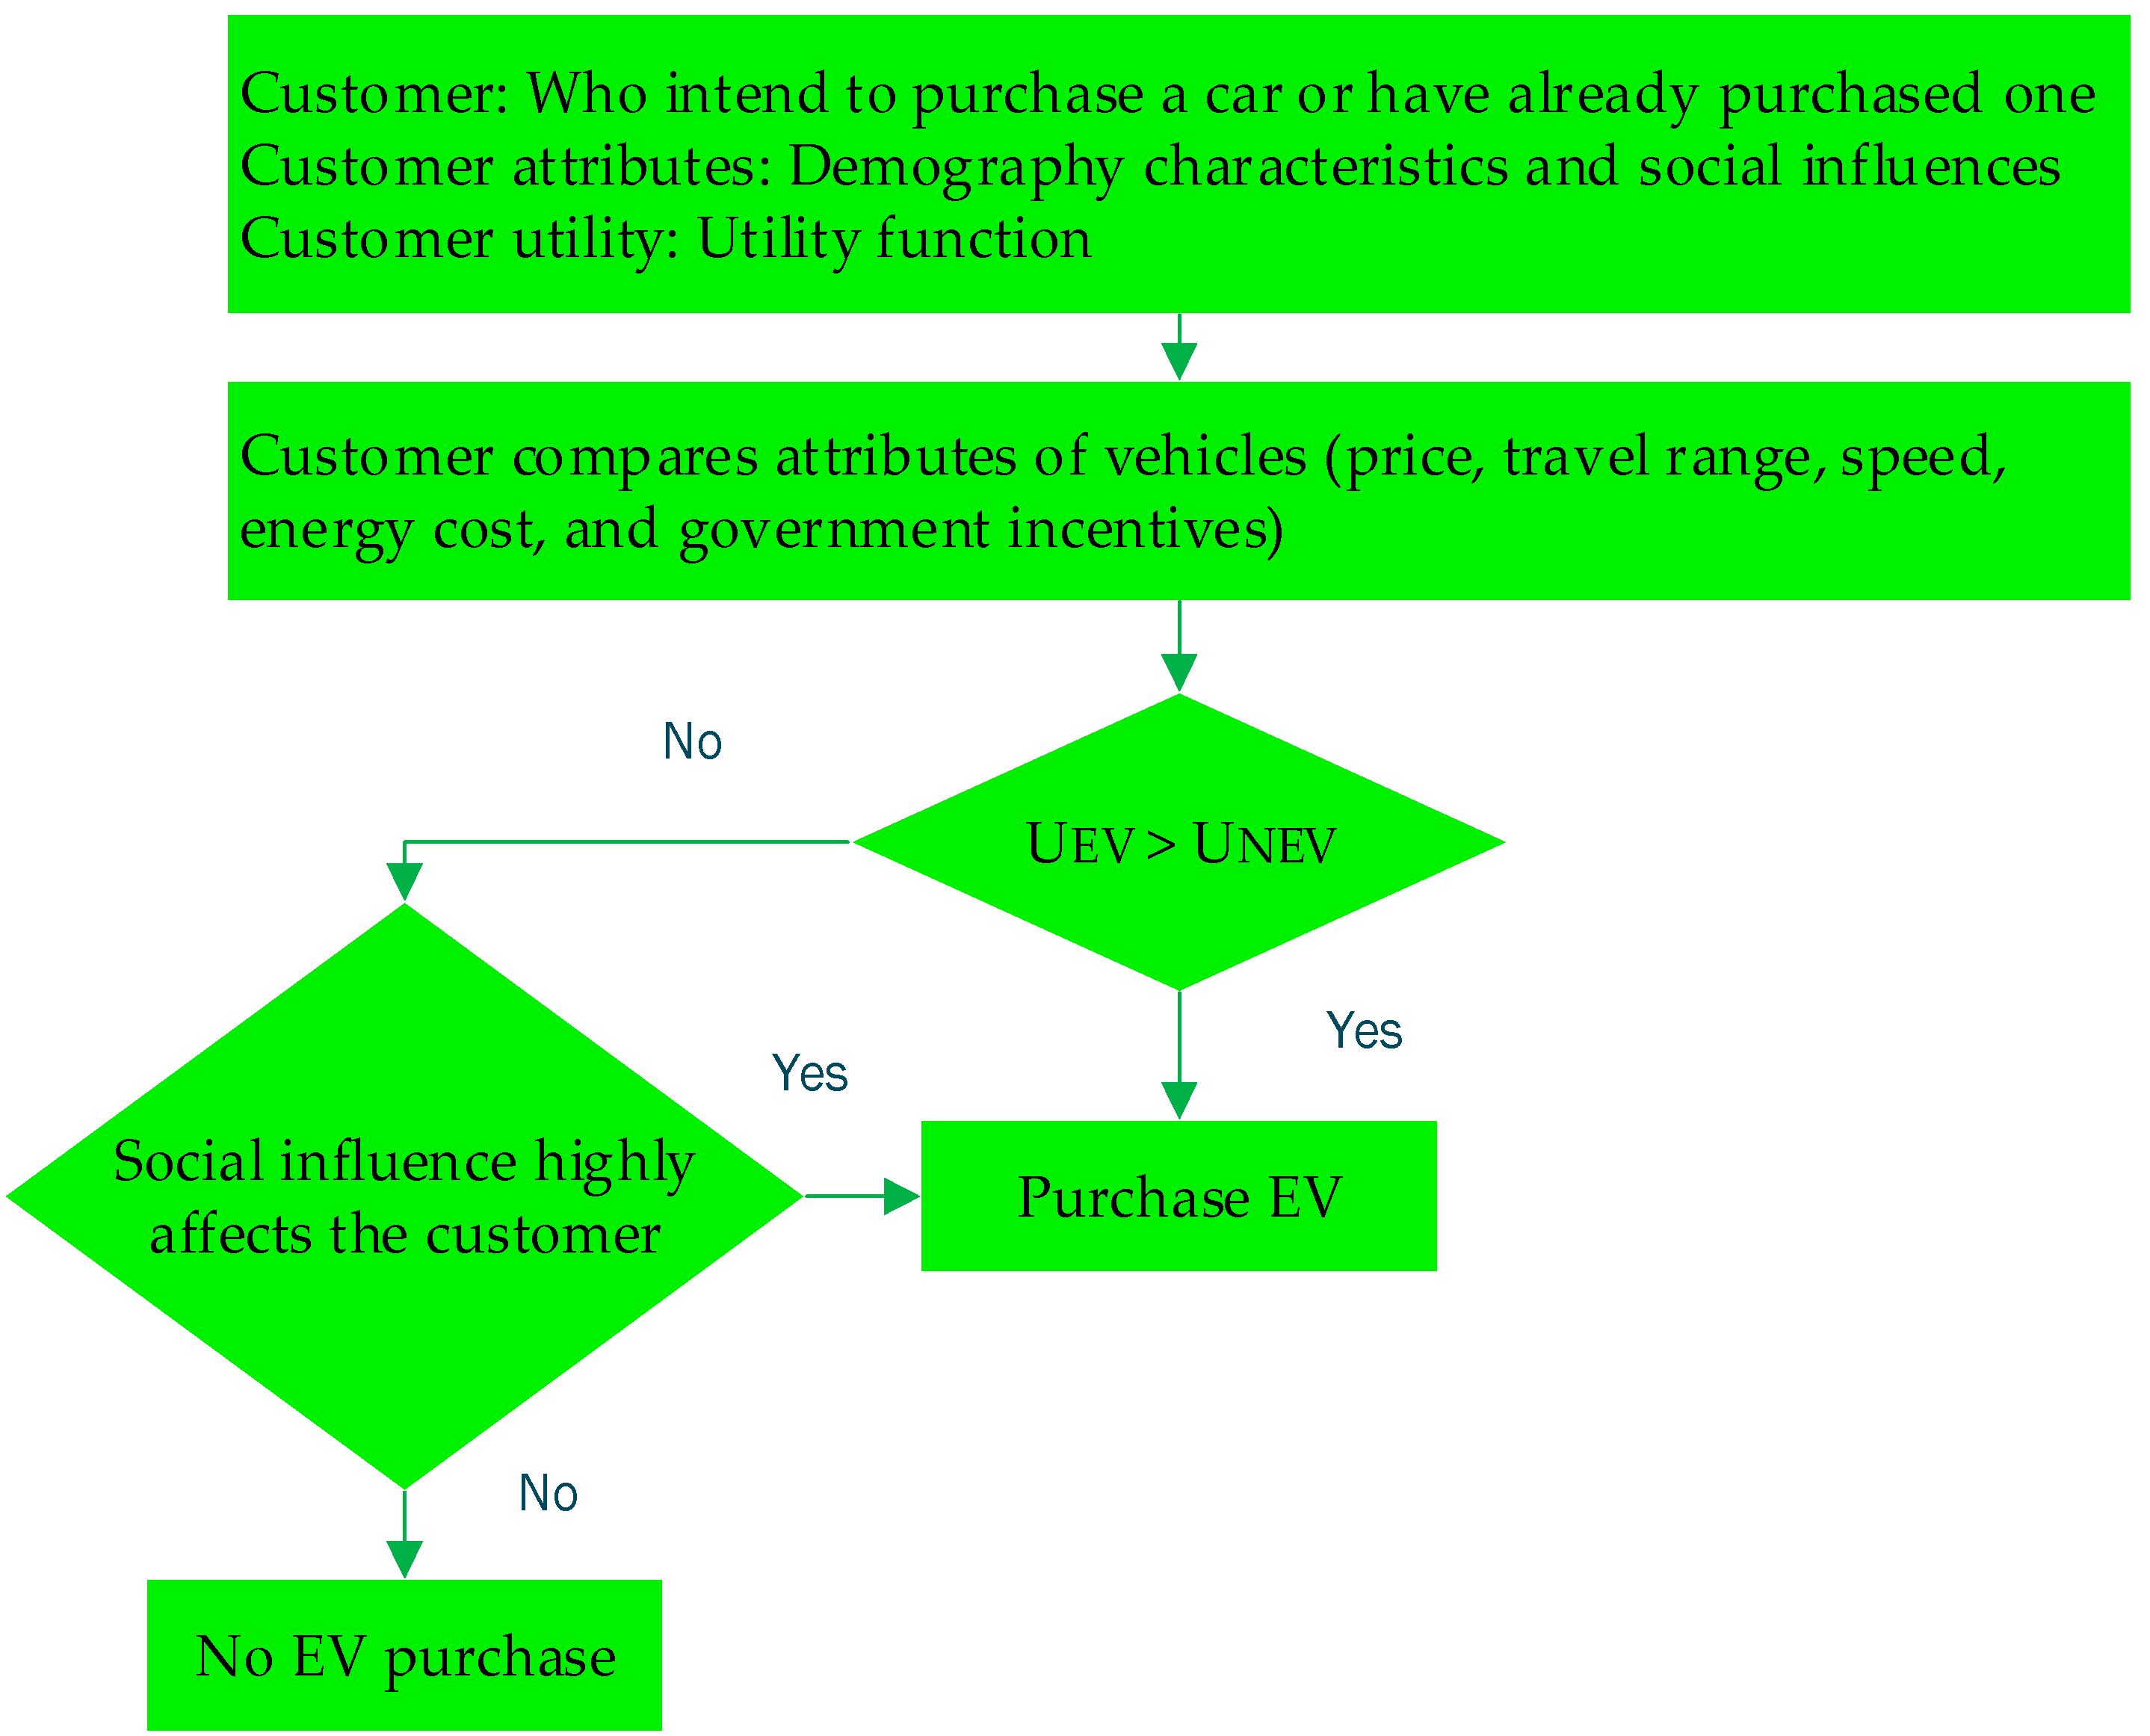
5.1. Vehicle Choice Algorithm
5.2. Social Network
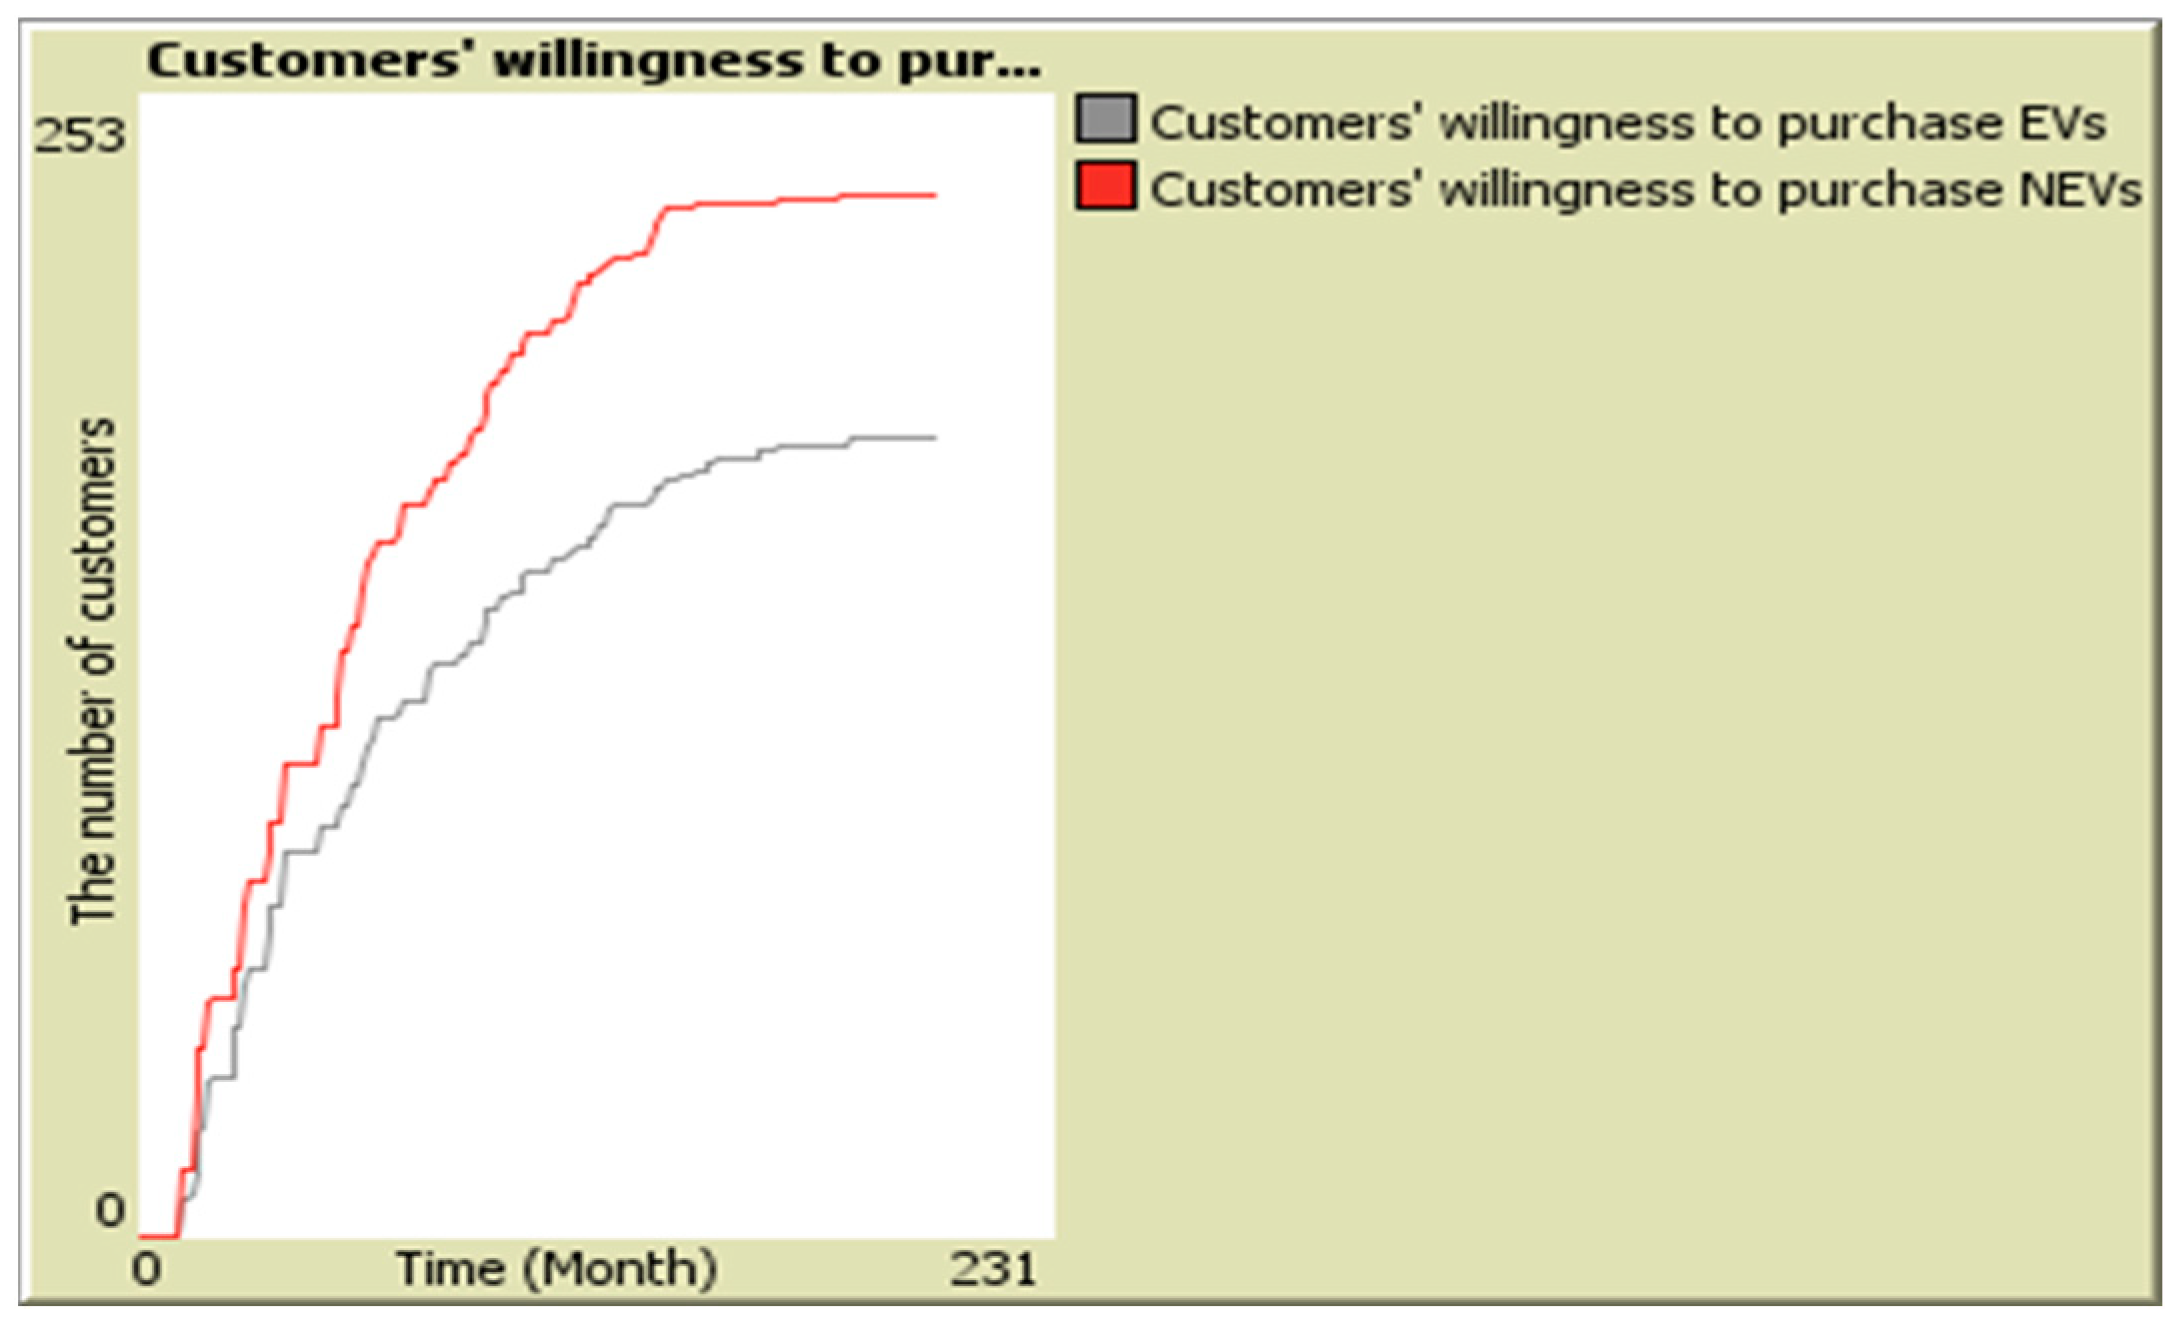
5.3. Simulation
5.4. Model Verification and Validation
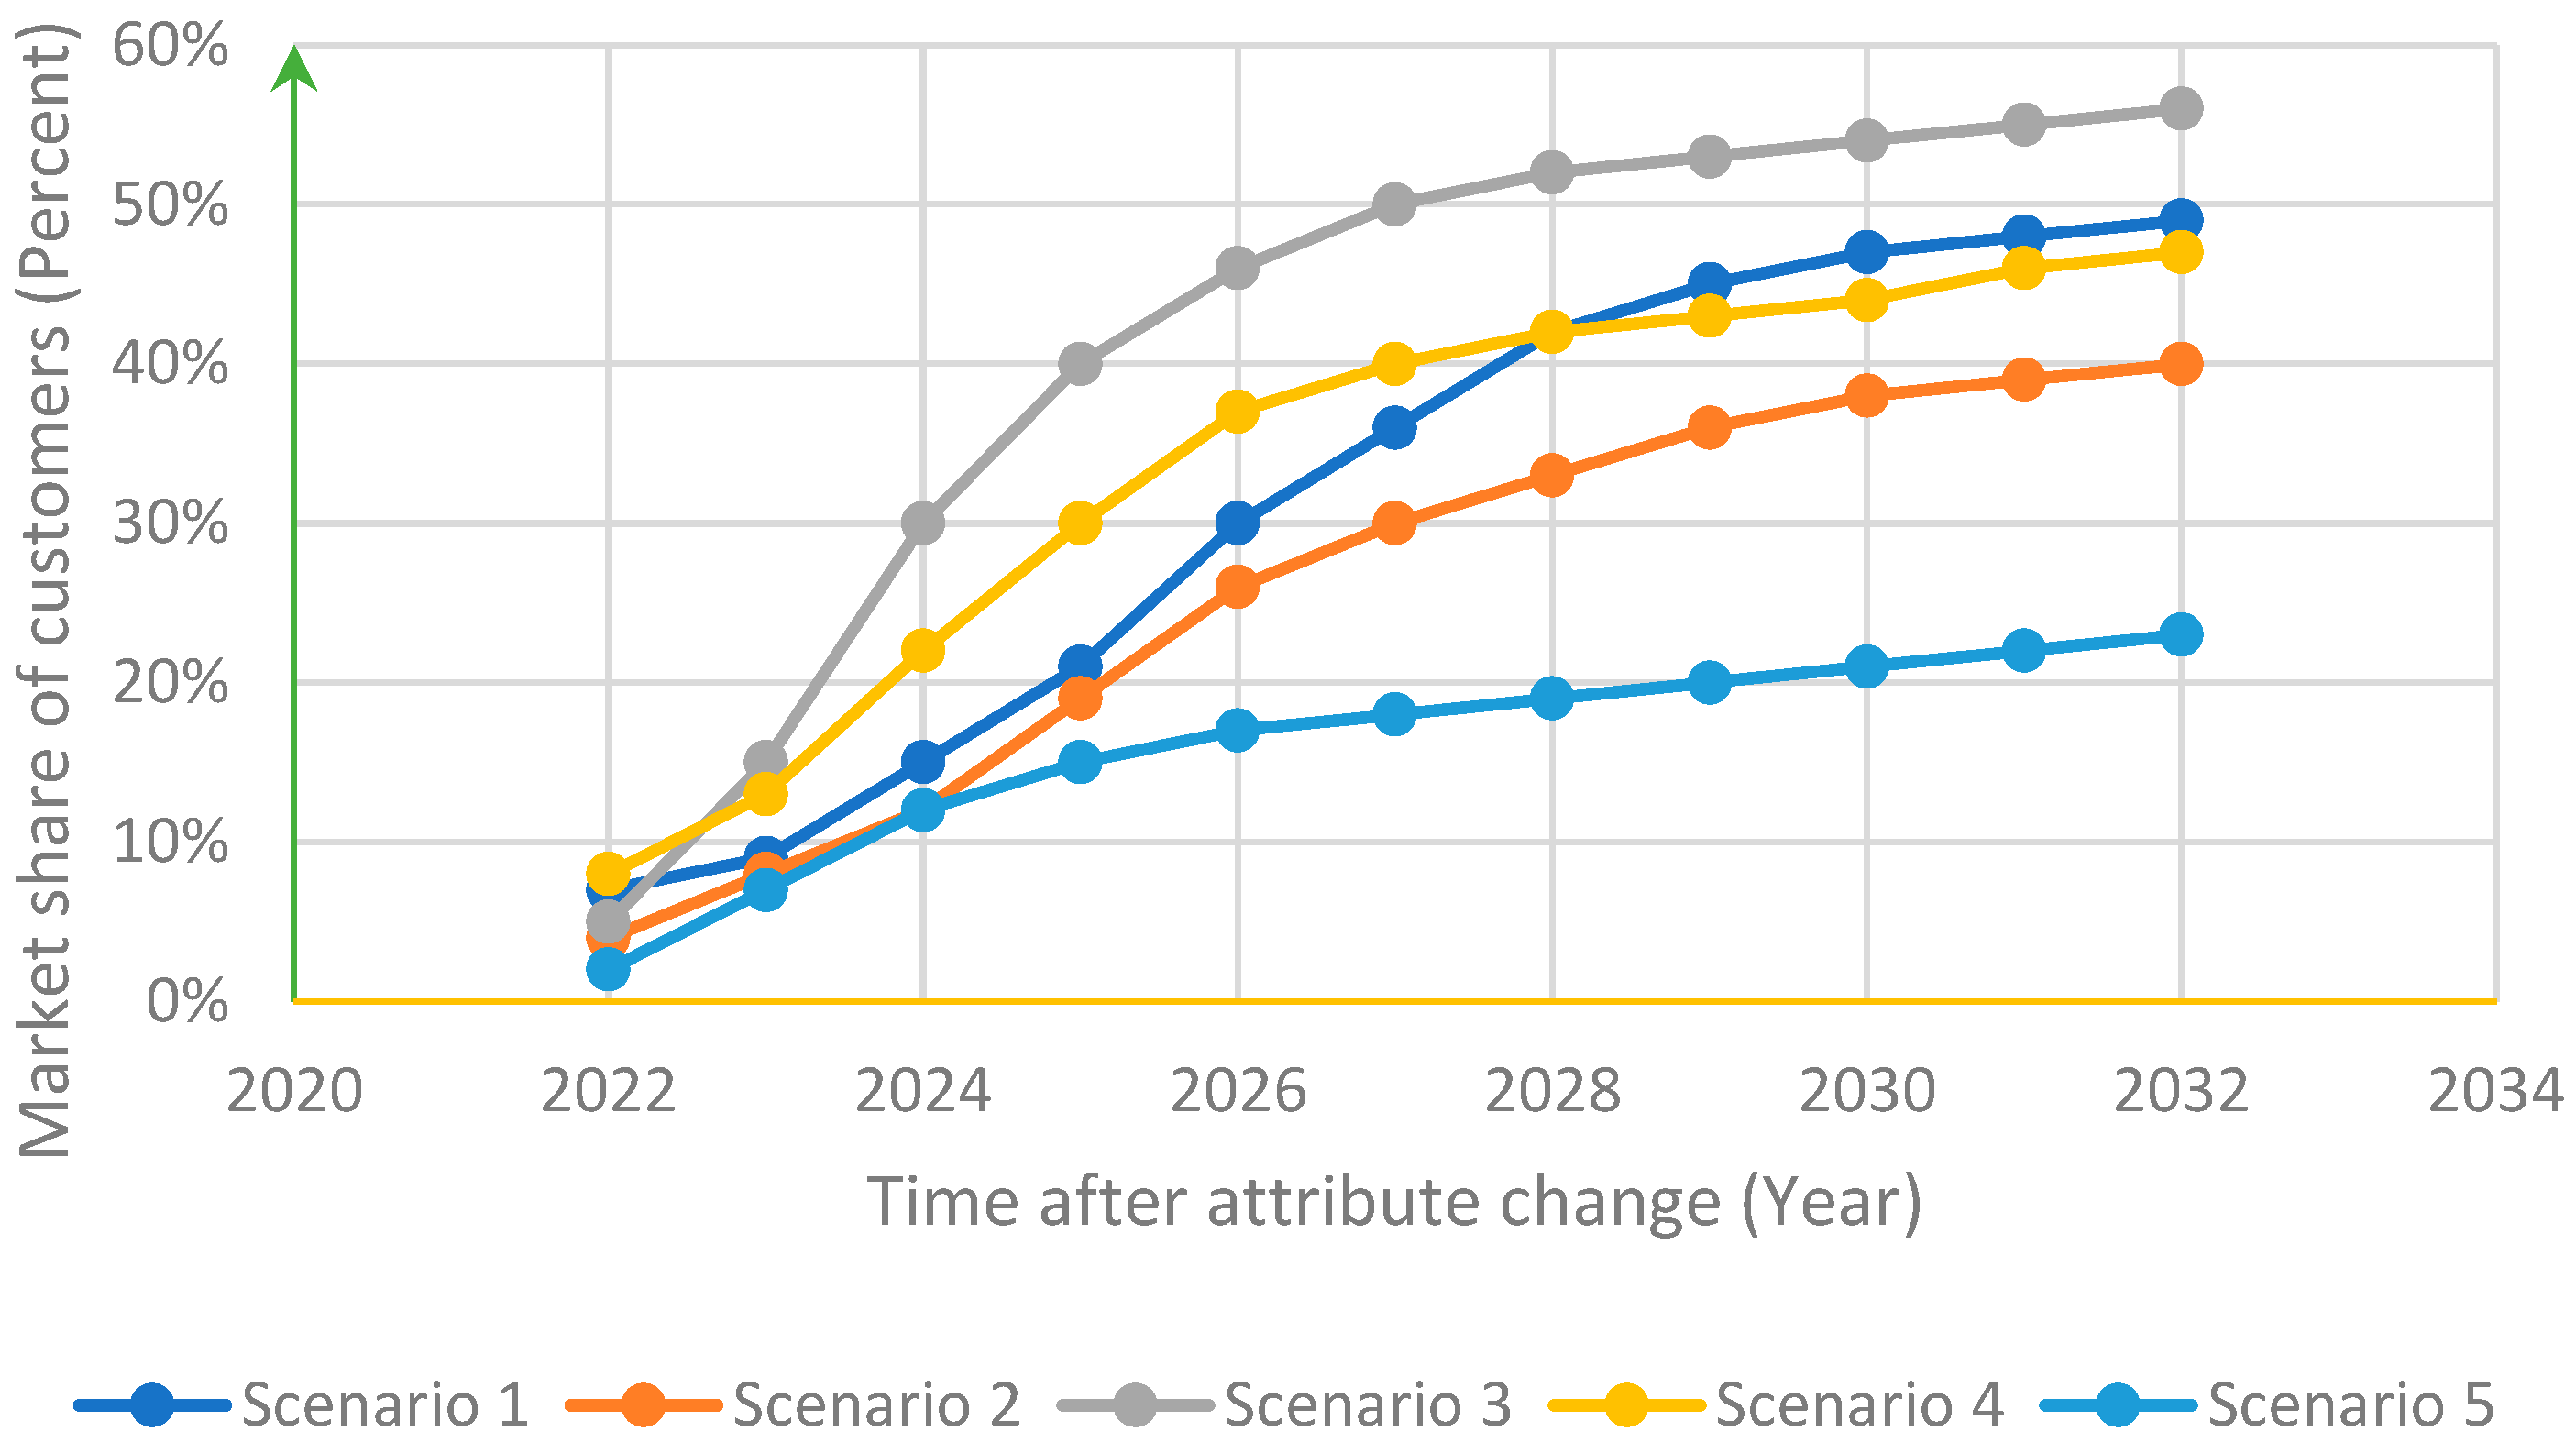
5.5. Scenario Building
5.5.1. Scenario 1: EV Price
5.5.2. Scenario 2: NEVs Energy Costs
5.5.3. Scenario 3: EVs Government Incentives
5.5.4. Scenario 4: EVs Travel Range
5.5.5. Scenario 5: EVs Top Speed
6. Conclusions and Discussion
6.1. Comparative Analysis of the Results
6.2. Research Suggestions
Author Contributions
Funding
Institutional Review Board Statement
Informed Consent Statement
Data Availability Statement
Conflicts of Interest
References
- Giansoldati, M.; Rotaris, L.; Scorrano, M.; Danielis, R. Does electric car knowledge influence car choice? evidence from a hybrid choice model. Res. Transp. Econ. 2020, 80, 100826. [Google Scholar] [CrossRef]
- Heinicke, M.; Wagenhaus, G. Sustainability in the car-based mobility: The case of the electric vehicle Editha. Int. J. Energy Energy Energy Sect. Manag. 2015, 9, 105–119. [Google Scholar] [CrossRef]
- Hu, K.; Wu, J.; Liu, M. Exploring the energy efficiency of electric vehicles with driving behavioral data from a field test and questionnaire. J. Adv. Transp. 2018, 2018, 1–14. [Google Scholar] [CrossRef]
- Cauwer, C.D.; Mierlo, J.V.; Coosemans, T. Energy consumption prediction for electric vehicles based on real-world data. Energies 2015, 8, 8573–8593. [Google Scholar] [CrossRef]
- Jensen, A.F.; Mabit, S.L. The use of electric vehicles: A case study on adding an electric car to a household. Transp. Res. Part A Policy Pract. 2017, 106, 89–99. [Google Scholar] [CrossRef] [Green Version]
- International Energy Agency (IEA). GlobaL EV Outlook. 2019. Available online: https://www.iea.org/reports/global-ev-outlook-2019 (accessed on 1 May 2019).
- IHS Predicts EV Sales Explosion. 2016. Available online: https://www.globalfleet.com/en/safety-environment/global/article/ihs-predicts-ev-sales-explosion?a=THA13&curl=1 (accessed on 12 December 2016).
- TEHRAN TIMES. 2020. Available online: https://www.tehrantimes.com/news/470091/Average-daily-gasoline-consumption-stands-at-86m-liters (accessed on 13 February 2022).
- Sixth Five-Year Development (2016–2021). Available online: https://policy.asiapacificenergy.org/node/3671 (accessed on 10 April 2017).
- Martin, D.M.; Väistö, T. Reducing the attitude-behavior gap in sustainable consumption: A theoretical proposition and the American electric vehicle market. Mark. A Sustain. Soc. (Rev. Mark. Res.) 2016, 13, 193–213. [Google Scholar] [CrossRef]
- Daziano, R.A.; Sarrias, M.; Leard, B. Are customers willing to pay to let cars drive for them? Analyzing response to autonomous vehicles. Transp. Res. Part C Emerg. Technol. 2017, 78, 150–164. [Google Scholar] [CrossRef] [Green Version]
- Quarles, N.; Kockelman, K.M.; Lee, J. America’s fleet evolution in an automated future. Res. Transp. Econo. 2021, 90, 101107. [Google Scholar] [CrossRef]
- Dutta, B.; Hwang, H.-G. Consumers purchase intentions of green electric vehicles: The influence of consumers technological and environmental considerations. Sustainability 2021, 13, 12025. [Google Scholar] [CrossRef]
- Chen, C.F.; Rubans, G.Z.D.; Noel, L.; Kester, J.; Sovacool, B.K. Assessing the socio-demographic, technical, economic, and behavioral factors of Nordic electric vehicle adoption and the influence of vehicle-to-grid preferences. Renew. Sustain. Energy Rev. 2020, 121, 109692. [Google Scholar] [CrossRef]
- Noel, L.; Rubans, G.Z.D.; Sovacool, B.K.; Kester, J. Fear and loathing of electric vehicles: The reactionary rhetoric of range anxiety. Energy Res. Soc. Sci. 2019, 48, 96–107. [Google Scholar] [CrossRef]
- Byun, H.; Shin, J.; Lee, C.Y. Using a discrete choice experiment to predict the penetration possibility of environmentally friendly vehicles. Energy 2017, 144, 312–321. [Google Scholar] [CrossRef]
- Onat, N.C.; Noori, M.; Kucukvar, M.; Zhao, Y.; Tatari, O.; Chester, M. Exploring the suitability of electric vehicles in the United States. Energy 2017, 121, 631–642. [Google Scholar] [CrossRef]
- Noori, M.; Tatari, O. Development of an agent-based model for regional market penetration projections of electric vehicles in the United States. Energy 2015, 96, 215–230. [Google Scholar] [CrossRef]
- Valeri, E.; Danielis, R.; Nassiri, H. Simulating the market penetration of cars with alternative fuel powers technologies in Italy. Transp. Policy 2015, 37, 44–56. [Google Scholar] [CrossRef] [Green Version]
- Hidrue, M.K.; Parsons, G.R.; Kempton, W.; Gardner, M.P. Willingness to pay for electric vehicles and their attributes. Resour. Energy Econ. 2011, 33, 686–705. [Google Scholar] [CrossRef] [Green Version]
- Macal, M.J.; North, C.M. Tutorial on agent-based modeling and simulation. J. Simul. 2010, 4, 151–162. [Google Scholar] [CrossRef]
- Bonabeau, E. Agent-based modeling: Methods and techniques for simulating human systems. Proc. Natl. Acad. Sci. USA 2002, 99 (Suppl. 3), 7280–7287. [Google Scholar] [CrossRef] [Green Version]
- Danielis, R.; Rotaris, L.; Giansoldati, M.; Scorrano, M. Drivers’ preferences for electric cars in Italy. Evidence from a country with limited but growing electric car uptake. Transp. Res. Part A Policy Pract. 2020, 137, 79–94. [Google Scholar] [CrossRef]
- Nie, Y.; Wang, E.; Guo, Q.; Shen, J. Examining Shanghai customer preferences for electric vehicles and their attributes. Sustainability 2018, 10, 2036. [Google Scholar] [CrossRef] [Green Version]
- Buchman, T.; Wolf, P.; Fidaschekrain, S. Stimulating E-Mobility diffusion in Germany (EMOSIM): An agent-based simulation approach. Energies 2021, 14, 656. [Google Scholar] [CrossRef]
- Klein, M.; Lüpke, L.; Günther, M. Home charging and electric vehicle diffusion: Agent-based simulation using choice-based conjoint data. Transp. Res. Part D Transp. Environ. 2020, 88, 102475. [Google Scholar] [CrossRef]
- Brown, M. Catching the PHEVer: Simulating electric vehicle diffusion with an agent-based mixed logit model of vehicle choice. J. Artif. Soc. Soc. Simul. 2013, 16, 1–5. [Google Scholar] [CrossRef]
- Shafiei, E.; Thorkelsson, H.; Ásgeirsson, E.I.; Davidsdottir, B.; Roberto, M.; Stefansson, H. An agent-based modeling approach to predict the evolution of the market share of electric vehicles: A case study from Iceland. Technol. Forecast. Soc. Chang. 2012, 79, 1638–1653. [Google Scholar] [CrossRef]
- Araghi, Y.; Lee, E.P.; Bollinger, A. Informing agent-based models with discrete choice analysis: Diffusion of solar PV in the Netherlands. In Proceedings of Social Simulation Conference, Barcelona, Spain, 1–5 September 2014. [Google Scholar]
- Hörl, S.; Balac, M.; Axhausen, K.W. Pairing discrete mode choice models and agent-based transport simulation with MATSim. In Proceedings of the 98th Annual Meeting of the Transportation Research Board (TRB 2019), Washington, DC, USA, 13–17 January 2019. [Google Scholar] [CrossRef]
- Pira, M.L.; Marcucci, E.; Gatta, V.; Inturri, G.; Ignaccolo, M.; Pluchino, A. Integrating discrete choice models and agent-based models for exante evaluation of stakeholder policy acceptability in urban freight transport. Res. Transp. Econ. 2017, 64, 13–25. [Google Scholar] [CrossRef]
- Bateman, I.J.; Carson, R.; Hanemann, M. Economic Valuation with Stated Preference Techniques: A Manual; Edward Elgar Publishing: Cheltenham, UK, 2004. [Google Scholar] [CrossRef]
- Dia, H. An agent-based approach to modeling driver route choice behavior under the influence of real-time information. Transp. Res. Part C Emerg. Technol. 2002, 10, 331–349. [Google Scholar] [CrossRef] [Green Version]
- Kalyanaram, G.; Winer, R.S. Empirical generalizations from reference price research. Mark. Sci. 1995, 14, 161. [Google Scholar] [CrossRef]
- Kalyanaram, G.; Little, J.D.C. An empirical analysis of latitude of price acceptance in consumer package goods. J. Consum. Res. 1994, 21, 408–418. [Google Scholar] [CrossRef]
- Hensher, D.A.; Rose, J.M.; Greene, W.H. Applied Choice Analysis: A Primer; Cambridge University Press: Cambridge, UK, 2005; ISBN 9781107092648. [Google Scholar]
- EV Database: Compare Electric Vehicles. 2022. Available online: http://ev-database.org (accessed on 10 May 2022).
- Esbensen, K.H.; Guyot, D.; Westad, F.; Houmoller, L.P. Multivariate Data Analysis: In Practice: An Introduction to Multivariate Data Analysis and Experimental Design, 5th ed.; CAMO AS: Oslo, Norway, 2002; ISBN 8299333032. [Google Scholar]
- Statistical Center of Iran. 2022. Available online: http://www.amar.org.ir (accessed on 8 May 2022).
- McFadden, D. Conditional logit analysis of qualitative choice behavior. In Frontiers in Econometrics; Zarembka, P., Ed.; Academic Press: Cambridge, MA, USA, 1974. [Google Scholar]
- Thurstone, L.L. A law of comparative judgment. Psychol. Rev. 1927, 34, 273–286. [Google Scholar] [CrossRef]
- Rezaei, A.; Puckett, S.M.; Nassiri, H. Heterogeneity in preferences of air travel itinerary in a low-frequency market. Transp. Res. Rec. J. Transp. Res. Board 2011, 2214, 10–19. [Google Scholar] [CrossRef]
- Cirillo, C.; Hetrakul, P. Continuous random coefficient logit models: A comparison of parametric and non-parametric methods to estimate individual preferences over cybernetic transportation systems. In Proceedings of the Transportation Research Board 89th Annual Meeting, Washington, DC, USA, 10–14 January 2010. [Google Scholar]
- Train, K. Discrete Choice Methods with Simulation; Cambridge University Press: New York, NY, USA, 2009. [Google Scholar]
- Newman, M.E.J. Communities, modules and large-scale structure in networks. Nat. Phys. 2012, 8, 25–31. [Google Scholar] [CrossRef]
- Barabasi, A.L.; Albert, R. Emergence of scaling in random networks. Science 1999, 286, 509–512. [Google Scholar] [CrossRef] [PubMed] [Green Version]
- Hexmoor, H. Argumentation for collaboration among internet of things. In Proceedings of the International Conference on Collaboration Technologies and Systems (CTS), Orlando, FL, USA, 31 October–4 November 2016. [Google Scholar] [CrossRef]
- Rand, W.; Rust, R.T. Agent-based modeling in marketing: Guidelines for rigor. Intern. J. Res. Mark. 2011, 28, 181–193. [Google Scholar] [CrossRef]
- Nobel Prize Committee; Richard, H. Thaler: Integrating Economics with Psychology; Nobel Prize in Economics Documents 2017-1. Available online: https://ideas.repec.org/p/ris/nobelp/2017_001.html (accessed on 21 March 2015).
- Niroo Research Institute (NRI). Available online: https://www.nri.ac.ir/evc (accessed on 21 March 2015).
- Nykvist, B.; Sprei, F.; Nilsson, M. Assessing the progress toward lower-priced long-range battery electric vehicles. Energy Policy 2019, 124, 144–155. [Google Scholar] [CrossRef]
- Pollák, F.; Vodák, J.; Soviar, J.; Markovič, P.; Lentini, G.; Mazzeschi, V.; Luè, A. Promotion of Electric Mobility in the European Union-Overview of Project PROMETEUS from the Perspective of Cohesion through Synergistic Cooperation on the Example of the Catching-Up Region. Sustainability 2021, 13, 1545. [Google Scholar] [CrossRef]
- Turoń, K.; Kubik, A.; Chen, F. When, What and How to Teach about Electric Mobility? An Innovative Teaching Concept for All Stages of Education. Energies 2021, 14, 6440. [Google Scholar] [CrossRef]
- Eggers, F.; Eggers, F. Where have all the flowers gone? Forecasting green trends in the automobile industry with a choice-based conjoint adoption model. Technol. Forecast. Soc. Chang. 2011, 78, 51–62. [Google Scholar] [CrossRef]
- Kotler, P. Marketing Management: Analysis, Planning, Implementation and Control, 9th ed.; Prentice Hall: Hoboken, NJ, USA, 1997. [Google Scholar]


| Authors | Socio-Economic Variables | Psychological Factors | Spatial Variables | Car-Related Condition | Financial Attributes | Technical Attributes | Infrastructure Attributes | Policy Attributes |
|---|---|---|---|---|---|---|---|---|
| Noel et al. [15] | ✓ | ✓ | ✓ | ✓ | ✓ | |||
| Byun et al. [16] | ✓ | ✓ | ✓ | ✓ | ||||
| Onat et al. [17] | ✓ | ✓ | ✓ | |||||
| Noori and Tatari [18] | ✓ | ✓ | ✓ | ✓ | ✓ | |||
| Valeri et al. [19] | ✓ | ✓ | ✓ | ✓ | ||||
| Hidrue et al. [20] | ✓ | ✓ | ✓ | ✓ | ✓ |
| DCM | ||
| Authors | Models | Results |
| Danielis et al. [23] | Multinominal logit Random parameter logit | Purchase price, fuel economy, driving range, charge time, free parking for EVs, and financial incentives affect the probability of buying EVs. |
| Nie et al. [24] | Multinominal logit Random parameter logit | Consumers preferred EVs with an extended range, a shorter charging time, a faster maximum speed, lower pollution emissions, lower fuel cost, and a lower price. |
| ABM | ||
| Authors | Models | Results |
| Buchman et al. [25] | ABM and set of a business as usual (BAU) scenario | A combined package carbon tax on fuel, charging points, and direct subsidies affects the diffusion of EVs. |
| Klein et al. [26] | ABM simulation using choice-based conjoint data | EVs’ charging time, range, and station density presumably cannibalize plug-in hybrid electric vehicle (PHEV) market shares. A government subsidy can initially promote PHEVs, but EVs will benefit later from that promotional effect. |
| Attributes | Vehicles | Levels | Number of Levels |
|---|---|---|---|
| Travel range (km) | EV (by one full battery) | 315, 365, 450, 385, 565 | 5 |
| NEV (by one full tank fuel) | 585, 780, 795, 750, 1150 | 5 | |
| Refueling duration | EV | 20 min, 40 min, 1 h, 2 h, 4 h | 5 |
| NEV | 10 min, 15 min | 2 | |
| Top speed (km/h) | EV | 135, 150, 160, 180, 250 | 5 |
| NEV | 160, 170, 185, 190, 250 | 5 | |
| Energy cost (US$) | EV (Charge cost per kWh) | 0.02, 0.025, 0.03, 0.04, 0.07 | 5 |
| NEV (Gasoline cost) | 0.15, 0.3, 0.35 | 3 | |
| Government incentives | EV | Loan allocation, Removal of traffic restrictions, Tax removal and urban toll | 3 |
| NEV | No government incentives | 1 | |
| Price (US$) | EV | 8000, 10,000, 12,000, 14,000, 18,000 | 5 |
| NEV | 5000, 7500, 9000, 12,000, 15,000 | 5 |
| Choice Sets | Vehicles | Travel Range | Refueling Duration | Top Speed | Energy Cost | Government Incentives | Price |
|---|---|---|---|---|---|---|---|
| Pair 1 | EV option 1 | 315 | 2 h | 135 | 0.02 | Removal of traffic restrictions | 8000 |
| EV option 2 | 565 | 20 min | 250 | 0.04 | Tax removal and urban toll | 18,000 | |
| NEV | 795 | 10 min | 185 | 0.15 | No government incentives | 9000 | |
| Pair 2 | EV option 1 | 450 | 20 min | 160 | 0.025 | Loan allocation | 12,000 |
| EV option 2 | 455 | 40 min | 180 | 0.025 | Removal of traffic restrictions | 14,000 | |
| NEV | 1150 | 10 min | 250 | 0.35 | No government incentives | 15,000 | |
| Pair 3 | EV option 1 | 455 | 40 min | 180 | 0.07 | Loan allocation | 14,000 |
| EV option 2 | 365 | 4 h | 150 | 0.03 | Loan allocation | 10,000 | |
| NEV | 585 | 5 min | 160 | 0.15 | No government incentives | 5000 | |
| Pair 4 | EV option 1 | 450 | 1 h | 160 | 0.025 | Loan allocation | 12,000 |
| EV option 2 | 565 | 20 min | 250 | 0.07 | Tax removal and urban toll | 18,000 | |
| NEV | 795 | 10 min | 185 | 0.3 | No government incentives | 9000 | |
| Pair 5 | EV option 1 | 455 | 40 min | 180 | 0.02 | Tax removal and urban toll | 14,000 |
| EV option 2 | 565 | 1 h | 250 | 0.07 | Removal of traffic restrictions | 18,000 | |
| NEV | 1150 | 5 min | 250 | 0.35 | No government incentives | 15,000 | |
| Pair 6 | EV option 1 | 450 | 2 h | 160 | 0.03 | Loan allocation | 12,000 |
| EV option 2 | 565 | 40 min | 250 | 0.02 | Tax removal and urban toll | 18,000 | |
| NEV | 780 | 10 min | 170 | 0.15 | No government incentives | 7500 | |
| Pair 7 | EV option 1 | 565 | 20 min | 250 | 0.04 | Removal of traffic restrictions | 18,000 |
| EV option 2 | 455 | 20 min | 180 | 0.03 | Tax removal and urban toll | 14,000 | |
| NEV | 750 | 5 min | 190 | 0.3 | No government incentives | 12,000 | |
| Pair 8 | EV option 1 | 450 | 20 min | 160 | 0.03 | Tax removal and urban toll | 12,000 |
| EV option 2 | 565 | 4 h | 250 | 0.025 | Loan allocation | 18,000 | |
| NEV | 780 | 5 min | 170 | 0.3 | No government incentives | 7500 |
| Attributes | EV Option 1 | EV Option 2 | NEV |
|---|---|---|---|
| Travel range (km) | 315 | 565 | 795 |
| Refueling duration | 2 h | 20 min | 10 min |
| Top speed (km/h) | 135 | 250 | 185 |
| Energy cost (US$) | 0.02 | 0.04 | 0.15 |
| Government incentives | Removal of traffic restrictions | Tax removal and urban toll | No government incentives |
| Price (US$) | 8000 | 18,000 | 9000 |
| The preferred choice between these vehicles is according to the above attributes. | |||
| Statement 1 | I usually recommend the car I buy to others. |
| Statement 2 | I usually talk to my friends a lot about the price and features of the appropriate car. |
| Statement 3 | I listen to people’s advice to buy a car. |
| Statement 4 | I have full knowledge of electric cars. |
| Statements | Weighted Average Score | |
|---|---|---|
| Statement 1 | I usually recommend the car I buy to others. | 4.91 |
| Statement 2 | I usually talk to my friends a lot about the price and features of the appropriate car. | 4.37 |
| Statement 3 | I listen to people’s advice to buy a car. | 3.75 |
| Statement 4 | I have full knowledge of electric cars. | 3.41 |
| Total Average | 4.11 | |
| Attributes | Vehicles | Coefficient | Std. Error | P > |Z| |
|---|---|---|---|---|
| Price | EV | −0.0066 | 0.0049 | 0.000 |
| NEV | −0.0041 | 0.0074 | 0.005 | |
| Travel range | EV | 0.0087 | 0.0094 | 0.000 |
| NEV | 0.0128 | 0.0071 | 0.002 | |
| Top speed | EV | 0.0086 | 0.0039 | 0.007 |
| NEV | 0.0119 | 0.0096 | 0.091 | |
| Government incentives | EV | 0.0251 | 0.0057 | 0.047 |
| NEV | 0.0072 | 0.0037 | 0.000 | |
| Energy cost | EV | −0.0069 | 0.0063 | 0.001 |
| (0.0566) | (0.0031) | |||
| NEV | −0.0059 | 0.0041 | 0.014 | |
| (0.0111) | (0.0045) | |||
| Log simulated likelihood | −5702.135 | |||
| Number of observations | 9024 | |||
| Wald chi2 (2) | 104.77 | |||
| Prob > Chi2 | 0.0000 | |||
| Income Group Attributes | High | Middle | Low |
|---|---|---|---|
| The Mean of Beta Coefficients | |||
| Price | −0.0021 (0.0167) | −0.0077 (0.0619) | −0.0068 (0.0093) |
| Top speed | 0.0013 (0.0095) | 0.0897 (0.0214) | 0.0767 (0.0228) |
| Energy cost | −0.0214 (0.0037) | −0.0041 (0.0071) | −0.0085 (0.0056) |
| Travel range | 0.0916 (0.0271) | 0.0011(0.0012) | 0.0285(0.0108) |
| Government incentives | 0.0671 (0.0813) | 0.01708 (0.0057) | 0.0075 (0.0091) |
| Number of observations | 3960 | 3072 | 1992 |
| Log simulated likelihood | −301.0409 | −231.7124 | −521.9007 |
| Wald chi2 (2) | 2.92 | 12.35 | 37.33 |
| Prob > Chi2 | 0.0000 | 0.0000 | 0.003 |
Publisher’s Note: MDPI stays neutral with regard to jurisdictional claims in published maps and institutional affiliations. |
© 2022 by the authors. Licensee MDPI, Basel, Switzerland. This article is an open access article distributed under the terms and conditions of the Creative Commons Attribution (CC BY) license (https://creativecommons.org/licenses/by/4.0/).
Share and Cite
Allahmoradi, E.; Mirzamohammadi, S.; Bonyadi Naeini, A.; Maleki, A.; Mobayen, S.; Skruch, P. Policy Instruments for the Improvement of Customers’ Willingness to Purchase Electric Vehicles: A Case Study in Iran. Energies 2022, 15, 4269. https://doi.org/10.3390/en15124269
Allahmoradi E, Mirzamohammadi S, Bonyadi Naeini A, Maleki A, Mobayen S, Skruch P. Policy Instruments for the Improvement of Customers’ Willingness to Purchase Electric Vehicles: A Case Study in Iran. Energies. 2022; 15(12):4269. https://doi.org/10.3390/en15124269
Chicago/Turabian StyleAllahmoradi, Elham, Saeed Mirzamohammadi, Ali Bonyadi Naeini, Ali Maleki, Saleh Mobayen, and Paweł Skruch. 2022. "Policy Instruments for the Improvement of Customers’ Willingness to Purchase Electric Vehicles: A Case Study in Iran" Energies 15, no. 12: 4269. https://doi.org/10.3390/en15124269
APA StyleAllahmoradi, E., Mirzamohammadi, S., Bonyadi Naeini, A., Maleki, A., Mobayen, S., & Skruch, P. (2022). Policy Instruments for the Improvement of Customers’ Willingness to Purchase Electric Vehicles: A Case Study in Iran. Energies, 15(12), 4269. https://doi.org/10.3390/en15124269