Article

Assessment of Selected Factors Influencing the Purchase of Electric Vehicles—A Case Study of the Republic of Croatia

Department of Sustainable Mobility and Logistics, University North, Trg dr. Žarka Dolinara, 48000 Koprivnica, Croatia
*
Author to whom correspondence should be addressed.
Energies 2022, 15(16), 5987; https://doi.org/10.3390/en15165987
Submission received: 1 August 2022 / Revised: 11 August 2022 / Accepted: 16 August 2022 / Published: 18 August 2022

Abstract

:
The use of electric vehicles and their adoption have become imperative due to the policies and goals to reduce harmful emissions emitted by fossil fuel vehicles. The adoption and acceptance of electric vehicles by the public may be determined by several factors, such as the price of the vehicles, the environmental and political costs of vehicle production, infrastructure availability, etc. However, given the diverse context of each country, different factors may have a different impact on customer attitudes. According to that fact, the purpose of this research is to identify which factors influence attitudes towards the purchase of electric vehicles in the Republic of Croatia. In order to identify those factors, this paper is based on a survey in which 578 randomly selected respondents took part. The research was conducted between 1 October 2021 and 1 May 2022. The obtained research results were analyzed using linear regression, i.e., moderation analysis. The results indicated that the most significant factors influencing attitudes towards the purchase of electric cars are difficulties in servicing, the cost of battery replacement, lack of charging infrastructure, and the reduced impact on environmental pollution. The basic conclusion of this research is that it is necessary to invest more in the development of infrastructure that supports the use of electric vehicles and in the development of electric vehicles themselves and their characteristics.

1. Introduction

Growing concerns about energy use, environmental pollution, and the impact that greenhouse gases have on climate change are subjects of political and social debate [1]. Fossil fuel vehicles are a special area of focus, since such vehicles emit almost one quarter of the total carbon dioxide (CO2) emissions at the global level. The increase in greenhouse gas emissions has resulted in an increase in global temperature, which affects biological processes, as well as life on earth in general [2]. To prevent a further rise in temperature and reduce emissions of greenhouse gases, it is necessary to reduce the need for fossil fuels, as well as the amount of energy consumed from non-renewable sources. In the context of traffic, this means an increased potential for electric vehicles to reduce the total amount of traffic CO2 emissions [3,4,5]. However, the increase in the use of electric vehicles may result in an increase in the demand for electric charging stations and the consumption of electricity [6,7]. Particularly significant are the peak loads that arise when the charging stations are used more frequently. Peak loads result in additional demands placed on the electric grid that may have a negative impact on other users of electricity [8]. In addition, one of the challenges that arises when discussing the demand for electricity is the mode of production of electricity, because different electricity production technologies produce different emissions of greenhouse gases [9], since the production of electricity forms a significant share of the total CO2 emissions [10]. In other words, for the sustainable usage of electric vehicles, i.e., ensuring the reduction of harmful gas emissions by using electric vehicles, it is necessary to use electricity obtained from renewable sources and to develop and improve existing methods of producing clean electricity, i.e., electricity obtained from sources that do not emit significant amounts of CO2 into the atmosphere [11]. Examples of such sources are wind power plants, solar cells, hydroelectric plants, and energy obtained from biomass [12].
Since the use of electric vehicles is one of the most important goals for achieving sustainability, the adaptation of the existing infrastructure, as well as the construction of additional infrastructure, form the basis for achieving the goal [13]. In addition, the policies defined by the government are crucial in stimulating the use of electric vehicles [14,15,16].
The policy of the government is determined by policies that are defined at the level of the federation or the union, as is the case in the European Union, where recommendations and regulations that are adopted at the level of the European Union influence the governments of the member states in defining the policy of encouraging the use of electric vehicles [17,18]. However, there is an unevenness among policies aimed at the use of electric vehicles at the global level, which is evident from the examples of India and European countries in relation to the USA (United States of America), where there is a clear commitment to vehicle electrification; i.e., in the context of India, there is no clearly defined strategy or vehicle electrification policy [19]. Accordingly, it should be emphasized that the European Parliament made a decision to ban the sale of fossil fuel vehicles from 2035, which means that after 2035, all vehicles on the roads in the European Union must be electric. The decision also states that, by 2030, the total amount of carbon dioxide emitted by cars must be reduced by 50%, and that, by 2030, hybrid vehicles will be considered as vehicles with reduced greenhouse gas emissions. In support of the full implementation of electric vehicles, the decision specifies that a total of 16.3 million charging stations for electric vehicles will be built by 2050, which must not be located more than 100 km from one another.
The acceptance of electric vehicles requires a change in the attitudes of buyers of such vehicles, which can be influenced by the government and policies related to the promotion of electromobility [20]. Apart from the government, the decision to purchase electric vehicles may also be influenced by the cost of owning an electric vehicle, in the context of vehicle maintenance, vehicle charging time, the number of kilometers that can be driven on a single battery charge, the price of electric vehicles, and the availability of electric vehicles [21]. In the same way, some of the variables that may influence purchasing decisions may be mitigated by positive influences on customers through the presentation of the benefits of purchasing an electric vehicle [22].
Since the diversity of cultures, differences in policies, and attitudes of the governments towards the purchase of electric vehicles across countries, as well as the different developmental stages of the countries in the context of the availability of the infrastructure for charging electric vehicles, may influence decision-making about the purchase of electric vehicles, the aim of this research is to identify the attitudes of potential buyers of electric vehicles in the Republic of Croatia, as well as the characteristics of electric vehicles and the policies and infrastructure that may influence the purchasing decisions.
The following hypotheses are outlined in the paper:
Hypothesis 1 (H1).
Policies to encourage electromobility in Croatia have a positive effect on attitudes towards electromobility.
Hypothesis 2 (H2).
Developed infrastructure has a positive effect on attitudes towards the purchase of electric vehicles.
The conducted research is one of the first studies on the attitudes of the citizens of the Republic of Croatia towards the implementation of electric vehicles, which is particularly significant, since the Republic of Croatia is a member of the European Union, which means that the decision to complete the transition towards electric vehicles after 2035 is mandatory for it as well [23].
This research can act as a basis for defining the necessary investments in the development of infrastructure, as well as the design of policies to encourage the purchase of electric vehicles.
The research is divided into a total of six chapters. In Section 1 of the paper, the goals of the paper and research hypothesis are described. Furthermore, Section 1 describes the context of the problem of the implementation of electric vehicles, as well as the differences in attitudes towards the acceptance of electric vehicles.
Section 2 provides an overview of the most important theoretical assumptions, primarily the state of electromobility in Europe and Croatia, as well as existing research that has analyzed factors that influence the implementation of electric vehicles.
Section 3 contains a description of the methodology used to conduct this research: the research model is described; the survey used is described; and a list of questions is given.
Section 4 describes the results of the conducted research. In Section 4.1, the demographic factors of the respondents are described, while in Section 4.2, we outline the conducted analysis using linear regression, which, more precisely, was an analysis of the variables that moderate attitudes about the purchase of electric vehicles.
In Section 5, the obtained results are discussed, while in Section 6, the conclusion of the research, its limitations, and recommendations for future researchers are given.

2. Theoretical Framework

2.1. Electromobility Fundamentals

Electric vehicles are vehicles that use electricity to power their electric motors. Compared to fossil fuel vehicles, electric vehicles emit a significantly lower amount of greenhouse gases during operation, or more precisely, 36% less emitted CO2 [24]. The lower emission of carbon dioxide makes these vehicles more environmentally friendly compared to fossil fuel vehicles, which is why their use has been growing. However, the application of electric vehicles requires changes related to the adaptation of the infrastructure, which implies the construction of a sufficient number of charging stations for electric vehicles, ensuring a sufficient amount of electricity from clean sources, and changes in society’s attitudes towards electric vehicles [25]. Otherwise, the application of electric vehicles will not result in the desired effects in the context of CO2 reduction.
One of the most significant challenges associated with the usage of electric vehicles is battery autonomy and battery charging time [26], since longer journeys may be a challenge, considering that it is necessary to provide a sufficient number of charging stations, as well as enough charging time. In addition, compared to fossil fuel cars, the end of the life cycle of electric vehicles is also a challenge, due to the problems related to the vehicle’s battery recycling [27]. However, in addition to the problem of recycling the batteries, another of the issues that arises is the production of batteries, or, more specifically, ensuring a sufficient amount of resources needed for their production, such as lithium [28], the production of which can cause harmful substances to be release into the environment [29].
When it comes to the production of electric vehicles and production technology, one of the challenges that arises is ensuring sufficient battery capacity [30]. Some progress in battery production technology and increasing battery autonomy [31] has been made, which affects the attractiveness of purchasing electric vehicles. However, the problem of battery autonomy is still pronounced in the context of trucks that are used to transport large quantities of goods, considering that the size of such vehicles and the mass that such vehicles transport are significantly greater compared to electric cars. Accordingly, electric cargo vehicles consume significantly more electricity, which causes the vehicle’s battery to discharge significantly faster [32]. One of the emerging solutions to this challenge is battery replacement stations that enable the quick and easy replacement of electric vehicle batteries, which takes less time compared to battery charging [33].
Given that electric vehicles are relatively new, one of the challenges that arises is the availability of service for such vehicles. An insufficiently developed service network may be one of the challenges that owners of electric vehicles face. The same applies to the availability of replacement parts, as well as the cost of replacement parts. However, regardless of the mentioned challenges, the cost of owning such vehicles, compared to fossil fuel vehicles, is lower in the long term [34,35]. It should be noted that the total cost of owning a vehicle includes the cost of vehicle registration, vehicle maintenance, vehicle charging, the payment of parking tickets, and similar costs. Furthermore, when describing the total cost of owning an electric vehicle, it is necessary to mention the cost of purchasing the vehicle, which is significantly higher compared to fossil fuel vehicles [36]. This challenge can be interpreted through the lens of new technology, as well as the number of manufacturers producing electric vehicles, which is currently relatively small. However, it should also be emphasized that the price of a car can depend on the type, i.e., the specific grade. The prices of city cars that use fossil fuels and city electric cars are almost equal, while the deviation in prices remains for cars belonging to a higher class, i.e., a higher grade [37].
A particularly important aspect that needs to be mentioned when discussing the price, i.e., the value of a car, is the residual value, which is especially important for organizations that own a fleet of electric vehicles. Organizations that own a fleet of electric vehicles often, after a certain period, return such vehicles to the leasing provider and acquire new vehicles; thus, the next question that arises is what the value of such vehicles is after the end of the lease. In this context, the residual value of such vehicles is determined by the equipment the vehicles contain, their age, total kilometers traveled, and similar factors [38]. The more kilometers the electric vehicle has traveled, i.e., the more times the battery of the electric vehicle has been charged, the lower the value of such a vehicle is expected to be.
Furthermore, when discussing energy costs, it is necessary to consider the vehicle load and the driving style of the electric vehicle, since these are some of the parameters that can affect energy costs [39]. However, the cost of charging electric vehicles is currently relatively low, i.e., there are charging stations for electric vehicles that do not charge for charging. Given the future demand for electricity and the cost of producing a sufficient amount of electricity, it can be expected that the cost of the energy required to charge electric vehicles will increase in the future, which will also lead to an increase in the cost of owning an electric vehicle [40].

2.2. Electromobility in Croatia and the European Union

The Republic of Croatia became a full member of the European Union on 1 July 2013, which enabled it to join in programs and funds developed by the European Union in the fields of sustainability and sustainable mobility. The membership of the Republic of Croatia in the European Union also means that the country has the obligation to ensure its compliance with the policies and regulations defined at the level of the European Union, which includes implementing the policies defined by the European Union and the necessity to adapt its legislation. In this context, the European Union emphasizes the need to transition from the use of vehicles powered by fossil fuels to vehicles that use electricity for propulsion [41], the encouragement of cross-border cooperation between the countries of the European Union through the exchange of good practices in developing electromobility [42], as well as the development of projects involving project partners from all countries of the European Union in order to participate in the development of ideas and the implementation of electromobility action plans. Specifically, one of the defined strategies is the Sustainable and Smart Mobility Strategy, through which the European Union set goals that can be divided into three periods: 2030, 2035, and 2050. According to these goals, by 2030, the European Union strives to achieve the goals of a minimum of 30 million zero-emission vehicles on the roads of European Union member states and the development of zero-emission ships. By 2035, the European Union’s goal is to develop zero-emission aircraft, while 2050 is marked as the year in which almost all vehicles on the road are set to be zero-emission [43]. To achieve these goals, it is necessary to ensure the development of technology, but also to develop citizens’ awareness of the importance of the transition from vehicles that use fossil fuels to vehicles that use electricity for propulsion [44]. The European Union develops programs and projects to support the achievement of defined goals, such as the LIFE (L’Instrument Financier pour l’Environnement) program, which aims to ensure a green recovery from the effects of the SARS CoV-2 virus pandemic in 11 European Union countries, including the green traffic transition, i.e., the use of electric vehicles [45]. Furthermore, in the new financial perspective defined by the European Union, which began in 2021 and will last until 2027, 30% of the total available financial resources will be dedicated to the fight against climate change, which also includes part of the financial resources for projects promoting sustainable mobility. In other words, all member states of the European Union can develop projects and submit developed projects for co-financing using the defined budget. The previous financial perspective, which ran from 2014 to 2020, on the other hand, prioritized projects related to the development of sustainability and the primary promotion of sustainable growth and the preservation of natural resources. Some of the examples of projects that emerged from the financial perspective of 2014–2020 are “LOW CARB”, which was a project directed towards the development of sustainable modes of transport in urban areas, and “E-MOB”, which was a project directed towards the encouragement and development of electromobility, in which the Republic of Croatia also actively participated.
In addition to financing projects, the European Union defines a series of directives that encourage the development of electromobility. The directives defined in this way are binding for all member countries of the European Union. Some examples of European directives aimed at encouraging and developing electromobility are:
  • The energy efficiency directive—this directive primarily refers to the reduction of the total amount of energy consumed by 32.5% by 2030. Achieving this goal is possible through the implementation of electric vehicles, as well as encouraging their use in public city transport.
  • The energy performance of the building directive—a directive that requires that, depending on the basic purpose of a building, all newly constructed buildings have developed electric charging stations or parking spaces where electric vehicles can be parked.
  • Electricity market design—a directive aimed at defining the rules for the production of electricity from renewable sources. In other words, 50% of the electricity produced by 2030 must be from renewable sources. In addition, this directive makes it easier for households to produce electricity and transmit it to the electricity grid, which is particularly significant due to the increase in demand for electricity due to the development of electromobility.
As a result, the Republic of Croatia, in its decision on the adoption of a national policy framework for the establishment of infrastructure and the development of the market for alternative fuels in transport, defined the basis for encouraging the development of legislation in the field of electromobility, in which it made a projection regarding the future need for electricity, considering the growth in the number of electric charging stations. Based on this, in 2016, the Law on the Establishment of Infrastructure for Alternative Fuels was adopted, which aims to reduce dependence on oil and mitigate the negative impacts that the use of oil derivatives have on the environment.
In addition, there are several interest-influential groups in the Republic of Croatia that are advocating for the additional development of electromobility, and one of them is the American Chamber of Commerce in Croatia, which, in 2021, offered recommendations for defining the Law on Electromobility and Alternative Fuels, but the recommendation has not yet resulted in the development of the proposed law. However, despite this, when discussing electromobility in the context of the Republic of Croatia and the state of electric vehicles, the government of the Republic of Croatia annually announces a tender for the funding of environmental protection and energy efficiency, in which it provides subsidies for the purchase of electric vehicles. In addition to encouraging customers to purchase electric vehicles through the provision of financial resources, the Republic of Croatia has also begun to construct supporting infrastructure in the form of the construction of charging stations for electric vehicles; that is, it is considering the provision of electricity sources from renewable sources [46]. Despite the incentives for the purchase of electric vehicles, as well as the investment in infrastructure, the Republic of Croatia is still behind the European Union countries in terms of the number of electric vehicles it produces, although there has been a visible shift. On the other hand, the largest number of vehicles that use electric energy for propulsion are in Germany [47]. Furthermore, when it comes to the number of available charging stations, in a special report prepared by the European Union in 2021, it was identified that the Republic of Croatia is one of the countries with the lowest number of available charging stations per 100 km2. Specifically, 586 charging stations were identified, while the largest number of charging stations were identified in Germany (44,464 per 100 km2). Furthermore, if the share of electric vehicles among the total number of passenger vehicles in the European Union is analyzed, the Republic of Croatia has a share of 0.1%, while the largest shares are held by Belgium and the Netherlands. It is evident that electromobility, in the context of the Republic of Croatia and in relation to the European Union, lags significantly behind. The countries that are behind the Republic of Croatia in terms of the degree of their development of electromobility are Lithuania, Latvia, Estonia, and Cyprus, while all other countries are significantly more developed.

2.3. Factors Affecting Attitudes towards the Purchase and Use of Electric Vehicles

The behavior and attitudes of customers may be determined by various factors that can positively or negatively affect their attitudes towards the purchase of electric vehicles. Basically, the factors that may influence attitudes towards the purchase of electric vehicles may be reduced to the technical characteristics of the vehicle [41], the attitudes of the customers themselves regarding electromobility, socio-demographic factors of society, the influence of politics, i.e., the incentives of the state to encourage the purchase of new vehicles, and the influence of others [42].
The technical characteristics of the vehicle primarily refer to the vehicle’s driving autonomy and acceleration, i.e., the performance of the electric motor, as well as the vehicle’s construction in general [43]. Sociodemographic factors include the habits of electric vehicle users from the perspective of the user’s income, including the customer’s age, education, potential to use a vehicle, the number of children in the family, etc. [44]. State incentives refer to funds and the possibility of co-financing the purchase of electric vehicles by the state, while the influence of others in society refers to the possibility that the people with whom the buyer interacts may influence a change in their attitudes; that is, they can influence the decision to buy an electric vehicle.
Factors that can influence attitudes related to the purchase of electric vehicles may be determined by culture itself, i.e., society. The environment and the attitudes of society can significantly influence the behavior of individuals in that society, and the attitudes of society can, on the other hand, be determined by factors such as state incentives. In other words, emphasizing the importance of ensuring sustainability, as well as promoting the use of alternative fuel vehicles, may act as a trigger that could influence a change in attitudes towards electric vehicles and ultimately influence the decision to purchase an electric vehicle [45]. In addition to the described factors, factors that may also influence the development of electromobility, i.e., the purchase of electric vehicles, can be divided into global factors and local factors. Global factors refer to the economic state, technology, politics, society, and the environment, while local factors can be categorized into the technical innovation of the vehicle itself, the daily usage time of the vehicle, electric vehicle manufacturers, the energy economy, and characteristics of the market itself [46]. If the described factors are compared, it is evident that they do not differ significantly and that they basically come down to economic incentives defined by the government. In addition to economic incentives, one of the particularly significant factors that may influence attitudes related to purchases are socio-demographic factors and, above all, the culture that prevails in the buyer’s environment.
Furthermore, the research conducted by [47] analyzes how attitudes towards electric vehicles are influenced by Hofstede’s six dimensions of national culture, which are used to analyze the diversity of modern cultures and how the diversity of modern cultures affects society and social phenomena. The research results indicated that uncertainty avoidance, individualism, masculinity, and indulgence have a negative impact on the purchase of electric vehicles. It should be emphasized that Hofstede’s six dimensions of national culture can be counted among the local factors that can determine the purchase of electric vehicles. However, one of the particularly significant factors, classified among the local factors that can influence the decision to purchase electric vehicles, are incentives, i.e., incentive policies defined by states, as well as the cost of owning a vehicle that may be determined by the costs imposed by the state. Most importantly, in the research carried out by [48], it was identified that one of the fundamental incentives for buying electric vehicles is the economic benefit, i.e., the savings that electric vehicle buyers can achieve due to the lower cost of owning electric vehicles.
It should be emphasized that, apart from private buyers, the implementation of electric vehicles is common in public city transport, and that the implementation of vehicles in public city transport may first depend on the decisions made at the city level. Such decisions may be a consequence of the development of incentives for the implementation of electric vehicles in public urban transport that are defined by the state, i.e., the European Union, which is particularly apparent from the promotion of the development of sustainable cities and the implementation of sustainable technologies within such cities [49].
However, in addition to the factors that encourage the purchase of electric vehicles, there are also factors that can influence the reduction of interests in purchasing. Such factors are primarily determined by the technical limitations of electric vehicles, namely the technology used to produce the batteries in electric vehicles, as well as their autonomy [50]. In addition, one of the factors that can influence the decrease in interests in purchasing electric vehicles is the lack of infrastructure for charging electric vehicles, as well as the long charging time of the batteries [51].
The adoption of, and attitudes of potential customers towards, electric vehicles may be determined and shaped by governmental policy towards electromobility, which is especially important in the context of the European Union, since the European Union encourages the development of electromobility through directives aiming towards the development of electromobility [52].
By raising awareness about climate change and the necessity of a transition from vehicles powered by fossil fuels to vehicles that use electric energy for propulsion, and through the development of the technology used in electric vehicles, it is possible to influence a change in attitudes related to the purchase and use of electric vehicles. It is particularly important to emphasize the role of the government—that is, the legislator—in encouraging electromobility through the development of policies and incentives aimed at co-financing the purchase of electric vehicles.

3. Materials and Methods

3.1. Conceptual Assumptions

The main reason for conducting this research is the lack of research, in the context of the Republic of Croatia, on the factors that influence decision-making regarding the purchase of electric vehicles. This research is focused on the analysis of the demographic factors that influence the formation of attitudes towards the purchase of electric vehicles; the influence government policies on the formation of attitudes towards the purchase of electric vehicles; and the analysis of the characteristics of electric vehicles that have an impact on the formation of attitudes towards the purchase of electric vehicles. With this in mind, the following research questions were defined:
  • What demographic factors have the greatest influence on people’s attitudes toward buying electric vehicles?
  • How do existing policies related to the promotion of electromobility affect attitudes towards the purchase of electric vehicles?
  • What aspects of electric vehicles influence the development of a favorable attitude toward the purchase of electric vehicles?

3.2. Sampling Method

A total of 578 respondents participated in the research. The research was conducted through an online questionnaire, and participation in the research was voluntary and anonymous. All respondents in the research were older than eighteen years. The research was conducted during the period from 1 October 2021 until 1 May 2022. The questionnaire was sent to a total of 1500 addresses based on random selection. It should be emphasized that, out of the total number of respondents, only 3% of respondents did not own a car, while the number of male and female respondents was equal, as described in Section 4.1. Furthermore, when conducting the research, special attention was paid to the geographically even distribution of the respondents, which is also described in Section 4.1. In light of this, this sample can be considered representative and can be used to answer the research questions.

3.3. Description of the Tools

This research was based on interviewing via the internet, which involves asking respondents questions in a precisely defined order, for which Google Forms were used. The use of this method opens the possibility of the automatic filling or incomplete filling of the survey, which is why an analysis of the collected answers was carried out, and all answers that were incomplete or whose solution time was less than two minutes were not considered. Furthermore, the International Business Machines (IBM) SPSS Statistics program for statistical processing, version 22.0, New York, NY, USA, was used to process the data obtained from the research.

3.4. Research Scheme

The research methodology is shown in the flowchart in Figure 1. The research started with an analysis of the existing research on the attitudes of buyers of electric vehicles, after which the survey questionnaire was created. Table 1, Table 2 and Table 3 show a table listing the papers that were considered when creating the survey conducted in this research.
The survey questions are based on a Likert scale ranging from 1 to 5, where 1 is the least agreement with the defined statement, while 5 is the greatest agreement with the defined statement.
The questions included in the survey questionnaire are shown in Table 1, Table 2 and Table 3.
After the creation of the defined questions and the defined survey described in Section 3.5, the research model shown in Figure 2 was defined. This model was based on conducting a regression analysis, i.e., an analysis of the moderator variables. A moderator variable moderates the relationship between the independent and dependent variables, i.e., it analyzes whether the influence of the independent variable on the dependent variable is greater if the moderator variable is applied. In other words, the moderator variable can positively or negatively affect the dependent variable that is under the influence of the independent variable [54].
The advantages of performing a moderation analysis are the ease of understanding the obtained results, as well as the possibility of accurately predicting the outcome. However, the fundamental disadvantage of using regression analysis is the insufficient reliability of the obtained results if part of the data are missing [54], which is why the collected data were refined and incomplete data were excluded. Out of the total number of responses collected (578), 22 responses were excluded due to incompleteness or a completion time of less than two minutes.
The research model is shown in Figure 2. Moderator variable (b) is a variable that influences the independent variable (a), i.e., existing attitudes toward electric vehicles, resulting in a shift in independent variable (ab), i.e., attitudes toward purchasing an electric vehicle. Furthermore, the labels shown in Figure 2, (a), (b), and (ab), refer to the regression coefficient. More precisely, (b) refers to the regression coefficient that the moderator variable has on the attitudes towards electric vehicles; the symbol (ab) refers to the regression coefficient that indicates a change in the respondents’ attitudes towards the purchase of electric vehicles; and the symbol (a) refers to the regression coefficient that indicates current attitudes towards electric vehicles.
The relationship between the variables shown in Figure 2 can be interpreted as a cause-and-effect relationship, where the cause is the moderator variable and the consequence is the attitudes towards purchasing electric vehicles. If the label (ab) = 0, then the moderator variable has no influence on the attitudes towards electric vehicles. On the other hand, if the variable (ab) = 1, then the moderator variable has a great influence on the attitudes towards the purchase of electric vehicles. It should be emphasized that the designation (ab) in Tables 7, 9, 11, 13, 15, 17, 19 and 21 is described by the designation B.
The conducted moderation analysis is based on expression (1), where β 0 represents the influence of the independent variable, β x 1 is the moderator variable and its interaction with the independent variable, B is the strength of the influence of the moderator variable, and e represents the standard deviation:
B = β 0 + β x 1 + e
Furthermore, when analyzing the moderator variable, it is necessary to draw attention to the coefficient of determination R2, which indicates the strength of the relationship between the variables. The closer the coefficient of determination is to 1, the greater the possibility of prediction is. In other words, R2 indicates the possibility of predicting the dependent variable using the moderator variable.
For example, a coefficient of determination of 0.3 indicates that the moderator variable can predict 30% of the dependent variable. To calculate the coefficient of determination, expression (2) was used, in which RSS is the sum of the squares of residuals, and TSS is the total sum of squares:
R 2 = 1 R S S T S S
In addition to the R2 indicator, an Adjusted R2 better describes the influence of the moderator variable on the independent variable. The closer the adjusted R2 is to 1, the greater the influence that the moderator variable has on the independent variable. To calculate the coefficient of determination, expression (3) was used, in which R2 is the coefficient of determination, and N is the total sample size, and p is the number of independent variables:
A d j u s t e d   R 2 = 1 1 R 2 N 1 N p 1
Furthermore, the t-test was used to identify whether the attitude towards the purchase of electric vehicles is determined solely by the moderator variable, or if there is another variable that has an influence on the formation of this attitude. The smaller the value of the t-test, i.e., the closer it was to zero, the more we could conclude that the attitude towards electric vehicles was determined only by the moderator variable. The higher the value of the t-test, the smaller the influence of the moderator variable. To calculate the t-test, expression (4) was used, where t is the obtained value of the conducted t-test, x ¯ is the mean of the sample, μ is the assumed mean, σ 2 is the standard deviation, and n is the number of observations:
t = x ¯ + μ σ 2 n
In addition to the t-test, which was used to analyze the influence of each variable individually, the F-test was used when examining the model fit to analyze the existence of significant differences between the influences of the independent variables on the dependent variables. This must interpreted based on the p value, that is, the significance. If the result is significant, then F indicates the rejection of the null hypothesis, that is, confirmation that there is an influence of the moderator variable on the dependent variable. To calculate the F-test, expression (5) was used, where the label   σ 1 2 is the variance of the larger sample and σ 2 2 is the variance of the smaller sample.
F = σ 1 2 σ 2 2
Cronbach’s alpha test a was used to analyze the reliability of the data, that is, the consistency of the answers. In other words, Cronbach’s alpha test was used to analyze the validity of the applied measurement scales. Expression (6) was used for the calculation, where N is the number of data in the series, v ¯ is the average covariance between paired items, and c ¯ is the average variance.
The closer Cronbach’s alpha is to 1, the higher the reliability, and vice versa:
a = N × c ¯ v ¯ + N 1 × c ¯
The standard deviation s was used to analyze the dispersion of the data in the observed series. A higher standard deviation indicates a greater dispersion of the data compared to the arithmetic mean.
Expression (7) was used to calculate the standard deviation, where x ¯ i is mean of all values in the data set, x i refers to each value in the data set, and n is the number of values in the data set.
s = x i x ¯ i n 1
The performed analysis was divided into two parts. In the first part, the influence of the variables that showed the greatest influence on the moderator variables was analyzed, after which the influence of the moderator variables on the attitudes towards the purchase of electric vehicles was analyzed, which represents the second part of the research.

3.5. Survey Development

Regarding the questions asked in the questionnaire, Table 1 shows the first part of the questions with the assigned GD marks (general data, GD1 to GD9). These questions were aimed at analyzing the attitudes of potential buyers of electric vehicles towards global warming, i.e., concerns about environmental pollution, the age of the respondents, income, sex of respondents, education of respondents, etc.
Table 2 shows the questions of the second part of the questionnaire, in which the characteristics of electric vehicles (CEV) are defined. In this part of the questionnaire, respondents were asked to choose their level of agreement with certain statements in the context of the influences that the defined characteristics of the vehicle have on the attitudes towards purchase.
In the third part of the questionnaire, respondents were asked the questions shown in Table 3. The questions were aimed at analyzing the impact of government policies (POL) and how much respondents agreed that policy has a positive or negative effect on creating attitudes, i.e., the consideration of buying an electric vehicle.
In addition to the variables described in Table 1, Table 2 and Table 3, respondents were asked about their current attitudes about whether they would buy an electric vehicle, what their current opinion is about electric vehicles, and what their current opinion is about the policies defined by the government, which are shown in Table 4. Abbreviations in Table 4 are as follows: moderation variables (MOD); and buying an electric vehicle (BEV).

4. Results

4.1. Demographic Analysis

Out of the total number of respondents, 255 (46%) respondents are male, while 301 (56%) respondents are female. Regarding the age of the respondents, a total of 136 respondents aged 18 to 25 participated in the research, which represents a share of 24% of the respondents; 238 respondents were aged 25 to 35, which represents a share of 42% of the respondents; 72 respondents were aged from 35 to 45 years old, which represents a share of 12.9%; 53 respondents were aged 45 to 55 years old, which represents a share of 9.5%; and 55 respondents were older than 55 years, which represents a share of 9.8%. Furthermore, regarding the habits of the respondents, out of the total number of respondents, 438 (78%) of them used a private car for transportation, while 43 (7%) of the respondents used only a bicycle for transportation, and 27 (4.8%) used only public transportation. It should also be noted that 45 respondents (8%) did not use any form of transport, i.e., they walked to their destination.
On the other hand, when the respondents’ education was considered, out of the total number of respondents, 3 (0.5%) had completed only primary school, 198 (37.5%) respondents had completed only secondary school, 161 (28%) respondents had completed undergraduate studies, 135 (24%) respondents had completed graduate studies, and 28 (5%) respondents had completed doctoral studies; that is, 30 (5%) respondents had completed specialist studies.
Examining the number of cars that respondents owned in their households, out of the total number of respondents, 14 (3%) did not own a car; 169 respondents (30%) owned only one car; 189 respondents (34%) owned two cars; 129 respondents (23%) owned three cars; and 54 respondents (10%) owned more than three cars. Examining the type of car in the context of buying a new or used car, 154 respondents (27%) bought their current car as new, while 352 respondents (63%) bought their current car as used.
To identify the state of current knowledge about electric vehicles, the respondents’ familiarity with electric vehicles was also analyzed. It was identified that, out of the total number of respondents, 115 (21%) respondents were not familiar with electric vehicles; 82 (15%) respondents were partially familiar with electric vehicles; 161 (29%) respondents were well acquainted with electric vehicles; and 197 (36%) respondents were extremely familiar with electric vehicles.
Furthermore, it is necessary to emphasize the demographic distribution. Of the respondents, 27% of the respondents lived in the area of Adriatic Croatia, while 73% of the research population lived in the area of continental Croatia, which is in accordance with the actual distribution of the population of the Republic of Croatia (the total number of inhabitants in Adriatic Croatia is 32%, while 68% of the population lives in continental Croatia).
It should be highlighted that, for the data presented in the tables, the mark * indicates a level of significance of p < 0.05, while the mark ** indicates a level of significance of p < 0.01.

4.2. Moderation Analysis

Before the moderator analysis, the reliability analysis of the obtained answers was performed using the Cronbach alpha test. The results of the conducted analysis are shown in Table 5 and indicate that Cronbach’s alpha was a = 0.835 (a > 0.7, which represents a reference value when analyzing the reliability of the results [55]), which indicates the reliability of the collected answers and their consistency.
Table 6 shows the results of the model fit analysis analyzing the impact of the general data on attitudes towards electric vehicles. In other words, the first part of the research was related to identifying the influences of the variables shown in Table 1 on the MOD1 variable shown in Table 4.
The coefficient of determination for the model is 0.223; thus, it can be interpreted that the model explains 22.3% of the variance of the moderator variable. The significance of the model, p = 0.000 (p < 0.01 (5)) F = 4.719, means that the obtained results are significant and can be considered when forming conclusions, and that there is an influence of the demographic data on the MOD1 variable.
In Table 7, the obtained results regarding the influence that each GD variable has on the MOD1 variable are presented in more detail.
According to the findings, GD1 has a significant influence (p = 0.021 (0.05); t = 2.320), but in a negative context, i.e., as the respondent’s age increases, so does their negative attitude toward electric vehicles (B = −0.138). In other words, respondents from the age of 30 to the age of 45 showed greater intentions towards purchasing electric vehicles compared to older respondents. Furthermore, it was identified that GD2 also has a significant influence (p = 0.02 (<0.05); t = 3.064) and that the gender of the respondents could influence different attitudes towards electric vehicles negatively (B = −0.319). GD3 is not significant (p = 0.163 (<0.05); t =−1.398; B = −0.033), which can be interpreted through the different shopping habits of the respondents; that is, using excess money for purposes other than buying electric vehicles, such as investing and saving.
On the other hand, GD4 (p = 0.041 (<0.05); t = 1.998; B = 0.070), i.e., the mode of transport used by the respondents, positively affects the attitude towards electric vehicles, which can be interpreted in light of the fact that that the largest proportion of respondents used private cars as their dominant mode of transport.
GD5 has a positive effect on the attitude towards electric vehicles, and with the increase in education came a more positive attitude towards electric vehicles (p = 0.003 (<0.01); t = 3.034; B = 0.153). GD6 is not significant (p = 0.807 (<0.05); t = −0.244; B = −0.021), which means that, regardless of political orientation, there was a positive attitude towards the purchase of electric vehicles.
Of the other variables, it is necessary to mention GD7 (p = 0.048 (<0.05); t = 1.989; B = 0.123), which is significant and positively affects the creation of attitudes towards electric vehicles. In other words, the respondents’ concerns regarding climate change had an impact on creating positive attitudes towards the purchase of an electric vehicle. GD8 is not significant (p = 0.192 (<0.05); t =−1.305; B = −0.073), which means that respondents who were not employed did not consider buying electric vehicles.
The last significant variable is GD9 (p = 0.000 (<0.01); t = 10.978; B = 0.402), from which it can be said that respondents who wanted to own new technology had a more positive attitude towards electric vehicles.
Table 8 shows the model fit for analyzing the impact of public policies on the MOD3 variable. The coefficient of determination for the model is 0.265; i.e., the model covers 26.5% of the variance of the variable moderator. The significance of the model is p = 0.000 (p < 0.01 (5) F = 39.715). The obtained results are significant, meaning that public policies had an impact on the formation of attitudes towards the purchase of electric vehicles.
Table 9 shows the results of the analysis of the influences of the POL variables on attitudes towards electric vehicles. Based on the analysis, it was identified that POL1 has the greatest influence on the creation of a positive attitude towards electric vehicles (p = 0.000 (<0.01); B = 0.539; t = 13.546), which means that encouraging the purchase of electric vehicles through the provision of co-financing had an impact on the formation of a positive attitude towards the purchase of electric vehicles.
Furthermore, respondents believed that existing public policies (POL2) do not sufficiently influence the development of infrastructure (p = 0.579; t = 0.556, B = 0.025), i.e., that there is a lack of infrastructure for electric vehicles. Based on this, it can be concluded that the existing infrastructure does not support the creation of positive attitudes towards the purchase of electric vehicles.
Furthermore, respondents believed that the existing policies aimed at environmental protection (POL3) are not sufficient and do not have a sufficient impact in emphasizing the importance of electric vehicles (p = 0.279; t = 1.083; B = 0.049). In this context, it can be concluded that existing environmental protection policies have no influence on the formation of attitudes towards the purchase of electric vehicles.
On the other hand, the variable that has a negative impact on the development of attitudes towards electric vehicles is POL4 (p = 0.048 (<0.05); B = −0.111; t = 1.989), which means that respondents believed that existing policies aimed at the construction of charging stations for electric vehicles are not sufficient.
Respondents believed that promoting electric vehicle use in the public (POL5) will not result in the formation of positive attitudes toward the purchase of electric vehicles (p = 0.997; t =0.004; B = 0.000).
Table 10 shows the model fit of the analysis of the characteristics of electric vehicles and the impacts that the characteristics of electric vehicles have on purchase decisions. The coefficient of determination for the model is 0.130; that is, it covers 13% of the variance of the variable moderator. The model is significant since p = 0.000 (p < 0.01 (5)); thus, the obtained results can be considered relevant and significant when drawing conclusions.
Table 11 shows the influences of the CEV variables on the probability of purchasing electric vehicles. In other words, it analyzes which characteristics of electric vehicles have a positive influence on attitudes towards the purchase of electric vehicles.
Based on the obtained results, the respondents believed that CEV1 does not have a significant influence on the formation of attitudes towards the purchase of electric vehicles (p = 0.101; t = 1.645; B = 0.128), while CEV2 has a negative impact (p = 0.021 (<0.05); B = −0.165; t = −2.316). In other words, the high cost of replacing an electric vehicle battery negatively affected attitudes towards electric vehicles.
Furthermore, CEV3 has also negative impact (p = 0.002 (<0.01); t = −3.060; B = −0.184). That means that the lack of infrastructure for charging electric vehicles negatively affected attitudes towards purchasing electric vehicles.
CEV4 (p = 0.838 (>0.05)), CEV5 (p = 0.630 (> 0.05)), and CEV6 (p = 0.203 (>0.05)) do not have a significant impact on the formation of attitudes towards the purchase of electric vehicles. Furthermore, it was identified that the variable CEV7 has the greatest negative impact on the purchase attitudes (p = 0.029 (<0.05); B = −0.253; t = 2.219), and that the lack of service for electric vehicles negatively affected the probability of buying an electric vehicle.
CEV8 (p = 0.000 (<0.01); B = 0.522; t = 3.828) has a positive effect on attitudes, and respondents believed that the use of electric vehicles reduces greenhouse gas emissions released into the atmosphere.
CEV9 to CEV13 do not have significant impacts (p > 0.05). On the other hand, CEV14, which examines the impact of the existence of a service network, positively affects attitudes towards the purchase of electric vehicles (p = 0.005 (<0.01); B = 0.543; t = 2.791).
Variables from CEV15 to CEV17 do not have a significant impact (p > 0.05).
Based on the conducted analyses, we identified which variables have the greatest influences on the formation of the moderator variables that can impact the purchase of electric vehicles. Furthermore, in the next phase of the analysis, we determined which of the moderator variables, MOD1, MOD2, or MOD3, has the greatest influence on the formation of positive attitudes towards the purchase of electric vehicles.
Table 12 shows the model fit of the analysis of the impact that MOD1 has on BEV. The coefficient of determination of the model is 0.726, which equates to 72.6% of variance coverage. The significance of the obtained results is p = 0.000 (p < 0.01 (5)), which indicates that the obtained results can be used to form conclusions.
Table 13 shows the analysis of the influence of MOD1 on BEV, and based on the analysis, it was identified that there was a link between attitudes towards electric vehicles and the purchase of electric vehicles (p = 0.000 (<0.01); B = 0.786; t = 38.280). In other words, it was identified that the attitude towards the purchase of electric vehicles was influenced by the respondents’ characteristics. In other words, the purchase decision was determined by demographics and attitudes towards new technology.
Table 14 shows the model fit for the analysis of the impact of MOD3 on BEV, from which it follows that the coefficient of determination is 0.124, implying that the obtained data cover 12.4% of the variance. When it comes to the level of significance, it was identified that the model is significant, since p = 0.000 (p < 0.01 (5)). Examining the effect of MOD3 on BEV, the results of the testing are shown in Table 15.
On the other hand, the relationship between MOD3 and BEV is also significant (p = 0.000 (<0.01); B = 0.339; t = 6.046); thus, it can be concluded that there was a link between the characteristics of electric vehicles and the purchase of electric vehicles.
In other words, the CEV variables have an influence on the respondents’ attitudes and can influence the purchase of electric vehicles.
Furthermore, when looking at the influence that MOD3 has on MOD1, Table 16 shows the model fit, from which it is evident that the coefficient of determination is 0.060, which covers 6% of the variance. The significance of the model is p = 0.000 (<0.01). It was identified that there was a positive relationship between the characteristics of electric vehicles and the creation of attitudes towards electric vehicles.
On the other hand, regarding the influence that MOD3 has on MOD1 (Table 17), it was identified that there is a positive relationship, and thus that the characteristics of electric vehicles could influence the respondents’ attitudes towards electric vehicles (p = 0.000 (<0.01); B = 0.183; t = 6.046).
When considering the relationship between MOD2 and BEV, Table 18 shows the model summary of the analysis carried out. The model is significant p = 0.000 (p < 0.01 (5)), which indicates that the obtained results can be considered when reaching a conclusion. The coefficient of determination for the model is 0.230, which covers 23% of the variance of the variable moderator.
The influence of MOD3 on MOD2 (Table 19) is positive, i.e., there is a relationship between the characteristics of electric vehicles and the public policies that are adopted (p = 0.000 (<0.01); B = 0.183; t = 6.046). Thus, it can be concluded that the characteristics of electric vehicles could have an impact on the policies which determine the creation of the infrastructure and define the incentives for buying electric vehicles.
The model fit of the influence of MOD2 on BEV are presented in Table 20. The results of the conducted analysis is shown in Table 21. The coefficient of determination for the defined model is 0.192, which indicates a coverage of 19.2% of the variance. The influence of MOD2 on BEV is significant, at p = 0.000 (p < 0.01 (5)).
The impact of MOD2 on BEV is positive, and there is a positive link between the policy and the decision to buy electric vehicles (B = 0.289; t = 5.555; p = 0.000 (<0.01)). Thus, it can be concluded that the policies adopted by the government had a positive impact on the purchase of electric vehicles.
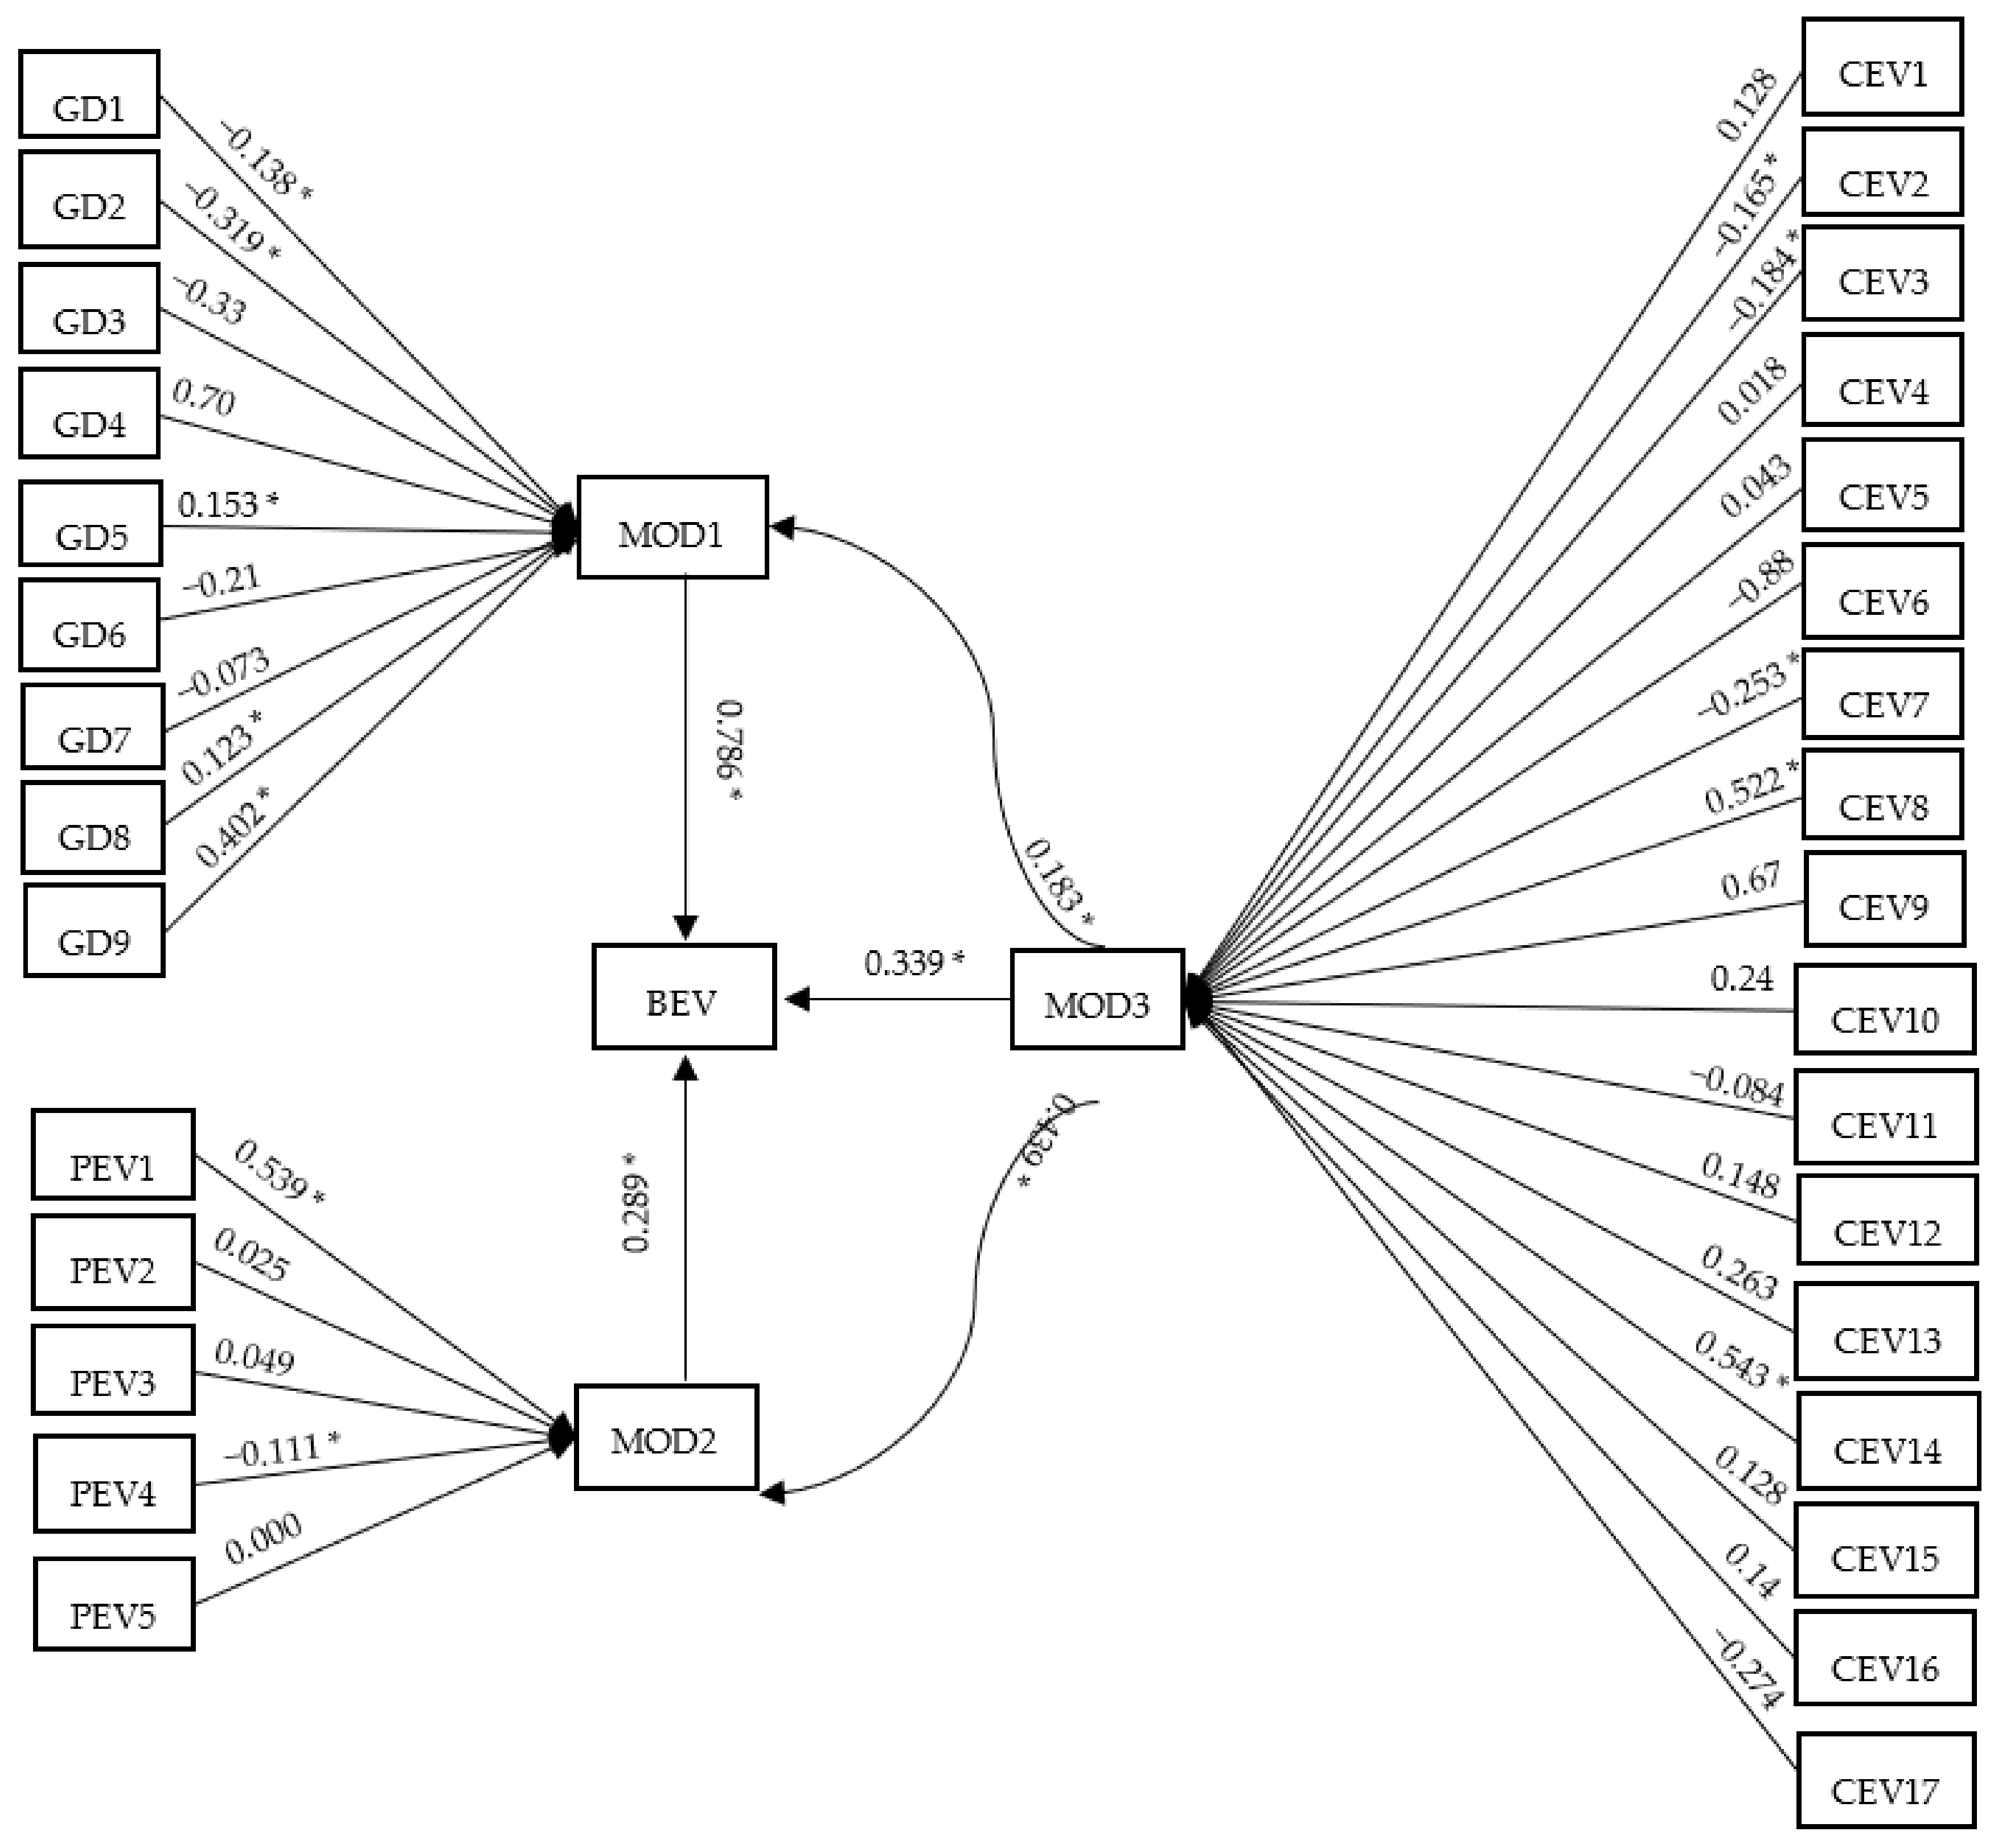
Figure 3 shows the relationship between the group of variables GD, the group of variables PE, and the group of variables CE regarding the decision to purchase electric vehicles. Coefficients B marked with * indicate a significant influence.
Through the analysis, it was identified that the variables that had the greatest influence on the acceptance of electric vehicles were battery life and the reduced negative impact that electric vehicles have on the environment. On the other hand, when considering the negative impact, it was identified that the lack of a service network, or the lack of infrastructure that supports the use of electric vehicles, was the most significant variable in negatively affecting the purchase of electric vehicles. Thus, there was a significant link between the moderator variable MOD3 and the decision to purchase an electric vehicle.
By analyzing the interactions between the moderator variables, we identified which characteristics of electric vehicles had an impact on the second moderator variable, MOD2, which refers to public policies aimed at investing in infrastructure, i.e., encouraging the purchase of electric vehicles. The moderator variable MOD1 also had a significant influence on decisions about purchasing an electric vehicle, and it can be concluded that the personal attitudes of respondents could determine purchase decisions.
Furthermore, when analyzing the influence on the moderator variables, it was identified that there was a significant influence of demographic factors, such as the gender of the respondents, the education of the respondents, the income of the respondents, their attitudes towards climate change, as well as their desires to own new technology. All the above determined the moderator variable MOD1, which could influence the purchase of an electric vehicle. On the other hand, when it comes to policies, it was identified that the respondents believed that the current policies are not enough in terms of encouraging the purchase of electric vehicles and that the implementation of the current policies does not significantly affect purchase decisions. This means that, through the definition of policies and the introduction of additional incentives for the purchase of electric vehicles, it may be possible to influence the creation of the moderator variable MOD2, which ultimately had an impact on the purchase of an electric vehicle.
The characteristics of electric vehicles and the availability of infrastructure are also moderator variables (MOD3) that had a significant impact, and when it comes to the determinants of MOD3, the battery of the electric vehicle, as well as the service network, i.e., the supporting infrastructure, stood out the most as factors that could influence the decision to purchase an electric vehicle.
Thus, in conclusion, it can be said that there is a positive attitude towards electric vehicles in the Republic of Croatia, but the limited autonomy of electric vehicles, as well as insufficiently developed infrastructure, negatively affect decisions regarding the purchase and use of electric vehicles. Likewise, it can be said that it is necessary to define new policies aimed at encouraging the development of electromobility, as well as the development of infrastructure.

5. Discussion

In this research, the influences of variables on the creation of attitudes towards electric vehicles were analyzed, as well as the mutual influence of moderator variables. It was identified that there were significant influences of the moderator variables on the formation of positive attitudes towards electric vehicles. It was also identified that the respondents believed that the existing policies aiming to encourage electromobility implemented by the government are not adequate. Likewise, it was identified that the existing efforts aimed at building the infrastructure for electric vehicles were not deemed good enough. The research data were analyzed using regression analysis and the exact analysis of the moderator variables. This research is one of the first studies of its kind to be conducted in the Republic of Croatia, which is why it has special significance.
Furthermore, the research hypotheses, as stated, were:
Hypothesis 1 (H1). Policies aiming to encourage electromobility in Croatia have a positive effect on the attitudes towards electromobility.
Hypothesis 2 (H2). Developed infrastructure has a positive effect on the attitudes towards the purchase of electric vehicles.
On the basis of the conducted research, it was identified that the respondents believed that the existing policies for encouraging the development of electromobility are not sufficient, and that it is necessary to modify them in the context of defining policies that can be directed towards encouraging the purchase of electric vehicles by ensuring a larger amount of co-financing, encouraging the construction of public charging stations for electric vehicles, and similar incentives. Accordingly, hypothesis H1 can be rejected.
Furthermore, the research identified that the existence of infrastructure has a positive effect on the creation of attitudes towards electric vehicles. This is evident from the responses of the respondents, who indicated their belief that the current lack of a service network for electric vehicles, a service network for electric vehicle batteries, as well as a sufficient number of charging stations, negatively affects the formation of attitudes.
Insufficient investment in the development of the infrastructure necessary for the normal functioning of electric vehicles may be a significant problem, especially in the case of a tourist country such as the Republic of Croatia, and with regard to the EU-defined year of the cessation of production, i.e., the use of fossil fuel vehicles. In other words, the arrival of a large number of tourists may also lead to an increased demand for electric charging stations, which could create significant congestion at charging stations. There is no doubt that, through the policies enforced by the European Union, as well as the funds provided for the development of electromobility, the development of infrastructure may be influenced, leading to an increase in the capacity of the existing infrastructure. This is also the basic link that we identified in the research, with the exception that we identified how insufficiently developed infrastructure negatively affects attitudes towards the purchase of electric vehicles.
It is certainly necessary to emphasize the need for the additional development of the characteristics of electric vehicles, and primarily the battery capacity, since the limitation of the battery capacity, based on the obtained research results, has a negative effect on the attitudes towards the purchase of an electric vehicle, as well as the technology of electric vehicles in general.
Globally, on the basis of the conducted research, it was identified that, in the Republic of Croatia, it is necessary to systematically increase the awareness of electric vehicles and the advantages of their use, and to encourage their use through investment in infrastructure, which was also emphasized in the conclusions of [56]. Likewise, given that the current situation in the Republic of Croatia is such that there are a certain number of public charging stations for electric vehicles that allow free charging, in the future, with the increase in the number of electric vehicles, a charging fee will most likely be introduced, which could also be one of the limiting factors.
Furthermore, it is necessary to emphasize the necessity of education related to electric vehicles, as well as to consider the issue of the political and environmental costs of battery production, or of electric vehicles in general. Such costs can affect the final price of an electric vehicle, which, in the research conducted in the context of the Republic of Croatia, turned out to be a factor that negatively affected the formation of attitudes towards the purchase of electric vehicles.
The price of electric vehicles certainly plays a significant role in their adoption, i.e., their mass use [57], which may be a significant challenge in the context of the Republic of Croatia with regard to purchasing power and economic conditions. The aforementioned challenge may can also be a factor that has an impact on the current situation from the perspective of infrastructure development. In addition to the political and environmental costs, the cost of owning an electric vehicle also has a significant impact, as emphasized by [56]. In other words, by reducing taxes on the purchase of electric vehicles, encouraging their purchase, or enabling free charging at public charging stations, it may be possible to influence the purchase of electric vehicles and their wider adoption in society.
There is no doubt that the adoption of electric vehicles is becoming an imperative, imposed by the need to reduce greenhouse gas emissions. However, the adoption of electric vehicles may be significantly limited due to insufficiently well-articulated policies defined at the government level, as well as slowness in adapting the infrastructure to the needs of the charging of electric vehicle batteries. Given the insufficient autonomy and the challenges arising from the risks involved in charging batteries or the insufficient reliability of electric vehicles, and in light of the technical innovations built into electric vehicles, the imperative to invest in the additional development and innovation of this technology falls on electric vehicle manufacturers. On the other hand, there is also a need to develop and change the awareness of citizens through policies defined at the government level and to ensure enough financial resources are available to co-finance the purchase of electric vehicles. This approach could influence an increase in the citizens’ awareness, as well as the mass adoption, of electric vehicles, since users would have to adapt their behavior and habits to the imposed policies and the new context in which they find themselves.

6. Conclusions

The conducted research is one of the first studies of its kind in the Republic of Croatia, which aimed to analyze current attitudes towards the adoption of electric vehicles and represents a significant contribution to our understanding of the culture of mobility in the Republic of Croatia, as well as our understanding of attitudes towards climate change and how such attitudes can affect opinions about electric vehicles. Considering that electromobility in the Republic of Croatia is still in its infancy, and that the Republic of Croatia does not have significant infrastructure that could meet the demand for electric vehicle charging stations in the future, it is necessary to analyze the current situation from the point of view of attitudes and availability, i.e., the capacity of the existing infrastructure, in order to raise awareness about the need to develop plans for the development of infrastructure intended for electric vehicles.
Furthermore, it is necessary to emphasize the need to develop the infrastructure to produce electricity, since an insufficiently developed infrastructure will not be able to meet future demands in terms of electricity demand in addition to existing requirements. However, the development of infrastructure for producing electricity must be based on clean, i.e., green, electricity, as the development of unsustainable sources of electricity will create a negative effect, i.e., it will reduce the positive effects created by reducing the use of vehicles on fossil fuels. However, it is also necessary to manage the materials used to produce electric vehicles, since the use of unsustainable materials will have a negative impact on the cumulative greenhouse gases released during the production of the components that are installed in electric vehicles. Therefore, the issue of the adoption of electric vehicles and their production (i.e., use) needs to be approached systematically, which includes considering the sustainability of the resources used to produce electricity, the production of electric vehicles, and, ultimately, their disposal, i.e., the recycling of the components of electric vehicles.
The obtained research results must also be interpreted in the context in which the Republic of Croatia currently finds itself, which is characterized by growing inflation, an enhanced culture of using fossil-fueled cars, and a standard of living that, compared to the developed countries of the European Union, is low.
The obtained results can be used, in practice, as a basis for defining policies aimed at procuring the necessary investments in infrastructure, increasing the number of available filling stations, and encouraging a culture of sustainability. In addition, the obtained results can serve as a basis for the development of electric vehicles in the context of improving their existing characteristics, which, in this research, turned out to have an impact on the formation of the attitudes related to their purchase.
The conducted research has limitations that primarily relate to regionality, since the research was conducted exclusively in the territory of the Republic of Croatia, without considering other countries in the European Union. In view of this, the obtained results of this research may differ from the results that other authors may obtain when conducting their research elsewhere.
Future researchers in this area are encouraged to conduct research in which the current state of charging stations for electric vehicles—that is, the current situation in terms of the capacity of charging stations—is analyzed. In addition, recommendations for future researchers include the conducting of research in which the total amount of harmful gases emitted during the production of an electric vehicle is analyzed and in which such results are compared with the amount of harmful gases emitted during the production and operation of vehicles powered by fossil fuels.

Author Contributions

Conceptualization, M.K.; methodology, M.K. and M.M.; software, M.K.; validation, M.K. and M.M.; formal analysis, M.K. and M.M.; investigation, M.K. and M.M.; resources, M.K.; data curation, M.K. and M.M.; writing—original draft preparation, M.K. and M.M.; writing—review and editing, M.K. and M.M.; visualization, M.K. and M.M.; supervision, K.B.; project administration, K.B.; funding acquisition, K.B. All authors have read and agreed to the published version of the manuscript.

Funding

The APC was funded by University North, Republic of Croatia.

Institutional Review Board Statement

Not applicable.

Informed Consent Statement

The authors (Maja Mutavdžija, Matija Kovačić and Krešimir Buntak) of the paper, entitled “Assessment of selected factors influencing purchase of electric vehicles—a case study of the Republic of Croatia”, confirm that informed consent was obtained from all participants involved in the study.

Data Availability Statement

Not applicable.

Conflicts of Interest

The authors declare no conflict of interest.

References

  1. Krupa, J.S.; Rizzo, D.M.; Eppstein, M.J.; Lanute, D.B.; Gaalema, D.E.; Lakkaraju, K.; Warrender, C.E. Analysis of a consumer survey on plug-in hybrid electric vehicles. Transp. Res. Part A Policy Pract. 2014, 64, 14–31. [Google Scholar] [CrossRef]
  2. Bharadwaj, S.; Ballare, S.; Chandel, M.K. Impact of congestion on greenhouse gas emissions for road transport in Mumbai metropolitan region. Transp. Res. Procedia 2017, 25, 3538–3551. [Google Scholar] [CrossRef]
  3. Requia, W.J.; Adams, M.D.; Arain, A.; Koutrakis, P.; Ferguson, M. Carbon dioxide emissions of plug-in hybrid electric vehicles: A life-cycle analysis in eight Canadian cities. Renew. Sustain. Energy Rev. 2017, 78, 1390–1396. [Google Scholar] [CrossRef]
  4. Küfeoğlu, S.; Hong, D.K.K. Emissions performance of electric vehicles: A case study from the United Kingdom. Appl. Energy 2020, 260, 114241. [Google Scholar] [CrossRef]
  5. Plötz, P.; Funke, S.A.; Jochem, P.; Wietschel, M. CO2 mitigation potential of plug-in hybrid electric vehicles larger than expected. Sci. Rep. 2017, 7, 16493. [Google Scholar] [CrossRef] [PubMed]
  6. Jensen, A.F.; Thorhauge, M.; Mabit, S.E.; Rich, J. Demand for plug-in electric vehicles across segments in the future vehicle market. Transp. Res. Part D Transp. Environ. 2021, 98, 102976. [Google Scholar] [CrossRef]
  7. Gilleran, M.; Bonnema, E.; Woods, J.; Mishra, P.; Doebber, I.; Hunter, C.; Mann, M. Impact of electric vehicle charging on the power demand of retail buildings. Adv. Appl. Energy 2021, 4, 100062. [Google Scholar] [CrossRef]
  8. Casini, M.; Vicino, A.; Zanvettor, G.G. A receding horizon approach to peak power minimization for EV charging stations in the presence of uncertainty. Int. J. Electr. Power Energy Syst. 2021, 126, 106567. [Google Scholar] [CrossRef]
  9. Rostami, F.; Kis, Z.; Koppelaar, R.; Jiménez, L.; Pozo, C. Comparative sustainability study of energy storage technologies using data envelopment analysis. Energy Storage Mater. 2022, 48, 412–438. [Google Scholar] [CrossRef]
  10. Zhou, P.; Ang, B.W.; Wang, H. Energy and CO2 emission performance in electricity generation: A non-radial directional distance function approach. Eur. J. Oper. Res. 2012, 221, 625–635. [Google Scholar] [CrossRef]
  11. Bogdanov, D.; Ram, M.; Aghahosseini, A.; Gulagi, A.; Oyewo, A.S.; Child, M.; Breyer, C. Low-cost renewable electricity as the key driver of the global energy transition towards sustainability. Energy 2021, 227, 120467. [Google Scholar] [CrossRef]
  12. Benedek, J.; Sebestyén, T.T.; Bartók, B. Evaluation of renewable energy sources in peripheral areas and renewable energy-based rural development. Renew. Sustain. Energy Rev. 2018, 90, 516–535. [Google Scholar] [CrossRef]
  13. LaMonaca, S.; Ryan, L. The state of play in electric vehicle charging services—A review of infrastructure provision, players, and policies. Renew. Sustain. Energy Rev. 2022, 154, 111733. [Google Scholar] [CrossRef]
  14. Sechel, I.C.; Mariasiu, F. Efficiency of governmental policy and programs to stimulate the use of low-emission and electric vehicles: The case of Romania. Sustainability 2021, 14, 45. [Google Scholar] [CrossRef]
  15. Lieven, T. Policy measures to promote electric mobility—A global perspective. Transp. Res. Part A Policy Pract. 2015, 82, 78–93. [Google Scholar] [CrossRef]
  16. Åhman, M. Government policy and the development of electric vehicles in Japan. Energy Policy 2006, 34, 433–443. [Google Scholar] [CrossRef]
  17. Thiel, C.; Nijs, W.; Simoes, S.; Schmidt, J.; van Zyl, A.; Schmid, E. The impact of the EU car CO2 regulation on the energy system and the role of electro-mobility to achieve transport decarbonisation. Energy Policy 2016, 96, 153–166. [Google Scholar] [CrossRef]
  18. Krause, J.; Thiel, C.; Tsokolis, D.; Samaras, Z.; Rota, C.; Ward, A.; Verhoeve, W. EU road vehicle energy consumption and CO2 emissions by 2050–Expert-based scenarios. Energy Policy 2020, 138, 111224. [Google Scholar] [CrossRef]
  19. Singh, V.; Singh, V.; Vaibhav, S. Analysis of electric vehicle trends, development and policies in India. Case Stud. Transp. Policy 2021, 9, 1180–1197. [Google Scholar] [CrossRef]
  20. Ye, F.; Kang, W.; Li, L.; Wang, Z. Why do consumers choose to buy electric vehicles? A paired data analysis of purchase intention configurations. Transp. Res. Part A Policy Pract. 2021, 147, 14–27. [Google Scholar] [CrossRef]
  21. Coffman, M.; Bernstein, P.; Wee, S. Electric vehicles revisited: A review of factors that affect adoption. Transp. Rev. 2017, 37, 79–93. [Google Scholar] [CrossRef]
  22. Hasan, S. Assessment of electric vehicle repurchase intention: A survey-based study on the Norwegian EV market. Transp. Res. Interdiscip. Perspect. 2021, 11, 100439. [Google Scholar] [CrossRef]
  23. Di Felice, L.J.; Renner, A.; Giampietro, M. Why should the EU implement electric vehicles? Viewing the relationship between evidence and dominant policy solutions through the lens of complexity. Environ. Sci. Policy 2021, 123, 1–10. [Google Scholar] [CrossRef]
  24. Xu, L.; Yilmaz, H.Ü.; Wang, Z.; Poganietz, W.R.; Jochem, P. Greenhouse gas emissions of electric vehicles in Europe considering different charging strategies. Transp. Res. Part D Transp. Environ. 2020, 87, 102534. [Google Scholar] [CrossRef]
  25. Kovačić, M.; Mutavdžija, M.; Buntak, K. New Paradigm of Sustainable Urban Mobility: Electric and Autonomous Vehicles—A Review and Bibliometric Analysis. Sustainability 2022, 14, 9525. [Google Scholar] [CrossRef]
  26. White, C.; Thompson, B.; Swan, L.G. Comparative performance study of electric vehicle batteries repurposed for electricity grid energy arbitrage. Appl. Energy 2021, 288, 116637. [Google Scholar] [CrossRef]
  27. Chen, M.; Ma, X.; Chen, B.; Arsenault, R.; Karlson, P.; Simon, N.; Wang, Y. Recycling end-of-life electric vehicle lithium-ion batteries. Joule 2019, 3, 2622–2646. [Google Scholar] [CrossRef]
  28. Yu, M.; Bai, B.; Xiong, S.; Liao, X. Evaluating environmental impacts and economic performance of remanufacturing electric vehicle lithium-ion batteries. J. Clean. Prod. 2021, 321, 128935. [Google Scholar] [CrossRef]
  29. Di Maria, A.; Elghoul, Z.; Van Acker, K. Environmental assessment of an innovative lithium production process. Procedia CIRP 2022, 105, 672–677. [Google Scholar] [CrossRef]
  30. Gu, H.; Liu, Z.; Qing, Q. Optimal electric vehicle production strategy under subsidy and battery recycling. Energy Policy 2017, 109, 579–589. [Google Scholar] [CrossRef]
  31. Dixon, J.; Bell, K. Electric vehicles: Battery capacity, charger power, access to charging and the impacts on distribution networks. ETransportation 2020, 4, 100059. [Google Scholar] [CrossRef]
  32. Nykvist, B.; Olsson, O. The feasibility of heavy battery electric trucks. Joule 2021, 5, 901–913. [Google Scholar] [CrossRef]
  33. Yang, J.; Guo, F.; Zhang, M. Optimal planning of swapping/charging station network with customer satisfaction. Transp. Res. Part E Logist. Transp. Rev. 2017, 103, 174–197. [Google Scholar] [CrossRef]
  34. Suttakul, P.; Wongsapai, W.; Fongsamootr, T.; Mona, Y.; Poolsawat, K. Total cost of ownership of internal combustion engine and electric vehicles: A real-world comparison for the case of Thailand. Energy Rep. 2022, 8, 545–553. [Google Scholar] [CrossRef]
  35. Figenbaum, E. Retrospective Total cost of ownership analysis of battery electric vehicles in Norway. Transp. Res. Part D Transp. Environ. 2022, 105, 103246. [Google Scholar] [CrossRef]
  36. Franzò, S.; Nasca, A.; Chiesa, V. Factors affecting cost competitiveness of electric vehicles against alternative powertrains: A total cost of ownership-based assessment in the Italian market. J. Clean. Prod. 2022, 363, 132559. [Google Scholar] [CrossRef]
  37. Goetzel, N.; Hasanuzzaman, M. An empirical analysis of electric vehicle cost trends: A case study in Germany. Res. Transp. Bus. Manag. 2022, 43, 100825. [Google Scholar] [CrossRef]
  38. Wróblewski, P.; Lewicki, W. A method of analyzing the residual values of low-emission vehicles based on a selected expert method taking into account stochastic operational parameters. Energies 2021, 14, 6859. [Google Scholar] [CrossRef]
  39. Sun, D.J.; Zheng, Y.; Duan, R. Energy consumption simulation and economic benefit analysis for urban electric commercial-vehicles. Transp. Res. Part D Transp. Environ. 2021, 101, 103083. [Google Scholar] [CrossRef]
  40. Aguilar-Dominguez, D.; Dunbar, A.; Brown, S. The electricity demand of an EV providing power via vehicle-to-home and its potential impact on the grid with different electricity price tariffs. Energy Rep. 2020, 6, 132. [Google Scholar] [CrossRef]
  41. Davies, H.; Santos, G.; Faye, I.; Kroon, R.; Weken, H. Establishing the transferability of best practice in EV policy across EU borders. Transp. Res. Procedia 2016, 14, 2574–2583. [Google Scholar] [CrossRef]
  42. Janota, L.; Surovezhko, A.; Igissenov, A. Comprehensive evaluation of the planned development of intermittent renewable sources within the EU. Energy Rep. 2022, 8, 214–220. [Google Scholar] [CrossRef]
  43. Gkoumas, K.; Marques dos Santos, F.L.; Stepniak, M.; Pekár, F. Research and Innovation Supporting the European Sustainable and Smart Mobility Strategy: A Technology Perspective from Recent European Union Projects. Appl. Sci. 2021, 11, 11981. [Google Scholar] [CrossRef]
  44. European Commission. LIFE Programme. Available online: https://cinea.ec.europa.eu/programmes/life_en (accessed on 28 July 2022).
  45. Prebeg, P.; Gasparovic, G.; Krajacic, G.; Duic, N. Long-term energy planning of Croatian power system using multi-objective optimization with focus on renewable energy and integration of electric vehicles. Appl. Energy 2016, 184, 1493–1507. [Google Scholar] [CrossRef]
  46. Rokicki, T.; Bórawski, P.; Bełdycka-Bórawska, A.; Żak, A.; Koszela, G. Development of Electromobility in European Union Countries under COVID-19 Conditions. Energies 2021, 15, 9. [Google Scholar] [CrossRef]
  47. Novotny, A.; Szeberin, I.; Kovács, S.; Máté, D. National Culture and the Market Development of Battery Electric Vehicles in 21 Countries. Energies 2022, 15, 1539. [Google Scholar] [CrossRef]
  48. Desai, R.R.; Hittinger, E.; Williams, E. Interaction of Consumer Heterogeneity and Technological Progress in the US Electric Vehicle Market. Energies 2022, 15, 4722. [Google Scholar] [CrossRef]
  49. Van Heuveln, K.; Ghotge, R.; Annema, J.A.; van Bergen, E.; van Wee, B.; Pesch, U. Factors influencing consumer acceptance of vehicle-to-grid by electric vehicle drivers in The Netherlands. Travel Behav. Soc. 2021, 24, 34–45. [Google Scholar] [CrossRef]
  50. Stockkamp, C.; Schäfer, J.; Millemann, J.A.; Heidenreich, S. Identifying factors associated with consumers’ adoption of e-mobility—A systematic literature review. Sustainability 2021, 13, 10975. [Google Scholar] [CrossRef]
  51. Chachdi, A.; Rahmouni, B.; Aniba, G. Socio-economic analysis of electric vehicles in Morocco. Energy Procedia 2017, 141, 644–653. [Google Scholar] [CrossRef]
  52. Jaiswal, D.; Deshmukh, A.K.; Thaichon, P. Who will adopt electric vehicles? Segmenting and exemplifying potential buyer heterogeneity and forthcoming research. J. Retail. Consum. Serv. 2022, 67, 102969. [Google Scholar] [CrossRef]
  53. Dutta, B.; Hwang, H.G. Consumers Purchase Intentions of Green Electric Vehicles: The Influence of Consumers Technological and Environmental Considerations. Sustainability 2021, 13, 12025. [Google Scholar] [CrossRef]
  54. Tucki, K.; Orynycz, O.; Świć, A.; Mitoraj-Wojtanek, M. The development of electromobility in Poland and EU states as a tool for management of CO2 emissions. Energies 2019, 12, 2942. [Google Scholar] [CrossRef]
  55. Ruggieri, R.; Ruggeri, M.; Vinci, G.; Poponi, S. Electric mobility in a smart city: European overview. Energies 2021, 14, 315. [Google Scholar] [CrossRef]
  56. Sahoo, D.; Harichandan, S.; Kar, S.K.; Sreejesh, S. An empirical study on consumer motives and attitude towards adoption of electric vehicles in India: Policy implications for stakeholders. Energy Policy 2022, 165, 112941. [Google Scholar] [CrossRef]
  57. Lewicki, W.; Drożdż, W.; Wróblewski, P.; Żarna, K. The Road to Electromobility in Poland: Consumer Attitude Assessment. Eur. Res. J. 2021, 24, 28–39. [Google Scholar] [CrossRef]
Figure 1. Research methodology.
Energies 15 05987 g001
Figure 2. Research model.
Energies 15 05987 g002
Figure 3. Graphical representation of the moderator variable values. * indicates a level of significance of p < 0.05.
Energies 15 05987 g003
Table 1. General data of the respondents.
VariableAbbreviationReference
Age of the respondent.GD1[1,22,50,53]
Sex of the respondent.GD2[1,22,50,53]
Total annual income of the respondent.GD3[1,22,50,53]
The mode of transport used by the respondent.GD4[1,22,50,53]
Education of the respondent.GD5[1,22,53]
Political orientation of the respondent.GD6[1]
I believe that the climate change is a threat to humanity.GD7[1,53]
Work status of the respondent.GD8[1,50]
The desire to own new technology.GD9[1]
Table 2. Characteristics of electric vehicles and infrastructure.
VariableAbbreviationReference
Low battery capacity of an electric vehicles.CEV1[1,22,50,53]
The high cost of replacing an electric vehicle battery.CEV2[1,22,50,53]
Lack of infrastructure for charging electric vehicles.CEV3[1,50,53]
The ecological and political costs of producing an electric vehicle battery.CEV4[1,50,53]
The ecological and political costs of producing an electric vehicle.CEV5[1,50,53]
Ecological cost of electric vehicle battery disposal.CEV6[1,50,53]
Difficulties in servicing or repairing the electric motor of an electric vehicle.CEV7[1,50,53]
Understanding that electric vehicles reduce greenhouse gas emissions.CEV8[1,50,53]
Realizing that electric vehicles reduce monthly fuel consumption.CEV9[1,50,53]
Realizing that an electric vehicle can be charged at home.CEV10[1,50,53]
Realizing that electric vehicle batteries can be repurposed and recycled.CEV11[1,50,53]
Getting an incentive from the government to buy an electric vehicle.CEV12[1,50,53]
The existence of a leasing program for electric vehicle batteries.CEV13[1,50,53]
The existence of a service network for electric vehicles.CEV14[1,50,53]
The existence of a service network for electric vehicle batteries.CEV15[1,50,53]
The existence of a warranty on the battery of an electric vehicle.CEV16[1,50,53]
Existence of charging infrastructure near home/apartment/work.CEV17[1,50,53]
Table 3. Analysis of the influence of public policies on the creation of attitudes towards the purchase of electric vehicles.
VariableAbbreviationReference
Government co-finances the purchase of electric vehicles.POL1[22,50,53]
Public policy does prioritize the construction of charging stations for electric vehicles.POL2[1,50,53]
Environmental protection policies emphasize the need for use of electric vehicles.POL3[1,50,53]
Public policy cares enough about new modes of transportation.POL4[1,50,53]
I believe that a change in public policies towards the use of electric vehicles would have a positive effect on society’s attitudes towards the purchase of electric vehicles.POL5[1,50,53]
Table 4. Willingness to buy electric vehicles.
VariableAbbreviation
The influence of the respondent’s characteristics and their influence on the creation of attitudes towards the purchase of an electric vehicle. MOD1
The influence of the characteristics of electric vehicles and infrastructure on the creation of attitudes about the purchase of electric vehicles. MOD2
The influence of public policies on the creation of attitudes towards the purchase of electric vehicles. MOD3
Attitude towards buying an electric vehicle. BEV
Table 5. Reliability analysis using the Cronbach alpha test.
Cronbach Alpha (a)N of Items
0.83538
Table 6. Model fit analysis of the GD variables.
RR2Adjusted R2Fp
0.4720.2230.2104.7190.000 **
Table 7. Analysis of the influence of the GD variables on MOD1.
ModelCoefficientstp
BStd. Error
(Constant)3.2910.4127.9880.000
GD1−0.1380.0592.3200.021 *
GD2−0.3190.1043.0640.002 **
GD3−0.0330.024−1.3980.163
GD40.0700.0401.9980.041 *
GD50.1530.0503.0340.003 **
GD6−0.0210.086−0.2440.807
GD70.1230.0641.9890.048 *
GD8−0.0730.056−1.3050.192
GD90.4020.03710.9780.000 **
Table 8. Model fit analysis for the POL variables.
RR2Adjusted R2Fp
0.7170.5150.26539.7150.000 **
Table 9. Analysis of the influences of the POL variables on MOD3.
ModelCoefficientstp
BStd. Error
(Constant)2.0510.3056.7230.000
POL10.5390.04013.5460.000 **
POL20.0250.0460.5560.579
POL30.0490.0451.0830.279
POL4−0.1110.0591.9890.048 *
POL50.0000.0580.0040.997
Table 10. Model fit analysis for the CEV variables.
RR2Adjusted R2Fp
0.3600.1300.1024.7190.000 **
Table 11. Analysis of the influences of the CEV variables on MOD2.
ModelCoefficientstp
BStd. Error
(Constant)5.9790.53711.1420.000
CEV10.1280.0781.6450.101
CEV2−0.1650.071−2.3160.021 *
CEV3−0.1840.060−3.0600.002 **
CEV40.0180.0890.2050.838
CEV50.0430.0890.4820.630
CEV6−0.0880.069−1.2740.203
CEV7−0.2530.1162.1930.029 *
CEV80.5220.1363.8280.000 **
CEV90.0670.1310.5080.612
CEV100.0240.1140.2090.834
CEV11−0.0840.134−0.6280.531
CEV120.1480.1031.4410.150
CEV130.2630.1891.3910.165
CEV140.5430.1952.7910.005 **
CEV150.1280.1460.8770.381
CEV160.0140.1850.0780.938
CEV17−0.2740.159−1.7260.085
Table 12. Model fit for the analysis of the impact of MOD1 on BEV.
ModelRR2Fp
10.8520.7261465.3880.000 **
Table 13. Analysis of the influence of MOD1 on BEV.
ModelCoefficientstp
BStd. Error
1(Constant)0.9420.07712.2470.000
MOD1 → BEV0.7860.02138.2800.000 **
Table 14. Model fit for the analysis of the impact of MOD3 on BEV.
ModelRR2Fp
10.3520.12473.1260.000 **
Table 15. Analysis of the influence of MOD3 on BEV.
ModelCoefficientstp
BStd. Error
1(Constant)4.1360.21812.2470.000
MOD3 → BEV0.3390.0566.0460.000 **
Table 16. Model fit for the analysis of the impact of MOD3 on MOD1.
ModelRR2Fp
10.2490.06236.5570.000 **
Table 17. Analysis of the influence of MOD3 on MOD1.
ModelCoefficientstp
BStd. Error
1(Constant)4.1360.21812.2470.000
MOD3 → MOD10.1830.0306.0460.000 **
Table 18. Model fit for the analysis of the impact of MOD3 on MOD2.
ModelRR2Fp
10.2300.05330.8580.000 **
Table 19. Analysis of the influence of MOD3 on MOD2.
ModelCoefficientstp
BStd. Error
(Constant)4.1920.10340.7290.000
MOD3 → MOD20.1830.0306.0460.000 **
Table 20. Model fit for the analysis of the impact of MOD2 on BEV.
ModelRR2Fp
10.4390.19230.8580.000 **
Table 21. Analysis of the influence of MOD2 on BEV.
Coefficientstp
BStd. Error
(Constant)3.8940.19519.9920.000
MOD2 → BEV0.2890.0525.5550.000 **
Publisher’s Note: MDPI stays neutral with regard to jurisdictional claims in published maps and institutional affiliations.

