Abstract
For the study of coal and gangue identification using near-infrared reflection spectroscopy, samples of anthracite coal and gangue with similar appearances were collected, and different dust concentrations (200 ug/m3, 500 ug/m3 and 800 ug/m3), detection distances (1.2 m, 1.5 m and 1.8 m) and mixing gangue rates (one-third coal, two-thirds coal, full coal) were collected in the laboratory by the reflection spectroscopy acquisition device and the gangue reflection spectral data. The spectral data were pre-processed using three methods, first-order differentiation, second-order differentiation and standard normal variable transformation, in order to enhance the absorption characteristics of the reflectance spectra and to eliminate the effects of changes in the experimental environment. The PCViT gangue identification model is established, and the disadvantages of the violent patch embedding of the ViT model are improved by using the stepwise convolution operation to extract features. Then, the interdependence of the features of the hyperspectral data is modeled by the self-attention module, and the learned features are optimized adaptively. The results of gangue recognition under nine working conditions show that the proposed recognition model can significantly improve the recognition accuracy, and this study can provide a reference value for gangue recognition using the near-infrared reflection spectra of gangue.
1. Introduction
Coal is still one of the most important world energy resources nowadays, and it will inevitably be developed by intelligent and even unmanned mining technologies in the future. However, limited by the complex and harsh production environment and working conditions of underground coal mines, the development of intelligent coal mining technology is still difficult and insufficient. Unmanned intelligent mining of requires the intelligent perception of equipment. The deep combination and application of artificial intelligence in the process of coal rock mining is the new direction of the high-quality development of the coal industry, and the identification and sorting of coal gangue is an important part of coal mine intelligence [1,2]. In coal mining, a large amount of coal gangue is mixed with raw coal, which easily causes pollution and reduces the combustion heat of raw coal [3,4]. Therefore, gangue separation is the key step to improving the quality of raw coal [5]. In recent years, the research and application of coal gangue dry sorting have developed rapidly, including dual-energy gamma-ray detection [6,7,8], X-ray detection [9], laser detection [10] and image detection [11]. Radioactive detection techniques (e.g., gamma and X-ray) are easy to integrate, but radiation is present during use, so radiation isolation is required. Image detection is susceptible to various interfering factors (e.g., uneven and poor illumination) that result in invisible surface and texture differences, and dust around the gangue may also degrade recognition performance. Given the above challenges, there is an urgent need for a fast and environmentally friendly analysis method with a low operating cost.
Near infrared spectroscopy (NIRS) is a radiation-free, in situ material-specific spectroscopic analysis technique whose identification mechanism is the presence of reflectance spectral absorption properties at specific wavelengths for the specific chemical composition and material structure of the tested substance, and this technique has been successfully used for quantitative analysis in agriculture, fuels, food and other fields. In studies related to coal, the literature [12,13] used NIRS and different analytical modeling strategies to analyze coal for moisture, fixed carbon and volatile matter content. In addition, Hu et al. [14] used the results of the analysis of organic properties such as volatile matter and fixed carbon to improve regression models for predicting inorganic properties such as ash and sulfur. Despite several attempts to analyze coal quality, research on the application of NIR spectroscopy in coal and gangue identification has been limited. In terms of the NIR spectral analysis of coal ash on the basis of machine learning, researchers have proposed a vast number of learning algorithms for increasing the quality of modeling spectral data and estimating the performance of the model [15,16,17,18]. Based on gangue absorption spectra, Song et al. [19] used a combination of visible-near infrared (VIS-NIR) and thermal infrared spectroscopy to distinguish gangue from coal, and Yang et al. [20] used VIS-NIR and a support vector machine (SVM) to identify coal and carbonaceous shale.
For these applications of NIR spectroscopy in coal analysis, most of the specimens are in powder form. Moreover, most of the data sets involved in NIR spectroscopy studies have sample heterogeneity, such as excessive coal powder on the gangue surface, which will lead to the foreign matter homospectral phenomenon. Additionally, because NIR spectroscopy is a highly sensitive nondestructive detection method, changes in the detection conditions (e.g., separation distance and light intensity) can lead to changes in the collected spectral data. The conventional machine learning methods used in most of the research may not meet the requirements for accurate gangue identification [21,22,23,24]. Considering these challenges in coal gangue identification, this paper proposes a new method for the nondestructive detection of coal gangue identification using near-infrared spectroscopy. An improvement of the vision transformer (ViT) [25] method, which exhibits excellent performance in the field of image classification, allows for its application to pixel-level tasks, and the main contributions of this paper are as follows.
- (1)
- In this paper, we designed a three-factor (distance between the measuring device and the sample, the dust concentration and the coal content in the field of view), three-level simulated working environment based on the factors [26,27] that have a great influence on the spectral data in the actual working conditions, and we analyzed the influence of environmental factors by the collected data of coal rock spectral data in different experimental environments. Moreover, the experiments in this paper are based on block samples, which will significantly improve the practicality of the method.
- (2)
- Because the VIT method is a violent segmentation of the image, after which the output feature map is single-scale and low-resolution, it is a challenge to apply it to pixel-level tasks. To address the above limitations, this study proposes a pre-convolution vision transformer (PCViT) model. In this model, we strategically introduce convolution into the ViT structure to improve performance and robustness while maintaining high computational and memory efficiency. Our proposed pre-convolutional vision transformer (PCViT) exploits the advantages of CNN—a local perceptual field, shared weights and spatial subsampling—while retaining the advantages of the transformer: dynamic attention, global context fusion and better generalization.
The chapters of this paper are organized as follows: Section 2 introduces the structure of the model and its specific operations, and Section 3 depicts the experimental environment, the data preprocessing methods and the experimental comparisons of different hyperparameters of the model. Section 4 and Section 5 provide a discussion and a conclusion.
2. Pre-Convolutional Vision Transformer (PCViT)
VIT violently splits a 224 × 224 sized image into 16 × 16 blocks. This violent splitting method is fast but ignores the local feature information in the data, and this defect can be solved by CNN. The PCViT proposed in this paper integrates CNN and ViT; firstly, the local feature information of the data is fully extracted by different convolutional kernels, and then the attention weights of the extracted features of CNN are calculated by the excellent global modeling ability of ViT. The multi-headed attention can fully utilize the resources for parallel computation and speed up the computation speed.
A Overall Architecture.
The overall architecture of the PCVIT method proposed in this paper is shown in Figure 1, and Table 1 summarizes the specific description of the PCVIT method.
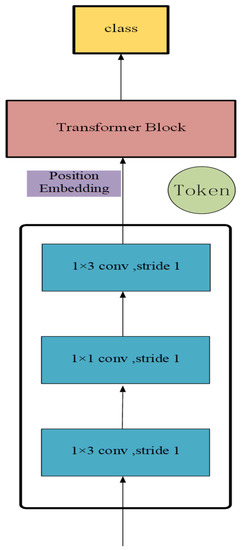
Figure 1.
Overall structure of the PCViT model.

Table 1.
Model structure.
Our goal is to improve the problem of data local feature loss in the ViT method by convolution. The whole architecture is similar to the CNN backbone [22], and our method has four stages, first generating multi-scale high-resolution features by convolution and then sending them to the Encoder structure in VIT to calculate the attention weights and further extract the features to complete the coal gangue identification based on hyperspectral data.
B Convolutional stem design.
In order to reduce the feature dimension without losing information, we do not use the pooling layer in classical convolutional neural networks and only use the convolutional layer to aggregate the feature information. Inspired by Peng, in the convolutional stage, this paper uses convolutional kernels of different sizes in the network to learn the long-term and short-term features of the input signal. This is done by performing a 1 × 3 convolution, a subsequent 1 × 1 convolution and finally a 1 × 3 convolution at the end. We follow a simple design pattern in order for the PCViT model to fully learn the regions of interest in the signal: all convolution steps are 1, and the number of output channels (256) is added to the original. The input data are quickly downsampled to 1 × 148 by three convolutions, and the output of the last convolution layer matches the input of the standard ViT method. In comparison, if a larger convolution step is used in the first layer, although it will reduce the dimensionality of the data more quickly, it also makes the network lose some of the features that are effective for classification. The convolution operation is shown in Equation (1).
In the formula, refers to the output of the neuron at the layer; refers to a nonlinear function; refers to the bias of the neuron at the layer; refers to the sample of an input data set; refers to the output of the neuron in the layer; and refers to the weight from the neuron in the layer to the neuron in the layer.
C The Encoder of the Vision Transformer (ViT).
A CNN stem of our own design is used to replace the image segmentation operation (patch embedding) in VIT, after which the convolutionally extracted features are fed into the Encoder module. Each Encoder module consists of two parts: a multi-headed attention layer and an MLP layer, which contains two nonlinear layers with GELU activation functions. The specific structure is shown in Figure 2. The layer normalization (Equation (7)) is applied before each layer in order to speed up the computation, and the residual join is applied after each layer. The Encoder composition structure diagram is shown in Figure 2.
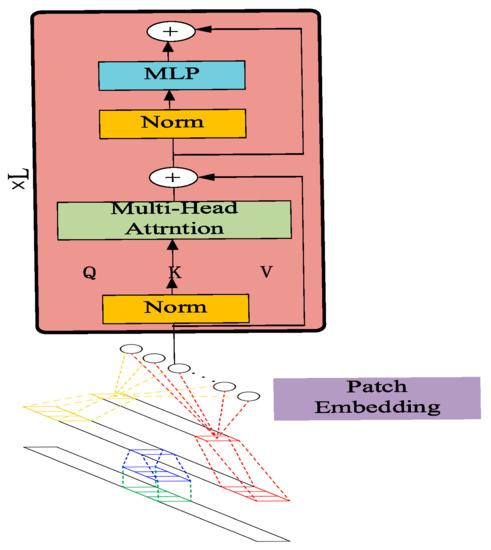
Figure 2.
Encoder composition structure diagram.
In terms of data operation, the convolutionally extracted features are first spliced with a Class token, and after adding position encoding by Equation (2), the attention weights of the features are calculated using Equations (3)–(5), followed by the nonlinear transformation of the data using Equation (6). After the L Encoder modules, the data are finally fed into a fully connected layer for classification.
As with other artificial neural networks, the stochastic learning process of the model (due to random weight initialization) requires a reasonable number of learning iterations to ensure that the cost function is minimized. The classification cross-entropy is a loss function applicable to the classification problem and is defined using Equation (8).
where Ti is the truth label and hybrid n is the Softmax probability of the nth class.
3. Experimental Study
3.1. Coal Gangue Spectrum Collection Experiment
A transparent PVC sheet was used to form a confined space, and the arrangement of the near-infrared reflection spectroscopy collection device of the coal gangue in the confined space is shown in Figure 3. The collimator mirror (field of view θ = 0.12°, lens diameter d = 2.5 cm) and halogen lamp are placed side by side; the collimator mirror and NeoSpectra NIR spectrometer (wavelength range of 1000–2500 nm, resolution of 8 nm) are connected with quartz fiber; the computer is connected with the NIR spectrometer through USB3.0 to display the NIR reflection spectrum of the coal gangue samples in real time. To reduce the influence of the bi-directional reflection characteristics of the measured gangue sample, a 100 W halogen lamp was used to irradiate the center of the sample surface in a vertical direction to form a circular light spot with an illumination of about 20,000 l×. In order to limit the scattering phenomenon during the spectral acquisition, a collimator was used to collimate the beam, and the distance between the collimator and the spot center was L. The range of the spectrum acquired by the NIR spectrometer was the circle formed by the field of view of the collimator on the surface of the sample. The diameter D and area S of the bottom circle are
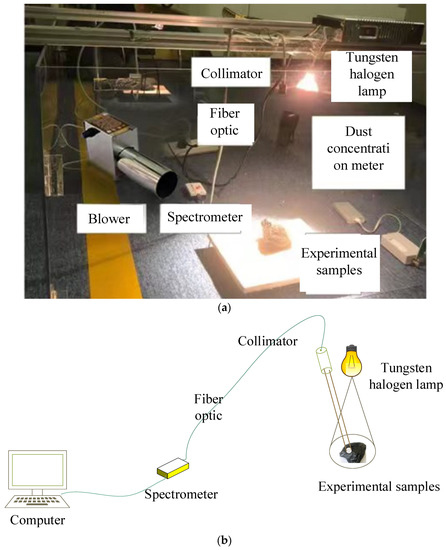
Figure 3.
Gangue near-infrared reflection spectrum acquisition device. (a) Physical diagram, (b) Schematic diagram.
In order to simulate the different environmental conditions of gangue identification as far as possible, the dust concentration in the confined space is set as 200, 500 and 800 mg/m3, and the distance between the collimator and gangue sample is set as 1.2, 1.5 and 1.8 m. Meanwhile, the field of view of the collimator acquisition is related to the distance L, so the coal percentage in the field of view is set as 1/3, 2/3 and 1 [27]. According to the scientific experimental method, the three-factor three-level orthogonal test was designed, and the specific details are shown in Table 2 and nine working conditions are shown in Table 3.
Table 2.
Experimental factors setting table.
Table 3.
Nine working conditions.
Note: The mixing rate expressed in terms of a projected area can be obtained by counting the number of pixel points in the two-dimensional image. One-third of the coal in the table is shown in Figure 4.
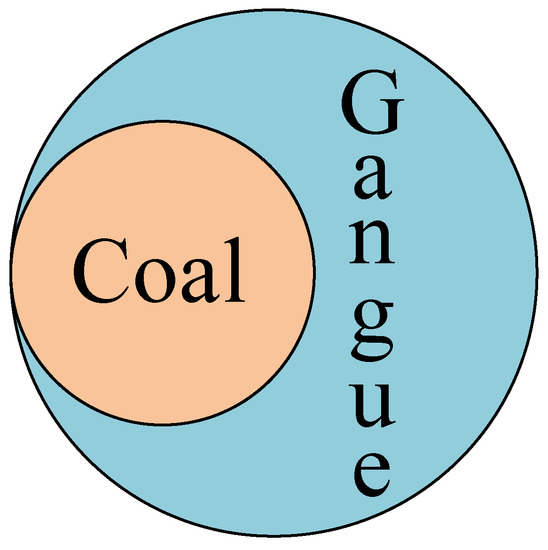
Figure 4.
The Schematic diagram of Coal Content.
3.2. Experimental Data Set and Validation Setup
The near-infrared reflection spectral curves of the same coal gangue sample under different working conditions are shown in Figure 5. From Figure 5, it can be seen that the spectral curve of the coal rock sample has an overall drift due to the change in the experimental environment. With the increase in the detection distance and dust concentration, the reflectance of the near-infrared reflection spectrum of the coal rock decreases, which will not affect the location of the characteristic absorption band of the spectrum but will affect the depth of the characteristic absorption band. The near-infrared reflectance spectral curve of the gangue fluctuates more obviously throughout the band, especially at 1400 nm, 1900 nm and 2200 nm near the appearance of the obvious characteristic absorption band. Compared with the spectral curves of the rocks, the spectral curves of the coal specimens are smoother and have no obvious characteristic absorption bands.
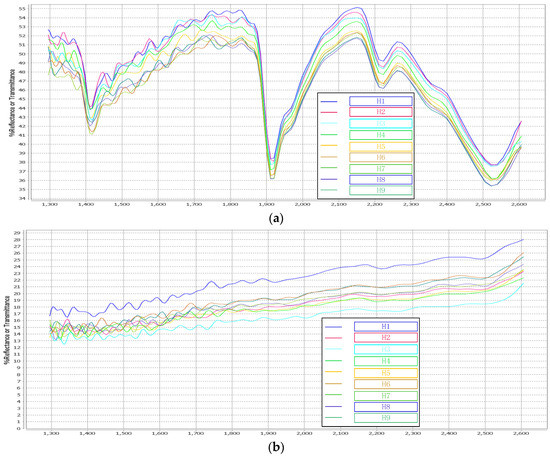
Figure 5.
Near-infrared reflectance spectra of coal and gangue samples under different detection distances and dust concentrations. (a) Near-infrared reflection spectral curve of gangue, (b) Near-infrared reflection spectral curve of coal.
During the experiment, the natural light intensity of the test site is constantly changing, and there is no timely use of the calibration whiteboard for the reflection background calibration, so there will be a background shift phenomenon. The coal and gangue are rich in a variety of chemical compositions; the difference in composition and inhomogeneity will form the scattering of light, which makes the collected coal gangue reflection spectral data contain a lot of noise.
In order to enhance the absorption characteristics of the gangue reflection spectrum and eliminate the influence of the changes in the experimental environment, three methods are used to pre-process the gangue reflection spectral data: first-order differentiation, second-order differentiation and standard normal variable transformation [28]. The pre-processed data are shown in Figure 6. The principles of the three algorithms are as follows:
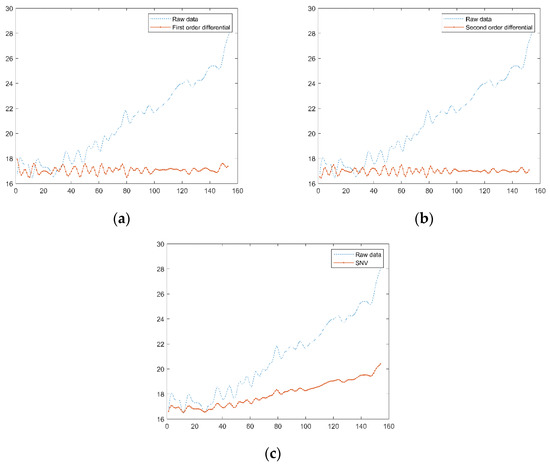
Figure 6.
Spectral curves after pre-treatment. (a) first-order differentiation, (b) second-order differentiation, (c) standard normal variable transformation.
- (1)
- First-order differentiation and second-order differentiation.
A total of 120 coal and gangue samples were collected, and each sample collects the spectral data of nine simulated working conditions respectively, so the data set contains a total of 2160 spectral data. The training and testing sets are divided in the ratio of 7:3, and the proportion of each category is guaranteed to be balanced.
PCViT is implemented in the pytorch library, and Python 3.8. web training and testing were performed on a computer with a Windows operating system, Intel Core i7-6850K CPU and GTX 1080Ti GPU. During training, we used a cross-entropy loss function and an Adam optimization algorithm with a learning rate of 0.0001. To verify the stability of the algorithm, each set of experiments was performed five times.
The success of the model in the classification study was related to the number of samples in the correct and incorrect categories. The performance criterion of the model is represented by the complexity matrix of the performance criterion of the test data. An example of the confusion matrix is given in Figure 7.
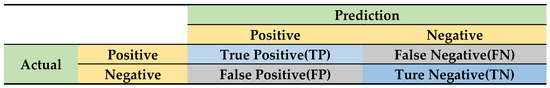
Figure 7.
Example of the confusion matrix.
Figure 8 shows the relationship between the loss and accuracy for each epoch. It is necessary to minimize the error in the recognition process. Accuracy is defined here as the ratio of the number of correctly trained data to the total number of trained data (Equation (15)). We can find that both values are converging, and the accuracy of the network is increasing as the training proceeds.
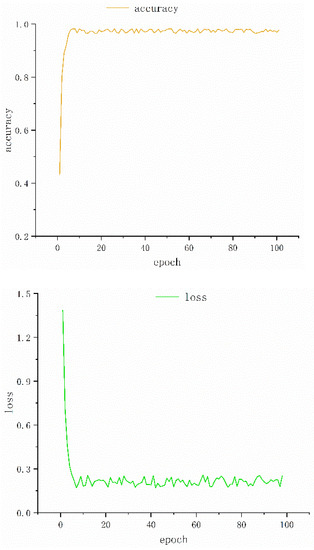
Figure 8.
Loss and accuracy of test set.
3.3. Effect of Hyperparameters
- 1.
- The scale of the filter
This section explores the effect of the scale of the filter in PCViT on the performance of the model coal gangue identification. Two network structures are built in this experiment, Conv3 and Conv7, and the ending numbers in their names indicate the size of the convolution kernel. Figure 9 shows the recognition accuracy of the model under the two convolutional kernels. It is clear that the network performance decreases when the convolutional kernel size changes from 1 × 3 to 1 × 7, which indicates that more recognition features are extracted by using smaller convolutional kernels.
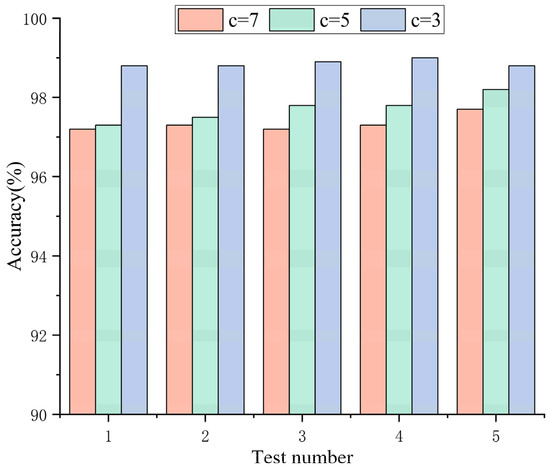
Figure 9.
The influence of the filter scale.
- 2.
- The Number of Vit Layers
This section explores the effect of the number of vit layers in PCViT on the coal gangue identification performance. Three network structures are established in this experiment—PCViT-4, PCViT-6 and PCViT-12—and the ending numbers in their names indicate the number of vit layers, The number of parameters is shown in Table 4. Figure 10 shows the recognition accuracy of the three PCViTs. It is clear that when the number of vit layers increases from four to twelve, the network performance also increases. This indicates that the optimization effects of multiple attention modules can be accumulated in the network, thus continuously improving the network performance. Although more attention modules increase the network parameters, the accuracy of PCViT-6 is improved by about 3% compared to that of PCViT-4, so the small increase in the network parameters is acceptable.
Table 4.
Number of three network parameters.
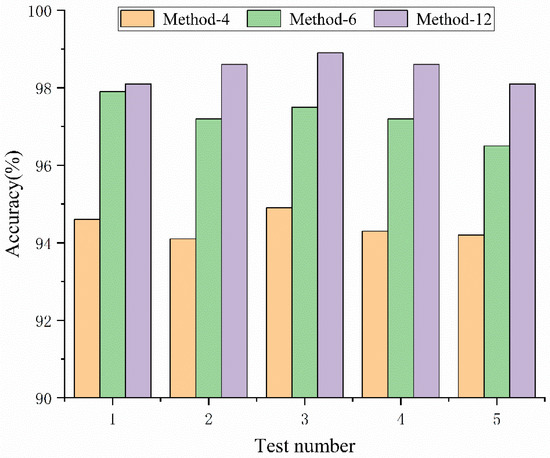
Figure 10.
The recognition accuracy of the PCViT network with different depths.
- 3.
- Comparison with other advanced networks.
The six deep learning networks are PVCT, VIT [25], Wencnn [29], MA1DCNN [30], a residual convolutional neural network based on 1DCNN (Rescnn) [31] and a deep confidence network (SAPSO-DBN) [32], and the experimental results are shown in Figure 11.
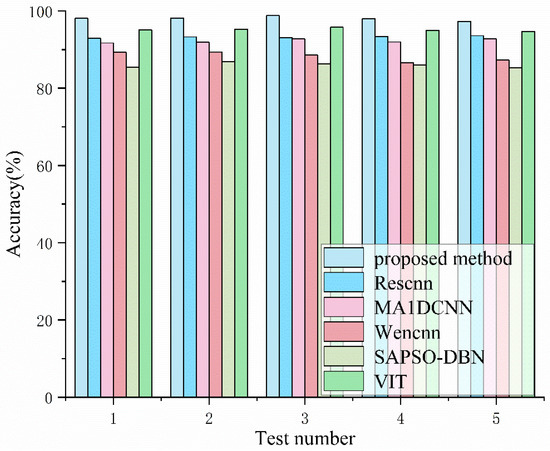
Figure 11.
Comparison of the accuracy rates of six methods.
First, we discuss the performance of the PCViT and VIT networks. As can be seen from the figure, PCViT and VIT achieve 98% and 95% recognition accuracies in the test set, respectively, which are much better than those of the other non-VIT networks, indicating that the self-attention mechanism in VIT can effectively learn the feature relationships between the coal gangue spectral data, resulting in better recognition performance. In addition, PCViT adaptively captures features related to the recognition information by pre-convolution, which is about 3% better than VIT, demonstrating the effectiveness of the preemptive use of convolution operation. Next, we discuss the performance of PCViT and the three CNN-based networks. It is clear that PCViT outperforms the three CNN-based networks in terms of recognition accuracy under all working conditions. The MA1DCNN method adds channel attention and activation attention mechanisms to CNNs, which pay more attention to the local features in the data. In contrast, the coal rock spectral data have their own peculiarities, i.e., the experimental samples of the same components produce different data in different experimental settings, and robust identification methods require the analysis of potential connections in the global data, so self-attentive mechanisms that can establish global connections are more suitable for this task. We use the t-SNE technique to visualize the final output distribution of six methods in two dimensions, and the visualization results are shown in Figure 12, where green represents coal and brown represents gangue.
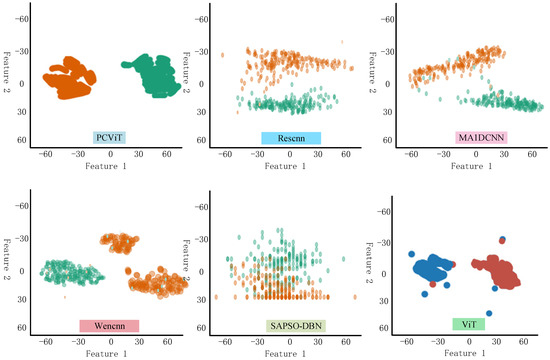
Figure 12.
Visualization results of different methods.
Finally, in order to demonstrate the good performance of the proposed new method, the identification accuracy under various working conditions is analyzed in detail in this paper, and the gangue spectral data of the ideal experimental environment are added. The confusion matrix of PCViT under nine working conditions is given in Figure 13. In this figure, the rows and columns denote the predicted labels and the true labels, respectively. The diagonal cells indicate the accuracy of gangue identification. It can be seen that the model can distinguish the test samples with high accuracy under all of the working conditions, and the recognition accuracy is still about 96% even in the most severe experimental environment (1.8 m–800 mg/m3), which indicates that PCViT has good potential for practical applications.
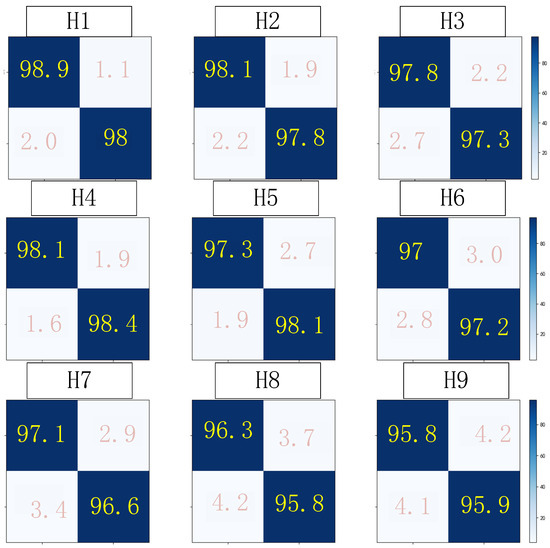
Figure 13.
Confusion matrix of nine working conditions of coal gangue identification.
Figure 14 provides the distribution of the output of PCViT prediction in two-dimensional space. The number after the letter H is the corresponding simulated experimental environment, and H0 (1.2 m-None-Full) is the data of the ideal experimental environment. As we can see from the figure, due to the characteristics of the high sensitivity of the NIR spectroscopy technique, the changes in the experimental environment do affect the gangue spectral data, and the different qualities of the experimental samples render the accurate identification of the gangue even more difficult.
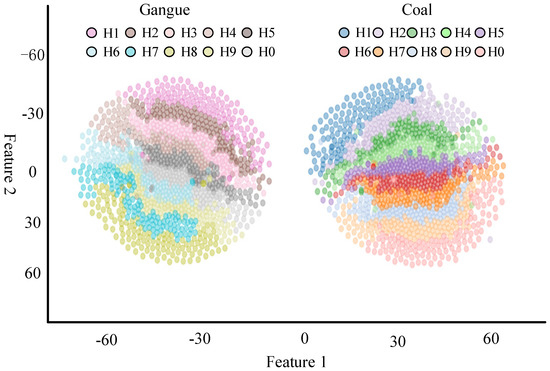
Figure 14.
t-SNE plot of prediction results.
4. Discussion
Data Assumptions
(1) The feature space of the test and training samples should be the same, i.e., they are one-dimensional signals with the same length and the same sampling frequency. (2) The label space of the test and training samples should be the same. (3) The working conditions of the test and training samples should be the same, i.e., they have the same feature distribution.
Significance and Advantages
The validity has been confirmed in Section 3. Next, we discuss the advantages of PCViT. (1) Enhanced identification of the feature learning mechanism: Starting from the characteristics of the data itself, it can be found that the different components of coal and gangue lead to different locations and peaks of their absorption peaks. The self-attention mechanism can locate the information of the feature absorption peaks and pay more attention to them so as to extract more recognition information, which is important to improving the model performance. (2) Exploring the discriminative feature learning mechanism: the feature representation in PCViT consists of activation maps extracted by different convolution kernels. The information captured by different convolutional kernels has different importance for the gangue recognition task. The neural network learning of recognition features is very redundant, and treating all features equally is harmful to network performance. Therefore, the next direction of our research is to further improve the performance of the model in combination with CBAM and to explore the impact of convolutional kernels through the hybrid domain attention mechanism.
5. Conclusions
In the process of coal mining and sorting, if the gangue content in the fine coal is too high, it will cause unnecessary pollution when burning; if the coal content in the gangue is too high, it will damage the coal yard. Good environmental adaptability and high recognition accuracy are the prerequisites for the effective separation of coal and gangue. In this paper, the PCViT coal gangue recognition model is proposed, and the local features of coal gangue spectral data are fully extracted by using the convolution operation of three small convolution kernels with a small step length. This operation solves the shortcomings of the ViT model, which ignores the local features of the data. Then, the weights of the extracted features are calculated by using the multi-headed self-attentive module in ViT to adaptively optimize the learned features in order to obtain more discriminative features. The global modeling capability of ViT solves the drawbacks of not being able to focus on the global information and the long-distance dependence caused by the local sensory field of CNN. The conclusions are summarized as follows. (1) The pre-convolution operation used has demonstrated its effectiveness for understanding and learning gangue discriminative features. (2) The proposed PCViT model applied to hyperspectral gangue identification shows significant advantages in terms of accuracy in advanced networks.
Author Contributions
For this research article, J.Y. was in charge of the methodology. B.C. was in charge of the writing, review and formal analysis. Y.Z. (Yuzeng Zhang) was in charge of the data curation and field inspection. Y.Z. (Yucheng Zhang) and W.L. were in charge of the testing and verification. All authors have read and agreed to the published version of the manuscript.
Funding
This research was funded by the Theory and Method of Excavation-Support-Anchor Parallel Control for Intelligent Excavation Complex System (Grant No. 2021101030125); the Green, Intelligent and Safe Mining of Coal Resources (Grant No. 52121003); and the Mining Robotics Engineering Discipline Innovation and Intelligence Base (Grant No. B21014).
Institutional Review Board Statement
Not applicable.
Informed Consent Statement
Not applicable.
Data Availability Statement
The data are available on request, subject to restrictions (e.g., privacy or ethical restrictions).
Acknowledgments
The study was approved by the China University of Mining and Technology (Beijing).
Conflicts of Interest
The authors declare no conflict of interest.
References
- Guofa, W.; Feng, L.; Xiangjun, M.; Jingdao, F.; Huaiwei, R. Research and practice on intelligent coal mine construction (primary stage). Coal Sci. Technol. 2019, 47, 1–36. [Google Scholar]
- Guofa, W.; Yibo, D. Development direction of intelligent coal mine and intelligent mining technology. Coal Sci. Technol. 2019, 47, 1–10. [Google Scholar]
- He, M.; Zhang, Z.; Zhu, J.; Li, N. Correlation between the constant mi of hoek–Brown criterion and porosity of intact rock. Rock Mech. Rock Eng. 2022, 55, 923–936. [Google Scholar] [CrossRef]
- He, M.; Zhang, Z.; Zhu, J.; Li, N.; Li, G.; Chen, Y. Correlation between the rockburst proneness and friction characteristics of rock materials and a new method for rockburst proneness prediction: Field demonstration. J. Pet. Sci. Eng. 2021, 205, 108997. [Google Scholar] [CrossRef]
- Gui, X.; Liu, J.; Cao, Y.; Miao, Z.; Li, S.; Xing, Y.; Wang, D. Coal preparation technology: Status and development in China. Energy Environ. 2015, 26, 997–1013. [Google Scholar] [CrossRef]
- Hou, W. Identification of coal and gangue by feed-forward neural network based on data analysis. Int. J. Coal Prep. Util. 2019, 39, 33–43. [Google Scholar] [CrossRef]
- Pu, Y.; Apel, D.B.; Szmigiel, A.; Chen, J. Image recognition of coal and coal gangue using a convolutional neural network and transfer learning. Energies 2019, 12, 1735. [Google Scholar] [CrossRef] [Green Version]
- Yunxiao, L.; Jingxuan, X. Coal downhole sorting technology and equipment. Coal Process. Compr. Util. 2011, 6, 39–42. [Google Scholar]
- Allegrini, F.; Pierna, J.F.; Fragoso, W.; Olivieri, A.C.; Baeten, V.; Dardenne, P. Regression models based on new local strategies for near infrared spectroscopic data. Anal. Chim. Acta 2016, 933, 50–58. [Google Scholar] [CrossRef]
- de Santana, F.B.; de Souza, A.M.; Poppi, R.J. Visible and near infrared spectroscopy coupled to random forest to quantify some soil quality parameters. Spectrochim. Acta Part A Mol. Biomol. Spectrosc. 2018, 191, 454–462. [Google Scholar] [CrossRef]
- Ferreiro-González, M.; Espada-Bellido, E.; Guillén-Cueto, L.; Palma, M.; Barroso, C.G.; Barbero, G.F. Rapid quantification of honey adulteration by visible-near infrared spectroscopy combined with chemometrics. Talanta 2018, 188, 288–292. [Google Scholar] [CrossRef]
- Kim, D.W.; Lee, J.M.; Kim, J.S. Application of near infrared diffuse reflectance spectroscopy for on-line measurement of coal properties. Korean J. Chem. Eng. 2009, 26, 489–495. [Google Scholar] [CrossRef]
- Yu, X.; Guo, W.; Wu, N.; Zou, L.; Lei, M. Rapid discrimination of coal geographical origin via near-infrared spectroscopy combined with machine learning algorithms. Infrared Phys. Technol. 2020, 105, 103180. [Google Scholar] [CrossRef]
- Hu, R.; Wang, Y.; Yang, M.; Li, X.; Luo, Z.; Li, G. Improved analysis of inorganic coal properties based on near-infrared reflectance spectroscopy. Anal. Methods 2015, 7, 5282–5288. [Google Scholar] [CrossRef]
- Zou, L.; Yu, X.; Li, M.; Lei, M.; Yu, H. Nondestructive identification of coal and gangue via near-infrared spectroscopy based on improved broad learning. IEEE Trans. Instrum. Meas. 2020, 69, 8043–8052. [Google Scholar] [CrossRef]
- Zou, G.; She, J.; Peng, S.; Yin, Q.; Liu, H.; Che, Y. Two-dimensional SEM image-based analysis of coal porosity and its pore structure. Int. J. Coal Sci. Technol. 2020, 7, 350–361. [Google Scholar] [CrossRef] [Green Version]
- Liang, S.; Cheng, J.; Jia, K.; Jiang, B.; Liu, Q.; Liu, S.; Xiao, Z.; Xie, X.; Yao, Y.; Yuan, W. Recent progress in land surface quantitative remote sensing. J. Remote Sens. 2016, 20, 875–898. [Google Scholar]
- Cloutis, E.A.; Pietrasz, V.B.; Kiddell, C.; Izawa, M.R.; Vernazza, P.; Burbine, T.H.; DeMeo, F.; Tait, K.T.; Bell, J.F., III; Mann, P. Spectral reflectance “deconstruction” of the Murchison CM2 carbonaceous chondrite and implications for spectroscopic investigations of dark asteroids. Icarus 2018, 305, 203–224. [Google Scholar] [CrossRef]
- Song, L.; Liu, S.; Yu, M.; Mao, Y.; Wu, L. A classification method based on the combination of visible, near-infrared and thermal infrared spectrum for coal and gangue distinguishment. Guang Pu Xue Yu Guang Pu Fen Xi = Guang Pu 2017, 37, 416–422. [Google Scholar]
- Yang, E.; Ge, S.; Wang, S. Characterization and identification of coal and carbonaceous shale using visible and near-infrared reflectance spectroscopy. J. Spectrosc. 2018, 2018, 2754908. [Google Scholar] [CrossRef] [Green Version]
- Wang, H.; Zhang, Q. Dynamic identification of coal-rock interface based on adaptive weight optimization and multi-sensor information fusion. Inf. Fusion 2019, 51, 114–128. [Google Scholar] [CrossRef]
- Guo, Y.; Ni, Y.; Kokot, S. Evaluation of chemical components and properties of the jujube fruit using near infrared spectroscopy and chemometrics. Spectrochim. Acta Part A Mol. Biomol. Spectrosc. 2016, 153, 79–86. [Google Scholar] [CrossRef]
- Basri, K.N.; Laili, A.R.; Tuhaime, N.A.; Hussain, M.N.; Bakar, J.; Sharif, Z.; Khir, M.F.A.; Zoolfakar, A.S. FT-NIR, MicroNIR and LED-MicroNIR for detection of adulteration in palm oil via PLS and LDA. Anal. Methods 2018, 10, 4143–4151. [Google Scholar] [CrossRef]
- He, C.; Chen, L.; Yang, Z.; Huang, G.; Liao, N.; Han, L. A rapid and accurate method for on-line measurement of straw–Coal blends using near infrared spectroscopy. Bioresour. Technol. 2012, 110, 314–320. [Google Scholar] [CrossRef] [PubMed]
- Dosovitskiy, A.; Beyer, L.; Kolesnikov, A.; Weissenborn, D.; Zhai, X.; Unterthiner, T.; Dehghani, M.; Minderer, M.; Heigold, G.; Gelly, S. An image is worth 16x16 words: Transformers for image recognition at scale. arXiv Prepr. 2020, arXiv:2010.11929. [Google Scholar]
- Hu, Y.; Zou, L.; Huang, X.; Lu, X. Detection and quantification of offal content in ground beef meat using vibrational spectroscopic-based chemometric analysis. Sci. Rep. 2017, 7, 15162. [Google Scholar] [CrossRef] [Green Version]
- Yang, X. Environmental Adaptation of Near-Infrared Spectroscopy for Coal Rock Identification. Master’s Thesis, China University of Mining and Technology, Beijing, China, 2020. [Google Scholar]
- Yang, J.; Chang, B.; Zhang, Y.; Luo, W.; Wu, M. Research on CNN Coal and Rock Recognition Method Based on Hyperspectral Data. Res. Sq. 2021. [Google Scholar] [CrossRef]
- Wen, L.; Li, X.; Gao, L.; Zhang, Y. A new convolutional neural network-based data-driven fault diagnosis method. IEEE Trans. Ind. Electron. 2017, 65, 5990–5998. [Google Scholar] [CrossRef]
- Wang, H.; Liu, Z.; Peng, D.; Qin, Y. Understanding and learning discriminant features based on multiattention 1DCNN for wheelset bearing fault diagnosis. IEEE Trans. Ind. Inform. 2019, 16, 5735–5745. [Google Scholar] [CrossRef]
- Zhang, W.; Li, X.; Ding, Q. Deep residual learning-based fault diagnosis method for rotating machinery. ISA Trans. 2019, 95, 295–305. [Google Scholar] [CrossRef]
- Yang, J.; Chang, B.; Wang, X.; Zhang, Q.; Wang, C.; Wang, F.; Wu, M. Design and application of deep belief network based on stochastic adaptive particle swarm optimization. Math. Probl. Eng. 2020, 2020, 6590765. [Google Scholar] [CrossRef]
Publisher’s Note: MDPI stays neutral with regard to jurisdictional claims in published maps and institutional affiliations. |
© 2022 by the authors. Licensee MDPI, Basel, Switzerland. This article is an open access article distributed under the terms and conditions of the Creative Commons Attribution (CC BY) license (https://creativecommons.org/licenses/by/4.0/).