
Simulation of the Thermal Runaway Onset in Li-Ion Cells—Influence of Cathode Materials and Operating Conditions


Abstract
:1. Introduction
2. Model Overview
3. Simulation Implementation
3.1. One-Dimensional Component
- Porous Electrode to define the charge balance for the electrodes and the electrolyte inside the pores;
- Porous Electrode Reaction to define the charge transfer reactions at the interface between the electrodes and the electrolytes;
- Separator to represent the separator properties (conductivity, diffusivity, etc.).
3.2. Two-Dimensional Component
- SEI decomposition in the range between 90 and 120 °C;
- Reactions between anode and electrolyte at T > 120 °C;
- Reactions between cathode and electrolyte at T > 170 °C;
- Electrolyte decomposition at T > 200 °C.
4. Model Results and Discussion
4.1. Single Cells
4.2. Propagation
5. Conclusions
Author Contributions
Funding
Conflicts of Interest
References
- Berckmans, G.; Messagie, M.; Smekens, J.; Omar, N.; Vanhaverbeke, L.; Van Mierlo, J. Cost Projection of State of the Art Lithium-Ion Batteries for Electric Vehicles Up to 2030. Energies 2017, 10, 1314. [Google Scholar] [CrossRef] [Green Version]
- Dunn, J.B.; Gaines, L.; Kelly, J.C.; James, C.; Gallagher, K.G. The significance of Li-ion batteries in electric vehicle life-cycle energy and emissions and recycling’s role in its reduction. Energy Environ. Sci. 2015, 8, 158–168. [Google Scholar] [CrossRef]
- Park, J.K. Principles and Applications of Lithium Secondary Batteries, 1st ed.; Wiley-VCH Verlag GmbH & Co. KGaA: Weinheim, Germany, 2012. [Google Scholar]
- Santhanagopalan, S.; Smith, K.; Neubauer, J.; Kim, G.H.; Pesaran, A.; Keyser, M. Design and Analysis of Large Lithium-Ion Battery Systems; Artech House: Miami, FL, USA, 2015. [Google Scholar]
- Feng, X.; Ouyang, M.; Liu, X.; Lu, L.; Xia, Y.; He, X. Thermal runaway mechanism of lithium ion battery for electric vehicles: A review. Energy Storage Mater. 2018, 10, 246–267. [Google Scholar] [CrossRef]
- Wen, J.; Yu, Y.; Chen, C. A Review on Lithium-Ion Batteries Safety Issues: Existing Problems and Possible Solutions. Mater. Express 2012, 2, 197–212. [Google Scholar] [CrossRef]
- Wang, Q.; Ping, P.; Zhao, X.; Chu, G.; Sun, J.; Chen, C. Thermal runaway caused fire and explosion of lithium ion battery. J. Power Sources 2012, 208, 210–224. [Google Scholar] [CrossRef]
- Hendricks, C.; Williard, N.; Mathew, S.; Pecht, M. A failure modes, mechanisms, and effects analysis (FMMEA) of lithium-ion batteries. J. Power Sources 2015, 297, 113–120. [Google Scholar] [CrossRef] [Green Version]
- Soares, F.J.; Carvalho, L.; Costa, I.C.; Iria, J.P.; Bodet, J.M.; Jacinto, G.; Lecocq, A.; Roessner, J.; Caillard, B.; Salvi, O. The STABALID project: Risk analysis of stationary Li-ion batteries for power system applications. Reliab. Eng. Syst. Saf. 2015, 140, 142–175. [Google Scholar] [CrossRef] [Green Version]
- Bubbico, R.; Greco, V.; Menale, C. Hazardous scenarios identification for Li-ion secondary batteries. Saf. Sci. 2018, 108, 72–88. [Google Scholar] [CrossRef]
- Kim, G.H.; Pesaran, A.; Spotnitz, R. A three-dimensional thermal abuse model for lithium-ion cells. J. Power Sources 2007, 170, 476–489. [Google Scholar] [CrossRef]
- Chen, Y.J.W.; Evans, J.W. Thermal Analysis of Lithium-Ion Batteries. J. Electrochem. Soc. 1996, 143, 2708–2712. [Google Scholar] [CrossRef]
- Balakrishnan, P.G.; Ramesh, R.; Prem Kumar, T. Safety mechanisms in lithium-ion batteries. J. Power Sources 2006, 155, 401–414. [Google Scholar] [CrossRef]
- Chen, S.C.; Wan, C.C.; Wang, Y.Y. Thermal analysis of lithium-ion batteries. J. Power Sources 2005, 140, 111–124. [Google Scholar] [CrossRef]
- Zhang, L.; Zhao, P.; Xu, M.; Wang, X. Computational identification of the safety regime of Li-ion battery thermal runaway. Appl. Energy 2020, 261, 114440. [Google Scholar] [CrossRef]
- Mikolajczak, C.; Kahn, M.; White, K.; Long, F.T. Lithium-Ion Batteries Hazard and Use Assessment; Springer: New York, NY, USA, 2011. [Google Scholar]
- Zhang, Z.J.; Ramadass, P.; Fang, W. Safety of Lithium-Ion Batteries. In Lithium-Ion Batteries: Advances and Applications; Pistoia, G., Ed.; Elsevier: Amsterdam, The Netherlands, 2014; pp. 409–436. [Google Scholar]
- Kaliaperumal, M.; Dharanendrakumar, M.S.; Prasanna, S.; Abhishek, K.V.; Chidambaram, R.K.; Adams, S.; Zaghib, K.; Reddy, M.V. Cause and Mitigation of Lithium-Ion Battery Failure—A Review. Materials 2021, 14, 5676. [Google Scholar] [CrossRef] [PubMed]
- Xu, B.; Lee, J.; Kwon, D.; Kong, L.; Pecht, M. Mitigation strategies for Li-ion battery thermal runaway: A review. Renew. Sustain. Energy Rev. 2021, 150, 111437. [Google Scholar] [CrossRef]
- Jeevarajan, J. Safety of commercial lithium-ion cells and batteries. In Lithium-Ion Batteries; Pistoia, G., Ed.; Elsevier: Amsterdam, The Netherlands, 2014; pp. 387–407. [Google Scholar]
- Spotnitz, R.M.; Weaver, J.; Yeduvaka, G.; Doughty, D.H.; Roth, E.P. Simulation of abuse tolerance of lithium-ion battery packs. J. Power Sources 2007, 163, 1080–1086. [Google Scholar] [CrossRef]
- Chen, Y.S.; Hu, C.C.; Li, Y.Y. The importance of heat evolution during the overcharge process and the protection mechanism of electrolyte additives for prismatic lithium ion batteries. J. Power Sources 2008, 181, 69–73. [Google Scholar] [CrossRef]
- Kise, M.; Yoshioka, S.; Kuriki, H. Relation between composition of the positive electrode and cell performance and safety of lithium-ion PTC batteries. J. Power Sources 2007, 174, 861–866. [Google Scholar] [CrossRef]
- Jossen, A.; Spath, V.; Doring, H.; Garche, J. Reliable battery operation—A challenge for the battery management system. J. Power Sources 1999, 84, 283–286. [Google Scholar] [CrossRef]
- Al-Hallaj, S.; Selman, J.R. Thermal modeling of secondary lithium batteries for electric vehicle/hybrid electric vehicle applications. J. Power Sources 2002, 110, 341–348. [Google Scholar] [CrossRef]
- Sabbah, R.; Kizilel, R.; Selman, J.R.; Al-Hallaj, S. Active (air-cooled) vs. passive (phase change material) thermal management of high power lithium-ion packs: Limitation of temperature rise and uniformity of temperature distribution. J. Power Sources 2008, 182, 630–638. [Google Scholar] [CrossRef]
- Bubbico, R.; D’Annibale, F.; Mazzarotta, B.; Menale, C. Analysis of passive temperature control systems using PCM for application to secondary batteries cooling. J. Thermal Sci. Eng. Appl. 2018, 10, 061009. [Google Scholar] [CrossRef]
- Claus, D.; Besenhard, J.O. Handbook of Battery Materials; Wiley-VCH: Weinheim, Germany, 2011. [Google Scholar]
- Yuan, X.; Liu, H.; Zhang, J. Lithium-Ion Batteries Advanced Materials and Technologies; CRC Press, Taylor & Francis Group: Boca Raton, FL, USA, 2011. [Google Scholar]
- Nitta, N.; Wu, F.; Lee, J.T.; Yushin, G. Li-ion battery materials: Present and future. Mater. Today 2015, 5, 252–264. [Google Scholar] [CrossRef]
- Goodenough, J.B.; Kim, Y. Challenges for Rechargeable Li Batteries. Chem. Mater. 2010, 22, 587–603. [Google Scholar] [CrossRef]
- Hatchard, T.D.; MacNeil, D.D.; Basu, A.; Dahn, J.R. Thermal Model of Cylindrical and Prismatic Lithium-Ion Cells. J. Electrochem. Soc. 2001, 148, A755. [Google Scholar] [CrossRef]
- Abraham, D.P.; Roth, E.P.; Kostecki, R.; McCarthy, K.; MacLaren, S.; Doughty, D.H. Diagnostic examination of thermally abused high-power lithium-ion cells. J. Power Sources 2006, 161, 648–657. [Google Scholar] [CrossRef]
- Maleki, H.; Howard, J.N. Role of the cathode and anode in heat generation of Li-ion cells as a function of state of charge. J. Power Sources 2004, 137, 117–127. [Google Scholar] [CrossRef]
- Zeng, Y.; Wu, K.; Wang, D.; Wang, Z.; Chen, L. Overcharge investigation of lithium-ion polymer batteries. J. Power Sources 2006, 160, 1302–1307. [Google Scholar] [CrossRef]
- Waag, W.; Käbitz, S.; Sauer, D.U. Experimental investigation of the lithium-ion battery impedance characteristic at various conditions and aging states and its influence on the application. Appl. Energy 2013, 102, 885–897. [Google Scholar] [CrossRef]
- Roth, E.P.; Doughty, D.H.; Franklin, J. DSC investigation of exothermic reactions occurring at elevated temperatures in lithium-ion anodes containing PVDF-based binders. J. Power Sources 2004, 134, 222–234. [Google Scholar] [CrossRef]
- Kawamura, T.; Kimura, A.; Egashira, M.; Okada, S.; Yamaki, J.-I. Thermal stability of alkyl carbonate mixed-solvent electrolytes for lithium ion cells. J. Power Sources 2002, 104, 260–264. [Google Scholar] [CrossRef]
- Maleki, H.; Deng, G.; Anani, A.; Howard, J. Thermal Stability Studies of Li-Ion Cells and Components. J. Electrochem. Soc. 1999, 146, 3224–3229. [Google Scholar] [CrossRef]
- Forgez, C.; Do, D.V.; Friedrich, G.; Morcrette, M.; Delacourt, C. Thermal modeling of a cylindrical LiFePO4/graphite lithium-ion battery. J. Power Sources 2010, 195, 2961–2968. [Google Scholar] [CrossRef]
- Wang, Q.S.; Sun, J.H.; Chen, X.F.; Chu, G.Q.; Chen, C.H. Effects of solvents and salt on the thermal stability of charged LiCoO2. Mater. Res. Bull. 2009, 44, 543–548. [Google Scholar] [CrossRef]
- Watanabe, I.; Yamaki, J. Thermalgravimetry–mass spectrometry studies on the thermal stability of graphite anodes with electrolyte in lithium-ion battery. J. Power Sources 2006, 153, 402–404. [Google Scholar] [CrossRef]
- Yang, H.; Shen, X.D. Dynamic TGA–FTIR studies on the thermal stability of lithium/graphite with electrolyte in lithium-ion cell. J. Power Sources 2007, 167, 515–519. [Google Scholar] [CrossRef]
- Pasquier, A.D.; Disma, F.; Bowmer, T.; Gozdz, A.S.; Amatucci, G.; Tarascon, J.M. Differential Scanning Calorimetry Study of the Reactivity of Carbon Anodes in Plastic Li-Ion Batteries. J. Electrochem. Soc. 1998, 145, 472–477. [Google Scholar] [CrossRef]
- Orendorff, C.J.; Roth, E.P.; Nagasubramanian, G. Experimental triggers for internal short circuits in lithium-ion cells. J. Power Sources 2011, 196, 6554–6558. [Google Scholar] [CrossRef]
- Leising, R.A.; Palazzo, M.J.; Takeuchi, E.S.; Takeuchi, K.J. Abuse Testing of Lithium-Ion Batteries: Characterization of the Overcharge Reaction of LiCoO2/Graphite Cells. J. Electrochem. Soc. 2001, 148, A838–A844. [Google Scholar] [CrossRef]
- Ohsaki, T.; Kishi, T.; Kuboki, T.; Takami, N.; Shimura, N.; Sato, Y.; Sekino, M.; Satoh, A. Overcharge reaction of lithium-ion batteries. J. Power Sources 2005, 146, 97–100. [Google Scholar] [CrossRef]
- Guo, G.; Long, B.; Cheng, B.; Zhou, S.; Xu, P.; Cao, B. Three-dimensional thermal finite element modeling of lithium-ion battery in thermal abuse application. Three-dimensional thermal finite element modeling of lithium-ion battery in thermal abuse application. J. Power Sources 2010, 195, 2393–2398. [Google Scholar] [CrossRef]
- Chen, S.C.; Wang, Y.Y.; Wan, C.C. Thermal Analysis of Spirally Wound Lithium Batteries. J. Electrochem. Soc. 2006, 153, A637–A648. [Google Scholar] [CrossRef]
- Freitas, G.C.S.; Peixoto, F.C.; Vianna, A.S. Simulation of a thermal battery using Phoenics®. J. Power Sources 2008, 179, 424–429. [Google Scholar] [CrossRef]
- Zhang, X.W. Thermal analysis of a cylindrical lithium-ion battery. Electrochim. Acta 2011, 56, 1246–1255. [Google Scholar] [CrossRef]
- Jeon, D.H.; Baek, S.M. Thermal modeling of cylindrical lithium ion battery during discharge cycle. Energy Convers. Manag. 2011, 52, 2973–2981. [Google Scholar] [CrossRef]
- Kim, U.S.; Yi, J.; Shin, C.B.; Han, T.; Park, S. Modelling the thermal behaviour of a lithium-ion battery during charge. J. Power Sources 2011, 196, 5115–5121. [Google Scholar] [CrossRef]
- Spotnitz, R.; Franklin, J. Abuse behavior of high-power, lithium-ion cells. J. Power Sources 2003, 113, 81–100. [Google Scholar] [CrossRef]
- Bharathy, S.; Parimalam, A.D.; MacIntosh, R.; Brett, L. Lucht, Decomposition Reactions of Anode Solid Electrolyte Interphase (SEI) Components with LiPF6. J. Phys. Chem. C 2017, 121, 22733–22738. [Google Scholar]
- Kriston, A.; Adanouj, I.; Ruiz, V.; Pfrang, A. Quantification and simulation of thermal decomposition reactions of Li-ion battery materials by simultaneous thermal analysis coupled with gas analysis. J. Power Sources 2019, 435, 226774. [Google Scholar] [CrossRef]
- Wang, Q.S.; Sun, J.H.; Yao, X.L.; Chen, C.H. Thermal Behavior of Lithiated Graphite with Electrolyte in Lithium-Ion Batteries. J. Electrochem. Soc. 2006, 153, A329–A333. [Google Scholar] [CrossRef]
- Shigematsu, Y.; Ue, M.; Yamaki, J. Thermal Behavior of Charged Graphite and Lix CoO2 in Electrolytes Containing Alkyl Phosphate for Lithium-Ion Cells. J. Electrochem. Soc. 2009, 156, A176–A180. [Google Scholar] [CrossRef]
- Lee, S.Y.; Kim, S.K.; Ahn, S. Performances and thermal stability of LiCoO2 cathodes encapsulated by a new gel polymer electrolyte. J. Power Sources 2007, 174, 480–483. [Google Scholar] [CrossRef]
- COMSOL. Batteries & Fuel Cells Module Application Library Manual. © 1998–2016 COMSOL.
- COMSOL. Batteries & Fuel Cells Module User’s Guide. © 1998–2018 COMSOL.
- Hu, X.; Liu, W.; Lin, X.; Xie, Y. A Comparative Study of Control-Oriented Thermal Models for Cylindrical Li-Ion Batteries. IEEE Trans. Transp. Electrif. 2019, 5, 1237–1253. [Google Scholar] [CrossRef]
- Cai, L.; White, R.E. An Efficient Electrochemical–Thermal Model for a Lithium-Ion Cell by Using the Proper Orthogonal Decomposition Method. J. Electrochem. Soc. 2010, 157, A1188–A1195. [Google Scholar] [CrossRef]
- Santhanagopalan, S.; Guo, Q.Z.; Ramadass, P.; White, R.E. Review of models for predicting the cycling performance of lithium ion batteries. J. Power Sources 2006, 156, 620–628. [Google Scholar] [CrossRef]
- Smith, K.; Wang, C.Y. Power and thermal characterization of a lithium-ion battery pack for hybrid-electric vehicles. J. Power Sources 2006, 160, 662–673. [Google Scholar] [CrossRef]
- Moya, A.A.; Castilla, J.; Horno, J. Ionic Transport in Electrochemical Cells Including Electrical Double-Layer Effects. A Network Thermodynamics Approach. J. Phys. Chem. 1995, 99, 1292–1298. [Google Scholar] [CrossRef]
- Smith, K.; Kim, G.-H.; Darcy, E.; Pesaran, A. Thermal/electrical modeling for abuse-tolerant design of lithium ion modules. Int. J. Energy Res. 2010, 34, 204–215. [Google Scholar] [CrossRef]
- Guo, M.; White, R.E. A distributed thermal model for a Li-ion electrode plate pair. J. Power Sources 2013, 221, 334–344. [Google Scholar] [CrossRef]
- Christensen, J.; Cook, D.; Albertus, P. An Efficient Parallelizable 3D Thermoelectrochemical Model of a Li-Ion Cell. J. Electrochem. Soc. 2013, 160, A2258–A2267. [Google Scholar] [CrossRef]
- Allu, S.; Kalnaus, S.; Elwasif, W.; Simunovic, S.; Turner, J.A.; Pannala, S. A new open computational framework for highly-resolved coupled three-dimensional multiphysics simulations of Li-ion cells. J. Power Sources 2014, 246, 876–886. [Google Scholar] [CrossRef]
- Baba, N.; Yoshida, H.; Nagaoka, M.; Okuda, C.; Kawauchi, S. Numerical simulation of thermal behavior of lithium-ion secondary batteries using the enhanced single particle model. J. Power Sources 2014, 252, 214–228. [Google Scholar] [CrossRef]
- Lee, K.-J.; Smith, K.; Pesaran, A.; Kim, G.-H. Three dimensional thermal-, electrical-, and electrochemical-coupled model for cylindrical wound large format lithium-ion batteries. J. Power Sources 2013, 241, 20–32. [Google Scholar] [CrossRef]
- Al Hallaj, S.; Maleki, H.; Hong, J.S.; Selman, J.R. Thermal modeling and design considerations of lithium-ion batteries. J. Power Sources 1999, 83, 1–8. [Google Scholar] [CrossRef]
- Kim, U.S.; Shin, C.B.; Kim, C.S. Effect of electrode configuration on the thermal behavior of a lithium-polymer battery. J. Power Sources 2008, 180, 909–916. [Google Scholar] [CrossRef]
- Melcher, A.; Ziebert, C.; Rohde, M.; Seifert, H.J. Modeling and Simulation of the Thermal Runaway Behavior Li-Ion Cells-Computing of Critical Parameters. Energies 2016, 9, 292. [Google Scholar] [CrossRef] [Green Version]
- Melcher, A.; Ziebert, C.; Lei, B.; Zhao, W.; Luo, J.; Rohde, M.; Seifert, H.J. Modeling and Simulation of the Thermal Runaway in Cylindrical 18650 Lithium-Ion Batteries. In Proceedings of the 2016 COMSOL Conference, Munich, Germany, 12–14 October 2016. [Google Scholar]
- Lopez, C.F.; Jeevarajan, J.A.; Mukherjee, P.P. Mukherjee, Characterization of Lithium-Ion Battery Thermal Abuse Behavior Using Experimental and Computational Analysis. J. Electrochem. Soc. 2015, 162, A2163–A2173. [Google Scholar] [CrossRef]
- Xu, J.; Hendricks, C. A multiphysics Simulation of thermal Runaway in Large-Format Lithium-ion Batteries. In Proceedings of the 18th IEEE ITHERM Conference, Las Vegas, NV, USA, 28–31 May 2019. [Google Scholar]
- Frank-Kamentstskij, D.A. Diffusion and Heat Transfer in Chemical Kinetics; Plenum Press: New York, NY, USA, 1969. [Google Scholar]
- Roetzel, W.; Spang, B. C3 Typical Values of Overall Heat Transfer Coefficients. In VDI Heat Atlas; Springer: Berlin/Heidelberg, Germany, 2010. [Google Scholar]
- Huo, Y.; Rao, Z.; Liu, X.; Zhao, J. Investigation of power battery thermal management by using mini-channel cold plate. Energy Convers. Manag. 2015, 89, 387–395. [Google Scholar] [CrossRef]
- Fouchard, D.; Xie, L.; Ebner, W.; Megahed, S.A. Rechargeable Lithium and Lithium Ion (RCT) Batteries; PV, 94-28; Megahed, S.A., Ed.; Electrochemical Society: Miami Beach, FL, USA, 1994. [Google Scholar]
- Mendoza-Hernandez, O.S.; Ishikawa, H.; Nishikawa, Y.; Maruyama, Y.; Umeda, M. Cathode material comparison of thermal runaway behavior of Li-ion cells at different state of charges including over charge. J. Power Sources 2015, 280, 499–504. [Google Scholar] [CrossRef]
- Jiang, J.; Dahn, J.R. ARC studies of the thermal stability of three different cathode materials: LiCoO2; Li[Ni0.1Co0.8Mn0.1]O2; and LiFePO4, in LiPF6 and LiBoB EC/DEC electrolytes. Electrochem. Commun. 2004, 6, 39–43. [Google Scholar] [CrossRef]
- Onda, K.; Ohshima, T.; Nakayama, M.; Fukuda, K.; Araki, T. Thermal behavior of small lithium-ion battery during rapid charge and discharge cycles. J. Power Sources 2006, 158, 535–542. [Google Scholar] [CrossRef]
- Vetter, J.; Novák, P.; Wagner, M.R.; Veit, C.; Möller, K.C.; Besenhard, J.O.; Winter, M.; Wohlfahrt-Mehrens, M.; Vogler, C.; Hammouche, A. Ageing mechanisms in lithium-ion batteries. J. Power Sources 2005, 147, 269–281. [Google Scholar] [CrossRef]
- Wu, C.; Zhu, C.; Ge, Y.; Zhao, Y. A Review on Fault Mechanism and Diagnosis Approach for Li-Ion Batteries. J. Nanomater. 2015, 2015, 9. [Google Scholar] [CrossRef] [Green Version]
- Menale, C.; D’Annibale, F.; Mazzarotta, B.; Bubbico, R. Thermal management of lithium-ion batteries: An experimental investigation. Energy 2019, 182, 57–71. [Google Scholar] [CrossRef]
- Wang, Y.; Yan, X.; Bie, X.; Fu, Q.; Du, F.; Chen, G.; Wang, C.; Wei, Y. Effects of Aging in Electrolyte on the Structural and Electrochemical Properties of the Li[Li0.18Ni0.15Co0.15Mn0.52]O2 Cathode Material. Electrochim. Acta 2014, 116, 250–257. [Google Scholar] [CrossRef]
- Bodenes, L.; Naturel, R.; Martinez, H.; Dedryvère, R.; Menetrier, M.; Croguennec, L.; Pérès, J.P.; Tessier, C.; Fischer, F. Lithium secondary batteries working at very high temperature: Capacity fade and understanding of aging mechanisms. J. Power Sources 2013, 236, 265–275. [Google Scholar] [CrossRef]
- Abada, S.; Marlair, G.; Lecocq, A.; Petit, M.; Sauvant-Moynot, V.; Huet, F. Safety focused modeling of lithium-ion batteries: A review. J. Power Sources 2016, 306, 178–192. [Google Scholar] [CrossRef]
- Green, D.V.; Perry, R.H. Perry’s Chemical Engineers’ Handbook, 8th ed.; McGraw-Hill Professional Publishing: Blacklick, OH, USA, 2007. [Google Scholar]


| L_anode | 55 μm | Negative electrode thickness |
| L_separator | 30 μm | Separator thickness |
| L_cathode | 55 μm | Positive electrode thickness |
| L_cc_negative | 7 μm | Negative collector thickness |
| L_cc_positive | 10 μm | Positive collector thickness |
| L_cell 1 | 157 μm | Cell thickness |
| r_cell [m] | 9 × 10⁻³ | Cell radius |
| h_cell [m] | 6.5 × 10⁻² | Cell height |
| r_mandrel [m] | 2 × 10⁻³ | Mandrel radius |
| r_connector [m] | 3 × 10⁻³ | Connector radius |
| h_connettor [m] | 3 × 10⁻³ | Connector height |
| d_can [m] | 0.25 × 10⁻³ | External can thickness |
| Material | k [W/mK] | cp [J/kgK] | ρ [kg/m3] | Source |
|---|---|---|---|---|
| Copper | 298.15 | 385 | 8933 | [75] |
| Aluminum | 170 | 875 | 2770 | [75] |
| Separator | 0.344 | 1978 | 1009 | [75] |
| Graphite | 1.04 | 1437 | 1347 | [75] |
| LCO | 1.48 | 700 | 2500 | [77] |
| LMO | 1.58 | 1269 | 2329 | [60] |
| NMC | 3.4 | 1000 | 2500 | [60] |
| LFP | 1.48 | 1260 | 1500 | [77] |
| Nondimensional Concentration ci,0 | |||||
|---|---|---|---|---|---|
| SEI decomposition | 2.57 × 10⁵ | 1.667 × 10¹⁵ | 1.3508 × 10⁵ | 1.39 × 10³ | 0.15 |
| Anode reactions | 1.714 × 10⁶ | 2.5 × 10¹³ | 1.3508 × 10⁵ | 1.39 × 10³ | 0.75 |
| Cathode reactions | 3.14 × 10⁵ | 6.667 × 10¹³ | 1.396 × 10⁵ | 1.3 × 10³ | 0.0384 |
| Electrolyte decomposition | 1.55 × 10⁵ | 5.14 × 1025 | 2.74 × 10⁵ | 5 × 10² | 1 |
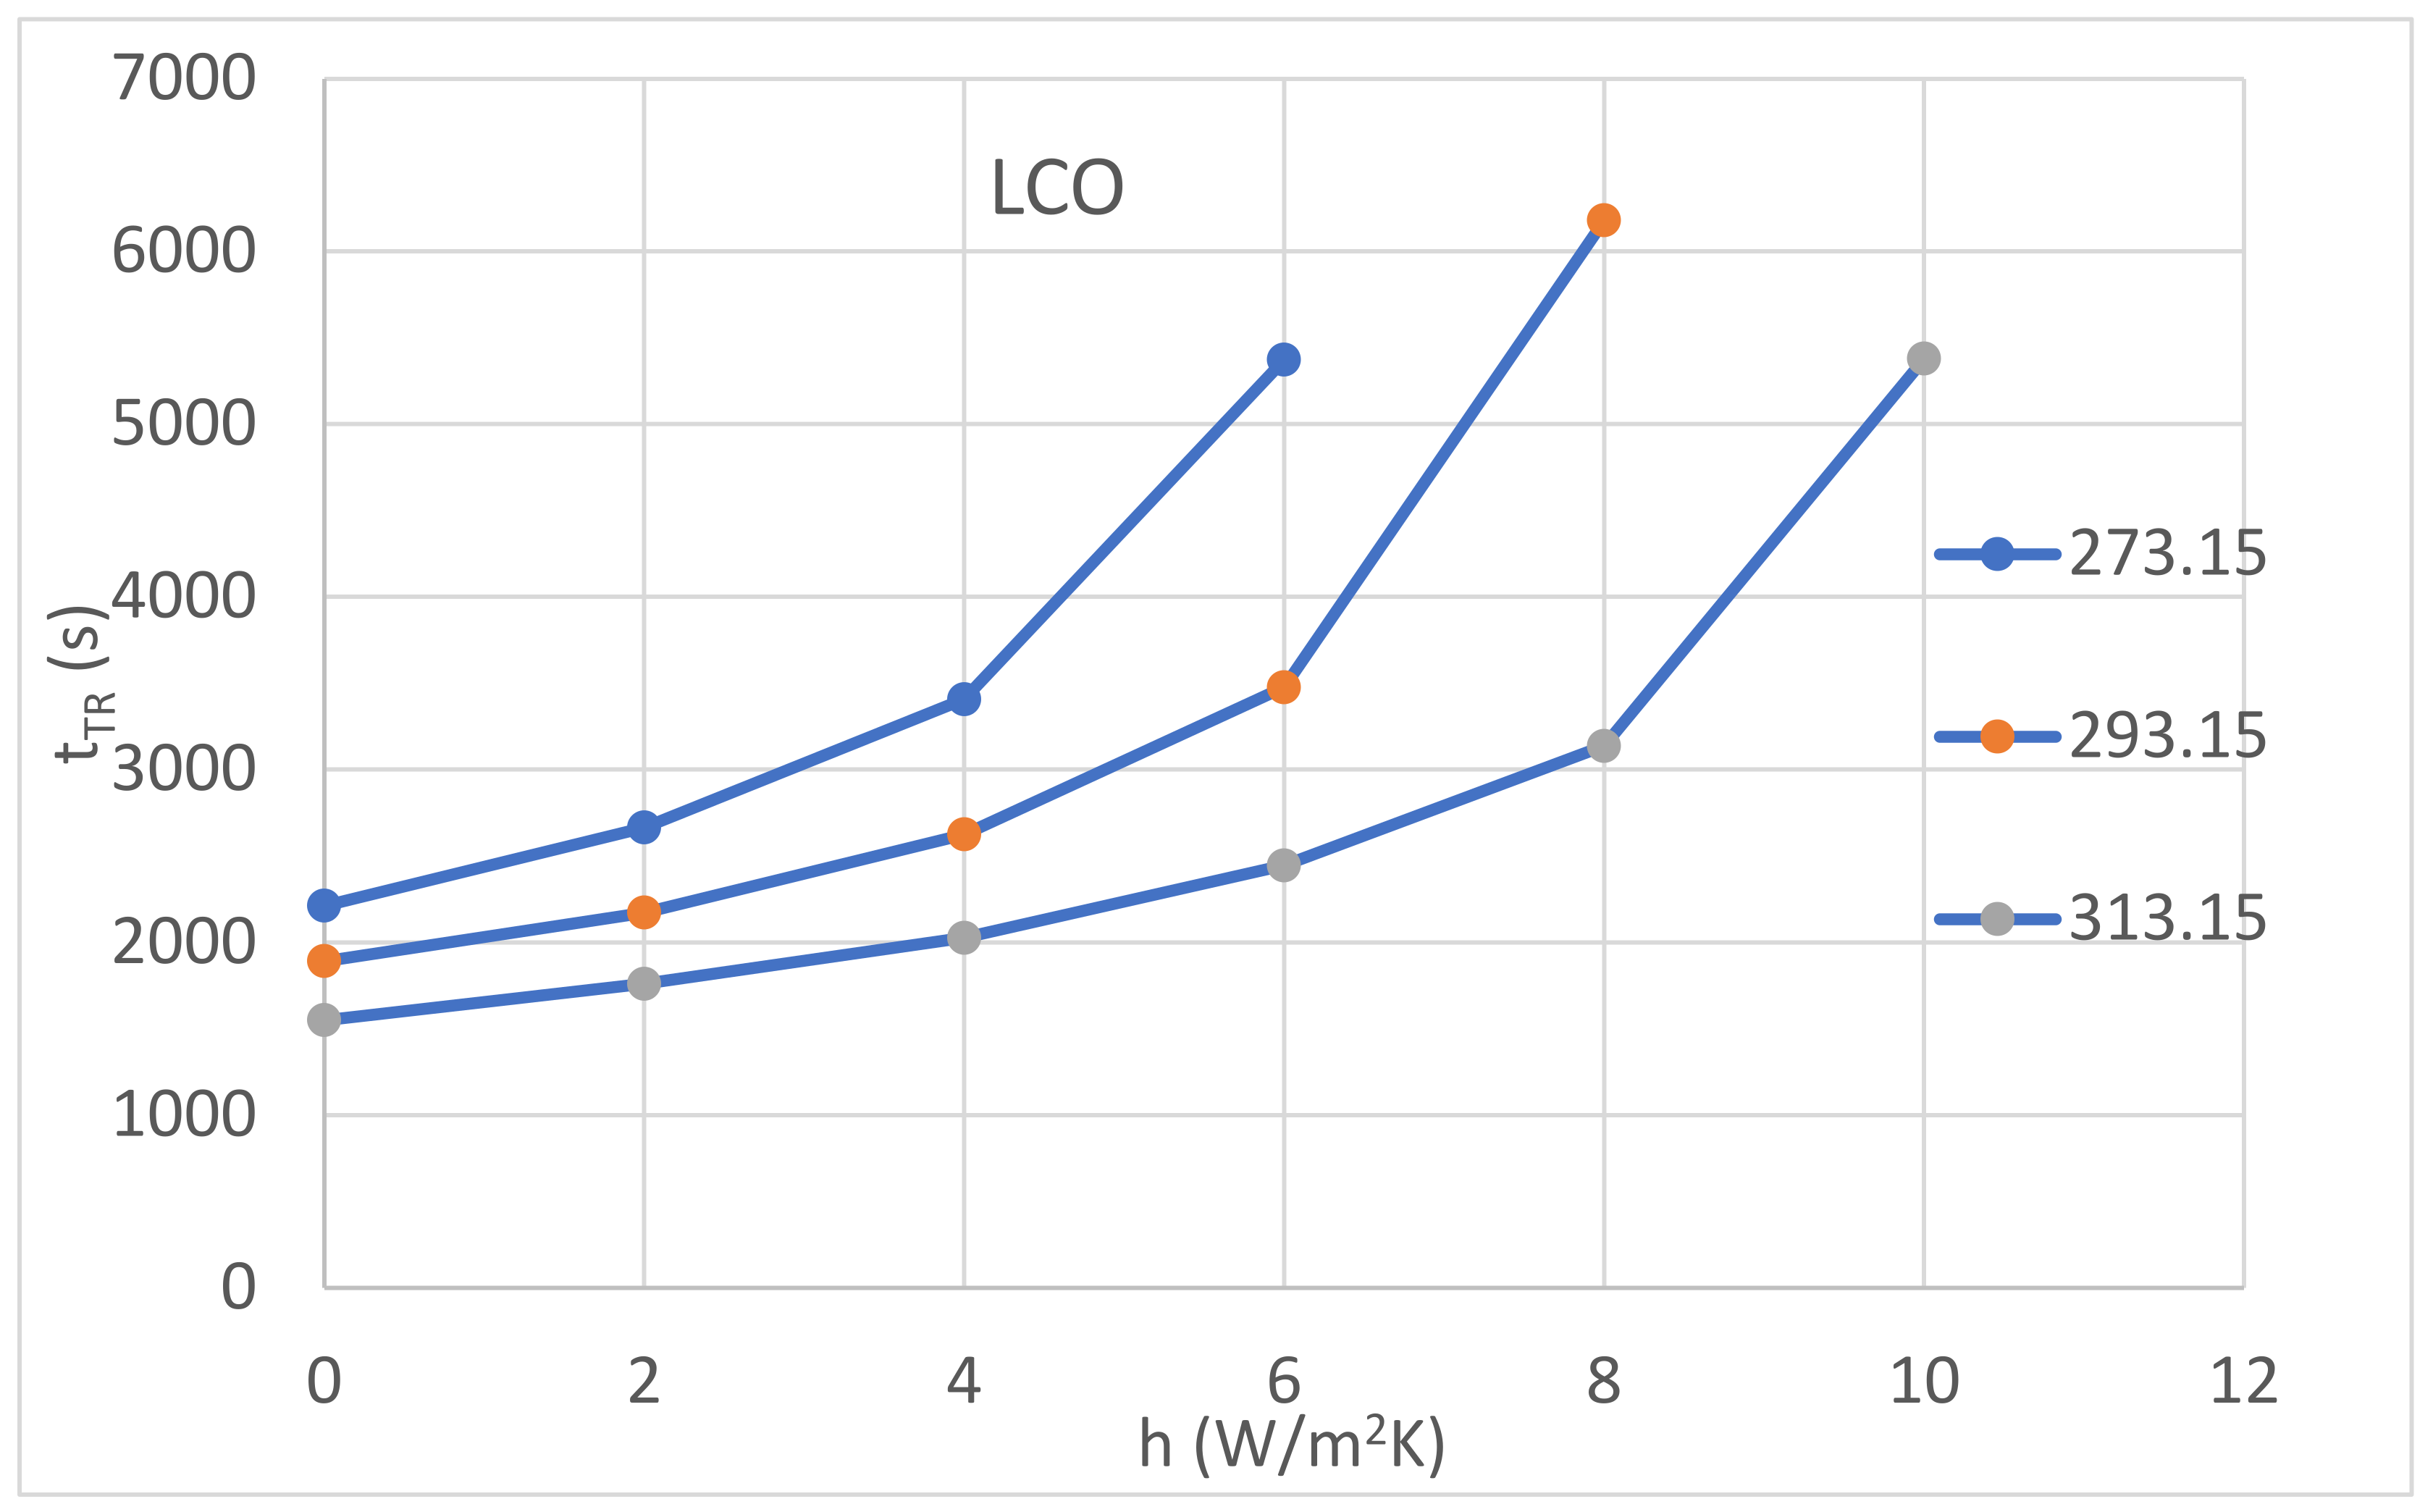
| h (W/m2K) | 0 | 2 | 4 | 6 | 8 | 10 | |
|---|---|---|---|---|---|---|---|
| Tenv (K) | |||||||
| 273.15 K | 2213 | 2665 | 3408 | 5374 | |||
| 293.15 K | 1892 | 2172 | 2624 | 3476 | 6179 | ||
| 313.15 K | 1550 | 1760 | 2026 | 2445 | 3137 | 5379 | |
| 333.15 K | 1252 | 1378 | 1525 | 1727 | 2024 | 2513 | |
| 353.15 K | 1113 | 1163 | 1278 | 1388 | 1627 | 1798 | |
| 373.15 K | 983 | 1047 | 1115 | 1229 | 1311 | 1474 | |
| Cathode Material | Initial Temperature (K) | tR (s) | |||||
|---|---|---|---|---|---|---|---|
| h = 0 W/m2K | h = 2 W/m2K | h = 4 W/m2K | h = 6 W/m2K | h = 8 W/m2K | h = 10 W/m2K | ||
| LCO | 273.15 | 2212 | 2664 | 3407 | 5373 | ||
| 293.15 | 1892 | 2172 | 2624 | 3476 | 6179 | ||
| 313.15 | 1550 | 1760 | 2026 | 2445 | 3137 | 5379 | |
| LMO | 273.15 | 2274 | 2773 | 3704 | 6443 | ||
| 293.15 | 2115 | 2579 | 3064 | 3844 | 7519 | ||
| 313.15 | 1578 | 1792 | 2083 | 2503 | 3254 | 5394 | |
| NMC | 273.15 | 2313 | 2848 | 3890 | 7656 | ||
| 293.15 | 2330 | 2842 | 3788 | 4821 | 8055 | ||
| 313.15 | 1612 | 1822 | 2118 | 2585 | 3467 | 6475 | |
| LFP | 273.15 | 2394 | 3078 | 4664 | |||
| 293.15 | 2859 | 3565 | 4733 | 6515 | |||
| 313.15 | 1727 | 2015 | 2346 | 3067 | 4967 | ||
| β [K−1] | 2.38 × 10⁻³ | Volumetric expansion coefficient |
| L [m] | 0.065 | Characteristic dimension |
| μ [Pa·s] | 2.4 × 10⁻⁵ | Viscosity |
| ρ [kg/m3] | 0.84 | Air density |
| cp [J/kgK] | 827.8 | Specific heat capacity |
| k [W/mK] | 3.45 × 10⁻² | Thermal conductivity |
| Cathode Material | tR (s) Text = 420 K, h = 7.5 W/m2K | tR (s) Text = 293 K, h = 0 W/m2K |
|---|---|---|
| LCO | 790 | 1892 |
| LMO | 1027 | 2115 |
| NMC | 1154 | 2330 |
| LFP | 1522 | 2859 |
Publisher’s Note: MDPI stays neutral with regard to jurisdictional claims in published maps and institutional affiliations. |
© 2022 by the authors. Licensee MDPI, Basel, Switzerland. This article is an open access article distributed under the terms and conditions of the Creative Commons Attribution (CC BY) license (https://creativecommons.org/licenses/by/4.0/).
Share and Cite
Cianciullo, M.; Vilardi, G.; Mazzarotta, B.; Bubbico, R. Simulation of the Thermal Runaway Onset in Li-Ion Cells—Influence of Cathode Materials and Operating Conditions. Energies 2022, 15, 4169. https://doi.org/10.3390/en15114169
Cianciullo M, Vilardi G, Mazzarotta B, Bubbico R. Simulation of the Thermal Runaway Onset in Li-Ion Cells—Influence of Cathode Materials and Operating Conditions. Energies. 2022; 15(11):4169. https://doi.org/10.3390/en15114169
Chicago/Turabian StyleCianciullo, Martina, Giorgio Vilardi, Barbara Mazzarotta, and Roberto Bubbico. 2022. "Simulation of the Thermal Runaway Onset in Li-Ion Cells—Influence of Cathode Materials and Operating Conditions" Energies 15, no. 11: 4169. https://doi.org/10.3390/en15114169
APA StyleCianciullo, M., Vilardi, G., Mazzarotta, B., & Bubbico, R. (2022). Simulation of the Thermal Runaway Onset in Li-Ion Cells—Influence of Cathode Materials and Operating Conditions. Energies, 15(11), 4169. https://doi.org/10.3390/en15114169