Article

Stability Analysis of a Typical Salt Cavern Gas Storage in the Jintan Area of China

1
CNPC Engineering Technology R&D Company Limited, Beijing 102206, China
2
School of Mechanical Engineering, Yangtze University, Jingzhou 434023, China
3
Geosciences Barcelona CSIC, Spanish National Research Council, 08028 Barcelona, Spain
*
Author to whom correspondence should be addressed.
Energies 2022, 15(11), 4167; https://doi.org/10.3390/en15114167
Submission received: 5 May 2022 / Revised: 22 May 2022 / Accepted: 2 June 2022 / Published: 6 June 2022

Abstract

:
Using underground space to store natural gas resources is an important means by which to solve emergency peak shaving of natural gas. Rock salt gas storage is widely recognized due to its high-efficiency peak shaving and environmental protection. Damage and stress concentrations inside the cavern injection during withdrawal operations and throughout the storage facility life have always been among the most important safety issues. Therefore, accurate evaluation of the stability of rock salt gas storage during operation is of paramount significance to field management and safety control. In this study, we used the finite element numerical analysis software Flac3D to numerically simulate large displacement deformations of the cavern wall during gas storage—in addition to the distribution of the plastic zone of the rock around the cavern and the surface settlement—under different working conditions. We found that the maximum surface settlement value occurred near the upper part of the cavern. The surface settlement value increased as a function of creep time, but this increase leveled off, that is, a convergence trend was observed. The value was relatively small and, therefore, had little impact on the surface. The application of gas pressure inhibited the growth of the plastic zone, but on the whole, the plastic zone’s range increased proportionally to creep time. For the 20-year creep condition, the deformation value of the cavern’s surrounding rock was large. Combined with the distribution of the plastic zone, we believe that the cavern’s surrounding rock is unstable; thus, corresponding reinforcement measures must be taken.

1. Introduction

Salt cavern gas storage is a technology that uses artificial methods to create cavern space in order to store gas in underground thick rock salt strata or salt domes [1,2]. The construction of salt cavern gas storage generally employs the water-soluble mining method. Its depth, capacity, spacing, and pressure are determined according to different terrains and geological conditions. Salt caverns are deeply buried hundreds to thousands of meters underground [3,4]. They have stable mechanical properties and a strong load capacity and can adapt to alternating changes in storage pressure. At the same time, rock salt has certain plasticity under high pressure, as well as a self-healing capacity [5]. Its permeability is low, which ensures an air-tight storage cavern. In addition, the mining techniques used to study salt caverns are well-established, giving the advantages of a large gas storage capacity, long life, as well as low operation and maintenance costs. At present, it is widely used in the storage of compressed natural gas, oil, and high-pressure air, as well as other related products. The idea of using salt mounds and salt layers to build storage was first proposed in Germany and won a patent in 1916 [6]. In 1959, the Soviet Union built the world’s first salt cavern gas storage, with the technology being rapidly promoted in Europe and the United States [7]. The first salt cavern gas storage in the United States was built in Marysville, Michigan, in 1961; the gas storage supplies gas as of 1968. The working gas volume was 6 × 10⁶ m3, and its pressure was 7.2 MPa [8]. In the 1990s, 20 salt cavern gas storage facilities were built in the United States. By 2009, 31 salt cavern gas storage facilities had been built there, which played a vital role in dealing with the peak shaving of natural gas. In addition, Canada, France, Germany, the United Kingdom, Denmark, Poland, and other countries have built a number of salt cavern gas storage installations in the last century [1,9]. As of 2009, there were 74 salt cavern gas reservoirs in the world used for natural gas storage, accounting for 11.7% of the total number of natural gas reservoirs. The total storage capacity was 229.42 × 10⁸ m3, the working gas volume was 161.98 × 10⁸ m3, and it accounted for 70.6% of the total storage capacity [6,10,11,12].
In order to meet the demand for seasonal peak shaving and the supply of natural gas between cities, the national energy strategic reserve and the carbon neutrality policy in China have led to the preparation and building of gas reservoirs in Jintan (Jiangsu Province), Xiangguo Temple in Chongqing, and Pingdingshan, located in Henan. Six gas storage centers are expected to be built nationwide. Globally, the long-term operation of salt cavern gas storage, gas leakage, cavern shrinkage, surface subsidence, and the overall failure of gas storage can occur from time to time. Compared with the construction of salt dome reservoirs with mature technology, the salt cavern gas storage in China exhibits the constraints of a low salt-layer grade and an irregular salt-cavern shape, which implies higher requirements for the stability of salt cavern and the safety evaluation of reservoir operations [12,13,14].
Usually, during salt gas storage, completion of cavern construction, and later during the operation, the formation stress is affected due to the solubility of cavern minerals and as a result of injection–production operations. This new condition may be compromised in the stress equilibrium state of the gas storage facility. When the rock salt is in an unbalanced stress state, the gas storage cavern can be subject to new stress conditions caused by displacement, deformation, and stress redistribution of the surrounding rock. When the redistribution of these stresses in the surrounding rock reaches or exceeds the rock salt deformation limit, it will cause volume shrinkage of the cavern and even lead to surface subsidence, resulting in possible damages to equipment such as injection and mining strings [13,15]. Such situations have occurred in the past. For example, surface subsidence occurred during the operation of the Berkaoui rock salt gas storage in Algeria, causing the formation of a 350 m diameter depression. Another well-known example is liquefied petroleum gas stored in the Brenham salt cavern in the United States, where leakage into the ground was explained as caused by leakage from the injection well, causing serious explosive accidents [8]. The Tersanne salt cavern gas storage in France was damaged, and the overall failure of the gas storage cavern occurred after 10 years of operation due to a 30% volume reduction in the storage capacity [16]. Therefore, the lessons learned from past experiences are that the safety of salt cavern gas storage is mainly compromised by two factors: potential damage to the surrounding rock of the gas storage and to leakage of the cavern. Consequently, ensuring the safe and stable operation of the gas storage facilities requires in-depth knowledge of these potential hazards and conditions.
In order to address these potential scenarios, in the present study, based on a numerical simulation of a real underground gas storage site (Figure 1), we analyzed the deformation of the salt chamber in three different calculations in order to confirm the feasibility of the working conditions. A numerical simulation was carried out while accounting for three characteristics: (i) the large displacement deformation of the cavern wall of the gas storage under different working conditions, (ii) the distribution of the plastic zone of the rock around the cavern, and (iii) the surface settlement. Before the numerical calculation, some constitutive relations are needed to describe the creep characteristics of rock salt. Through more in-depth research, the creep constitutive model of rock salt gradually evolves from the early elastic model to an elastic–plastic model, which reflects the special mechanical properties of rock salt more accurately [17,18].
Until now, the safety evaluation of rock salt gas storage was mainly studied by means of numerical simulations and has not yet been tested as a unified standard. Based on previous studies of rock salt stability for gas storage around the world, we simulated the long-term stability of a well in Jintan, China, under different load conditions using the finite difference software Flac3D. We also took into account the creep time of the gas storage under the actual injection and production operation conditions, thus providing a useful real-world constraint for its long-term safe operation.

2. Constitutive Model of Rock Salt

2.1. Elastic–Plastic Constitutive Model

For static analysis, we used the classical Mohr–Coulomb strength theory. This theory is essentially a shear stress strength theory, which comprehensively reflects the strength characteristics of the rock. It is applicable to both plastic rock and brittle rock shear failure and also points out the characteristic that the tensile strength of rock is far less than its compressive strength. This theory is widely used in rock engineering practice [10,19].
The expression of the Mohr–Coulomb criterion is as follows:
τ = c + σ tan φ
where τ is shear stress, σ is normal stress on the failure surface, c is the cohesive force, and φ is the internal friction angle.
τ = σ 1 σ 3 2 cos φ
τ = σ 1 + σ 3 2 σ 1 σ 3 2 sin φ
In terms of principal stresses, Equation (1) can be written as
f = σ 1 σ 3 2 cos φ ( σ 1 + σ 3 2 σ 1 σ 3 2 sin φ ) tan φ c
where σ 1 and σ 3 are the maximum and minimum principal stresses, respectively. If f = 0 , rock salt undergoes shear failure, and if f < 0 , it does not.
In order to simulate the possible tensile failure of the cavern under high internal pressure, it is necessary to construct the yield function of tensile failure, which is usually determined by the maximum tensile stress of rock that does not exceed its tensile strength:
f t = σ 3 σ t
where σ t is the tensile strength of rock salt. If f t = 0 , rock salt undergoes tensile failure, and if f t < 0 , it does not.

2.2. CPOWER Visco-Elastoplastic Creep Constitutive Model

Rock salt is a special kind of rock. When it is in an unbalanced stress state, it will undergo continuous creep, which is controlled by dislocation and its specific intracrystalline interface. By observing the stress–strain curve, we can see that rock salt may produce a small instantaneous elastic deformation at the same time and then enter the inelastic deformation stage, continuing to creep.
The constitutive equation of the stable creep strain rate of rock salt is the power-law function of stress deviation acting on it and the exponential function of energy and temperature.
It can be expressed as follows:
ε ˙ ( t ) = A q n
where q = 3 J 2 , J 2 is the second stress deviation invariant, and A and n are the experimental constants of rock salt materials.

3. Single Chamber Model of Rock Salt Gas Storage

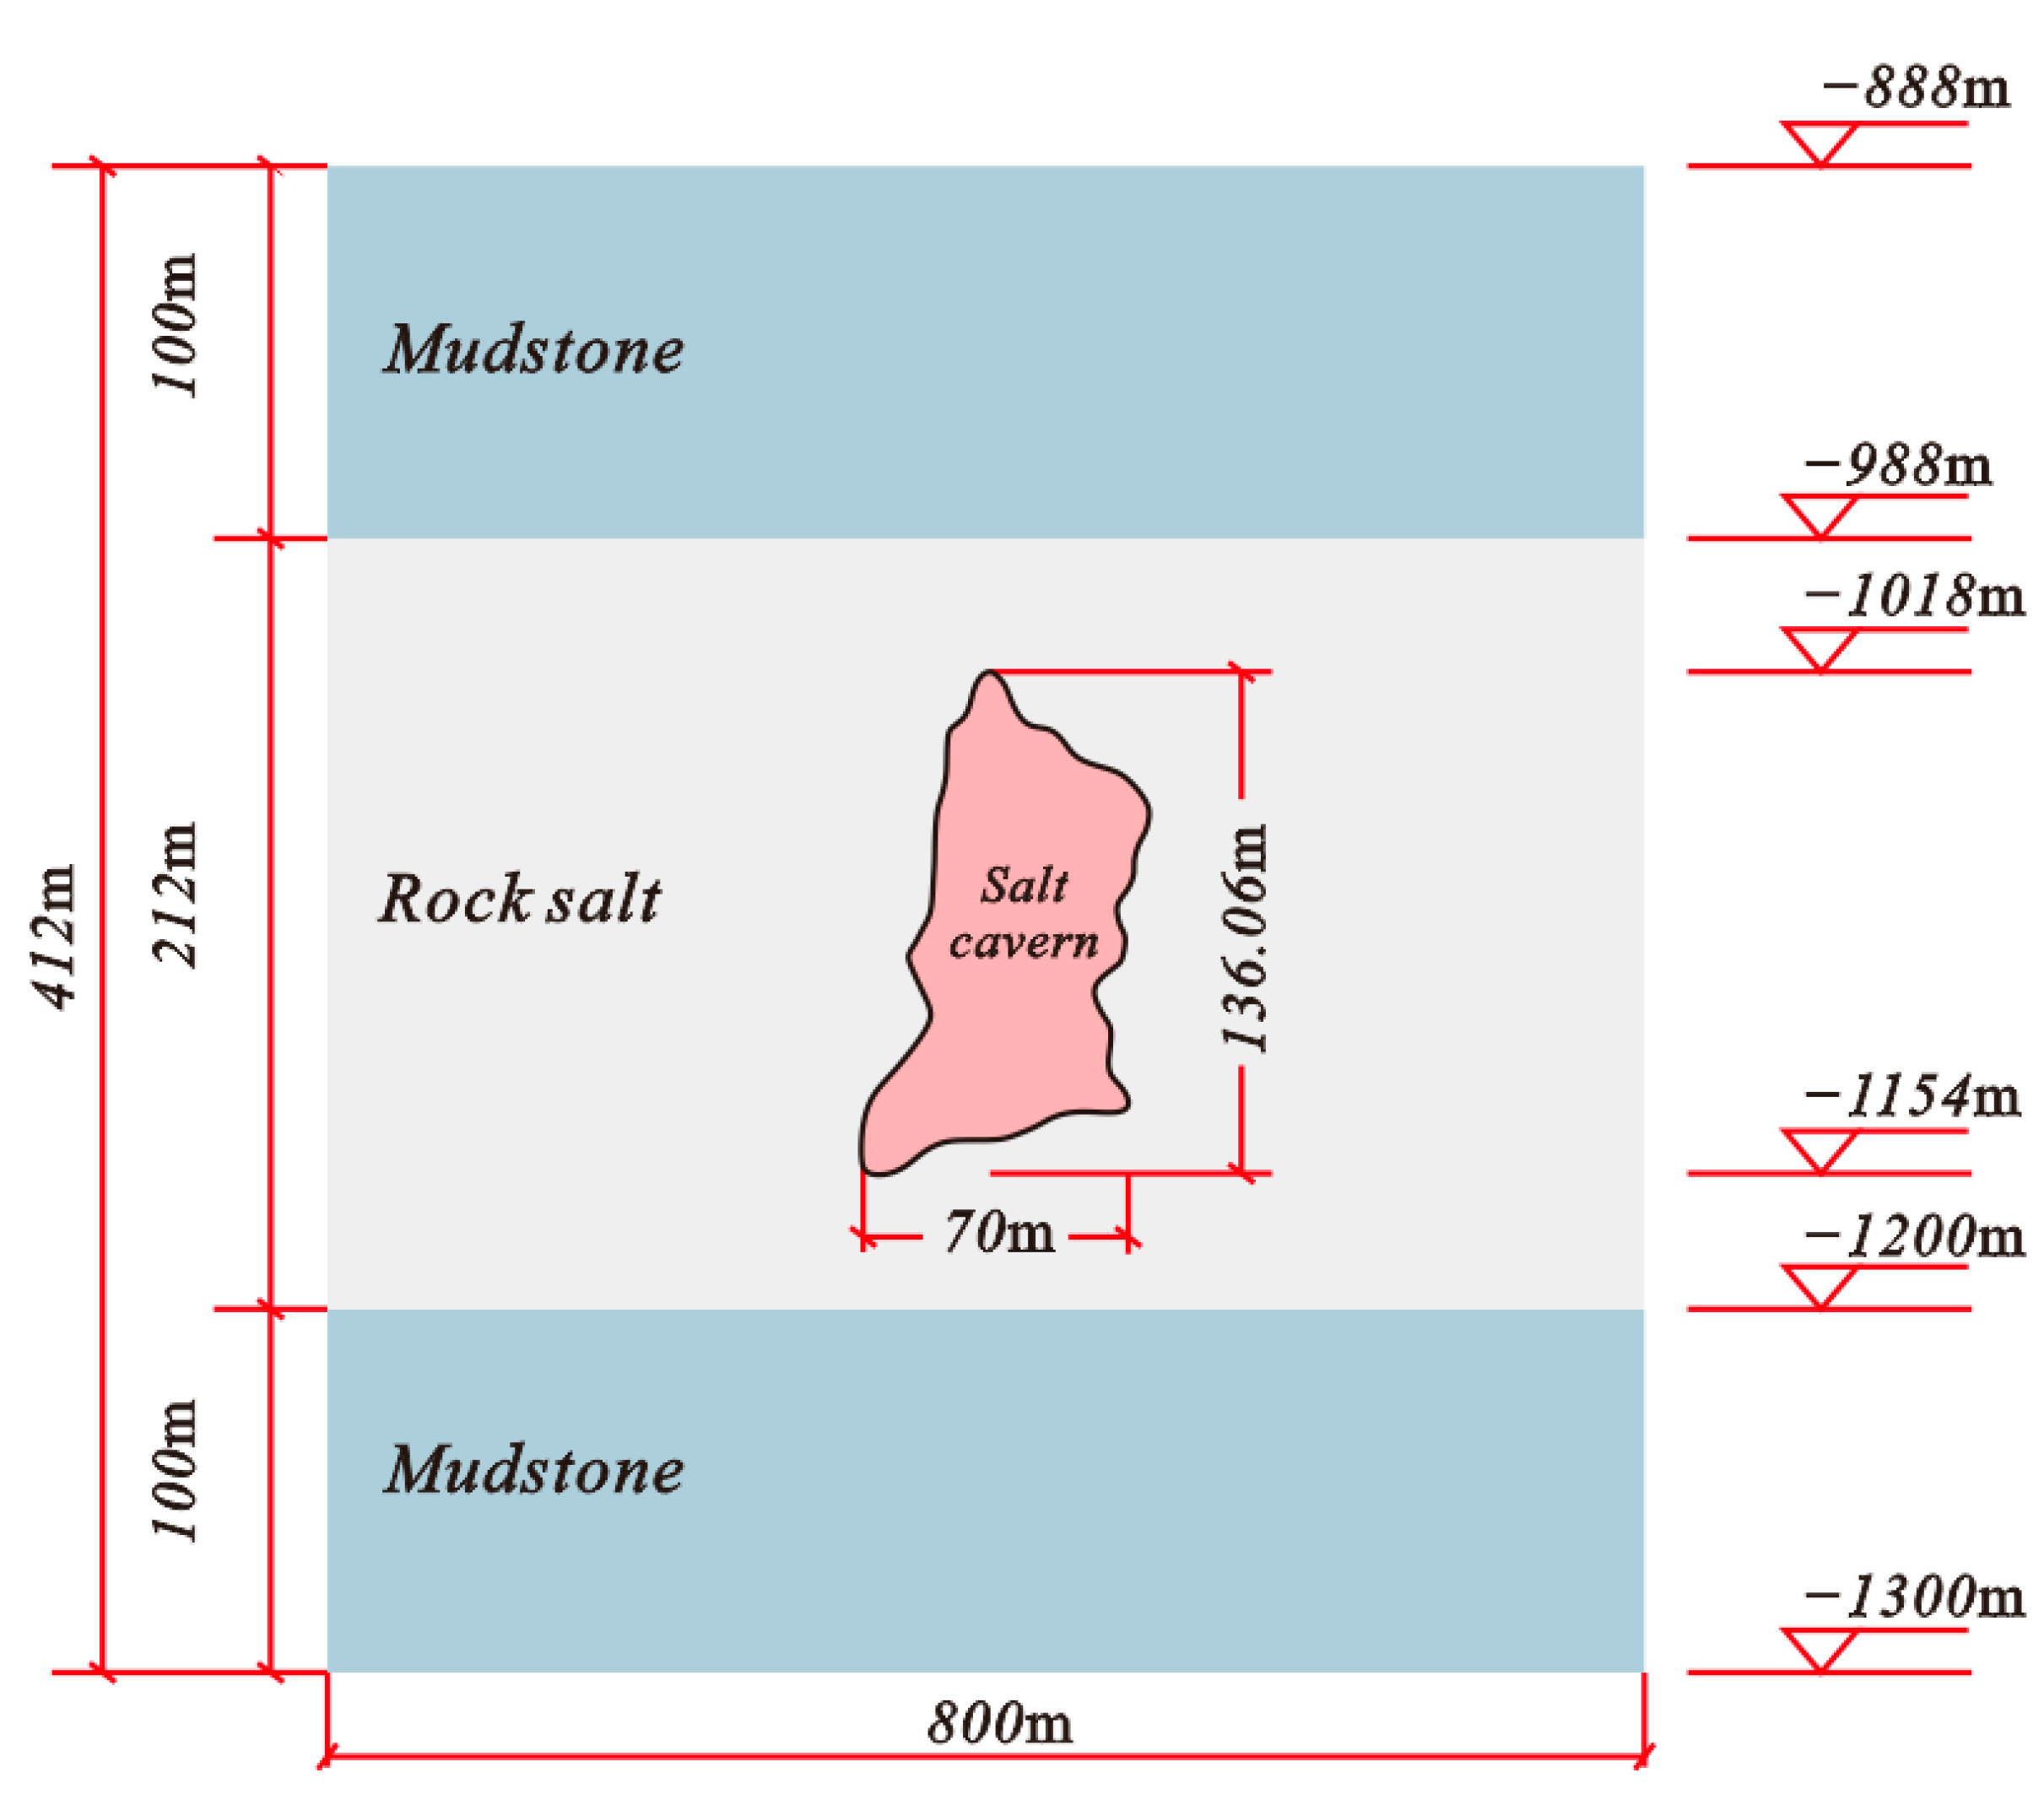
3.1. Basic Geological Conditions of the Salt Mine

According to the field data, the distribution of salt deposits in the Jintan area is relatively stable in the plane and axial directions, and the distribution of rock salt strata is gentle, with just small fluctuations. The axial profile structure is simple, and it is mainly distributed across three main ore beds from top to bottom. The burial depth at the top of the numerical calculation model is 888 m, the thickness of the overlying mudstone is 100 m, the thickness of the rock salt stratum is 212 m, and the thickness of the mudstone at the bottom of the salt stratum is 100 m [20,21,22]. In the axial direction of the cavern, the top burial depth of the salt cavern is 1018 m, the bottom burial depth is 1154 m, the volume is about 256,317 m3, the maximum horizontal width of the cavern is 70 m, and it has an axial height of 136 m [23]. The axial geological profile of the calculated area is shown in Figure 2. The upper strata are equivalently replaced by the load form. As the true cavern shape is irregular, the cavern shape in Figure 2 only indicates its span and height, as detailed in Figure 3 of the grid model.

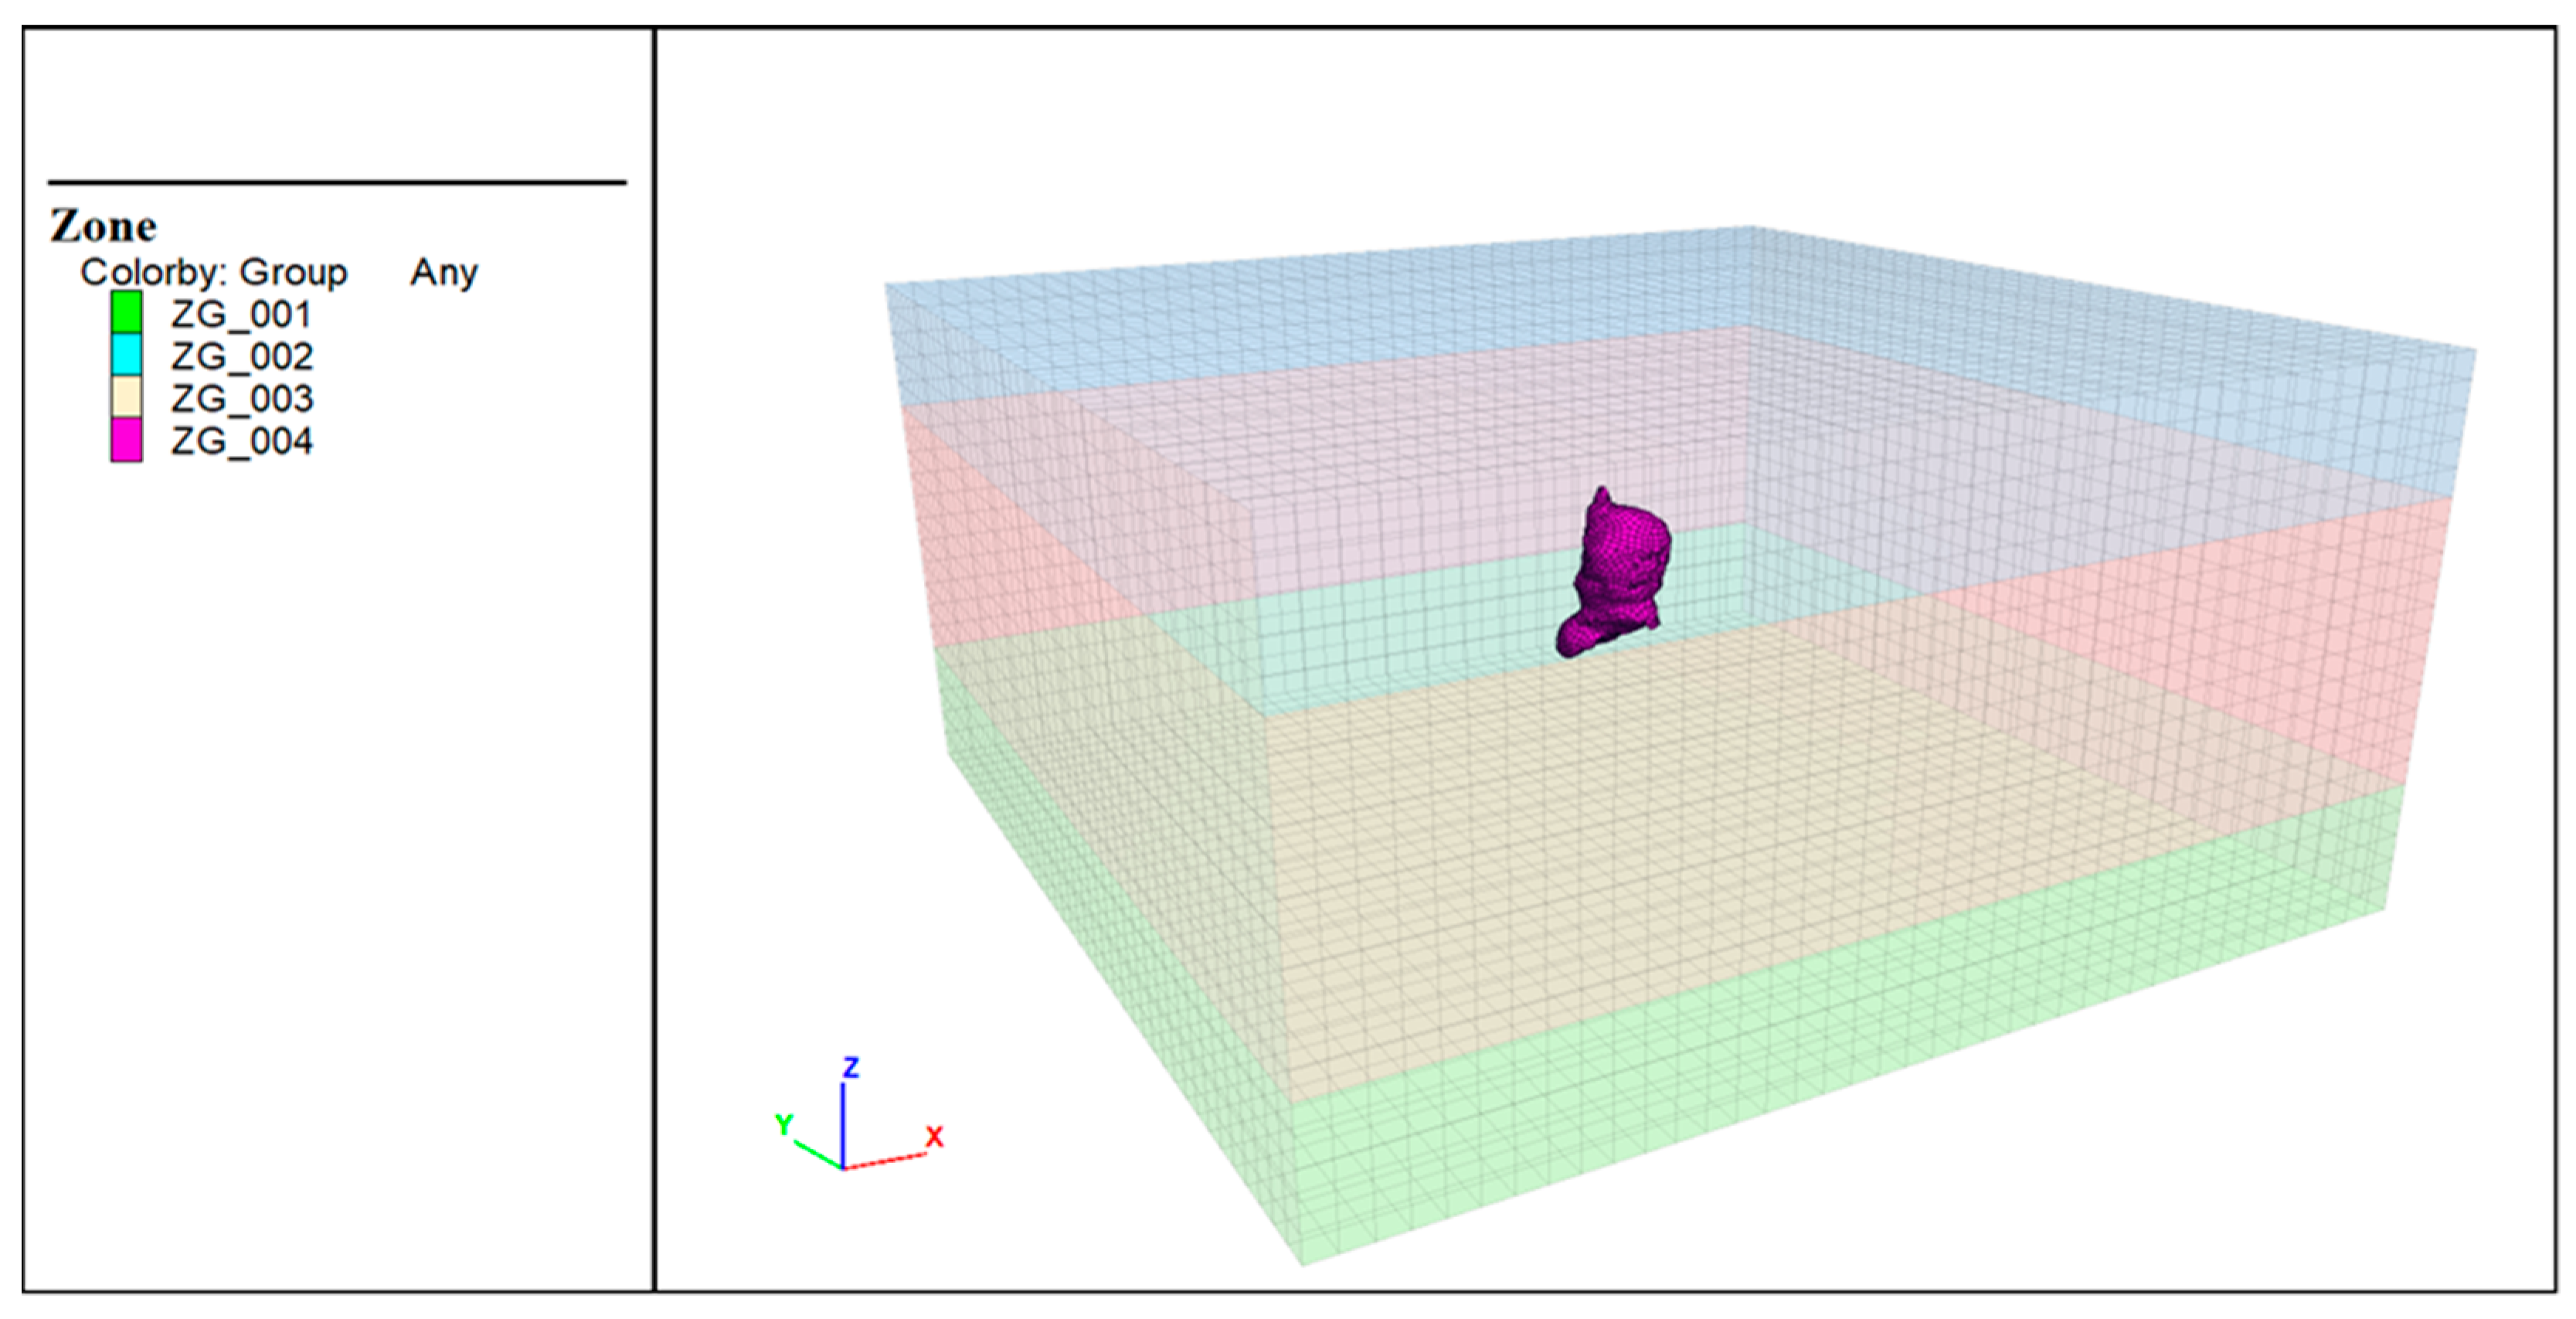
3.2. Selection of the Computational Grid Model

The triaxial creep tests of conventional mudstone and rock salt show that the strength of mudstone is much higher than that of the salt, while its creep property is much lower. According to research by scholars [24,25], this mudstone interlayer with high strength and low creep can limit the development of cavern wall failure zones and play a protective role in the deformation of surrounding gas storage rock [26]. For a reasonable simplification of the calculations, we assumed that the cavern is in a homogeneous salt rock formation. According to the needs of the model, the following reasonable assumptions were made on the established geomechanical grid model before the stability analysis of single cavern rock salt: (i) Each interlayer rock was approximately regarded as an isotropic homogeneous continuum, and (ii) we assumed that the different strata are closely connected, that is, the displacement between the strata is transmitted and is continuous [21].
In the example calculation, the Flac3D software was used to establish the grid model shown in Figure 3, and the area was set to be a cube. The origin of the model coordinate system was selected at the lower-left corner of the model in the XYZ coordinate system. The horizontal plane is the XZ coordinate system, and the axial direction is its Y-axis direction. In order to make a more accurate analysis of the forces around the cavern and the surrounding strata, hexahedral solid elements were used in the division units. In order to eliminate the influence of the boundary effect on the simulation results, the boundary condition was taken to be 350 m, i.e., five times the cavern span. At the same time, considering that the salt cavern volume is much smaller than the stratum size, we assumed that the stratum properties of each layer remain unchanged in the horizontal direction; the calculation model size was 800 m (width) × 800 m (length) × 412 (depth).
The model boundary now becomes the displacement constraint. Considering regions outside 400 m around the salt cavern, the calculation model adopts the following boundary conditions: the normal displacement constraint is employed in the front, back, left, right, and bottom of the model, and the vertical load constraint is applied on the upper surface. The load is considered to be the weight of the overburden. The rock thickness at the top of the model was about 888 m. According to the actual thickness of the stratum and the equivalent density of the overlying strata, the equivalent load was calculated to be 19.536 MPa, which acted on the upper surface of the model. The salt cavern was located at a depth of nearly 1000 m, and the tectonic stress coefficient was 1.0, that is, the in situ stress state was considered to be in accordance with the hydrostatic stress state. The initial in situ stress cloud map is shown in Figure 4.

4. Calculation Conditions and Schemes

4.1. Calculation Method

Flac3D is a continuum mechanics analysis software developed by Itasca that is based on a three-dimensional explicit finite difference method [27]. The finite difference method approximates the basic equation with the difference equations (algebraic equations) and changes the problem of solving the differential equation into the problem of solving the algebraic equation, so as to accurately simulate the yield, plastic flow, softening, and the large material deformation. In particular, it has its unique advantages in the elastic–plastic analysis and large deformation analysis of materials. It is widely used in engineering practice.

4.2. Calculation Parameters

In the FLAC3D program, there is a basic element model that can meet the analysis of geotechnical engineering structure, including isotropic, anisotropic, and transversely isotropic elastic constitutive models for elastic analysis. The plastic models include Mohr–Coulomb elastic–plastic, Drucker–Prager elastic–plastic, and Hock–Brown elastic–plastic models. Seven creep constitutive models such as CPOWER, Maxwell, and power exponent are used to describe the creep properties of materials. For static, dynamic, creep, seepage, temperature effects, and their mutual coupling engineering problems, choosing appropriate modes can realize the solutions to different types of problems. The CPOWER creep constitutive model is the most basic model and the most commonly used in stability analysis of salt cavern gas storage [28,29].
We, therefore, applied the CPOWER visco-elastic–plastic creep constitutive model for the numerical simulation of rock salt and mudstone. This model can accurately reflect the creep characteristics of rock salt. The mechanical calculation parameters required for the numerical simulation are shown in Table 1.

4.3. Condition Program

The Flac3D software has a powerful calculation function to be used in underground cavern stability analysis, which is usually simulated by a zero element. In order to analyze the deformation of rock salt caverns under different working conditions, three calculation conditions were needed—condition 1 is considered to be immediately after excavation, during which the cavern is pressurized to simulate the influence of natural gas injection on the gas pressure of the surrounding rock; condition 2 is considered as the condition after 20 years of creep subsequent to cavern construction, for which in this study, the results of creep for 5 years, 10 years, 15 years, and 20 years were analyzed, respectively; condition 3 allows the evaluation of the influence of injection–production cycle on the surrounding rock within 1 year after cavern construction. Table 2 below shows the simulation calculation.
Additional calculations are needed in order to ensure the stability of the gas storage cavern and the minimum operating pressure necessary to maintain the stability of the gas storage cavern. We followed the CSA Z341-2003 standard recommended guidelines for the operating pressure range of the salt cavern gas storage [30]. The maximum operating pressure should not exceed (i) 80% of the fracture pressure of the storage and caprock formations; or (ii) in the absence of fracture pressure data, 18.1 kPa per meter of depth to the top of the cavern, measured at the casing shoe. The minimum operating pressure for a salt cavern should be a 0 kPa gauge at the surface on the brine string, except for dry gas storage caverns, which should have a minimum pressure of 3.4 kPa per meter of depth to the casing shoe. Based on this standard, the top depth of the salt cavern was 1018 m, and the operating pressure range of the salt cavern should be between 3.46 MPa and 18.43 MPa. In the static calculation and creep calculation, the cavern pressure was 13 MPa, and the pressure range was between 8 MPa and 15 MPa.

5. Numerical Simulation Evaluation

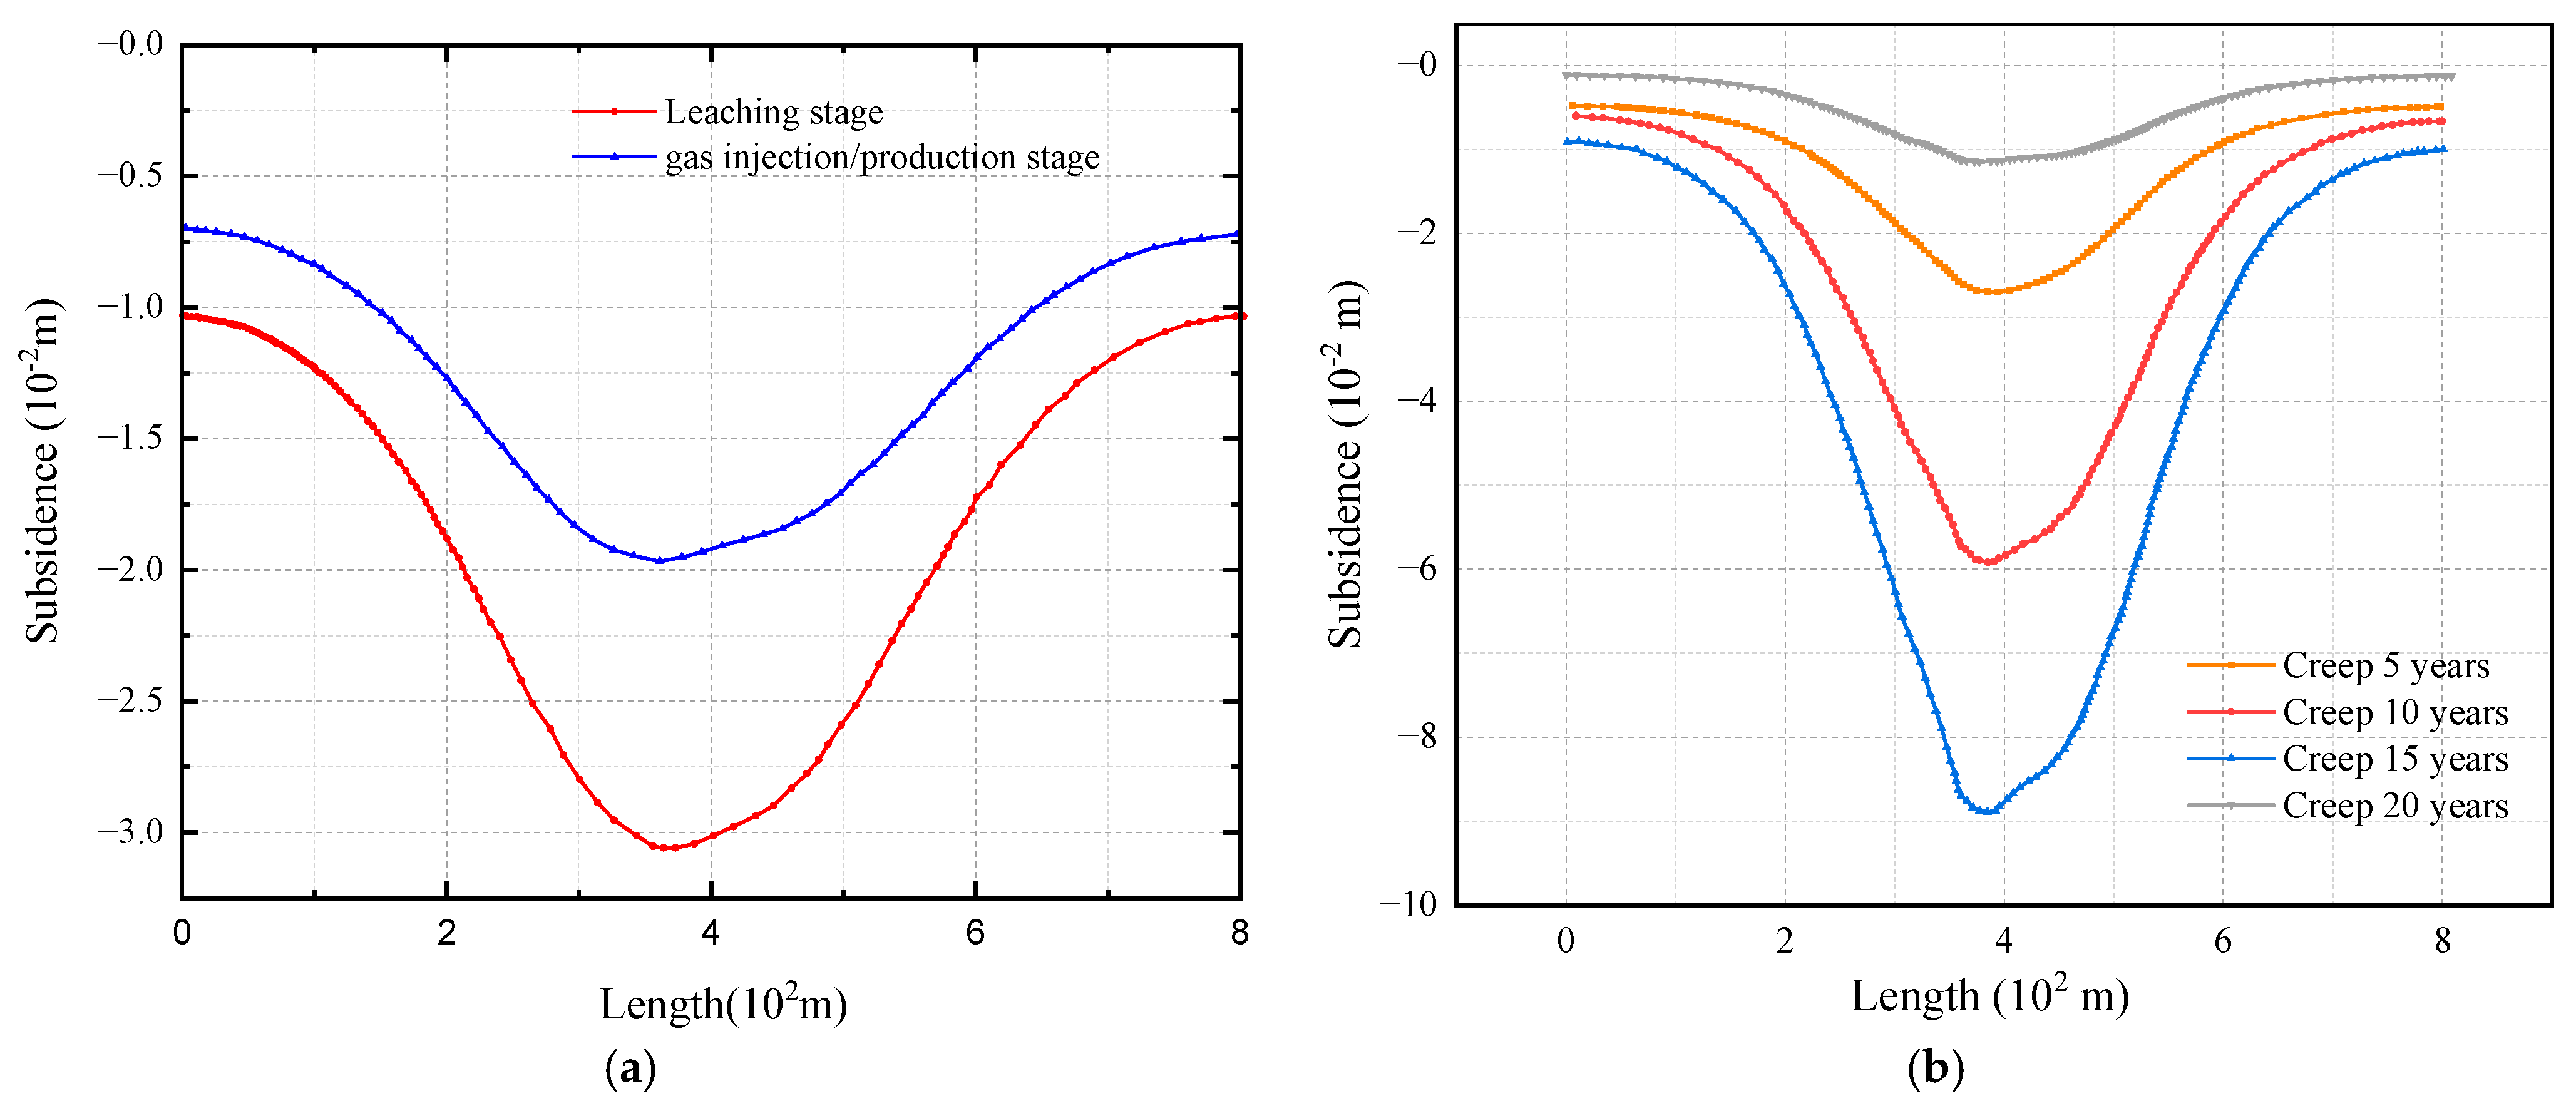
5.1. Land Subsidence

We simulated the dynamic surface settlement of a salt cavern gas storage in Jintan during excavation and operation; the calculation results are shown in Figure 5.
Figure 5 shows the surface settlement nephogram while under static excavation conditions. The curve represents the monitoring curve of the surface in the X-direction. It can be seen that the maximum settlement values during excavation and compression were about 43.95 mm, and 32.43 mm, respectively. The surface settlement value decreased with the application of gas pressure, indicating that the existence of gas pressure is beneficial to the control of the surface settlement. In addition, as the values were relatively small, the change in gas pressure had little effect on surface subsidence.
After applying the cavern pressure, the surface settlement under different creep times was determined, which is shown in the right part of Figure 5, where the curve represents the monitoring curve of the surface in the X-direction. Here, we see that maximum settlement occurred near the top of the cavern. The maximum settlement of the surface of the cavern after 5 years of creep was about 26.5 mm, while after 10 years, it would be 55.9 mm; after 15 years, it would be 89.1 mm, reaching 116.0 mm after 20 years. The surface settlement increased proportionally to creep time, but the increase leveled off, that is, a convergence trend is observed.
In terms of the conditions above the cavern’s top surface, the maximum settlement on the ground on top of the cavern would also occur near the top of the cavern. The ground settlement increased with increasing creep time, but the increase leveled off, that is, we again observe a convergence trend. The value was relatively small and, therefore, had little effect on the surface. The maximum settlement occurred at the top of the cavern, the maximum uplift occurred at the bottom of the cavern, and the maximum horizontal displacement occurred at the cavern’s central bulge.

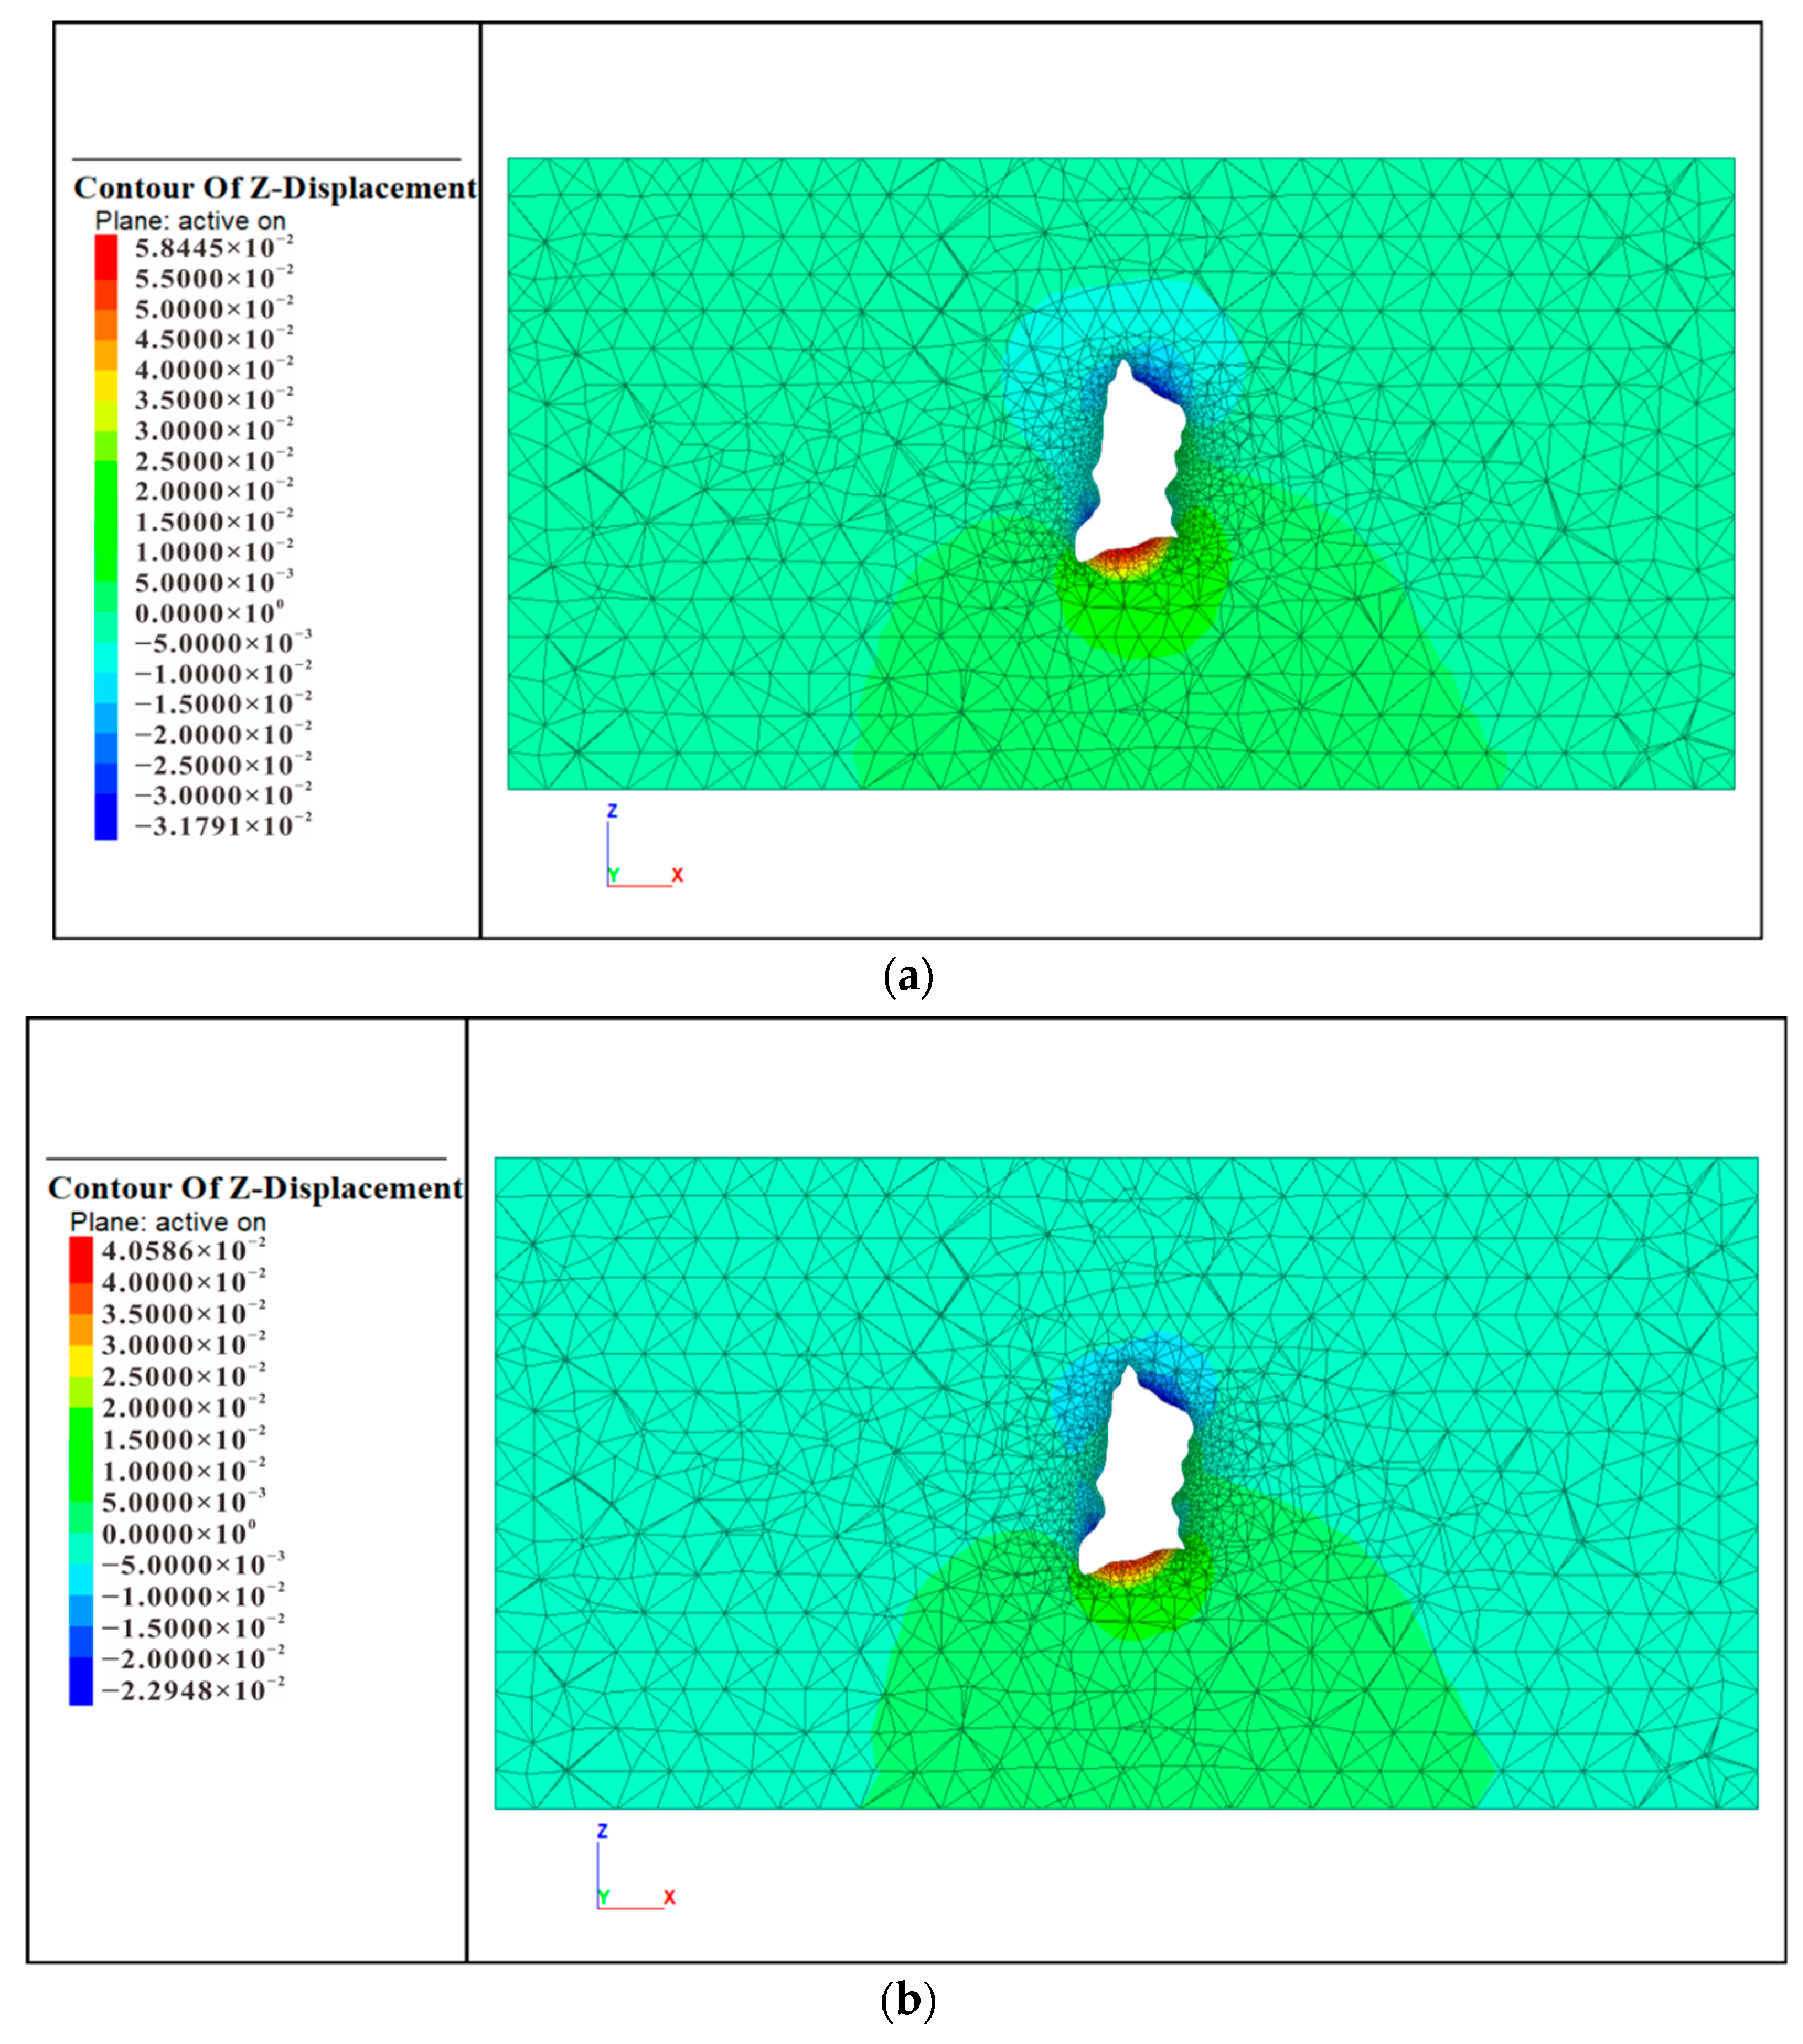
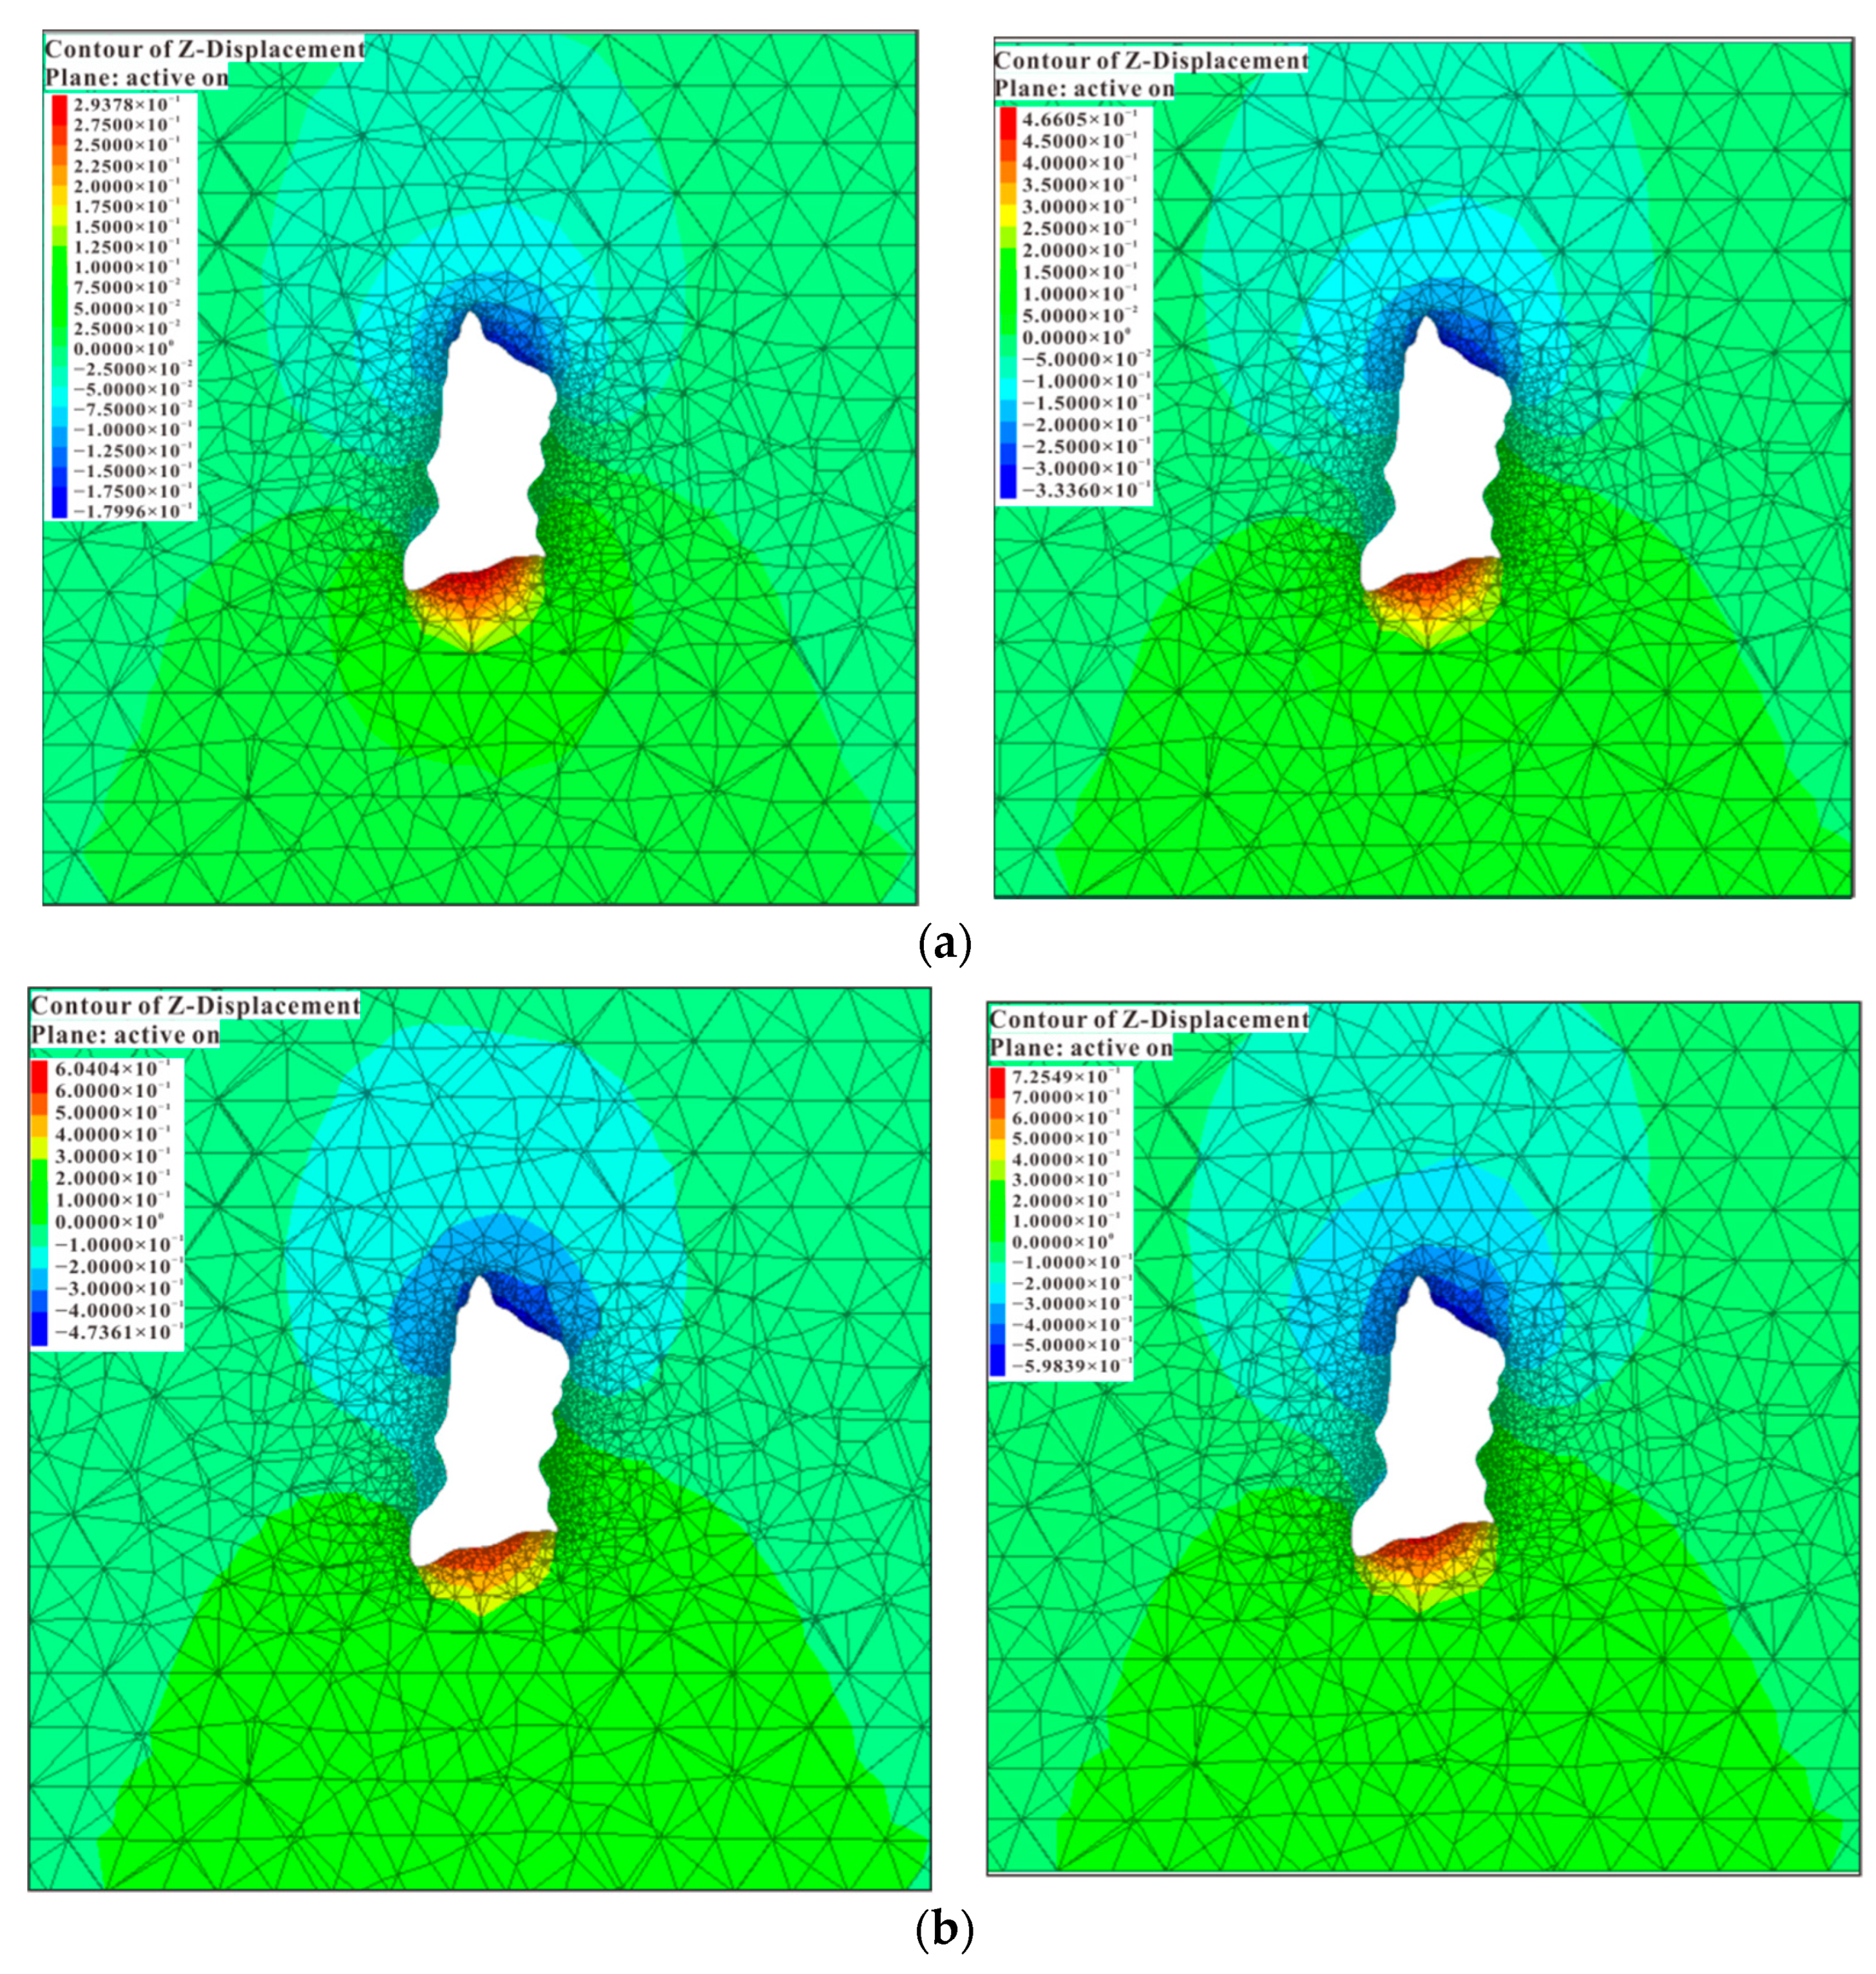
5.2. Cavern Displacement

For the static calculation condition, from the vertical displacement nephogram of the X-section of the cavern during excavation, we can infer that the maximum settlement occurred at the top of the cavern(Figure 6), with the excavation period’s displacement being about 31.79 mm and having a compression period of about 22.95 mm. Maximum uplift occurred at the bottom of the cavern during excavation, which was about 58.45 mm during excavation and 40.59 mm during compression. The vertical deformation value decreased with the application of gas pressure, indicating that this pressure is beneficial to the vertical displacement control of the cavern and that the surrounding rock was stable.
The results of long-term creep calculation can be found from the vertical displacement nephogram of the cavern along the X-direction under different creep times after applying gas pressure (Figure 7). Here, we see that maximum settlement occurred at the top of the cavern. After 5 years of creep, the maximum settlement was found to be 179.9 mm, while after 10 years, it would be 333.6 mm; after 15 years, it would be 473.6 mm, reaching 598.4 mm after 20 years of creep. Maximum uplift occurred at the bottom of the cavern. The maximum uplift was 293.8 mm after 5 years of creep, 466.1 mm after 10 years, and 604.1 mm after 15 years, increasing to 725.5 mm after 20 years. Thus, the vertical deformation value of the cavern increased as a function of creep time. However, the increase rate leveled off with longer creep times; therefore, we again observe a convergence trend; the deformation value was large and unstable at this time, so corresponding reinforcement measures need to be taken.

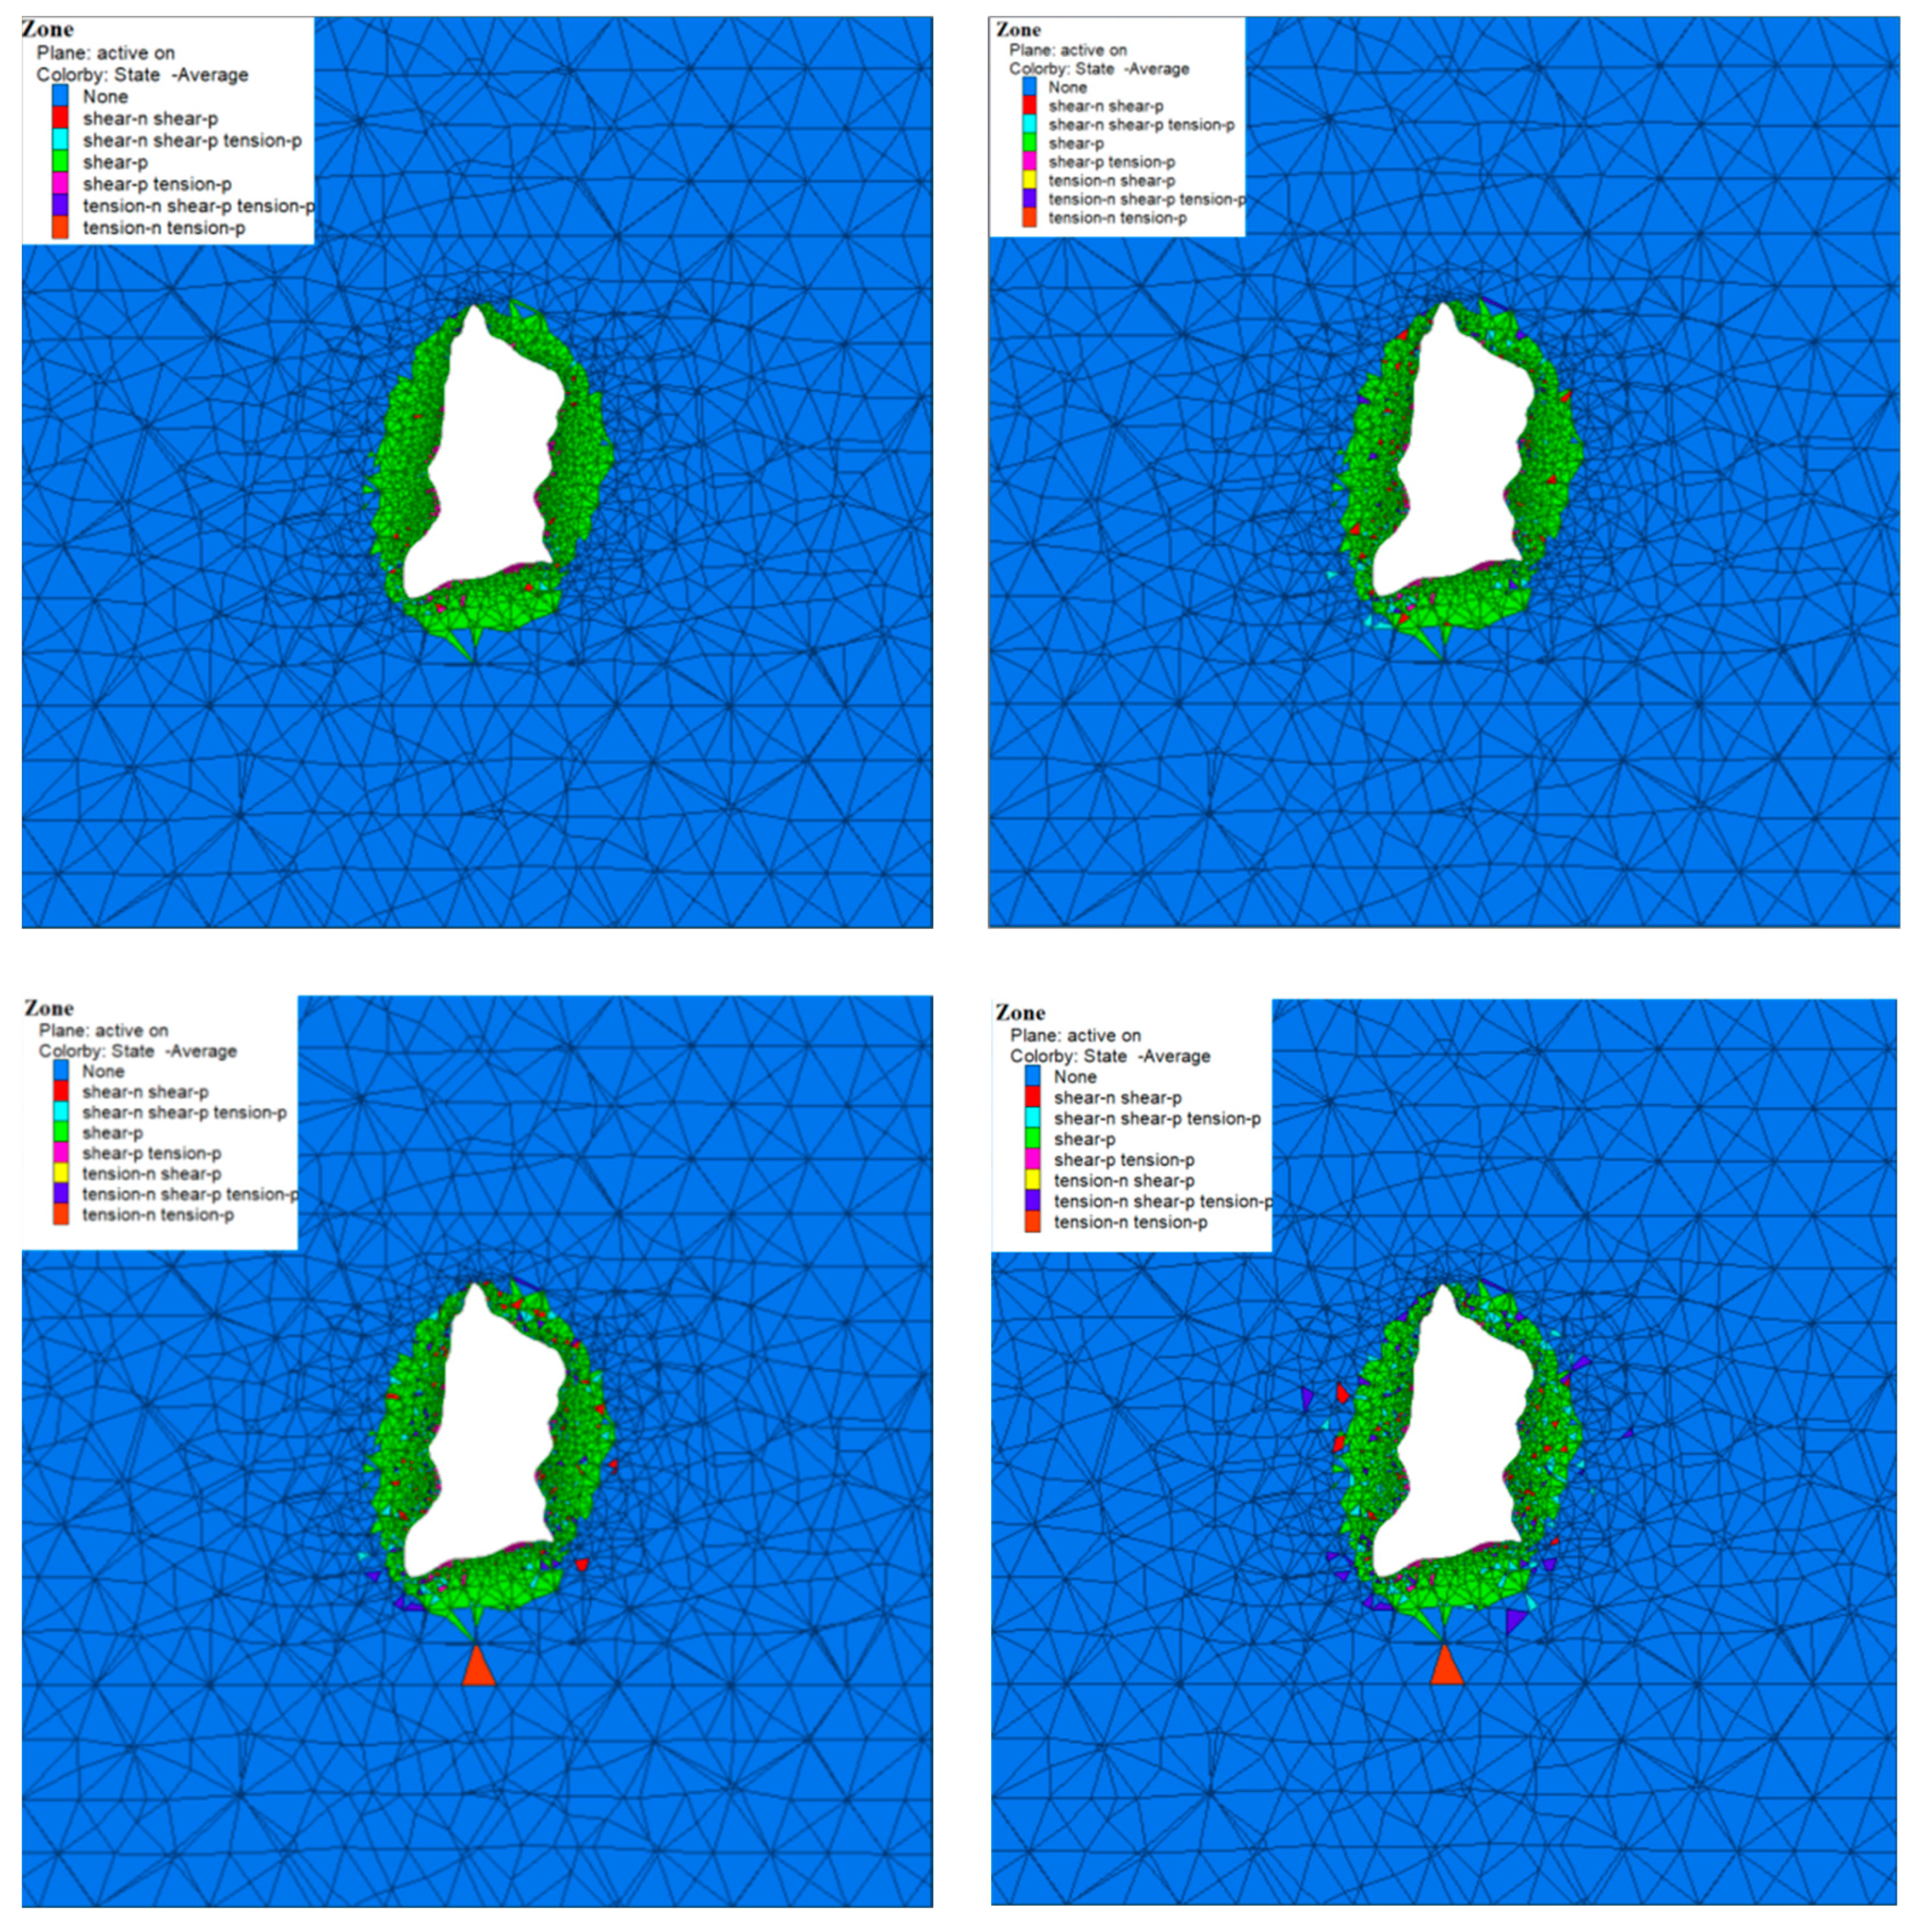
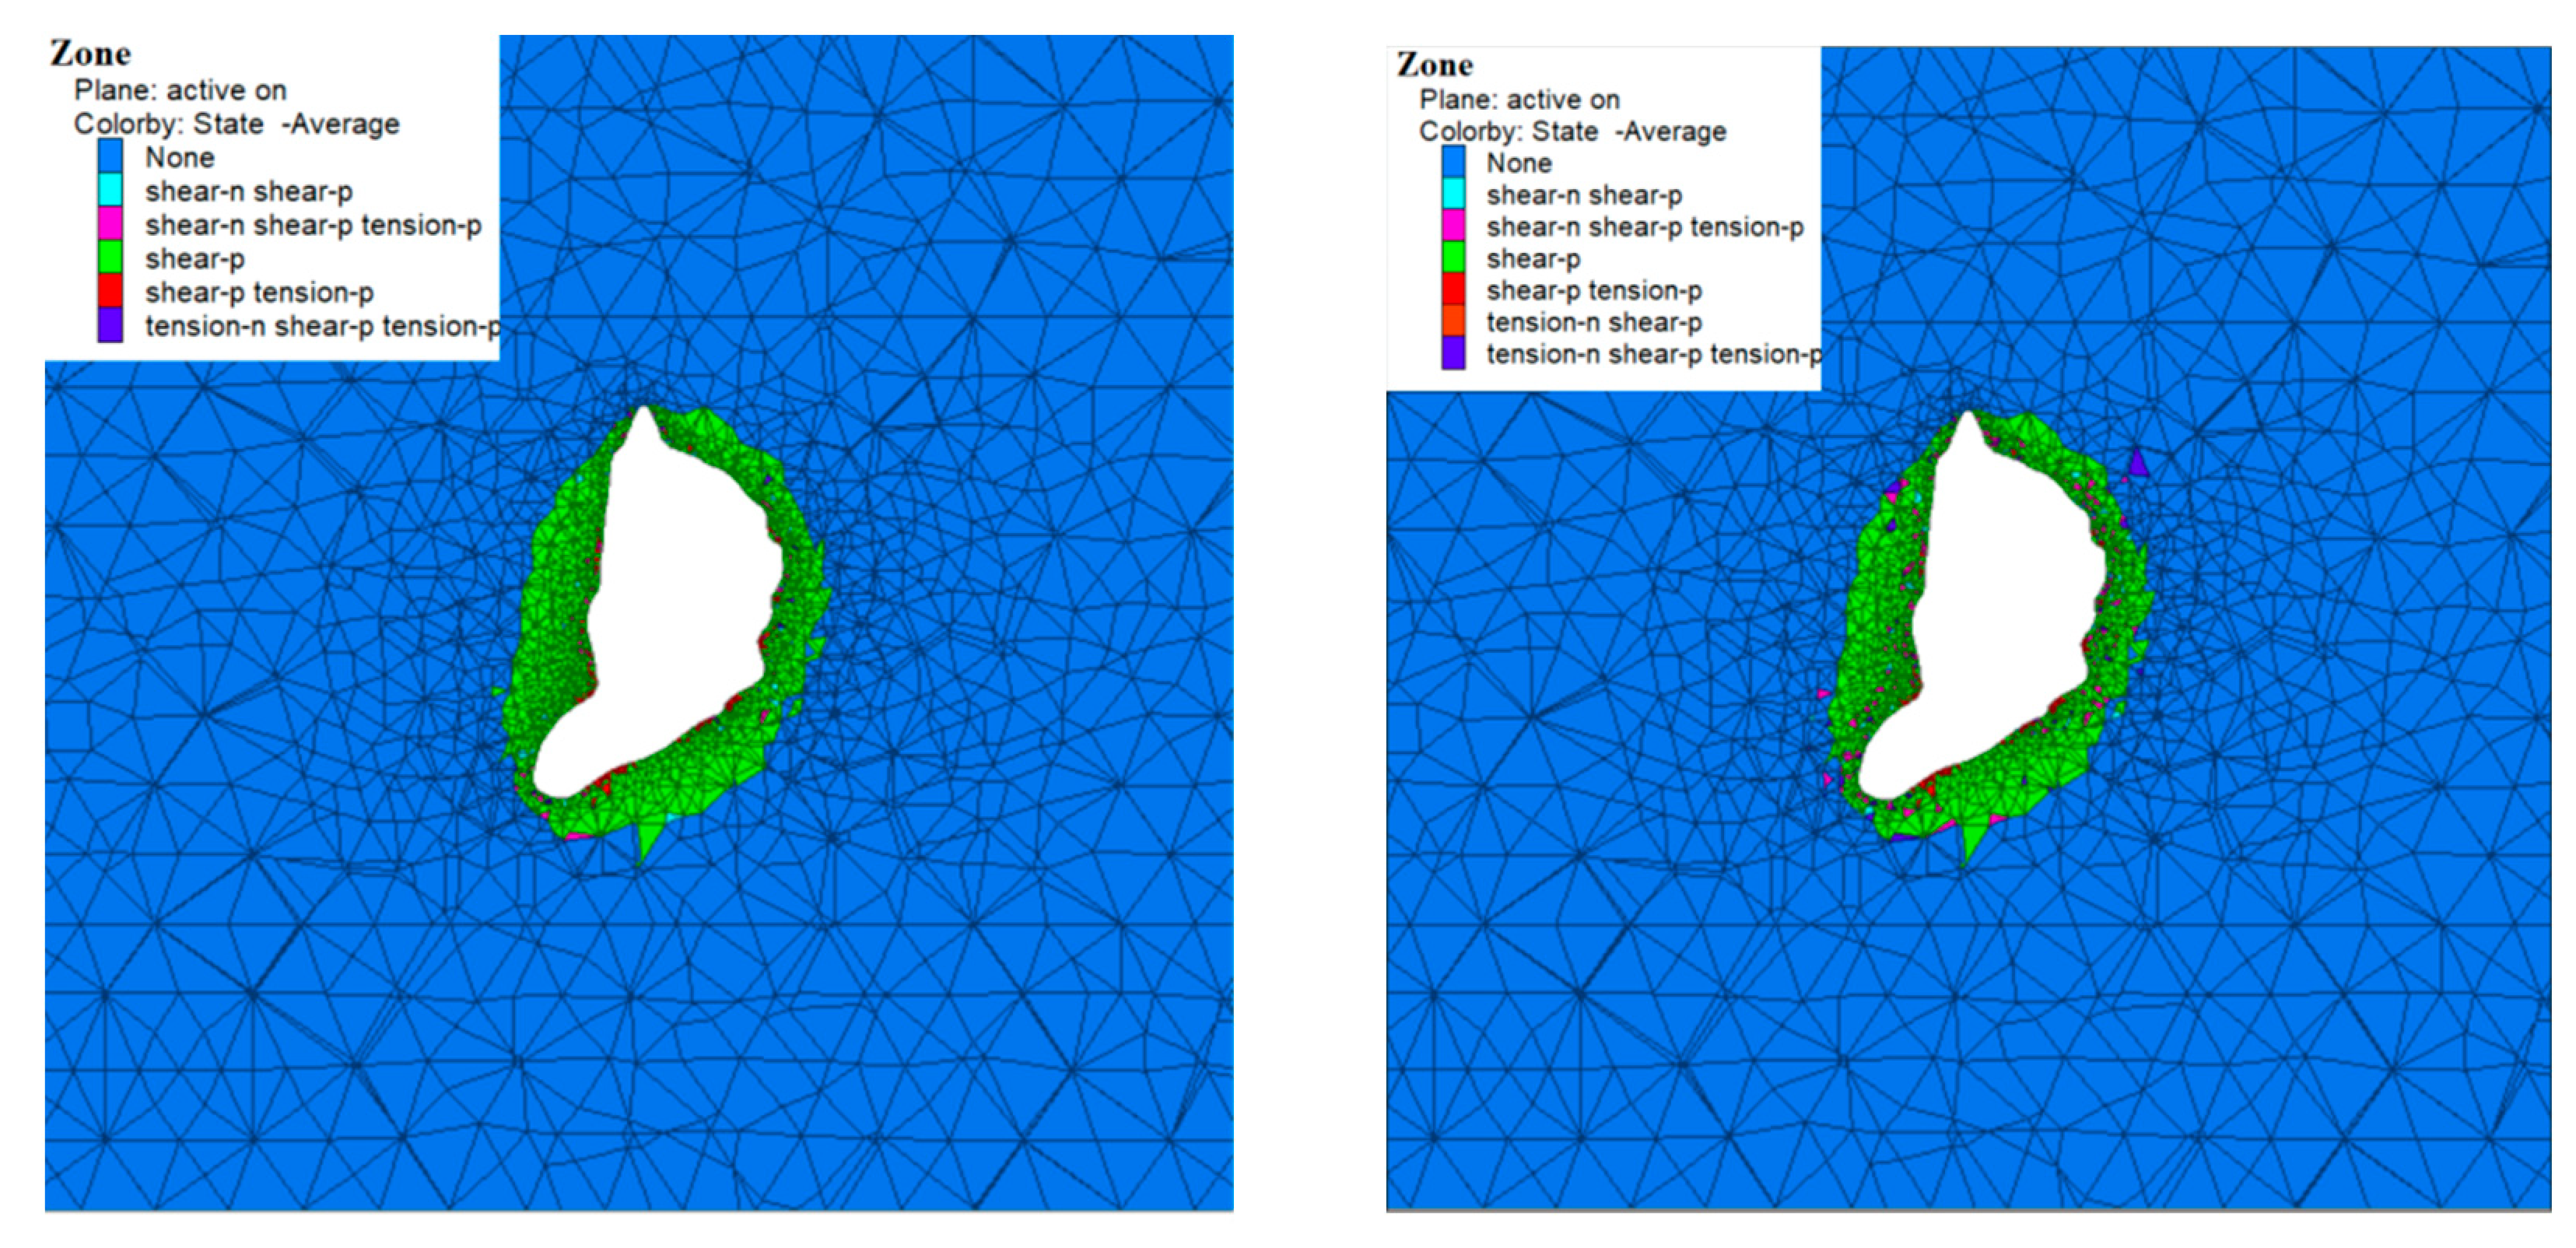
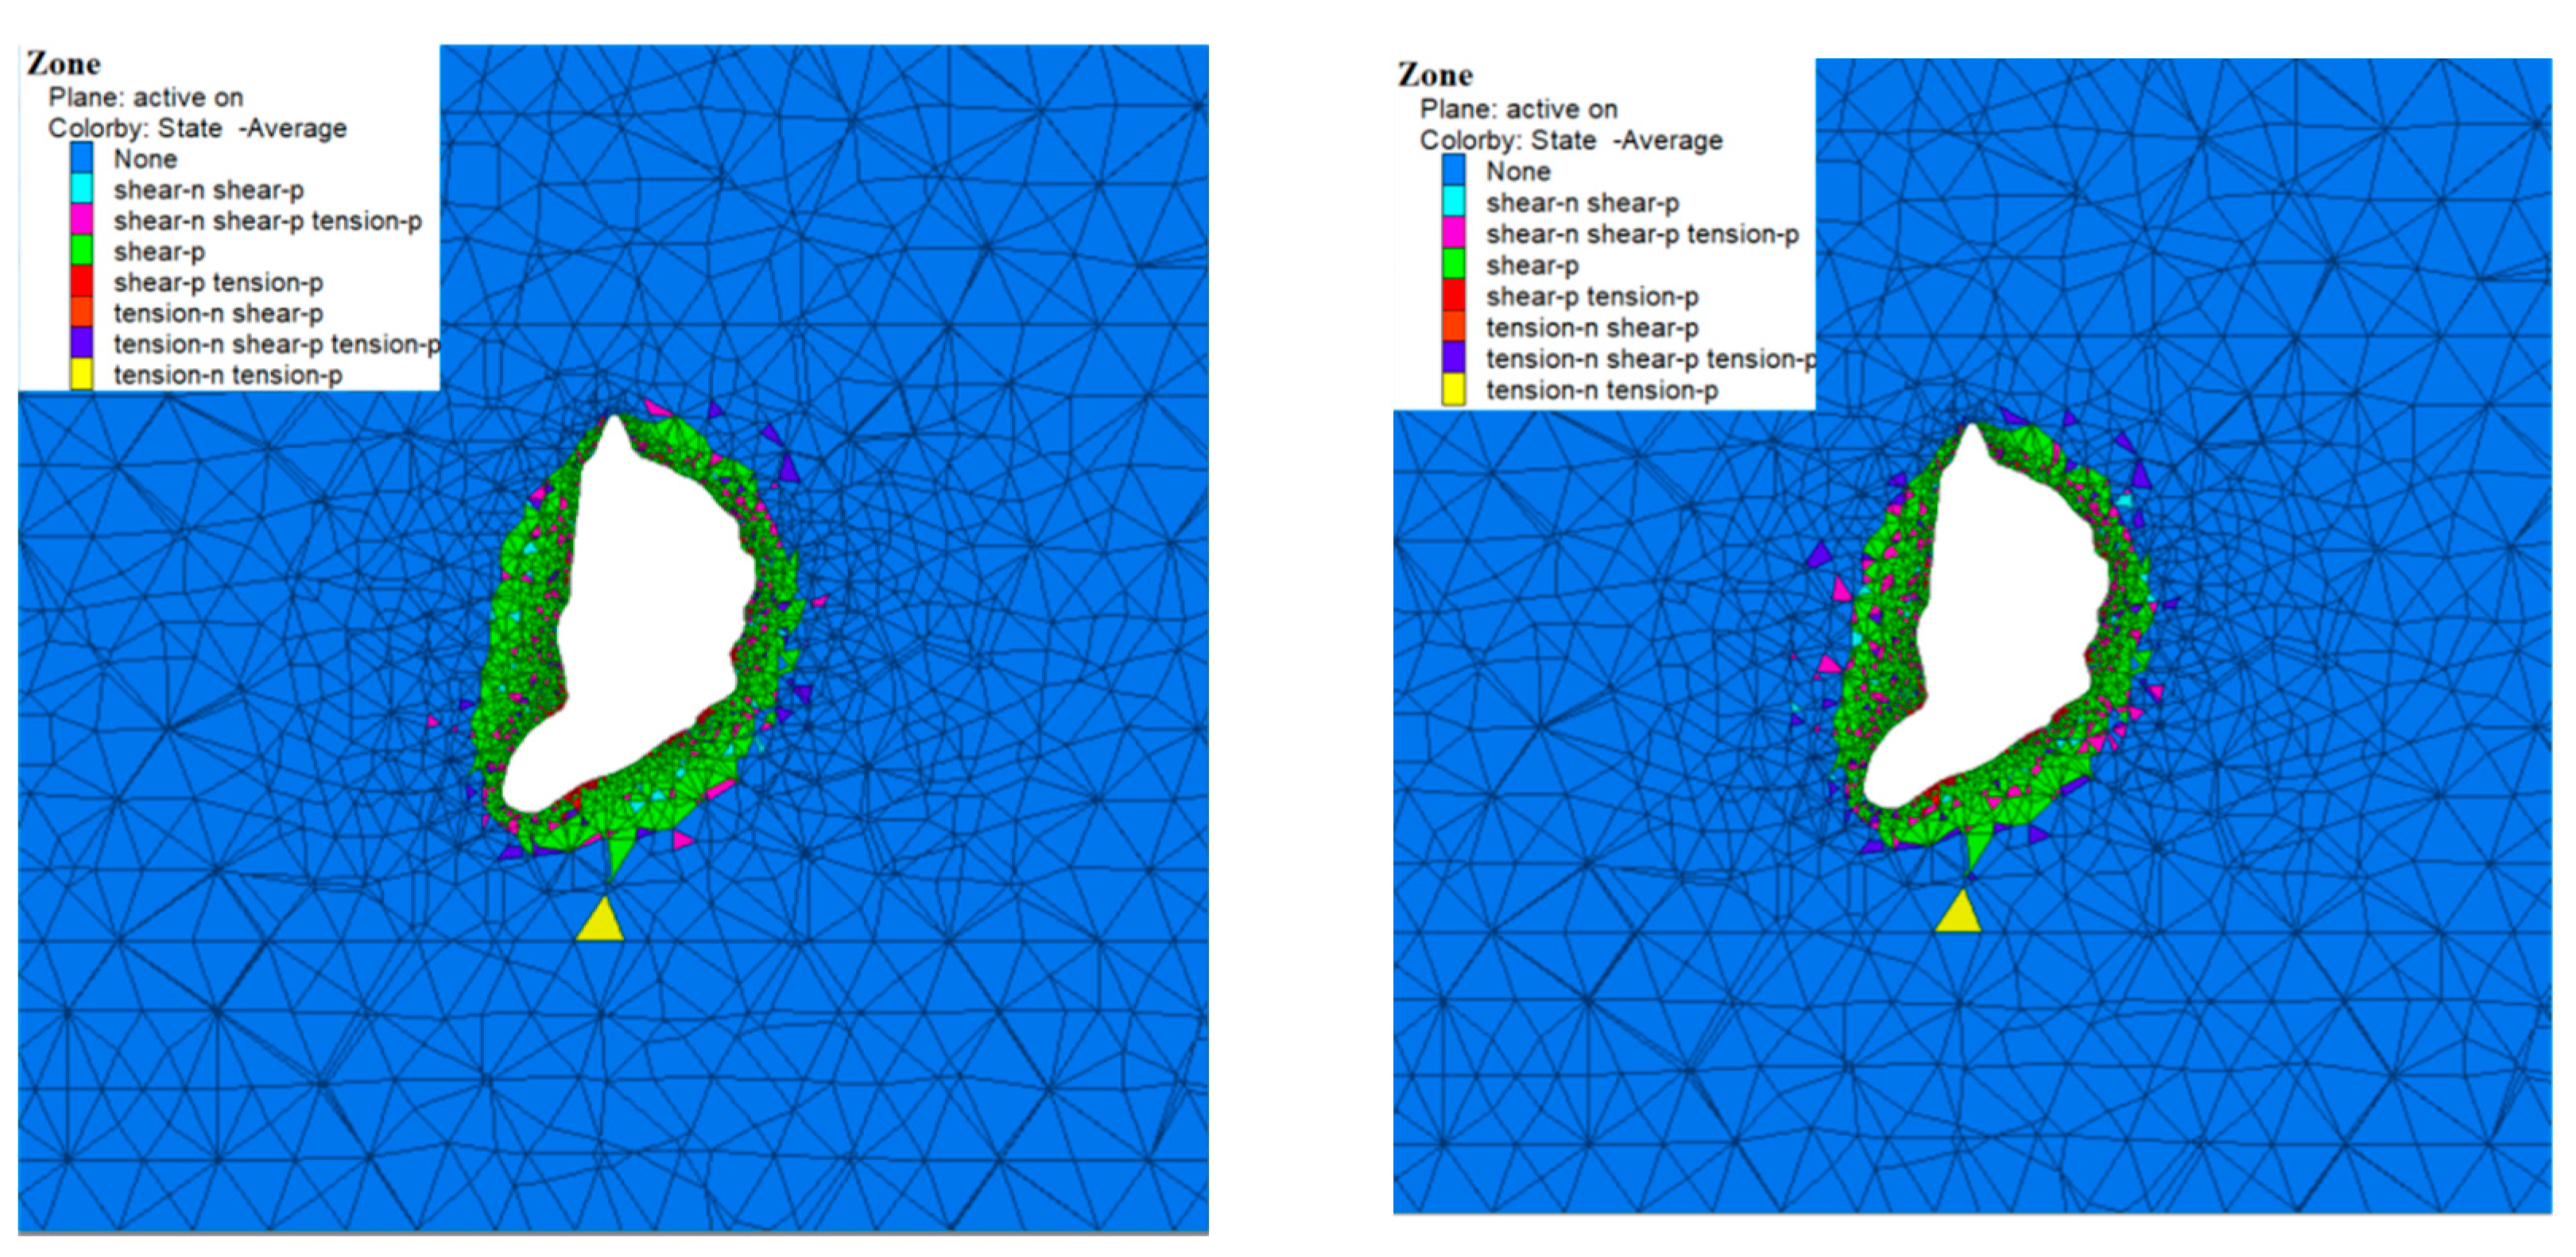
5.3. Distribution of Surrounding Rock Plastic Zone

The plastic zone nephogram in Figure 8 shows the static calculation for the cavern along the X–Y section. Here, we note the following: (i) during the excavation period, a large number of “-n” state plastic zones existed around the cavern; (ii) after pressurization, the plastic zones originally in the “-n’” state already shifted to the “-p” state; and (iii) the plastic zones decreased with the application of gas pressure, indicating that gas pressure is beneficial to the stability of the cavern’s surrounding rock and that the surrounding rock is itself stable. We see that the deformation value of the surrounding rock of the cavern was small and that the distribution of the plastic zone can also be considered to be stable.
For the long-term creep condition, the nephogram images of the plastic zone of the cavern along the X and Y directions are shown in Figure 9 and Figure 10. Here, we see that for different injection–production periods, the cavern’s surrounding rock was mainly in the ‘shear-p’ state, that is, the existence of gas pressure inhibited the deformation of the surrounding rock and reduced the existence of the ‘-n’ state plastic zone. From the above displacement analysis, the surrounding rock can be considered to be stable during short-term simulated creep times. The deformation value of the cavern surrounding rock was large. Combined with the distribution of the plastic zone, we may consider the cavern surrounding rock to be unstable; hence, corresponding reinforcement measures must be taken.

5.4. Volume Shrinkage

Volume shrinkage rate is one of the key parameters to evaluate the effectiveness of underground salt cavern gas storage, which can be defined as the ratio of cavern volume shrinkage to cavern volume. The change in volume shrinkage rate of the salt cavern with time after 20 years of cavern operation is shown in Figure 11. After 20 years of operation, the volume shrinkage would be 10.563%. The reason for the large volume shrinkage is that the irregular shape of the cavern is large, and there are more prominent areas of the cavern wall, that is, more areas of large curvature. When the pressure in the salt cavern changes rapidly, the cavern wall outburst area is first affected by the effective tensile stress, making the region unstable. Cavern volume loss rate must be typically limited to 1% per year [31]. After 20 years of operation, the shrinkage rate of the cavern volume would be 10.563%, which is still within the safe range, but some safety measures can be taken for maintenance.

6. Conclusions

In this study, we analyzed the long-term stability of a well in Jintan (China) under different loading conditions, using static analysis after excavation and creep calculation for a period of 20 years while under constant pressure. Due to its creep characteristics, volume shrinkage of rock salt used for gas storage inevitably occurs during operation. The results of our numerical simulations and analysis show that large vertical displacement deformation occurred at the top and bottom of the cavern and that large horizontal displacement deformation occurred at its central bulge. Reservoir gas pressure tended to inhibit the development of the surrounding rock’s plastic zone, but with increasing operation time, the plastic zone would undergo irreversible growth. For the creep situation of more than 20 years, the deformation of the cavern’s surrounding rock is noteworthy. Combined with the distribution of the plastic zone, we may consider that the cavern’s surrounding rock is in an unsteady state and that corresponding reinforcement treatment is needed.
The goal of this study was to assess the stability of a water-soluble cavern in the Jintan area. To this end, we used the Flac3D geotechnical calculation software to analyze the influence of different loading conditions on the long-term operational stability of the salt cavern gas storage. Our main conclusions are as follows:
  • Maximum surface subsidence occurred near the top of the cavern. The surface subsidence increased proportionally to creep time, but the increase rate eventually diminished, that is, it converged. Subsidence, however, was relatively small and showed little effect at the surface;
  • Maximum settlement occurred at the top of the cavern, maximum uplift occurred at the bottom of the cavern, and maximum horizontal displacement occurred at the convex part of the central cavern;
  • The application of internal pressure would inhibit the growth of the plastic zone, but its range would generally increase proportionally to increasing creep time;
  • For the static calculation condition, the deformation value of the cavern’s surrounding rock was small. Combined with the distribution of the plastic zone, we may consider that the cavern surrounding rock is stable;
  • For the one-year creep condition of injection–production, the deformation value of the cavern’s surrounding rock at this time had increased, compared with the static condition, but the overall value was still relatively small. Combined with the distribution of the plastic zone, we may consider that the cavern surrounding rock is essentially stable. However, considering that the creep time simulated was short, it is a factor that should still be carefully scrutinized in future studies. Combined with appropriate field monitoring, a corresponding treatment can hence be carried out;
  • For the 20-year creep condition, the deformation value of the cavern’s surrounding rock is significant; the shrinkage rate of the cavern volume was found to be 10.563%, which is still within the safe range. Combined with the distribution of the plastic zone, considering the possible instability of the surrounding rock of the cavern, corresponding reinforcement measures must be taken.

Author Contributions

All authors have contributed to this work. Conceptualization, J.L. and J.W.; methodology, J.L. and J.W.; software, J.W. and H.L.; validation, M.J.J. and H.L.; data curation, Y.H. and G.Y.; writing—original draft preparation, Y.H. and Y.X.; writing—review and editing, J.W. All authors have read and agreed to the published version of the manuscript.

Funding

This research was funded by the CNPC scientific research and technology development project (No. 2021DJ5402, No. 2022DJ8304 and No. 2022DJ8305).

Acknowledgments

The authors acknowledge the CNPC Engineering Technology R&D Company Limited, Petrochina for permission to publish this paper. We are also grateful to all the anonymous readers for their constructive comments.

Conflicts of Interest

The authors declare that they have no known competing financial interest or personal relationships that could have influenced the work reported in this paper.

References

  1. Wang, T.; Yang, C.; Wang, H.; Ding, S.; Daemen, J.J.K. Debrining prediction of a salt cavern used for compressed air energy storage. Energy 2018, 147, 464–476. [Google Scholar] [CrossRef]
  2. He, W.; Luo, X.; Evans, D.; Busby, J.; Garvey, S.; Parkes, D.; Wang, J. Exergy storage of compressed air in cavern and cavern volume estimation of the large-scale compressed air energy storage system. Appl. Energy 2017, 208, 745–757. [Google Scholar] [CrossRef]
  3. Wan, J.; Peng, T.; Yuan, G.; Ban, F.; Jurado, M.J.; Xia, Y. Influence of tubing/oil-blanket lifting on construction and geometries of two-well-horizontal salt caverns. Tunn. Undergr. Space Technol. 2021, 108, 103688. [Google Scholar] [CrossRef]
  4. Takach, M.; Sarajlić, M.; Peters, D.; Kroener, M.; Schuldt, F.; von Maydell, K. Review of Hydrogen Production Techniques from Water Using Renewable Energy Sources and Its Storage in Salt Caverns. Energies 2022, 15, 1415. [Google Scholar] [CrossRef]
  5. Wan, J.; Peng, T.; Shen, R.; Jurado, M.J. Numerical model and program development of TWH salt cavern construction for UGS. J. Pet. Sci. Eng. 2019, 179, 930–940. [Google Scholar] [CrossRef] [Green Version]
  6. Cyran, K. Insight Into a Shape of Salt Storage Caverns. Arch. Min. Sci. 2020, 65, 363–398. [Google Scholar]
  7. Ślizowski, J.; Lankof, L.; Urbańczyk, K.; Serbin, K. Potential capacity of gas storage caverns in rock salt bedded deposits in Poland. J. Nat. Gas Sci. Eng. 2017, 43, 167–178. [Google Scholar] [CrossRef]
  8. Warren, J.K. Solution Mining and Salt Cavern Usage. In Evaporites: A Geological Compendium; Springer International Publishing: Cham, Switzerland, 2016; pp. 1303–1374. [Google Scholar]
  9. Ozarslan, A. Large-scale hydrogen energy storage in salt caverns. Int. J. Hydrogen Energy 2012, 37, 14265–14277. [Google Scholar] [CrossRef]
  10. Li, P.; Li, Y.; Shi, X.; Zhao, A.; Hao, S.; Gong, X.; Jiang, S.; Liu, Y. Stability analysis of U-shaped horizontal salt cavern for underground natural gas storage. J. Energy Storage 2021, 38, 102541. [Google Scholar] [CrossRef]
  11. Wang, T.; Chai, G.; Cen, X.; Yang, J.; Daemen, J.J.K. Safe distance between debrining tubing inlet and sediment in a gas storage salt cavern. J. Pet. Sci. Eng. 2021, 196, 107707. [Google Scholar] [CrossRef]
  12. Liu, W.; Zhang, Z.; Chen, J.; Jiang, D.; Wu, F.; Fan, J.; Li, Y. Feasibility evaluation of large-scale underground hydrogen storage in bedded salt rocks of China: A case study in Jiangsu province. Energy 2020, 198, 117348. [Google Scholar] [CrossRef]
  13. Yin, H.; Yang, C.; Ma, H.; Shi, X.; Zhang, N.; Ge, X.; Li, H.; Han, Y. Stability evaluation of underground gas storage salt caverns with micro-leakage interlayer in bedded rock salt of Jintan, China. Acta Geotech. 2020, 15, 549–563. [Google Scholar] [CrossRef]
  14. Wang, T.; Li, J.; Jing, G.; Zhang, Q.; Yang, C.; Daemen, J.J.K. Determination of the maximum allowable gas pressure for an underground gas storage salt cavern—A case study of Jintan, China. J. Rock Mech. Geotech. Eng. 2019, 11, 251–262. [Google Scholar] [CrossRef]
  15. Liu, W.; Zhang, Z.; Fan, J.; Jiang, D.; Daemen, J.J.K. Research on the Stability and Treatments of Natural Gas Storage Caverns With Different Shapes in Bedded Salt Rocks. IEEE Access 2020, 8, 18995–19007. [Google Scholar] [CrossRef]
  16. Chen, X.; Li, Y.; Liu, W.; Ma, H.; Ma, J.; Shi, X.; Yang, C. Study on Sealing Failure of Wellbore in Bedded Salt Cavern Gas Storage. Rock Mech. Rock Eng. 2019, 52, 215–228. [Google Scholar] [CrossRef]
  17. Yin, H.; Yang, C.; Ma, H.; Shi, X.; Chen, X.; Zhang, N.; Ge, X.; Liu, W. Study on Damage and Repair Mechanical Characteristics of Rock Salt Under Uniaxial Compression. Rock Mech. Rock Eng. 2019, 52, 659–671. [Google Scholar] [CrossRef]
  18. Zhang, G.; Wang, Z.; Wang, L.; Chen, Y.; Wu, Y.; Ma, D.; Zhang, K. Mechanism of collapse sinkholes induced by solution mining of salt formations and measures for prediction and prevention. Bull. Eng. Geol. Environ. 2019, 78, 1401–1415. [Google Scholar] [CrossRef]
  19. Yuan, G.; Wan, J.; Li, J.; Li, G.; Xia, Y.; Ban, F.; Zhang, H.; Jurado, M.J.; Peng, T.; Liu, W. Stability analysis of a typical two-well-horizontal saddle-shaped salt cavern. J. Energy Storage 2021, 40, 102763. [Google Scholar] [CrossRef]
  20. Liu, J.; Song, J.; Zhang, Q.; Zhang, W. Stability analysis of Jintan underground rock salt gas storage cavern. Multidiscip. Modeling Mater. Struct. 2013, 9, 268–283. [Google Scholar] [CrossRef]
  21. Shi, X.; Liu, W.; Chen, J.; Yang, C.; Li, Y.; Ma, H.; Peng, H.; Wang, T.; Ma, X. Geological Feasibility of Underground Oil Storage in Jintan Salt Mine of China. Adv. Mater. Sci. Eng. 2017, 2017, 11. [Google Scholar] [CrossRef] [Green Version]
  22. Xing, W.; Zhao, J.; Düsterloh, U.; Brückner, D.; Hou, Z.; Xie, L.; Liu, J. Experimental study of mechanical and hydraulic properties of bedded rock salt from the Jintan location. Acta Geotech. 2014, 9, 145–151. [Google Scholar] [CrossRef]
  23. Li, J.; Tang, Y.; Shi, X.; Xu, W.; Yang, C. Modeling the construction of energy storage salt caverns in bedded salt. Appl. Energy 2019, 255, 113866. [Google Scholar] [CrossRef]
  24. Zhang, N.; Shi, X.L.; Wang, T.T.; Yang, C.H.; Liu, W.; Ma, H.L.; Daemen, J.J.K. Stability and availability evaluation of underground strategic petroleum reserve (SPR) caverns in bedded rock salt of Jintan, China. Energy 2017, 134, 504–514. [Google Scholar] [CrossRef]
  25. Yang, C.; Wang, T.; Li, Y.; Yang, H.; Li, J.; Xu, B.; Yang, Y.; Daemen, J.J.K. Feasibility analysis of using abandoned salt caverns for large-scale underground energy storage in China. Appl. Energy 2015, 137, 467–481. [Google Scholar] [CrossRef]
  26. Ma, H.; Yang, C.; Li, Y.; Shi, X.; Liu, J.; Wang, T. Stability evaluation of the underground gas storage in rock salts based on new partitions of the surrounding rock. Environ. Earth Sci. 2015, 73, 6911–6925. [Google Scholar] [CrossRef]
  27. Itasca. FLAC-3D (Version 5.0) User Manual; Itasca Cons Group Inc.: Minneapolis, MN, USA, 2012. [Google Scholar]
  28. Shahmorad, Z.; Salarirad, H.; Molladavoudi, H. A study on the effect of utilizing different constitutive models in the stability analysis of an underground gas storage within a salt structure. J. Nat. Gas Sci. Eng. 2016, 33, 808–820. [Google Scholar] [CrossRef]
  29. Zhou, J.; Peng, J.; Huang, X.; Chen, Y.; Liang, G.; Li, Q. Research on long-term operation stability of salt rock underground gas storage with interlayers. Arab. J. Geosci. 2022, 15, 389. [Google Scholar] [CrossRef]
  30. Canadian Standards Association. Storage of Hydrocarbons in Underground Formations; Canadian Standards Association: Mississauga, ON, Canada, 2010. [Google Scholar]
  31. Asgari, A.; Brouard, B. Stability Analysis of Natural Gas Storage Caverns in Salt Formations. In Proceedings of the Solution Mining Research Institute Fall 2012 Technical Conference, Bremen, Germany, 1–2 October 2012. [Google Scholar]
Figure 1. The stress on the wall of the salt cavern under injection–production conditions.
Energies 15 04167 g001
Figure 2. Geometric dimension graph.
Energies 15 04167 g002
Figure 3. Flac3D gas storage cavern mesh model.
Energies 15 04167 g003
Figure 4. Initial stress distribution cloud chart.
Energies 15 04167 g004
Figure 5. Ground subsidence of rock salt UGS: (a) static analysis; (b) considering creep.
Energies 15 04167 g005
Figure 6. Vertical displacement of the cavern in the X-direction (Z-displacement): (a) excavation period; (b) injection–production period.
Energies 15 04167 g006
Figure 7. Vertical displacement of cavern in the X-direction (Z-displacement): (a) creep after 5 and 10 years; (b) creep after 15 and 20 years.
Energies 15 04167 g007
Figure 8. Nephogram image of the plastic zone in the cavern profile: (a) excavation period; (b) pressure period.
Energies 15 04167 g008
Figure 9. X-direction nephogram image of plastic zone of cavern creep for 5, 10, 15, and 20 years.
Energies 15 04167 g009
Figure 10. Y-direction nephogram images of plastic zone of cavern creep for 5, 10, 15, and 20 years.
Energies 15 04167 g010aEnergies 15 04167 g010b
Figure 11. Volumetric shrinkage.
Energies 15 04167 g011
Table 1. Material parameter table.
LithologyDensity
(kg/m3)
Elastic Modulus
(GPa)
Poisson’s RatioCohesion
(MPa)
Internal   Friction   Angle   ( ° ) Tensile Strength
(MPa)
A
( M P a n · h 1 )
n
Rock salt220025.00.252.0302 1.08 × 10 8 3
Mudstone220018.00.32.0352 1.08 × 10 9 3
Table 2. Calculation table.
Working ConditionCalculation TypesCreep Time
(Years)
Remark
1Static force0Surface subsidence, cavern displacement, and plastic zone distribution.
2Creep20The distribution of surface settlement, cavern displacement, and plastic zone of creep for 5, 10, 15, and 20 years with time growth.
3Creep1Two injection–production cycles within one year; that is, in one cycle (6 months), the cavern pressure was 15 MPa, and the operation was carried out over 3 months. In the next cycle, cavern pressure was at 8 MPa and run for 3 months.
Publisher’s Note: MDPI stays neutral with regard to jurisdictional claims in published maps and institutional affiliations.

