Article

Experimental Study of Power Generation and COD Removal Efficiency by Air Cathode Microbial Fuel Cell Using Shewanella baltica 20

Faculty of Engineering Science and Technology, UiT-The Arctic University of Norway, 8514 Narvik, Norway
*
Author to whom correspondence should be addressed.
Energies 2022, 15(11), 4152; https://doi.org/10.3390/en15114152
Submission received: 9 May 2022 / Revised: 2 June 2022 / Accepted: 2 June 2022 / Published: 5 June 2022

Abstract

:
Microbial fuel cells (MFCs) are a kind of bioreactor for generating electricity, facilitated by exoelectrogens while treating wastewater. The present article focuses on the performance of an air cathode plexiglass MFC in terms of chemical oxygen demand (COD) removal efficiency and power output by performing two sets of experiments. The proton exchange membrane and electrode materials were Nafion 117 and carbon felts, whereas, for stable biofilm formation on the anode surface, a pure culture of Shewanella baltica 20 was used. Firstly, sterile Luria-Bertani (LB) media containing lactate, ranging from 20 to 100 mM, was continuously fed to an MFC, and a maximum power density of 55 mW/m2 was observed. Similarly, artificial wastewater with COD ranging from 3250 mg/L to 10,272 mg/L was supplied to the MFC in the second set of experiments. In this case, the maximum power density and COD removal efficiency were 12 mW/m2 and 57%, respectively. In both cases, the hydraulic retention time (HRT) was 1.5 h. It was found that electricity generation depends on the characteristics of the wastewater. These initial findings confirm that the design aspects of an MFC, i.e., surface area to volume ratio, and external resistance with respect to the quality of influent need to be optimised to improve the MFC’s performance.

1. Introduction

The technology of converting chemical energy stored in a wide range of organic matter and wastewater into electrical energy assisted by the biocatalytic activity of microorganisms has attracted the interest of academic researchers in recent decades. The technology for this energy conversion is achieved by microbial fuel cells. A microbial fuel cell (MFC) is a bioreactor capable of treating wastewater by removing pollutants and simultaneously generating electricity using electrochemically active microorganisms. The feedstock for MFC operation to generate electricity can be selected from a wide variety of wastewaters, from simple to complex. MFCs used for wastewater treatment have been studied for the removal of chemical and biological oxygen demand (COD and BOD, respectively), heavy metals, and ammonia (NH3) using biological degradation of organic matter to produce electricity [1]. In order to increase the sustainability of MFC technology for large-scale operations, the recovery of high-value products (such as silver or chromium) from wastewaters from various industries, such as the jewellery, photography, medical/pharmaceutical, personal care product (PCP) and electronic sectors, has also become an essential application [2].
In general, a microbial fuel cell consists of anode and cathode chambers that are separated physically by a cation/proton exchange membrane. Microorganisms present in wastewater act as biocatalysts in the anode chamber, oxidise organic matters, and produce electrons and protons. The produced protons then travel to the cathode chamber through a proton exchange membrane. Whereas, electrons flow to the cathode through an external circuit containing a resistor or a load. In the cathode chamber, protons and electrons react to produce water. By considering acetic acid in the anode chamber as a substrate or a sole carbon source in the anode chamber, the biochemical reaction that occurs in the anode chamber can be represented by [3]:
C 2 H 4 O 2 + 2 H 2 O 2 CO 2 + 8 e + 8 H +
The reaction in the cathode chamber will be:
2 O 2 + 8 e + 8 H + 4 H 2 O
From the biochemical reactions, it is apparent that the presence of oxygen will inhibit the production of electricity. Therefore, MFC should be designed to make the anode chamber anoxic.
Based on the transfer of produced electrons by active microorganisms from media to the anode, two types of MFCs exist: MFCs with a mediator and mediator-less MFCs. Electron transfer through the membrane (a cytoplasmic membrane envelops microorganisms, and is the primary barrier to the external environment) or nanowires produced by bacteria, is referred to as direct or mediator-less electron transfer. In order to enhance the electron transfer to the anode, chemical mediators, such as neutral red or anthraquinone-2,6-disulfonate (AQDS), can be added to the anode chamber [4]; this type of transfer is called mediated electron transfer.
In recent decades, MFCs have drawn attention due to their capability to generate electricity while treating wastewater [5]. Other than electricity generation, they can be used for many different applications, including desalination, chemical production, biosensors and biohydrogen production [6]. In the case of wastewater treatment applications, it is essential to gather more information about BOD and COD characteristics of organic matter to achieve standard effluent wastewater norms. In general, most research studies have concentrated on studying maximum power output instead of COD removal efficiency of MFCs. Few papers have focused on studying the power output using different types of feedstock, including single carbon sources, and artificial as well asnatural wastewater [7,8].
Previously most experiments were performed in batch modes for specific initial COD concentration of feedstock. As expected, these investigations found a proportional correlation between the COD concentration of the feedstock and power output. A Monod-type relationship between power output and substrate concentrations has been obtained earlier [7,9,10].
MFC operation conditions, i.e., flow characteristics and temperature, are essential factors for COD removal rates and the extent of COD removal from wastewater. In the case of isothermal continuous flow operation, the COD removal rates are determined based on the inlet and outlet COD concentrations as a function of the hydraulic retention time (HRT), which is one of the critical operating variables [11,12,13]. A short HRT increases the volumetric loading rate of organic matter to the MFC, resulting in a decrease in COD removal efficiency and power density [14]. COD removal rates are typically reported for the complete cycle in batch andfed-batch reactors based on initial and final COD concentrations [15]. The removal rates of COD are not often checked as this can hamper the current generation during the feeding of new solutions [16].
It was reported that removal efficiency of COD of 94% was achieved by an up-flow tubular MFC treating dairy wastewater with an initial COD of 4300 mg/L after 83–95 days [17]. The removal efficiency was found to be 96% for the same MFC when treating artificial wastewater, as it contained a minuscule quantity of toxic compounds. The higher concentration of microorganisms in the anode chamber contributes to a better mass transfer between the substrate and microbes, resulting in the enhancement of the contact with the anode surface [18] for treating domestic wastewater. It was suggested that, for better COD removal, the HRT for a single MFC should be within the range of 72 to 96 h [17]. The COD concentration of brewery wastewater is 10 times higher than that of domestic wastewater [19]. Nonetheless, overall coulombic efficiency decreases when brewery wastewater is used as a feedstock for MFC, as found in a previous study [20].
For long-term continuous flow operation, COD removal of 94.6% was attained for brewery wastewater, and greater removal efficiency was achieved by dilution [21]. Due to the high fraction of intractable substances present in winery wastewater, only a daily COD removal of 10% was reported [22], inferring a small amount of organic matter removal. An MFC achieved a high reduction of 83% at 14 days HTR for swine wastewater [23,24]. In comparison, for other types, the removal rates were 86.2%, 86.7%, 76.5% and 77.4%, respectively. One explanation for the above findings is that both exoelectrogenic and methanogenic microbes are present in the biomass, and by shifting the balance between these populations in the long-term continuous operation, the power generation efficiency can be modified. Thus, other factors other than the COD concentration of the influent need to be studied to improve an MFC’s coulombic efficiency.
It is essential to acquire a better understanding of the correlation between the current generation and COD removal in the aerobic or anaerobic processes within the MFC so that the MFC system can be designed for maximum energy generation and efficient wastewater treatment. The depletion of organic matter concentration in the MFC reactor depends on the arrangement of the electrical circuit. With a lower resistance, the concentration of organic matter decreases faster and produces higher current densities. In contrast, the depletion rate of organic matter is much slower for an open circuit arrangement. Ren et al., 2014 [25], reported that the achieved removal of organic matter was 67% after 9 h of operation for an open circuit arrangement, and removal of 88–92% was attained for a closed circuit over the same time. A higher OCV is not a good parameter for evaluating an MFC’s performance as it only measures the potential difference between the two electrodes when no electrons are flowing (current), because there is no transfer of electrons to complete the oxidation-reduction reaction (i.e., formation of water at the cathode). OCV only indicates the extent of activation losses in a cell and compares it with theoretical cell emf (electromotive force), whereas, for energy harvesting, external resistance is necessary. If existing bacteria are primarily exoelectrogenic, the current production starts after some time, based on the bacterial growth rate and reactor condition. Thus, external resistance and organic loading rate both influence the balance between exoelectrogenic activity and coulombic efficiency. To achieve maximum output power density, it is important that the reactor operates at minimum internal resistance and mass transfer losses. Therefore, closed circuit MFC studies are important to establish an optimal operating regime for an MFC for both maximum COD removal and coulombic efficiency.
In the present study, the performance of a small-scale air cathode MFC was investigated in terms of its COD removal efficiency. In the previous literature, Shewanella sp., namely Shewanella putrefaciens and Shewanella oneidensis, are commonly used for MFC operation. However, Shewanella baltica is a newly isolated bacterium whose performance regarding MFC application has not been widely explored. Therefore, a pure culture of Shewanella baltica 20 was selected for the present investigation for biofilm formation on the anode surface. Shewanella baltica 20 is a facultative bacterium capable of absorbing significant quantities of Fe(III) from its medium in aerobic conditions and reducing it to Fe(II) in anaerobic conditions. Furthermore, Shewanella baltica 20 has the potential to oxidise organic matters from the reduction of nitrate and sulphur compounds in anaerobic conditions [26]. Different lactate concentrations of microbial growth medium for Shewanella baltica 20 and influent COD concentrations of artificial wastewater were used in this study. The external resistance was varied to investigate various losses and to analyse the power output at different resistances. Thus, the paper outcome presents the wastewater treatment (i.e., COD removal) ability in tandem with the electricity generation capability of the selected air cathode MFC design.

2. Materials and Methods

A small-scale air cathode MFC design was selected for this study. A series of experiments using electrochemically active microorganism Shewanella baltica 20 were conducted. The details of different components of MFC, microbial growth conditions and experimental procedures for MFC operation are provided in the following sections.

2.1. MFC Assembly

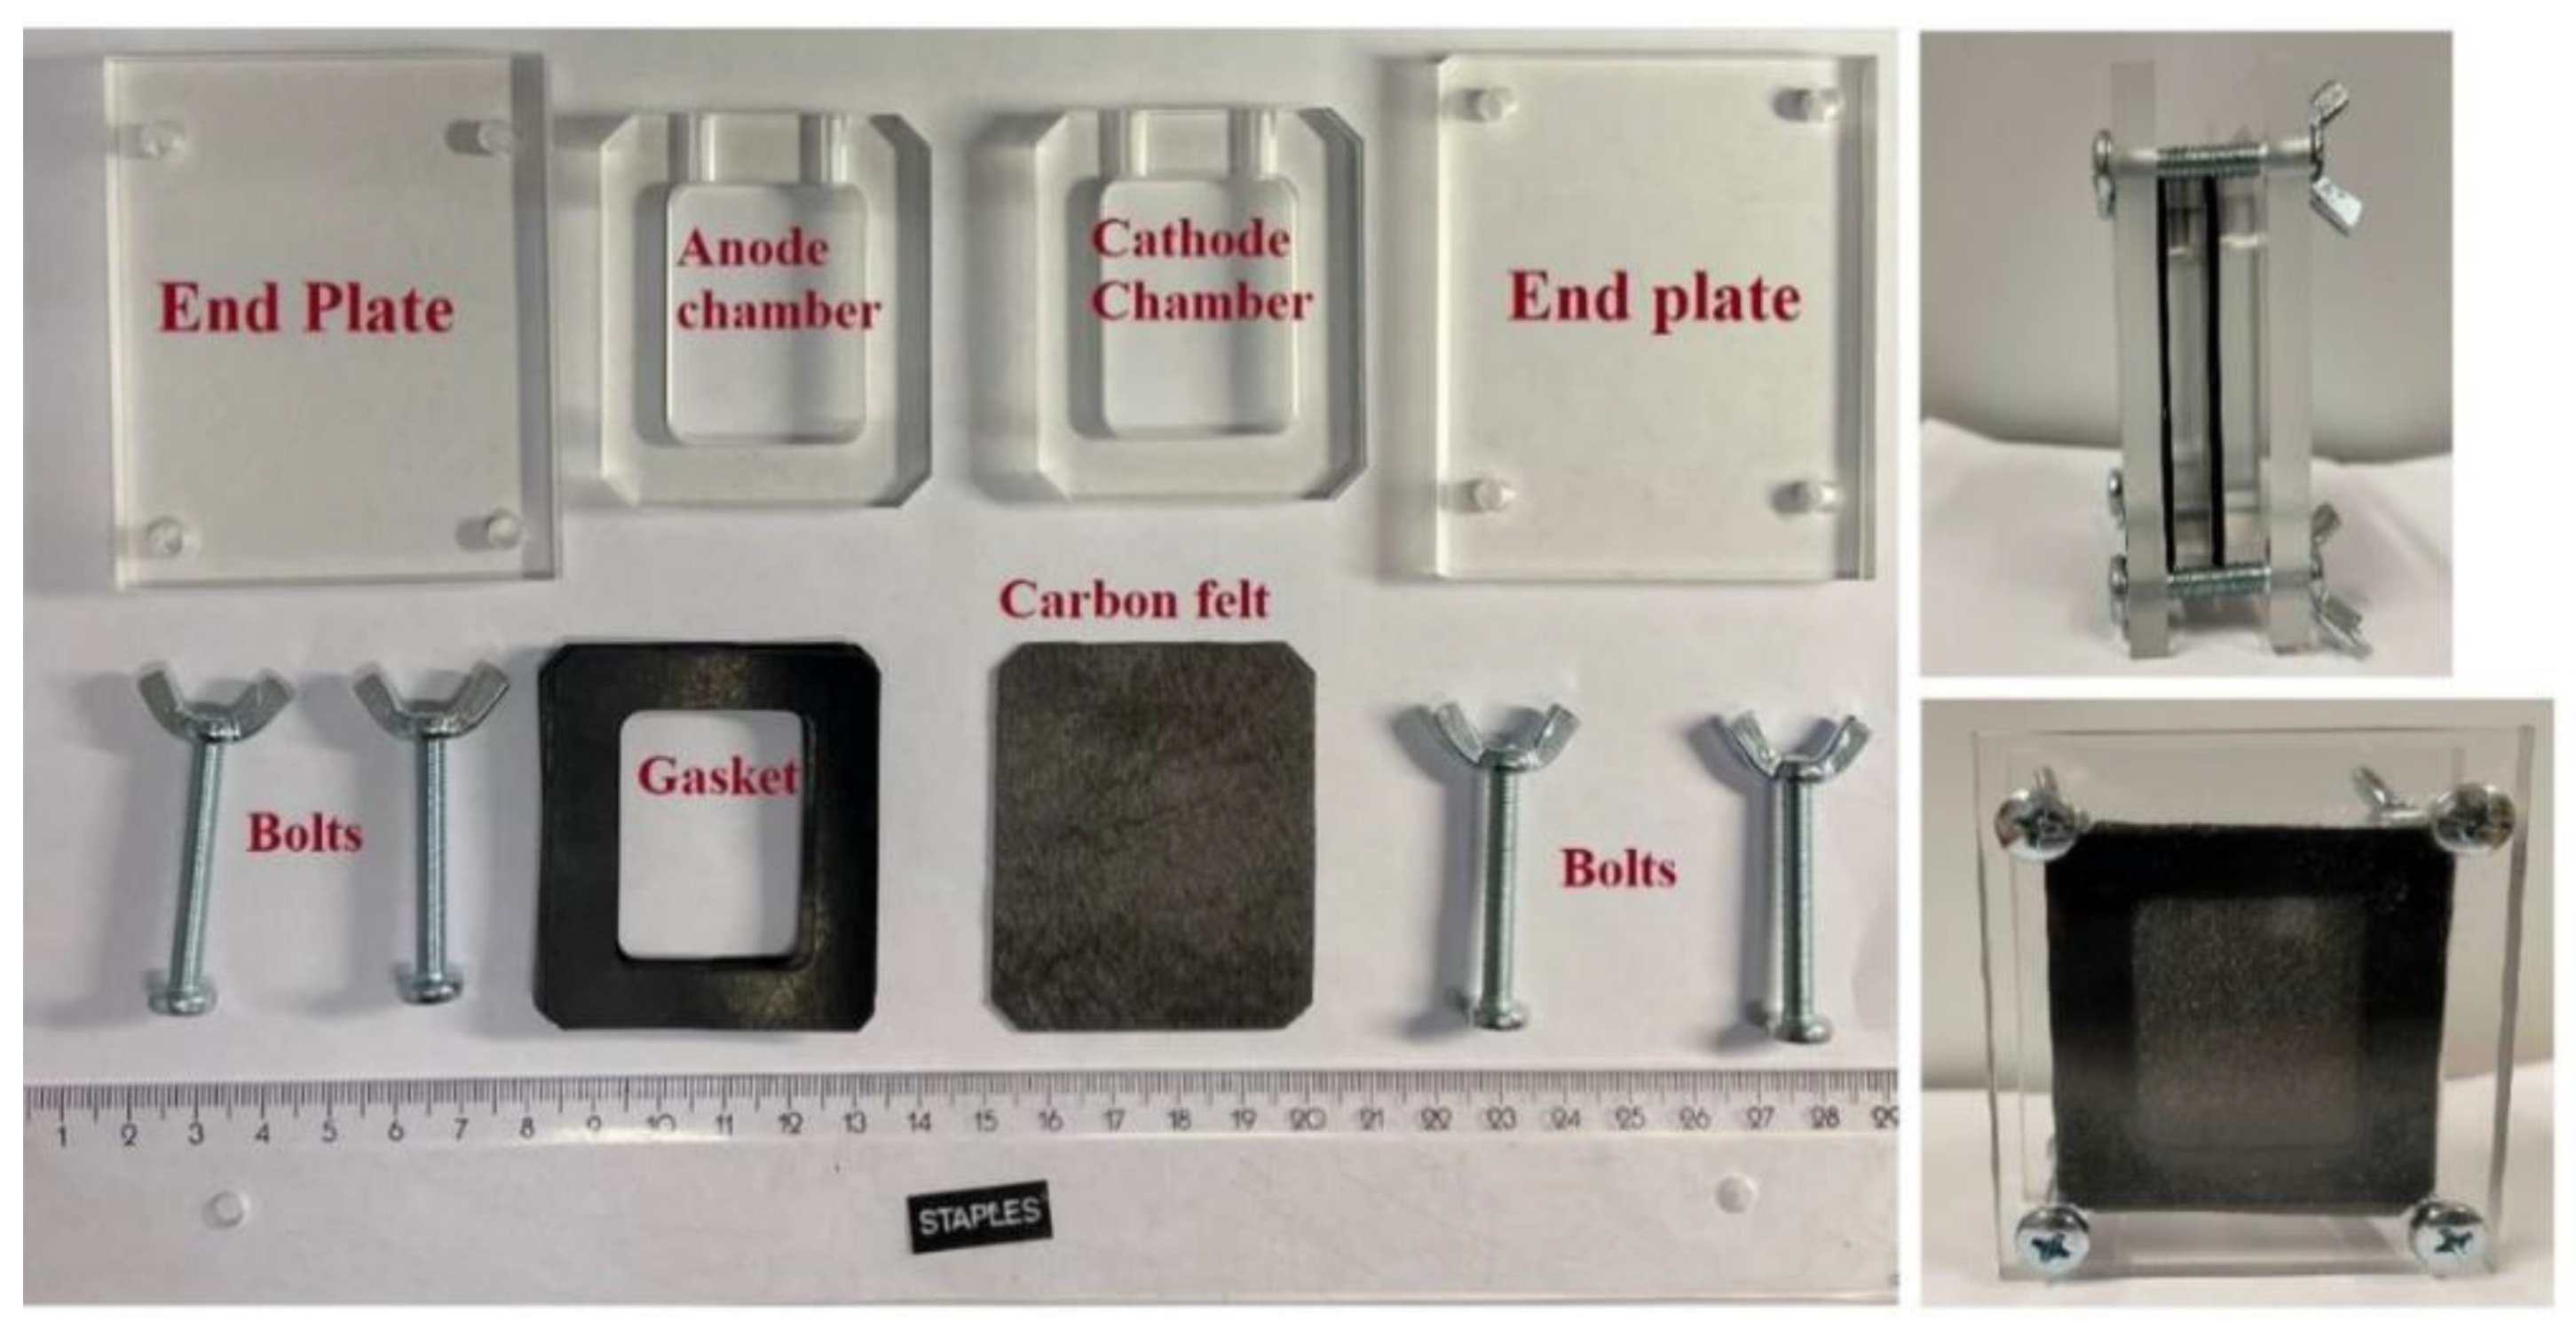
A plexiglass material was used to fabricate the anode and cathode chamber and end plate for both sides of the MFC. The dimension of each chamber was 30 × 40 × 7.5 mm, resulting in a working volume of 9 mL. Inlet and outlet ports were included in the anode chamber to allow the flow of wastewater in and out of the chamber.
The electrode material for both anode and cathode was selected as carbon felt having a dimension of 40 × 50 × 0.2 mm. A proton exchange membrane (PEM; NAFION 117, Sigma–Aldrich) was used to separate the two compartments. In order to prevent leakage, 1 mm rubber gaskets were used for both the anode and cathode sides. The anode and cathode compartments were filled with deionised water when the microbial fuel cell was not in use to maintain the conductivity of the membrane. The components of the MFC are shown in Figure 1.

2.2. Bacterial Culture Conditions

An exoelectrogen, gram-negative bacterium, Shewanella baltica 20, was selected for the present investigation. This bacterial strain was received from the department of medical microbiology and immunology, University of Pécs, Hungary. In our preliminary experiments conducted with the biotechnology laboratory of Sintef, Narvik, Norway, Shewanella baltica 20 showed good biofilm formation on both carbon felt and carbon cloths.
Shewanella baltica 20 is a facultative anaerobe, and was grown in Luria Bertani (LB) media at 25 °C for 48 h. After achieving a full-grown microbial population determined by plating, four different batch operations were performed to assess the microbial growth kinetic of Shewanella baltica 20. In each batch, experiments were conducted in an Erlenmeyer flask by varying initial lactate concentrations from 20 to 100 mM in the LB media. At every 3 h interval, samples were collected for further analysis.

2.3. Experimental Procedure

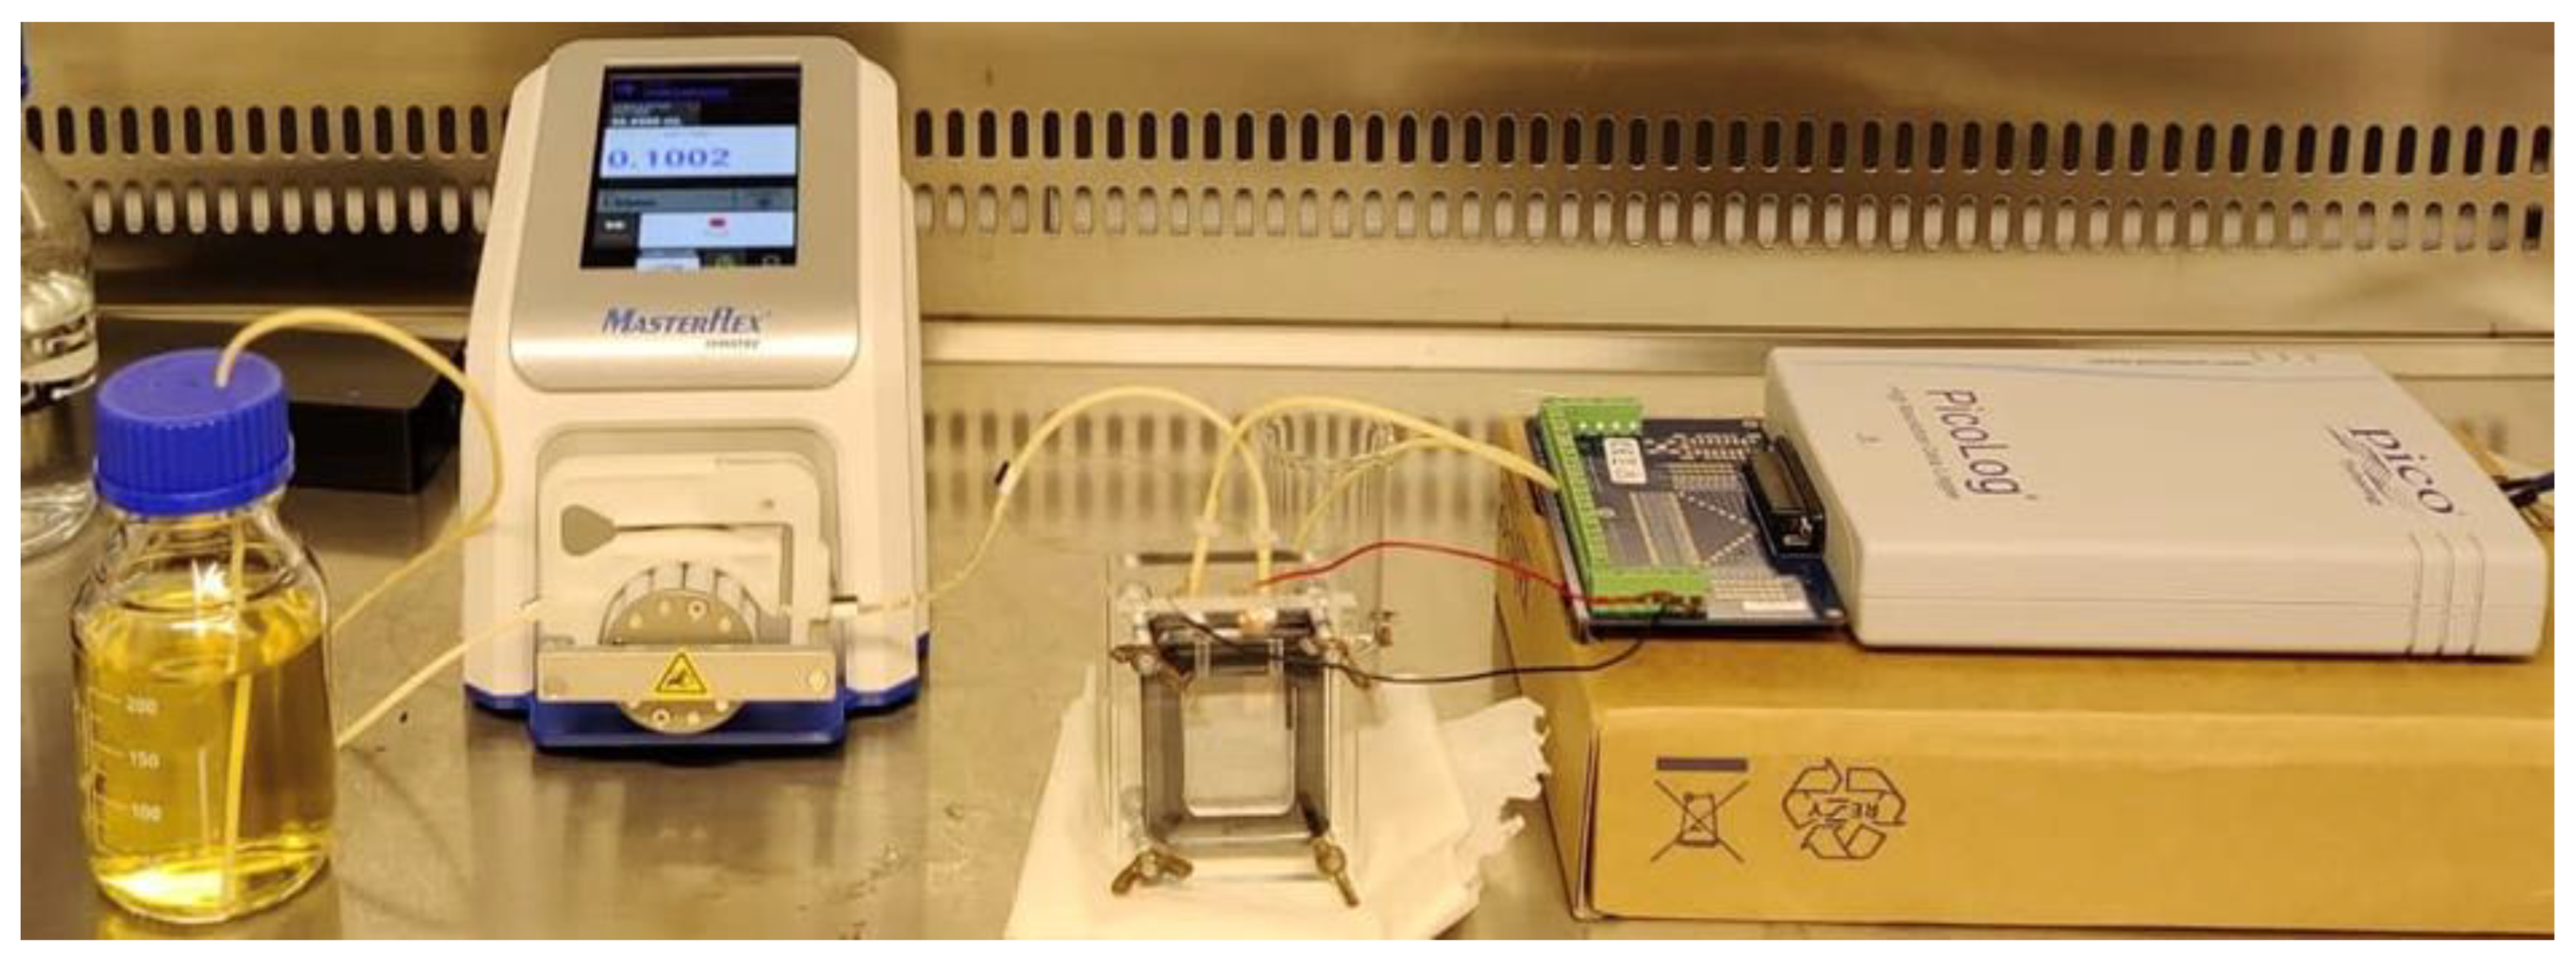
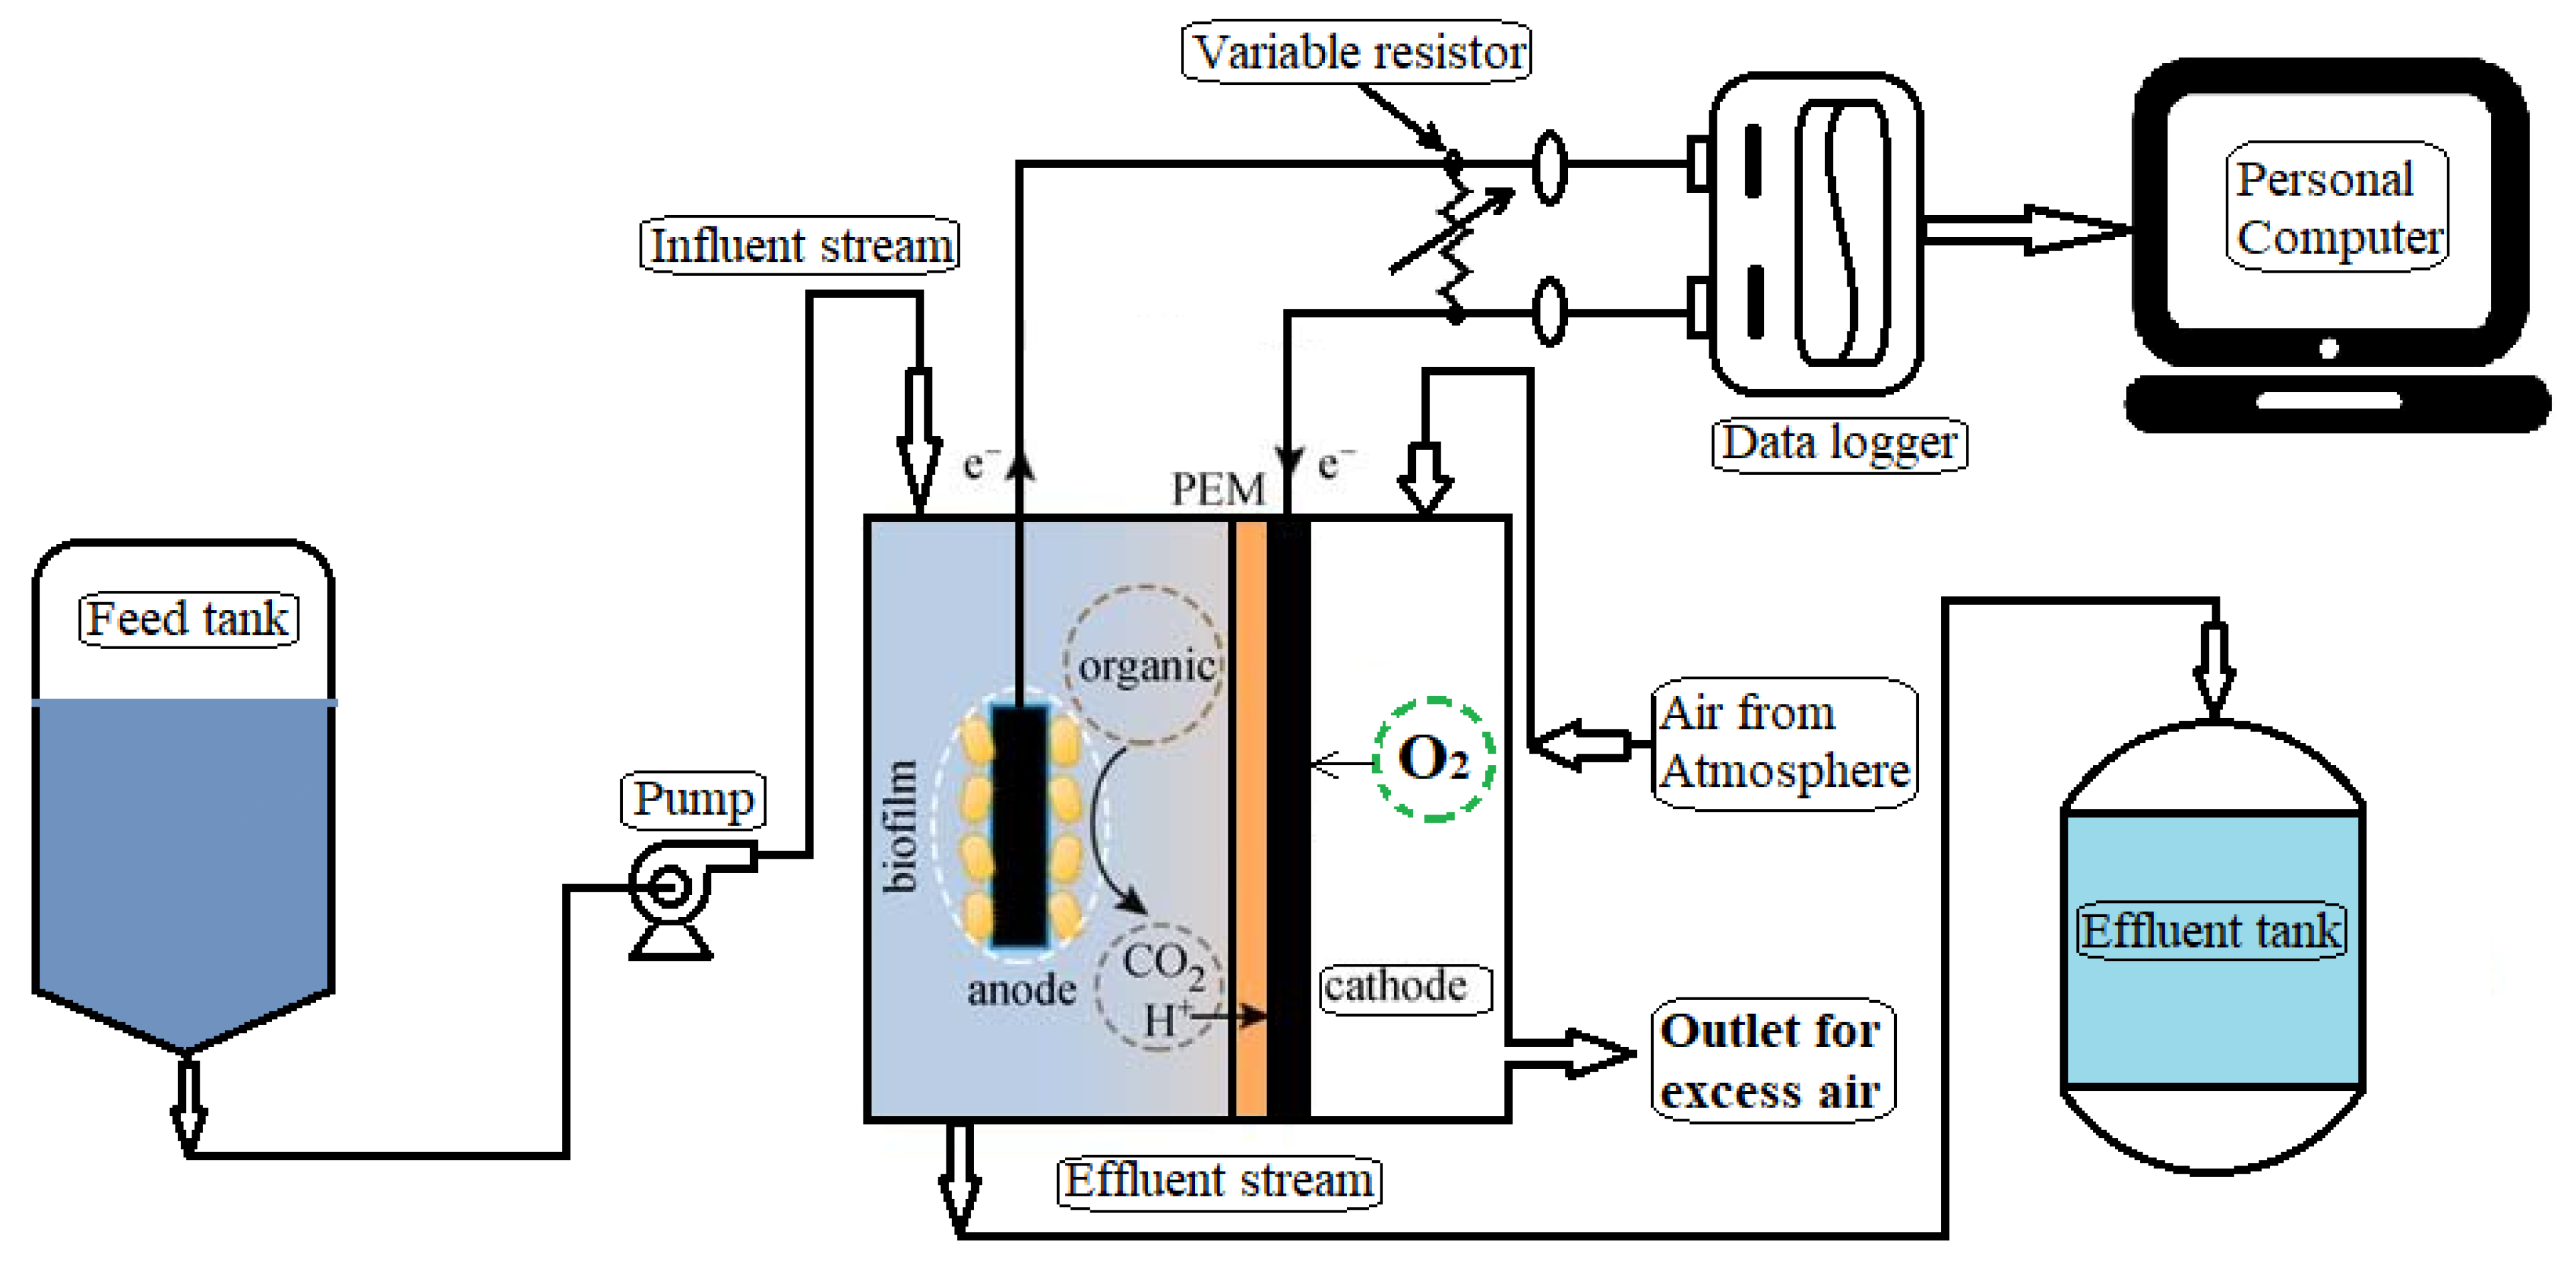
The microbial fuel cell was fed with lactate-rich LB media containing Shewanella baltica 20 with an optical density of 0.3 (at 600 nm) to enrich the anode chamber with the microbial community for the development of biofilm on the anode surface. The two electrodes were connected to a voltage data logger (Picolog), and the data were recorded on a personal computer. The open-circuit voltage was recorded for seven days until a stable voltage output was obtained from the MFC.
After achieving a stable open-circuit voltage, the MFC was fed continuously with lactate-containing LB media without the presence of bacterial strain. In addition, anode and cathode were connected with resistance to obtain the current output. The current outputs were observed for different lactate concentrations of the LB media. The details of the experimental setup are presented in Figure 2 and shown schematically in Figure 3.
In a similar manner, the feed for the MFC was replaced with artificial wastewater, mimicking dairy wastewater containing NH4Cl, 40 mg/L; MgCl2, 10 mg/L; CuSO4, 0.1 mg/L; CaCl2, 5 mg/L; MnSO4, 0.1 mg/L; ZnCl2, 0.1 mg/L; phosphate buffer (1.0 mol/L, pH7); in addition, the lactate concentrations were varied. In this case, the current outputs were also observed and recorded. In both cases, the flow rates of LB media and synthetic wastewater were 0.1 mL/min. The samples from the outlet of the anode chamber were collected for each change in lactate concentration to determine the lactate consumption and COD removal by the MFC.

2.4. Data Acquisition and Calculations

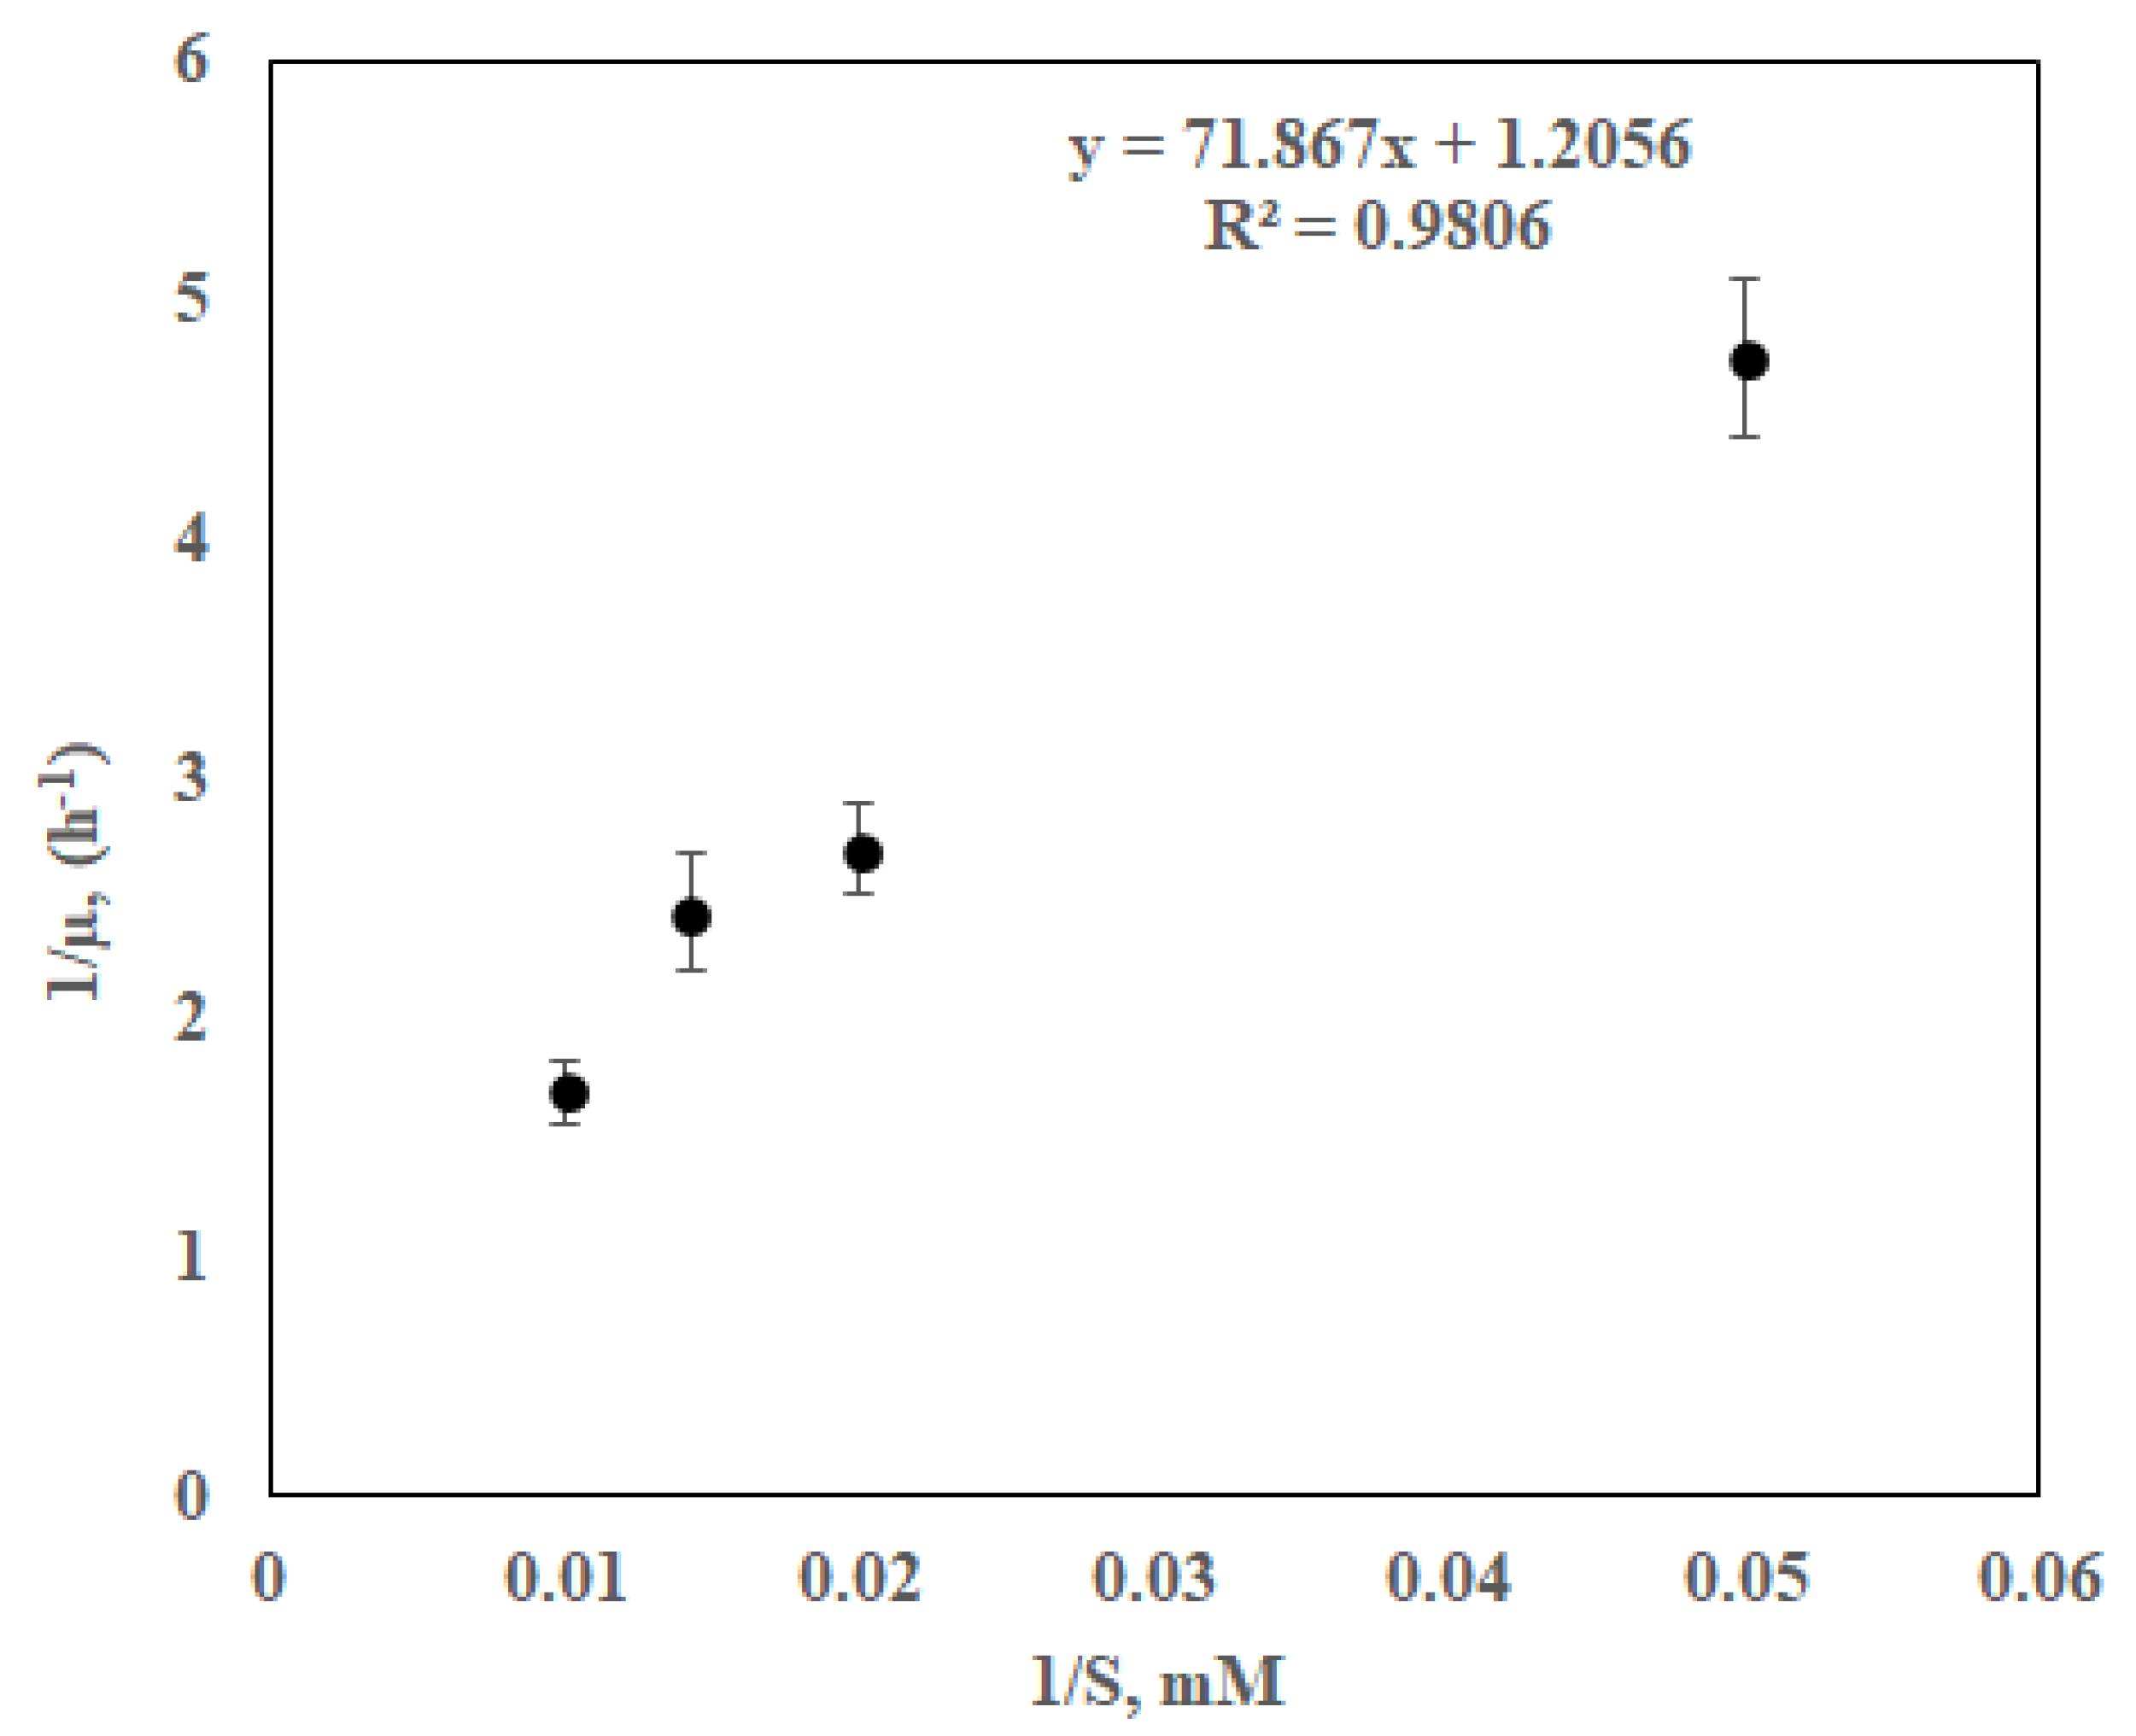
During the characterisation of microbial growth of Shewanella baltica 20, the biomass concentrations were measured using a spectrophotometer at 600 nm. The obtained viable microbial population was calculated in CFU/mL which is estimated by multiplying colony count by dilution multiple The lactate concentrations were measured by the rapid colourimetric method using the D-Lactate Assay kit (Megazyme). A DR3900 Laboratory spectrophotometer was used for measuring the chemical oxygen demand (COD) of influent and effluent streams of the anode chamber of the MFC. After obtaining a stable current for each change in COD in artificial wastewater, the polarisation curve was obtained by applying external resistance from 5 KΩ to 100 Ω. The output voltages were recorded using Ohm’s law, the output currents were calculated, and the polarisation curves were obtained. The online voltage and current were recorded through PicoLog, a high-resolution data logger. Linear sweep voltammetry (LSV) using a PalmSens4 potentiostat was used to determine MFC’s internal resistance.

3. Results and Discussions

3.1. Bacterial Growth Characteristics

Four batch experiments were conducted to understand the microbial growth characteristics of Shewanella baltica 20. For each batch experiment, the initial concentration of lactate, as the primary carbon source was varied from 20 to 100 mM. For each variation in lactate, the microbial growth curves were obtained. The growth kinetics of Shewanella baltica 20 were determined using Monod-type growth model. The specific growth rate, µ (h−1), for each initial lactate concentration, S (mM), was calculated by linearising the Monod microbial growth equation using the Langmuir–Hinshelwood mechanism [27]. The linearisation curve is presented in Figure 4. From the literature, it was found that microbial growth is also influenced by the nitrogen source present in the LB media [28].
Therefore, the bacterial growth presented in this study was influenced by both lactate and the nitrogen source, respectively. Another observation is that there was no presence of substrate inhibition within the range of 20 to 100 mM of lactate concentration. This kind of growth study is helpful in order to predict the flow rate of influent stream or hydraulic retention time, or the dilution rate of the influent for continuous MFC operation. From Figure 4, the maximum specific growth rate, µmax (h−1) of Shewanella baltica 20 was determined to be 0.83 h−1; that is, the maximum possible hydraulic retention time should be above 1.2 h for continuous MFC operation.

3.2. MFC Operation: Stable Current and Power Production

At the beginning of the MFC experiment, the anode chamber, which was filled with distilled water, was replaced with LB media containing 50 Mm of lactate and bacterial culture having an optical density (OD) of 0.3 at 600 nm. The feeding of LB media was accomplished using a peristaltic pump at a flow rate of 0.1 mL/min through the inlet port of the anode chamber. After replacing the distilled water with LB media, the inlet and outlet ports of the anode chamber were closed. The two electrodes were then connected with a voltage data logger, and the data from the datalogger were recorded using a personal computer. After day 7, a stable open-circuit voltage of 758 ± 7 mV was detected through the voltage data logger. When this stable voltage persisted for 12 h, the anode and cathode were connected through a resistor of 5 kΩ. A sharp fall in voltage was observed, and the voltage became stable at 468 mV. The MFC was then fed continuously with LB media containing 100 mM of lactate without the presence of bacterial culture. The flow rate of the inlet stream to the anode chamber was kept constant at 0.1 ml/min. After 75 min, a stable voltage and current were observed. In a similar manner, the lactate concentration of the feed stream was progressively changed to 70, 50 and 20 mM. For each change in lactate concentration, sharp changes in stable voltage and current were observed and recorded.
In order to observe the acceptance of the present MFC of wastewater, and the MFC’s performance, the anode chamber of MFC was replaced with artificial wastewater at different COD values. The characteristic of milk processing effluents from the dairy industries varies from a low COD of 0.5 g/L (mixed dairy) to 10.2 g/L (cheese, cottage cheese, whey) [29]. As the artificial wastewater in the present investigation mimicked dairy wastewater, the COD values were maintained within the range of 3250 to 10,272 mg/L. It was found that the MFC with biofilm formation of Shewanella baltica 20 performed well with artificial wastewater. The performance of the MFC at different lactate concentrations in LB media and different COD values in artificial wastewater is discussed in the next section.

3.3. Effect of Lactate Concentration on Power Density

Firstly, performance of the MFC was analysed in terms of power density by varying the lactate concentration in the LB media. The lactate concentration in LB media was maintained within the range of 20 to 100 mM, as shown in Figure 4.
Figure 5 presents the polarisation curve of the MFC at different lactate concentrations. The first part of the figure (Figure 5a) represents the voltage drop of the MFC from an open circuit to the closed-circuit condition at different lactate concentrations in LB media as a function of current density. For each lactate concentration of the liquid media, the closed-circuit resistances of the MFC were changed from 5 kΩ to 100 Ω. At each step change in resistance, the voltage was recorded, and the current was calculated using Ohm’s law (I = V/R). The second part of Figure 5b shows the power (P = V2/R) densities as a function of the current density for each change in lactate concentration. These figures show that the maximum power of 55 mW/m2 was obtained when the lactate concentration in the feed was 100 mM and the corresponding current was 191.5 mA/m2.

3.4. Effect of COD on Power Density

The performance of the MFC was analysed in terms of power density when the MFC was fed with artificial wastewater. In this case, the concentrations of organic load, termed COD, were varied from 3250 mg/L to 10,272 mg/L. The initial and final COD of the artificial wastewater were determined to calculate the COD removal efficiency by the MFC.
Figure 6 presents the polarisation curve of the MFC at different COD values.
The first part of Figure 6a represents the voltage drop of the MFC from an open circuit to the closed-circuit condition at different COD values in artificial wastewater as a function of current density. For each COD concentration of artificial wastewater, the closed-circuit resistances of the MFC were changed from 5 kΩ to 100 Ω, similar to the previous case where lactate concentrations were altered. At each step change in resistance, the voltage was recorded, and the current was calculated as discussed previously. The second part of Figure 6b shows the power (P = V2/R) densities as a function of current density for each change in COD. These figures show that the maximum power of 12 mW/m2 was obtained when the COD concentration of artificial wastewater was 10,272 mg/L and the corresponding current was 133 mA/m2. There was a direct correlation between the organic load and the applied external resistance. It is clear that there is an optimum range of external resistance for each COD level where maximum power can be drawn. Beyond this range, the cell will starve because mass transfer loses increase dramatically, and no current will be produced.
The COD removal percentage of the MFC for each initial organic load for a particular HRT of 1.5 h is presented in Figure 7. It was found from the experiments that, for this particular HRT, the COD removal efficiency is quite low compared to that of previously reported research articles. When the MFC was fed with a COD value of 3250 mg/L, a percentage removal of only 37.5% was achieved; and further increase in COD values of 4928 mg/L, 7616 mg/L, and 10,272 mg/L, the achieved percentage removal were 52%, 57% and 55%, respectively. The maximum possible COD removal for the present MFC at a hydraulic retention time of 1.5 h was 57%. If the present MFC was operated for a higher HRT, better performance in terms of COD removal efficiency would be possible. In addition to HRT, the causes of lower COD removal may be the lower substrate uptake rate, the chemical constituents of artificial wastewater or the presence of inhibitors for microbial growth. The previous literature reports a higher value of COD removal of 94% by increasing the HRT to a range of 72 to 96 h [17]. Since the working volume of the present MFC is 9 mL, it is quite impractical to operate it at such high HRT. In this case, the MFC operation would be performed as a batch instead of in continuous mode.
It is also essential to understand the influence of external resistance on power generation by the MFC as it can help in determining the optimised different wastewater treatment processes [30]. In the present study, the maximum power density obtained from both cases, the MFC fed with lactate and artificial wastewater, is presented in Figure 8.
The maximum power densities obtained for each lactate concentration and its corresponding resistance are presented in Figure 8a. Figure 8b illustrates the maximum power densities obtained for each COD concentration and its corresponding resistance. The maximum power densities and corresponding resistance for both cases were obtained from Figure 5 and Figure 6. It can be seen in Figure 8 that maximum power densities were achieved when the external resistance was within the range of 1.1–1.3 kΩ, when the MFC was operating with lactate. In the case of the MFC with artificial wastewater, the achieved range of external resistance was from 0.5 to 0.85 kΩ. Although, for both cases, external resistance was varied from 5 kΩ to 100 Ω, the optimised resistances to obtain maximum power density were different.

4. Conclusions

This study investigated the performance of a small-scale MFC in terms of power output and COD removal efficiency for artificial dairy wastewater. The study also illustrated that external resistance is an important operating parameter for process optimisation to gain maximum power density.
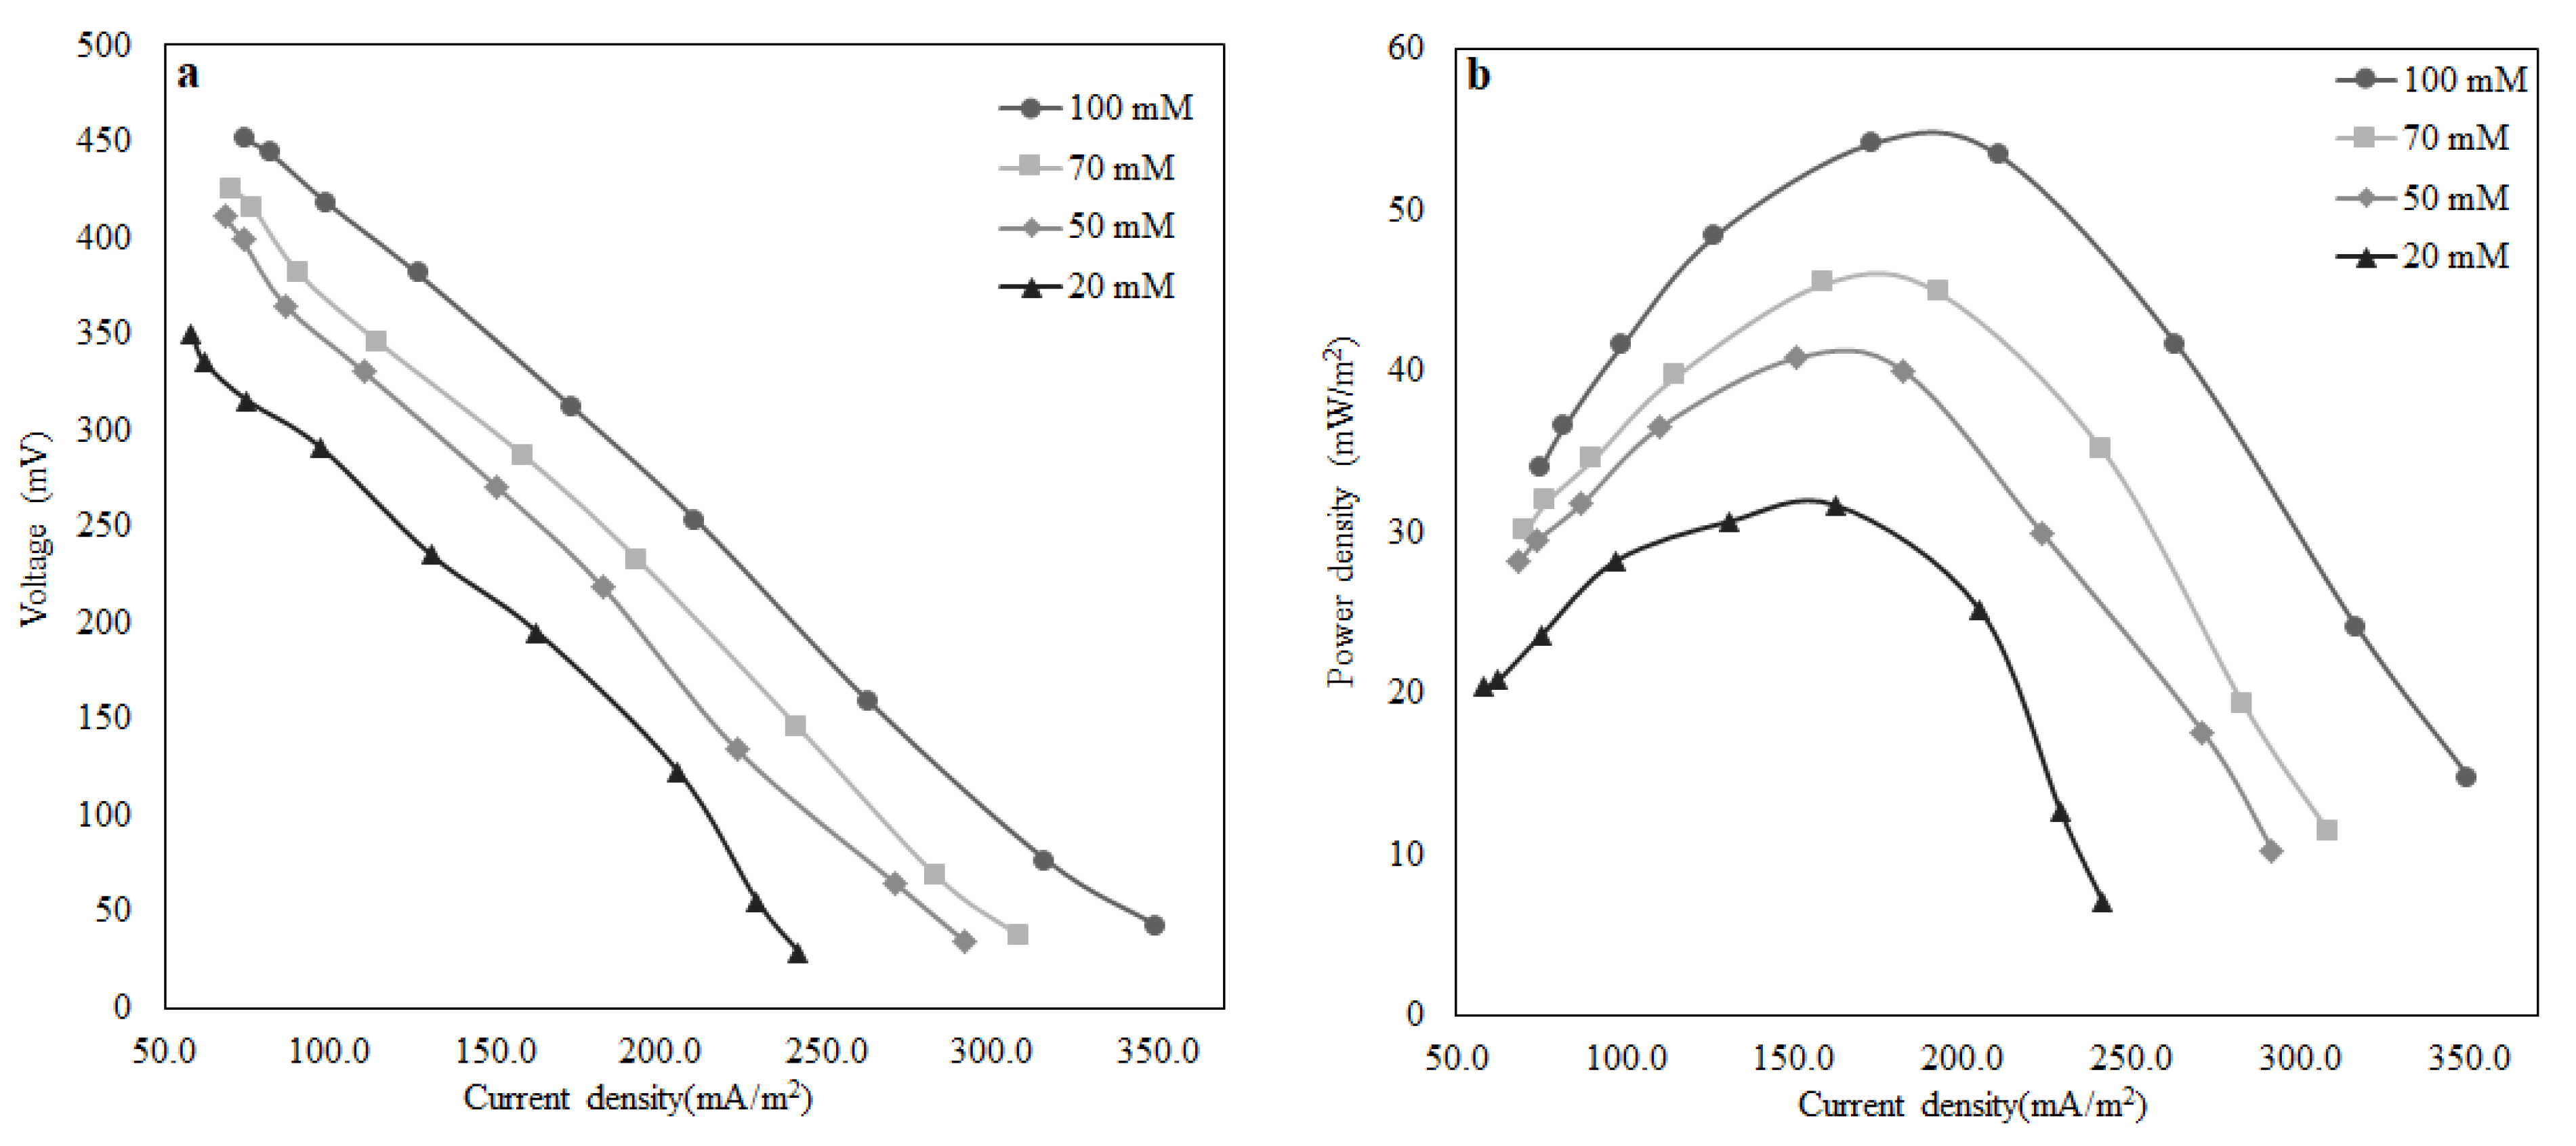
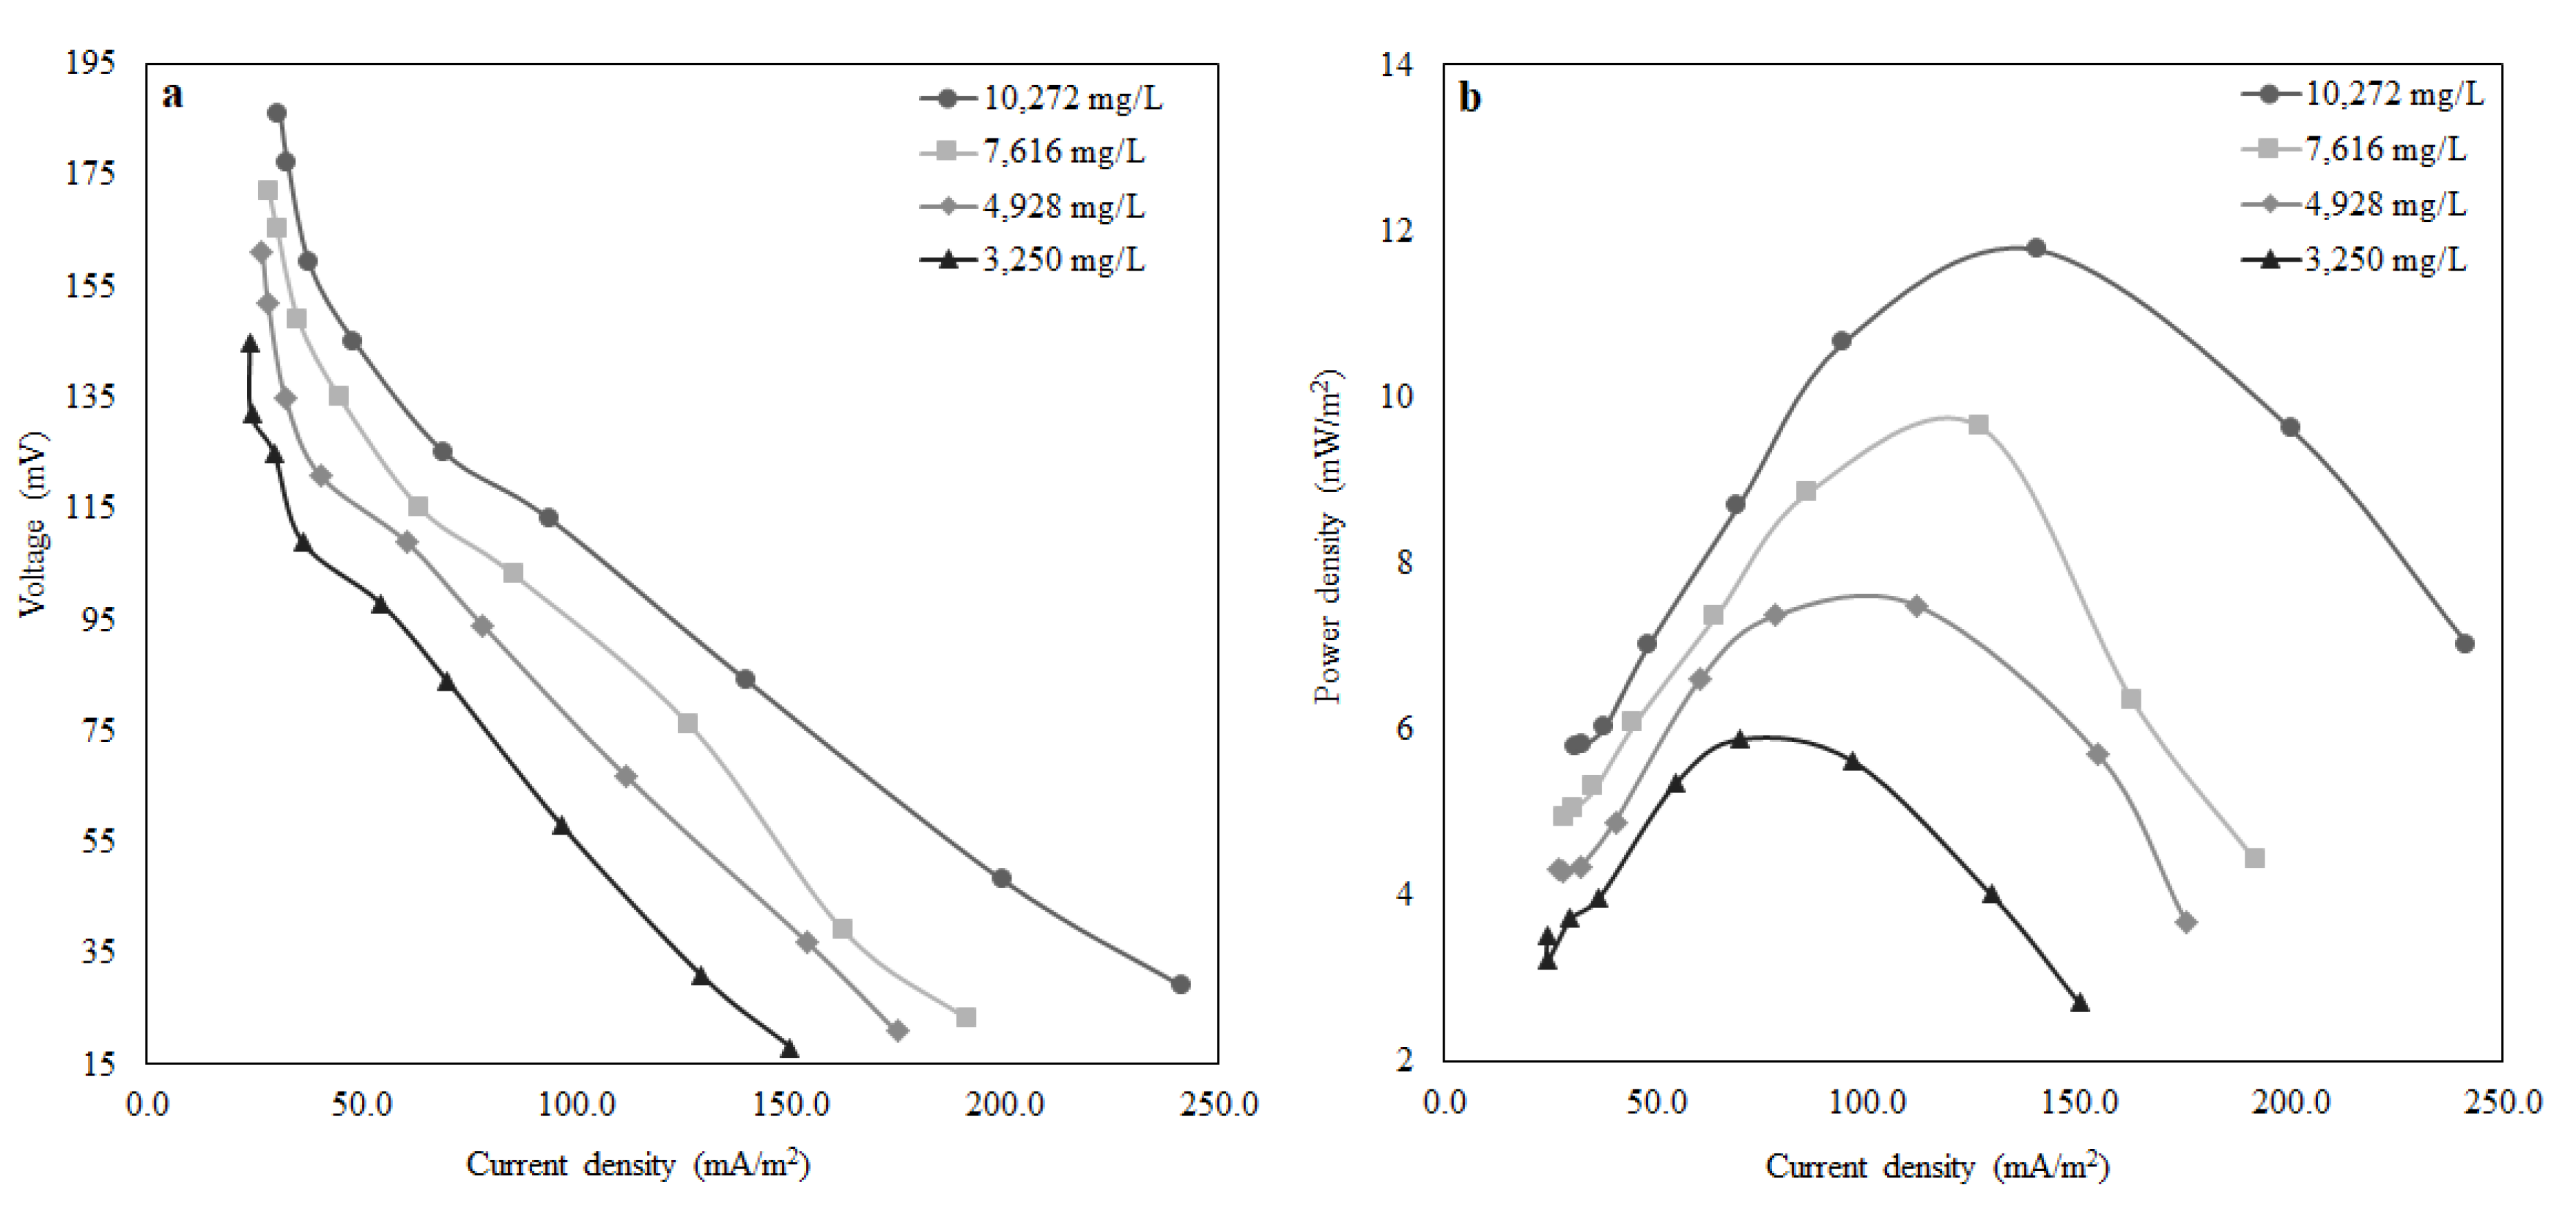
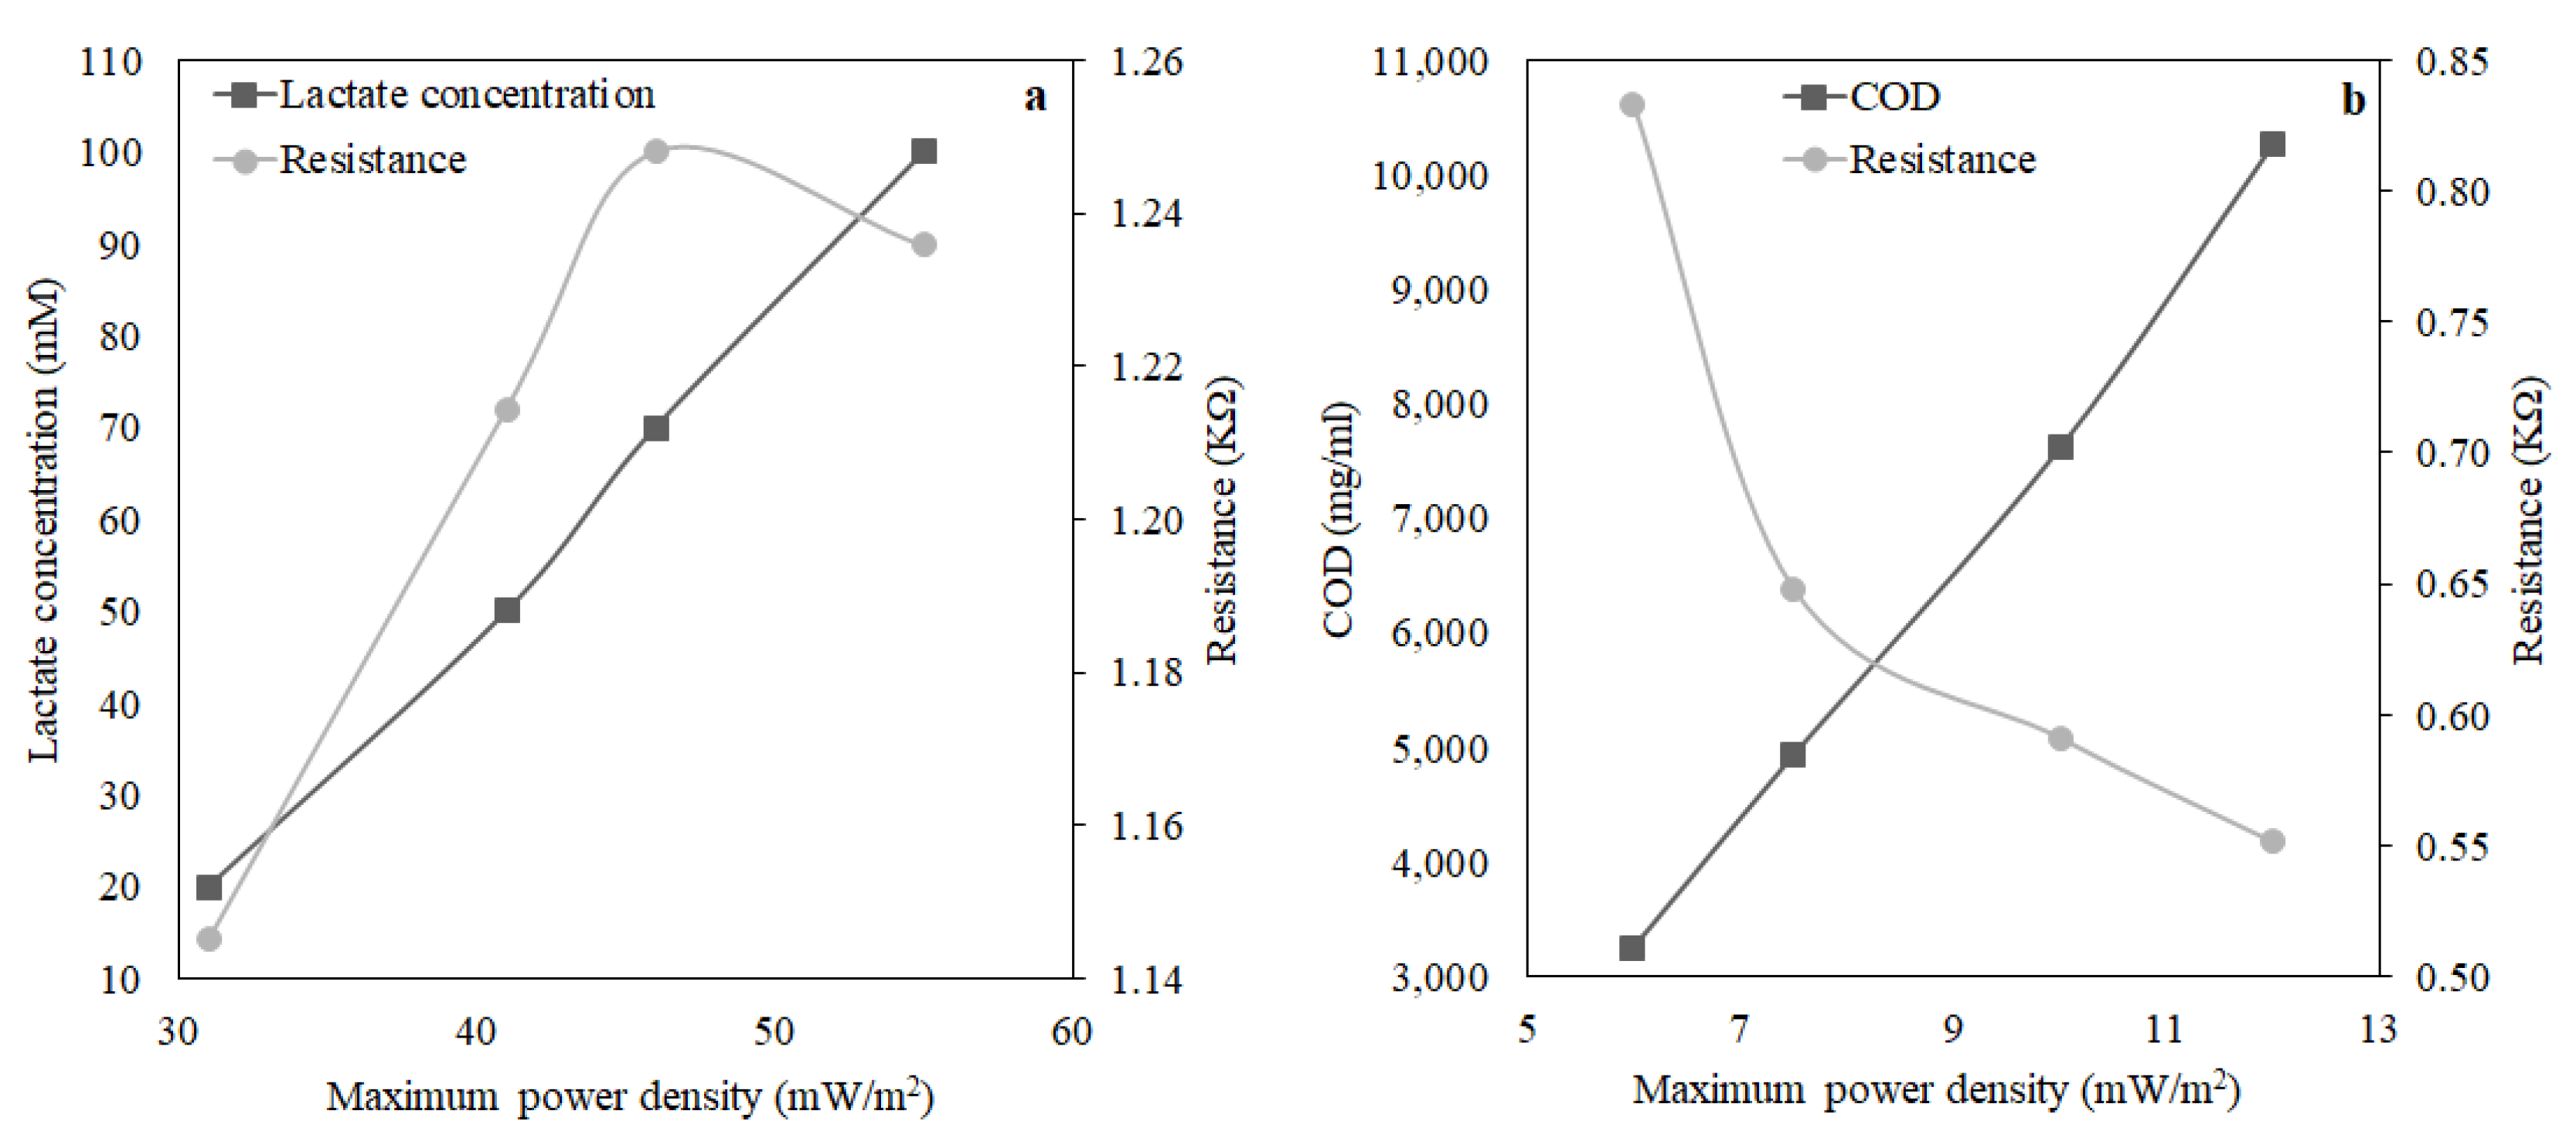
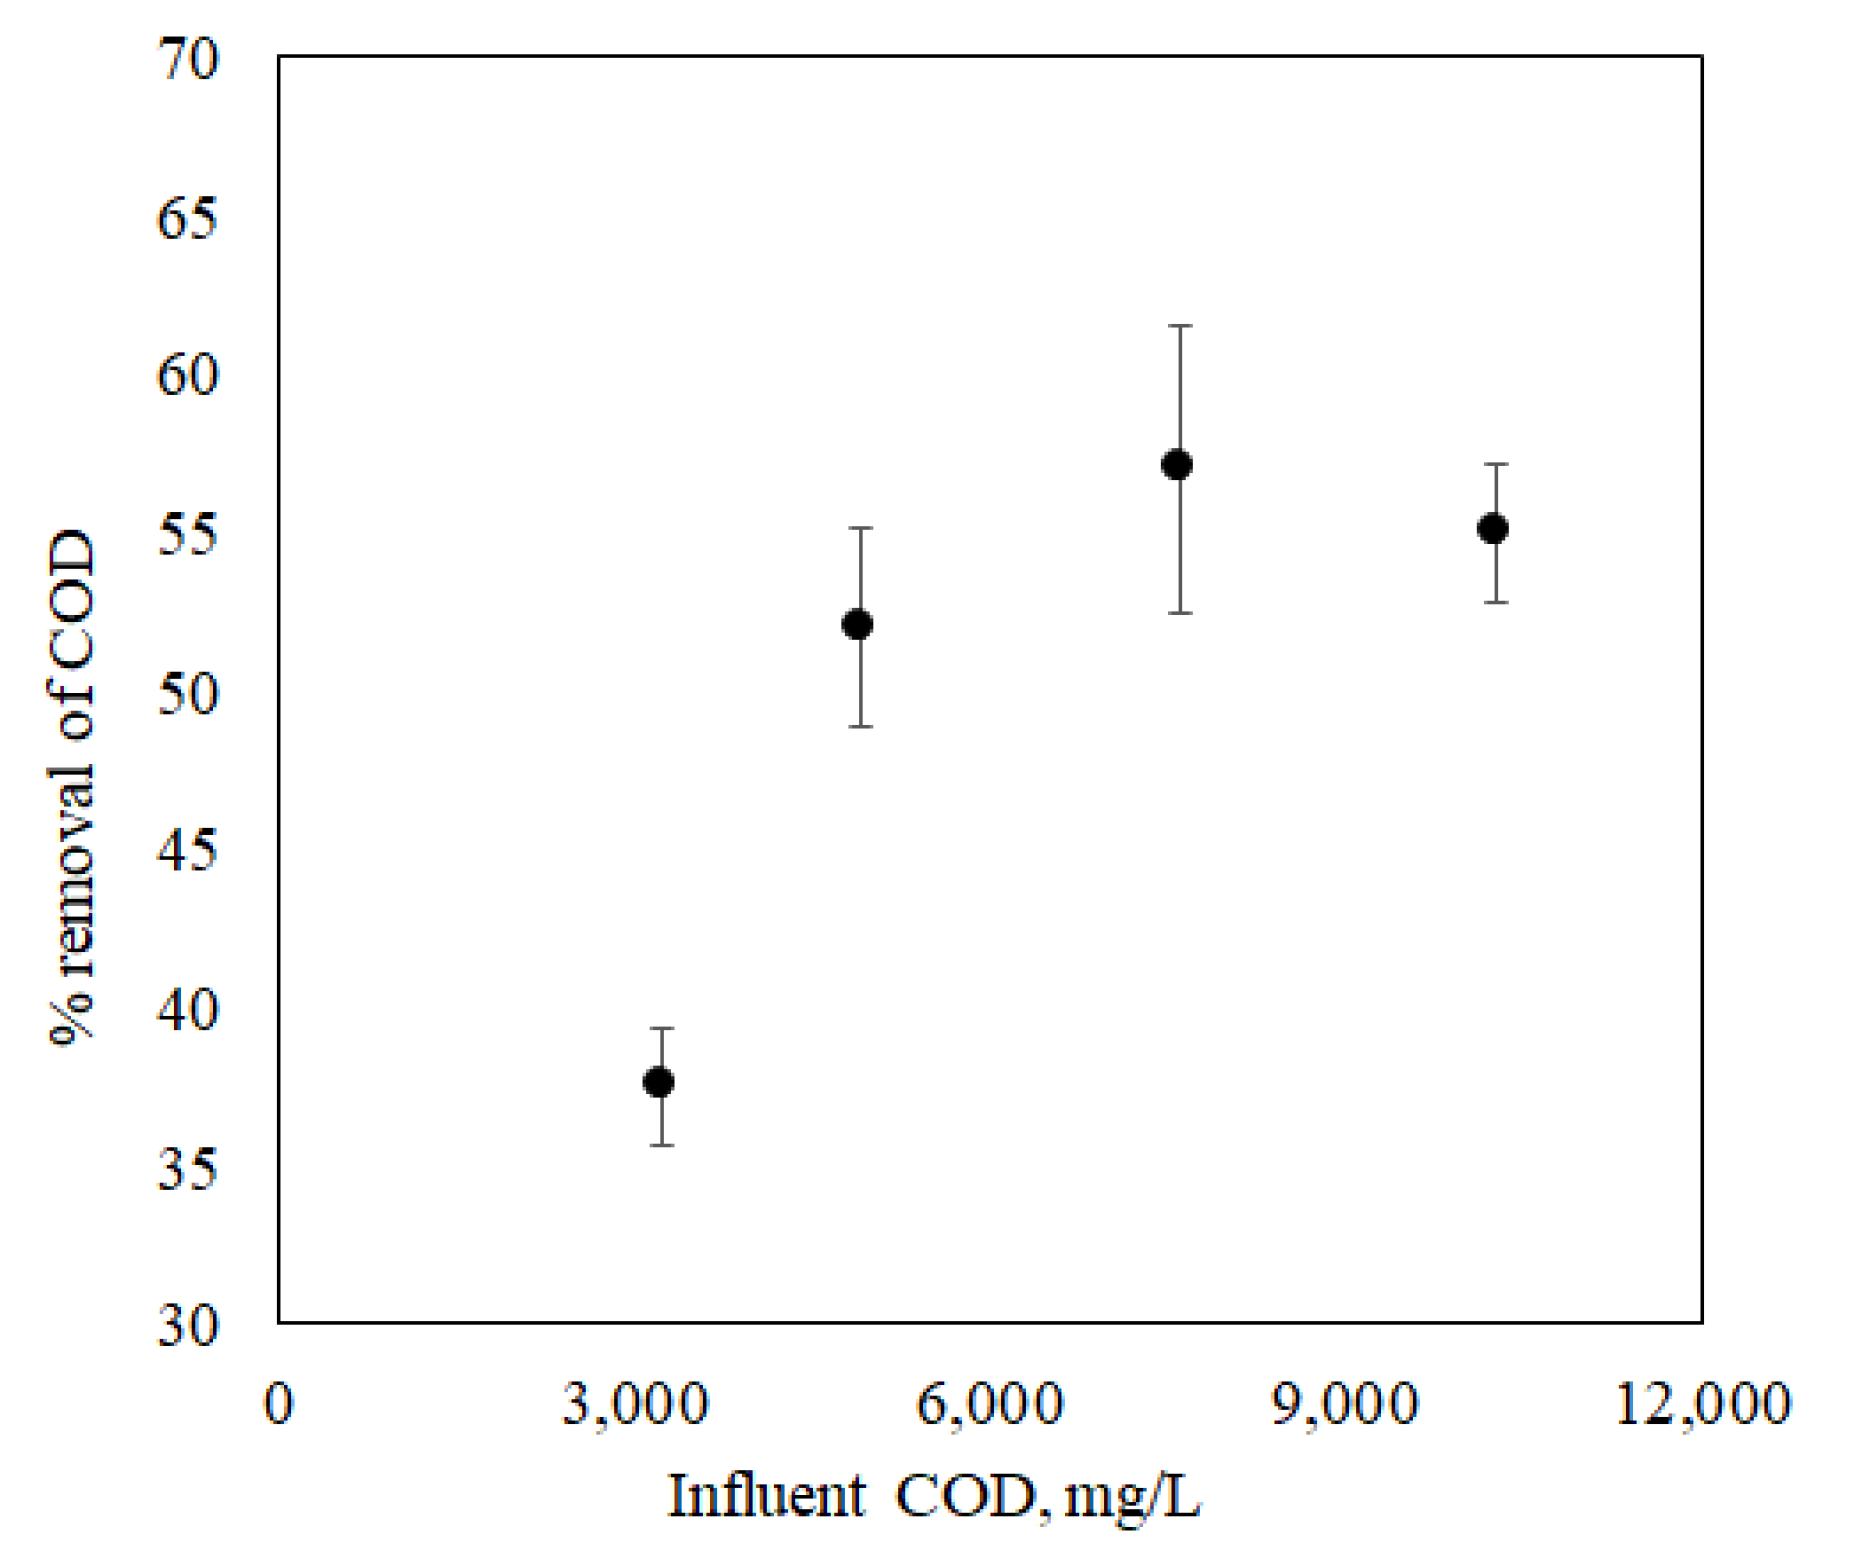
The pure culture of Shewanella baltica 20 indicated a good response to the presence of lactate in the growth medium. A maximum power density of 55 mW/m2 was observed when the MFC was fed with LB media containing 100 mM of lactate at an HRT of 1.5 h. In addition, the performance of MFC using artificial wastewater was examined, and a maximum power density of 12 mW/m2 was obtained, which is relatively low compared to the previous case where the MFC operated with lactate. The reason behind lower power output is that the microbial community takes a relatively long time to regain the electricity generation capacity as the substrate was altered. The MFC achieved a COD removal efficiency of 57% for an HRT of 1.5 h. In the above case, where the MFC was operated to treat wastewater by removing organic matter, it performed well by removing 57% of COD at an HRT of 1.5 h. Working with this small-scale MFC at an HRT higher than 1.5 h is impractical as the MFC operation will be close to a batch system, and there will be no point in considering HRT as an operating variable. Earlier literature reported that at higher HRT, COD removal was more than 94% because there is a direct correlation between the percentage removal of COD and HRT. Furthermore, observing the influence of external resistance on power density and wastewater treatment efficiency (percentage removal of (COD)), it can be inferred that optimised external resistance depends upon the quality of influent fed to the MFC. It was also reported that for maximum energy harvesting, other relevant factors include the supply and consumption of oxygen by the cathode, oxidation of substrates in the anode, efficient electron shuttling from the anode compartment to the anode surface, and the permeability of the proton exchange membrane are accountable. Therefore, additional investigations are required to understand how power production affects the percentage removal of COD and how hydraulic retention time and external resistance can be optimised. The above initial findings confirm that electricity generation by MFC depends on the characteristics of the wastewater along with its microbial community. Thus, the overall performance can be improved by optimising the design aspects of the MFC, i.e., the surface area to volume ratio and the external resistance with respect to wastewater quality.

Author Contributions

Conceptualisation, S.D. and R.K.C.; methodology, S.D.; formal analysis, S.D.; investigation, S.D.; writing—original draft preparation, S.D.; writing—review and editing, S.D. and R.K.C.; funding acquisition for work or publication, R.K.C. and S.D. All authors have read and agreed to the published version of the manuscript.

Funding

The article processing charges for this article have been jointly funded by SPRING Eu-India (Agreement No. 821423) and the publication fund of UiT The Arctic University of Norway.

Institutional Review Board Statement

Not applicable.

Informed Consent Statement

Not applicable.

Data Availability Statement

Not applicable.

Conflicts of Interest

The authors declare no conflict of interest.

References

  1. Trapero, J.R.; Horcajada, L.; Linares, J.J.; Lobato, J. Is Microbial Fuel Cell Technology Ready? An Economic Answer towards Industrial Commercialization. Appl. Energy 2017, 185, 698–707. [Google Scholar] [CrossRef]
  2. Dutta, A. Impact of Silver Price Uncertainty on Solar Energy Firms. J. Clean. Prod. 2019, 225, 1044–1051. [Google Scholar] [CrossRef]
  3. Najafpour, G.D.; Rahimnejad, M.; Mokhtarian, N.; Ramli, W.; Daud, W.; Ghoreyshi, A.A. Low Voltage Power Generation in a Biofuel Cell Using Anaerobic Cultures. World Appl. Sci. J. 2009, 6, 1585–1588. [Google Scholar]
  4. Aiyer, K.S. How Does Electron Transfer Occur in Microbial Fuel Cells? World J. Microbiol. Biotechnol. 2020, 36, 19. [Google Scholar] [CrossRef]
  5. Liu, H.; Logan, B.E. Electricity Generation Using an Air-Cathode Single Chamber Microbial Fuel Cell in the Presence and Absence of a Proton Exchange Membrane. Environ. Sci. Technol. 2004, 38, 4040–4046. [Google Scholar] [CrossRef] [PubMed]
  6. Wang, H.; Ren, Z.J. A Comprehensive Review of Microbial Electrochemical Systems as a Platform Technology. Biotechnol. Adv. 2013, 31, 1796–1807. [Google Scholar] [CrossRef] [PubMed]
  7. Liu, H.; Cheng, S.; Logan, B.E. Production of Electricity from Acetate or Butyrate Using a Single-Chamber Microbial Fuel Cell. Environ. Sci. Technol. 2005, 39, 658–662. [Google Scholar] [CrossRef]
  8. Torres, C.I.; Kato Marcus, A.; Rittmann, B.E. Kinetics of Consumption of Fermentation Products by Anode-Respiring Bacteria. Appl. Microbiol. Biotechnol. 2007, 77, 689–697. [Google Scholar] [CrossRef]
  9. Feng, Y.; Wang, X.; Logan, B.E.; Lee, H. Brewery Wastewater Treatment Using Air-Cathode Microbial Fuel Cells. Appl. Microbiol. Biotechnol. 2008, 78, 873–880. [Google Scholar] [CrossRef]
  10. Min, B.; Logan, B.E. Continuous Electricity Generation from Domestic Wastewater and Organic Substrates in a Flat Plate Microbial Fuel Cell. Environ. Sci. Technol. 2004, 38, 5809–5814. [Google Scholar] [CrossRef]
  11. Fan, Y.; Han, S.K.; Liu, H. Improved Performance of CEA Microbial Fuel Cells with Increased Reactor Size. Energy Environ. Sci. 2012, 5, 8273–8280. [Google Scholar] [CrossRef]
  12. Liu, H.; Cheng, S.; Huang, L.; Logan, B.E. Scale-up of Membrane-Free Single-Chamber Microbial Fuel Cells. J. Power Sources 2008, 179, 274–279. [Google Scholar] [CrossRef]
  13. Moon, H.; In, S.C.; Jae, K.J.; Kim, B.H. Residence Time Distribution in Microbial Fuel Cell and Its Influence on COD Removal with Electricity Generation. Biochem. Eng. J. 2005, 27, 59–65. [Google Scholar] [CrossRef]
  14. Chang, T.J.; Chang, Y.H.; Chao, W.L.; Jane, W.N.; Chang, Y.T. Effect of Hydraulic Retention Time on Electricity Generation Using a Solid Plain-Graphite Plate Microbial Fuel Cell Anoxic/Oxic Process for Treating Pharmaceutical Sewage. J. Environ. Sci. Heal.-Part A Toxic/Hazard. Subst. Environ. Eng. 2018, 53, 1185–1197. [Google Scholar] [CrossRef] [PubMed]
  15. Zhang, X.; He, W.; Ren, L.; Stager, J.; Evans, P.J.; Logan, B.E. COD Removal Characteristics in Air-Cathode Microbial Fuel Cells. Bioresour. Technol. 2015, 176, 23–31. [Google Scholar] [CrossRef]
  16. Ge, Z.; Li, J.; Xiao, L.; Tong, Y.; He, Z. Recovery of Electrical Energy in Microbial Fuel Cells. Environ. Sci. Technol. Lett. 2014, 1, 137–141. [Google Scholar] [CrossRef]
  17. Marassi, R.J.; Queiroz, L.G.; Silva, D.C.V.R.; da Silva, F.T.; Silva, G.C.; de Paiva, T.C.B. Performance and Toxicity Assessment of an Up-Flow Tubular Microbial Fuel Cell during Long-Term Operation with High-Strength Dairy Wastewater. J. Clean. Prod. 2020, 259, 120882. [Google Scholar] [CrossRef]
  18. Gude, V.G. Wastewater Treatment in Microbial Fuel Cells—An Overview. J. Clean. Prod. 2016, 122, 287–307. [Google Scholar] [CrossRef]
  19. Munoz-Cupa, C.; Hu, Y.; Xu, C.; Bassi, A. An Overview of Microbial Fuel Cell Usage in Wastewater Treatment, Resource Recovery and Energy Production. Sci. Total Environ. 2021, 754, 142429. [Google Scholar] [CrossRef]
  20. Yu, J.; Park, Y.; Kim, B.; Lee, T. Power Densities and Microbial Communities of Brewery Wastewater-Fed Microbial Fuel Cells According to the Initial Substrates. Bioprocess Biosyst. Eng. 2015, 38, 85–92. [Google Scholar] [CrossRef]
  21. Lu, M.; Chen, S.; Babanova, S.; Phadke, S.; Salvacion, M.; Mirhosseini, A.; Chan, S.; Carpenter, K.; Cortese, R.; Bretschger, O. Long-Term Performance of a 20-L Continuous Flow Microbial Fuel Cell for Treatment of Brewery Wastewater. J. Power Sources 2017, 356, 274–287. [Google Scholar] [CrossRef]
  22. Penteado, E.D.; Fernandez-Marchante, C.M.; Zaiat, M.; Cañizares, P.; Gonzalez, E.R.; Rodrigo, M.A. Influence of Sludge Age on the Performance of MFC Treating Winery Wastewater. Chemosphere 2016, 151, 163–170. [Google Scholar] [CrossRef] [PubMed]
  23. Ma, D.; Jiang, Z.H.; Lay, C.H.; Zhou, D. Electricity Generation from Swine Wastewater in Microbial Fuel Cell: Hydraulic Reaction Time Effect. Int. J. Hydrogen Energy 2016, 41, 21820–21826. [Google Scholar] [CrossRef]
  24. Ma, J.; Ni, H.; Su, D.; Meng, X. Bioelectricity Generation from Pig Farm Wastewater in Microbial Fuel Cell Using Carbon Brush as Electrode. Int. J. Hydrogen Energy 2016, 41, 16191–16195. [Google Scholar] [CrossRef]
  25. Ren, L.; Zhang, X.; He, W.; Logan, B.E. High Current Densities Enable Exoelectrogens to Outcompete Aerobic Heterotrophs for Substrate. Biotechnol. Bioeng. 2014, 111, 2163–2169. [Google Scholar] [CrossRef]
  26. Vogel, B.F.; Venkateswaran, K.; Satomi, M.; Gram, L. Identification of Shewanella Baltica as the Most Important H 2S-Producing Species during Iced Storage of Danish Marine Fish. Appl. Environ. Microbiol. 2005, 71, 6689–6697. [Google Scholar] [CrossRef] [Green Version]
  27. Das, S.; Banerjee, A.; Chowdhury, R.; Bhattacharya, P.; Calay, R.K. Parametric Sensitivity of PH and Steady State Multiplicity in a Continuous Stirred Tank Bioreactor (CSTBR) Using a Lactic Acid Bacterium (LAB), Pediococcus Acidilactici. J. Chem. Technol. Biotechnol. 2016, 91, 1431–1442. [Google Scholar] [CrossRef]
  28. Yamamoto, K.; Toya, S.; Sabidi, S.; Hoshiko, Y.; Maeda, T. Diluted Luria-Bertani Medium vs. Sewage Sludge as Growth Media: Comparison of Community Structure and Diversity in the Culturable Bacteria. Appl. Microbiol. Biotechnol. 2021, 105, 3787–3798. [Google Scholar] [CrossRef] [PubMed]
  29. Slavov, A.K. General Characteristics and Treatment Possibilities of Dairy Wastewater—A Review. Food Technol. Biotechnol. 2017, 55, 14. [Google Scholar] [CrossRef] [PubMed]
  30. Kloch, M.; Toczylowska-Maminska, R. Toward Optimization of Wood Industry Wastewater Treatment in Microbial Fuel Cells-Mixed Wastewaters Approach. Energies 2020, 13, 263. [Google Scholar] [CrossRef] [Green Version]
Figure 1. Microbial fuel cell assembly.
Energies 15 04152 g001
Figure 2. Experimental setup.
Energies 15 04152 g002
Figure 3. Schematic representation of the MFC experiment.
Energies 15 04152 g003
Figure 4. Microbial growth of Shewanella baltica 20; variation in the specific growth rate, µ (h−1), for each initial lactate concentration, S (mM).
Energies 15 04152 g004
Figure 5. Polarisation curve of the MFC operated at different lactate concentrations. Cell voltage (a) and power density (b) as a function of current density.
Energies 15 04152 g005
Figure 6. Polarisation curve of the MFC operated at COD concentrations. Cell voltage (a) and power density (b) as a function of current density.
Energies 15 04152 g006
Figure 7. Removal of organic matter in terms of COD by the MFC as a function of wastewater strength.
Energies 15 04152 g007
Figure 8. The influence of different external resistance values on power density at different lactate concentrations (a) and COD values (b).
Energies 15 04152 g008
Publisher’s Note: MDPI stays neutral with regard to jurisdictional claims in published maps and institutional affiliations.

