
Investigations of the Thermal Parameters of Hybrid Sol–Gel Coatings Using Nondestructive Photothermal Techniques


 ,
,  and
and
Abstract
:1. Introduction
2. Experimental
2.1. Materials
2.2. Synthesis
2.3. Samples
3. Methods
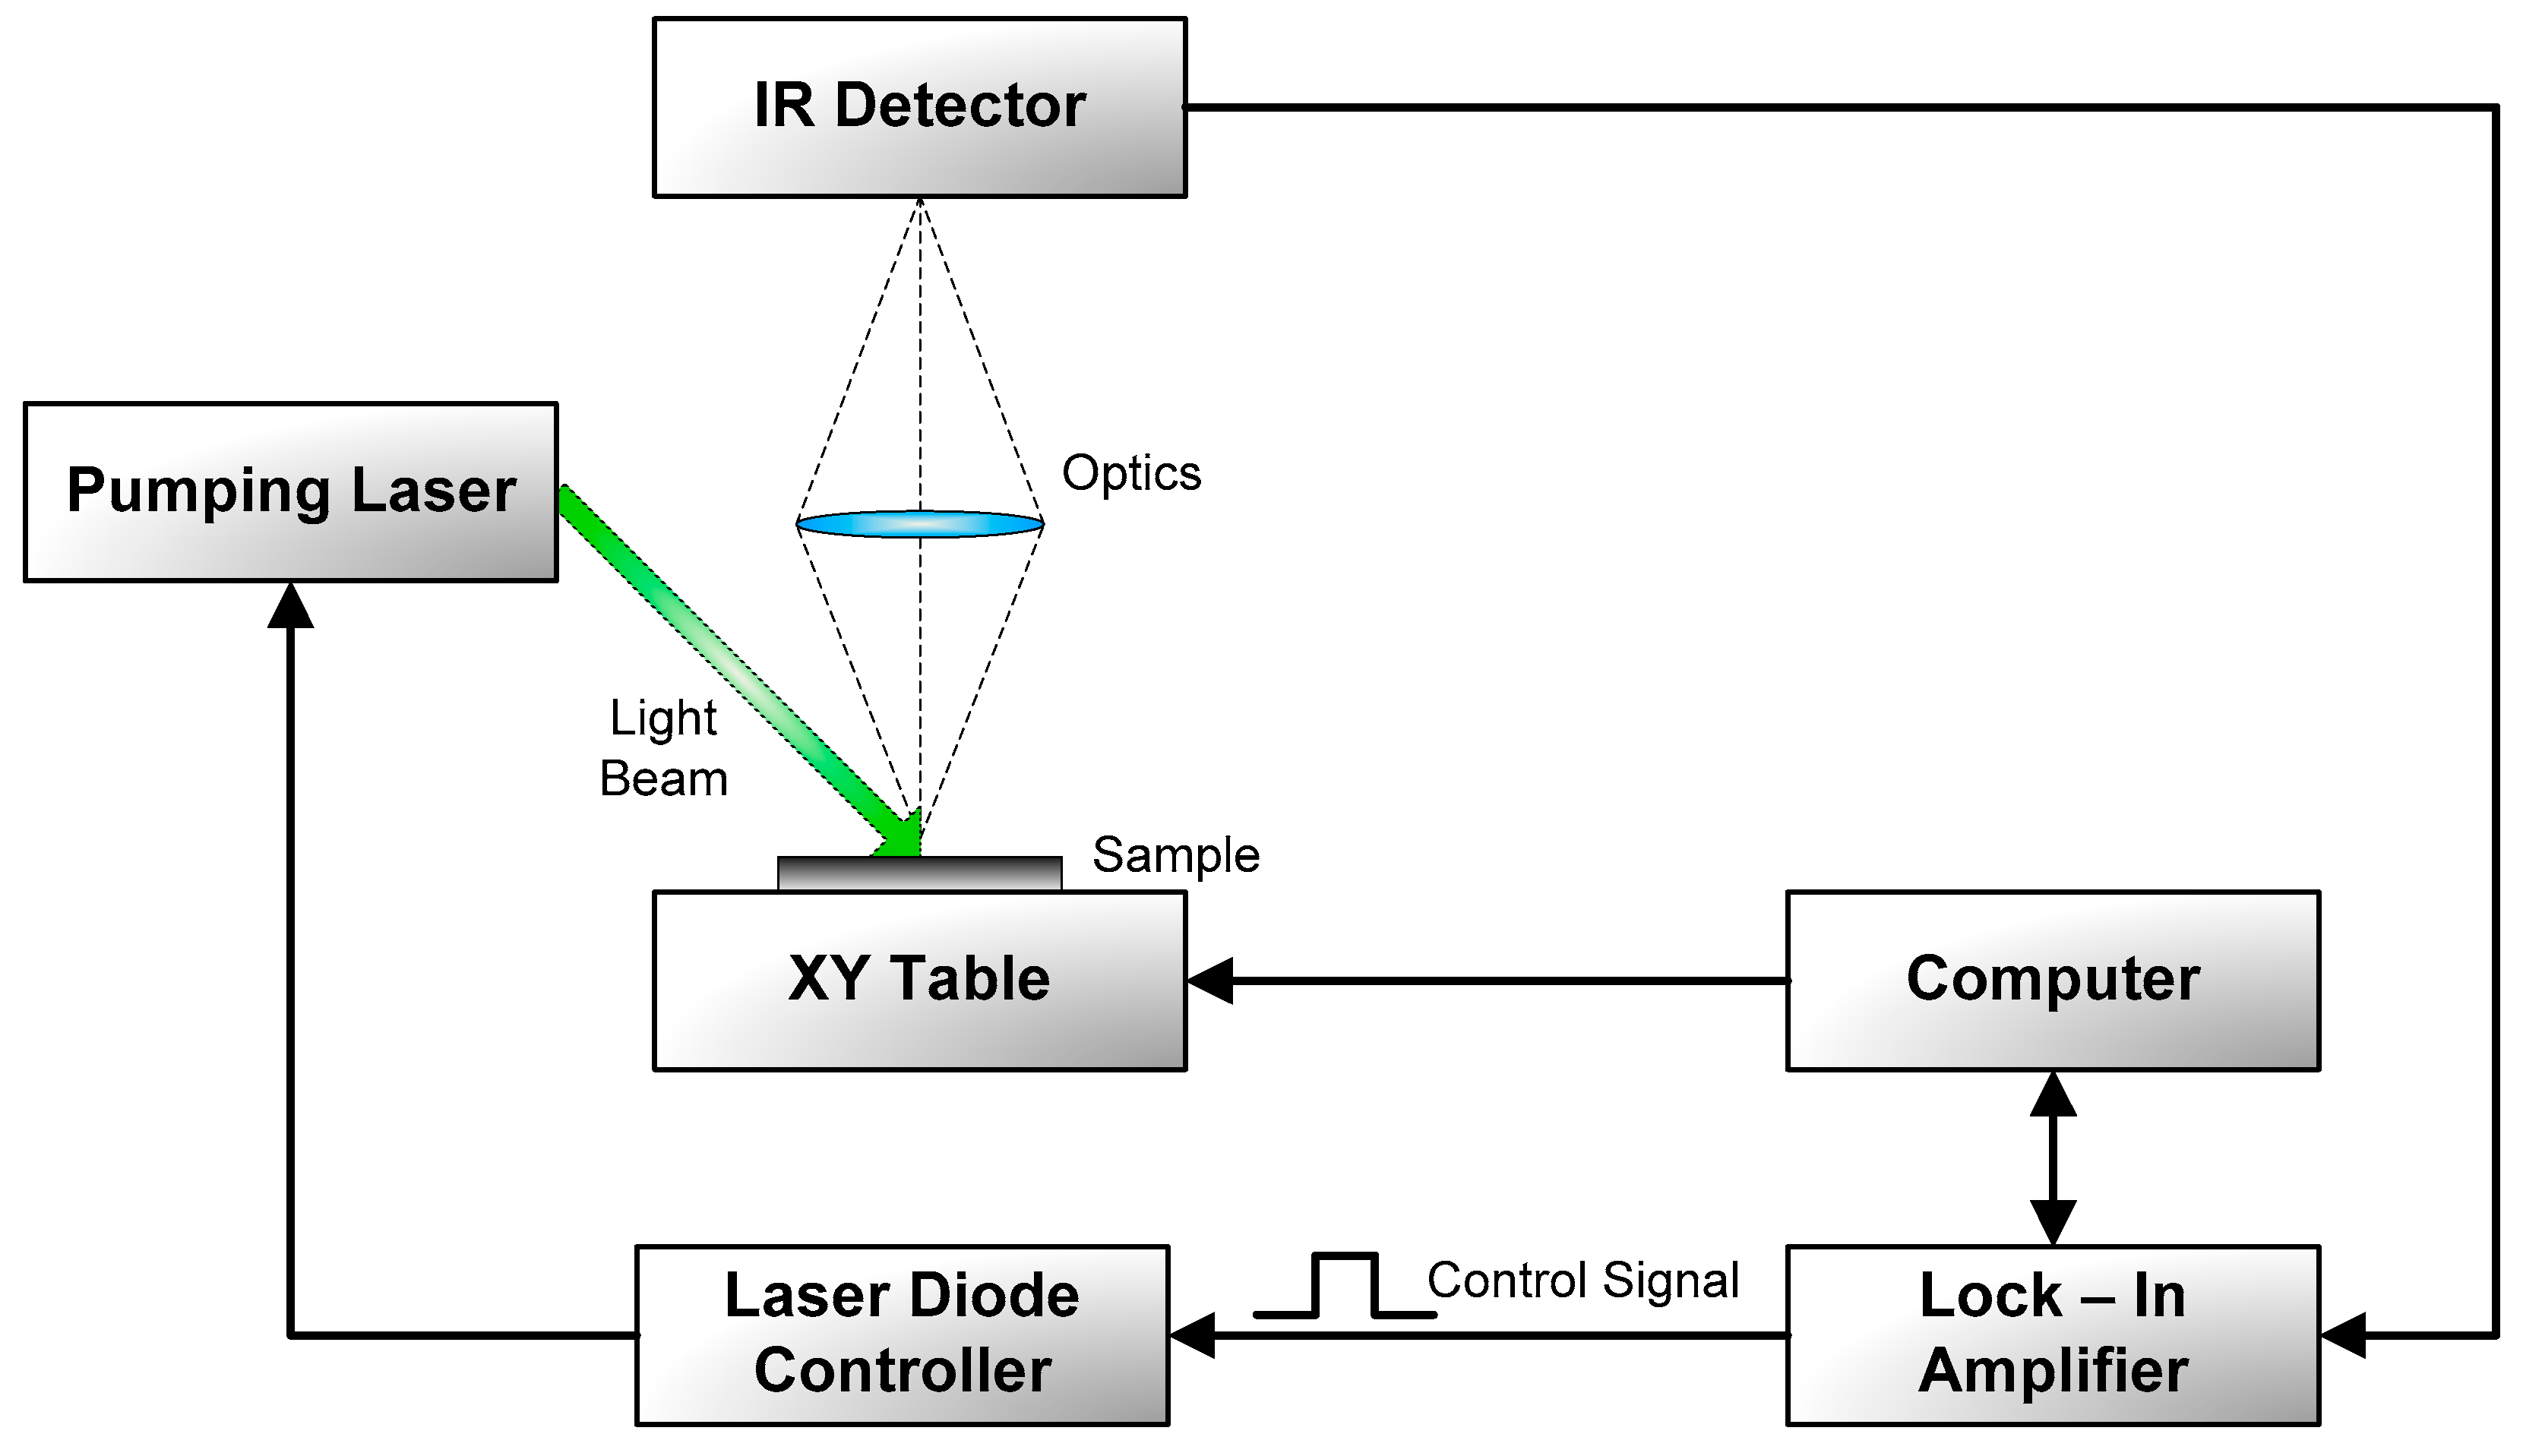
3.1. Photothermal Radiometry
3.2. Beam Deflection Spectroscopy
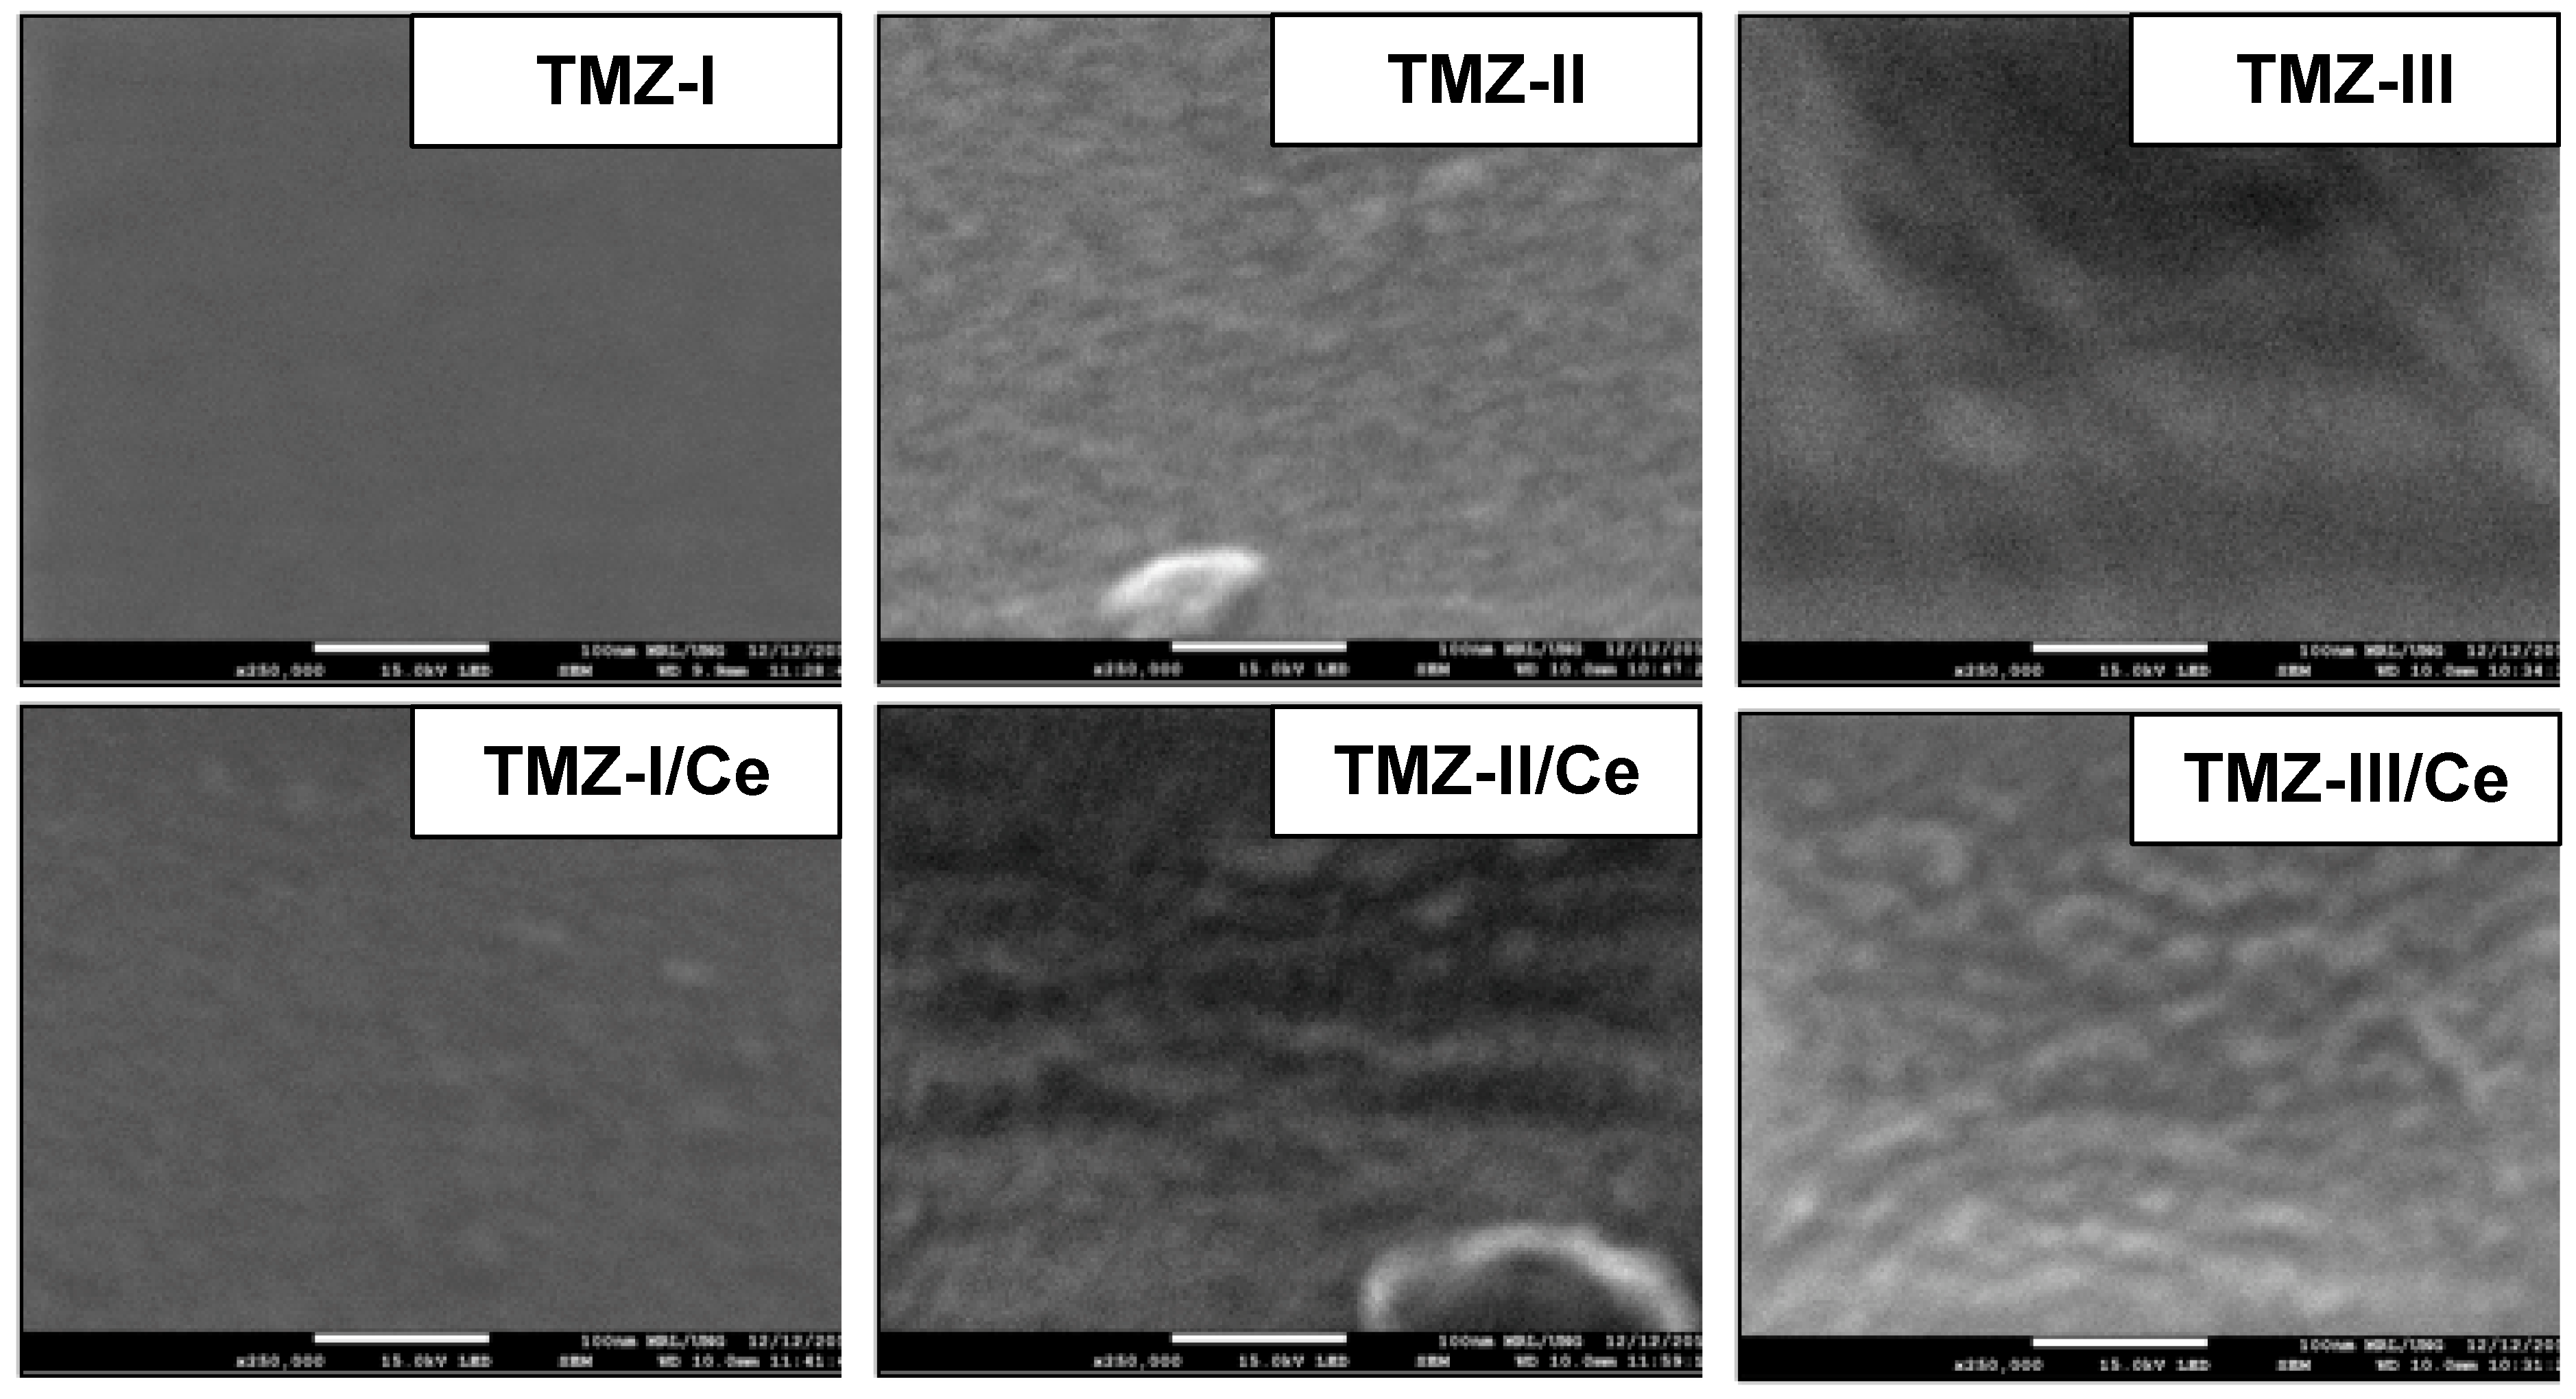
3.3. Scanning Electron Microscope
4. Theoretical Background
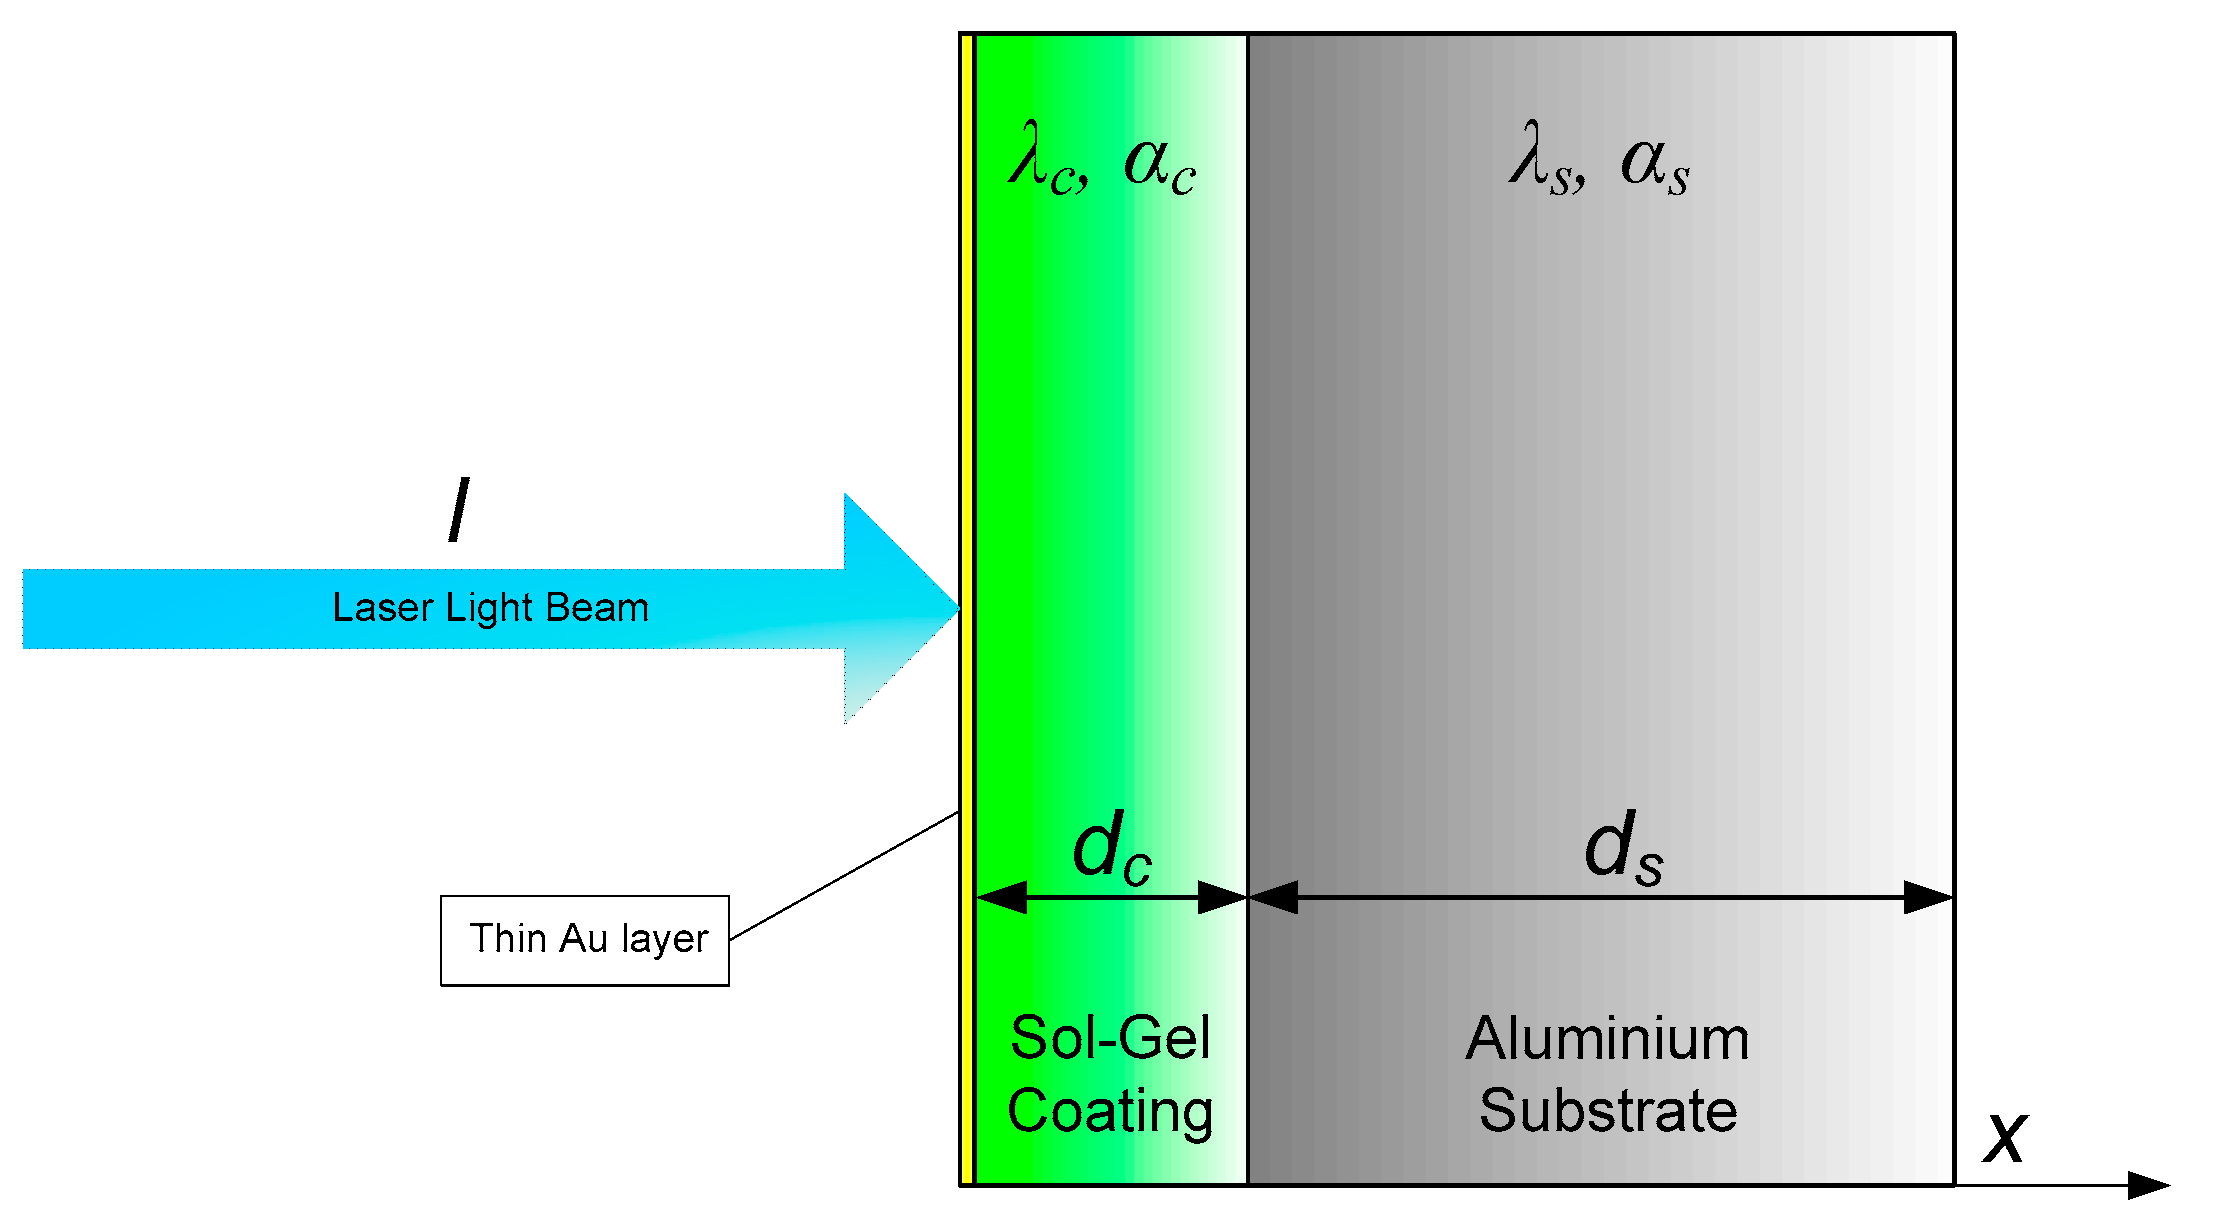
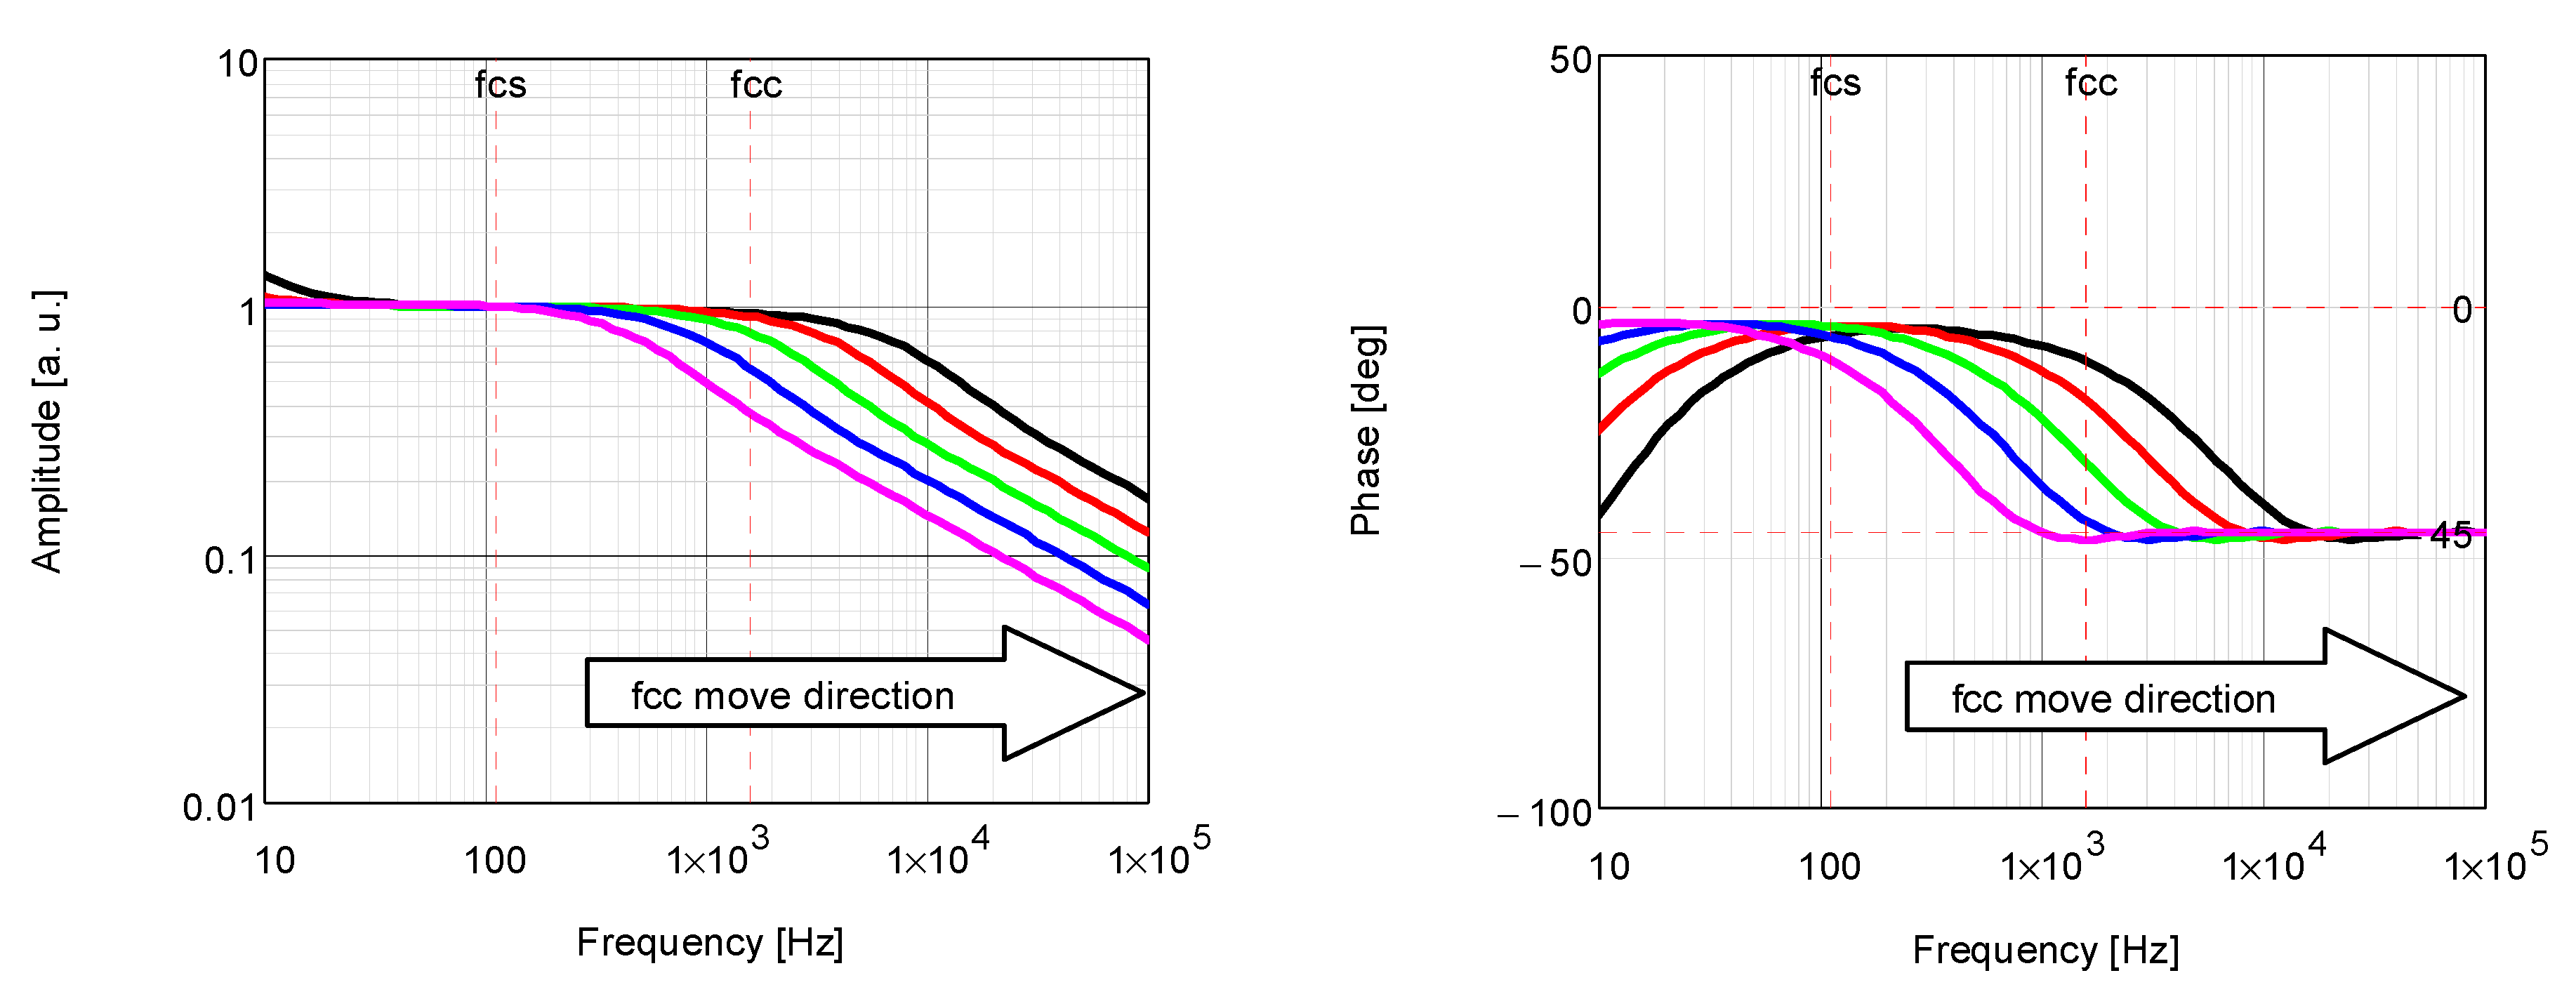
4.1. PTR Method
4.2. BDS Method
5. Results
5.1. SEM Analysis
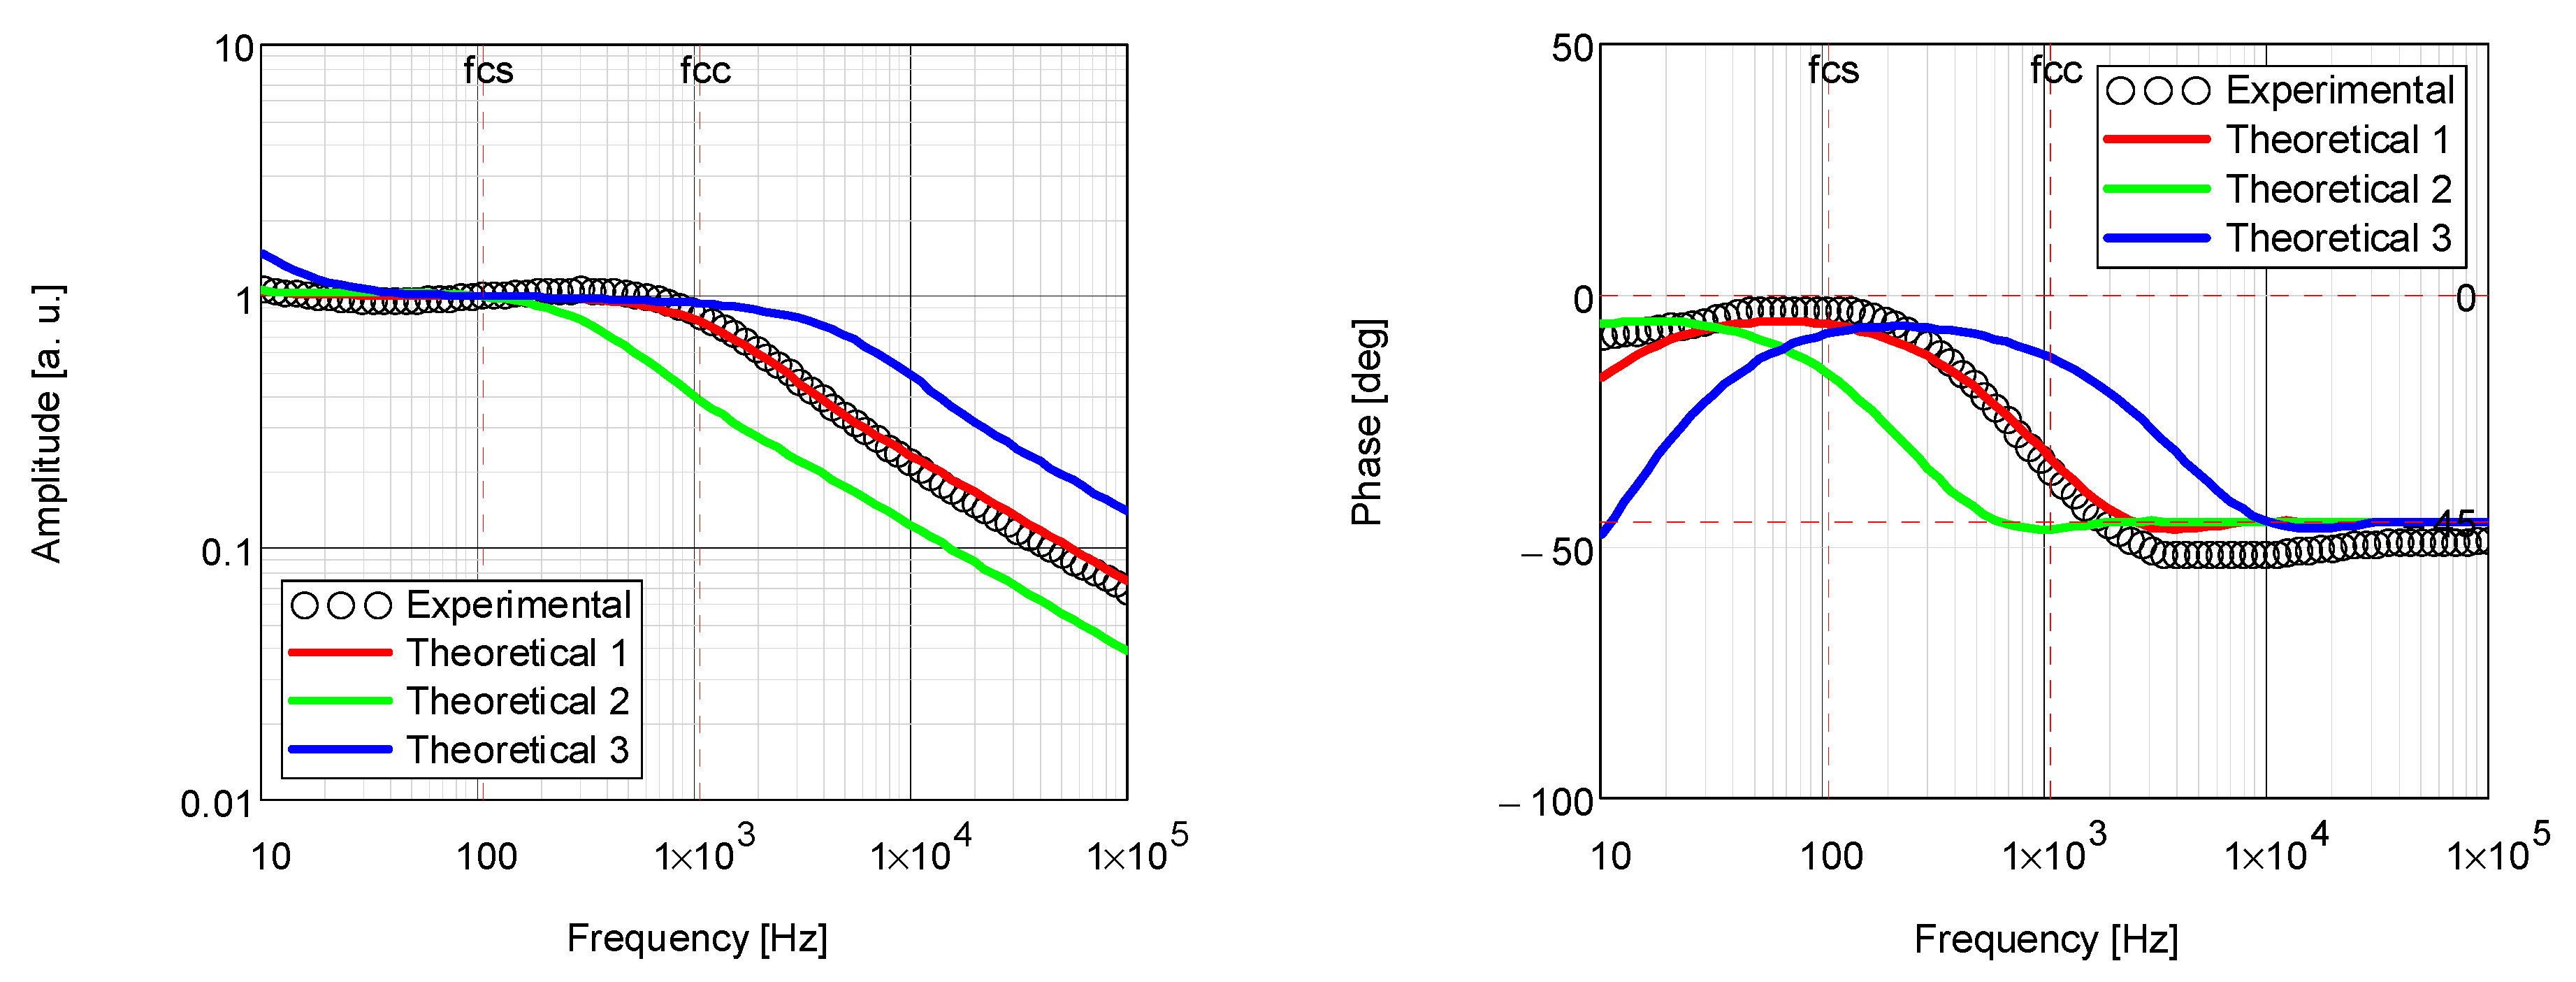
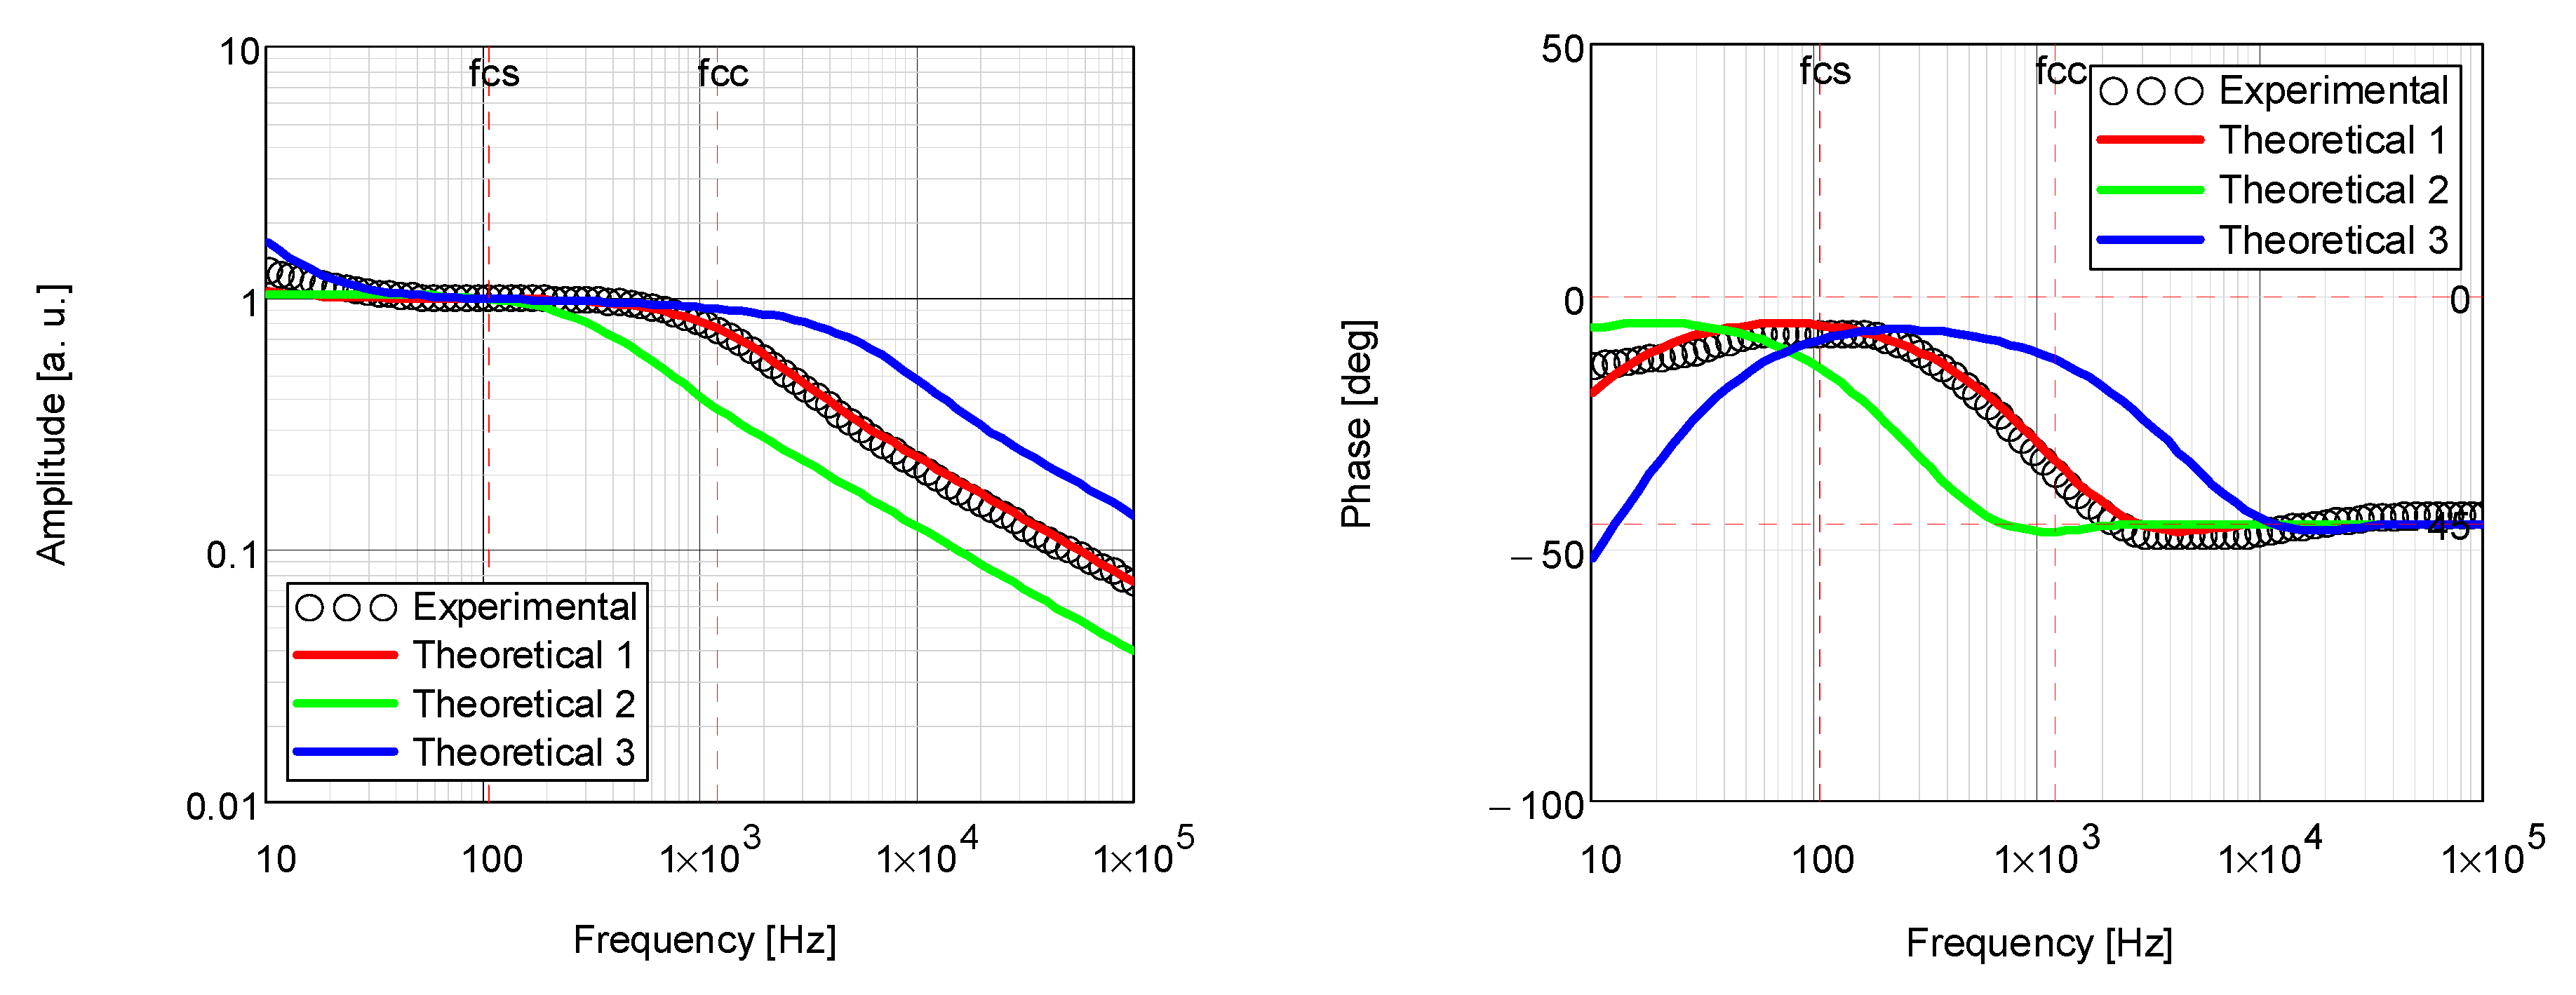
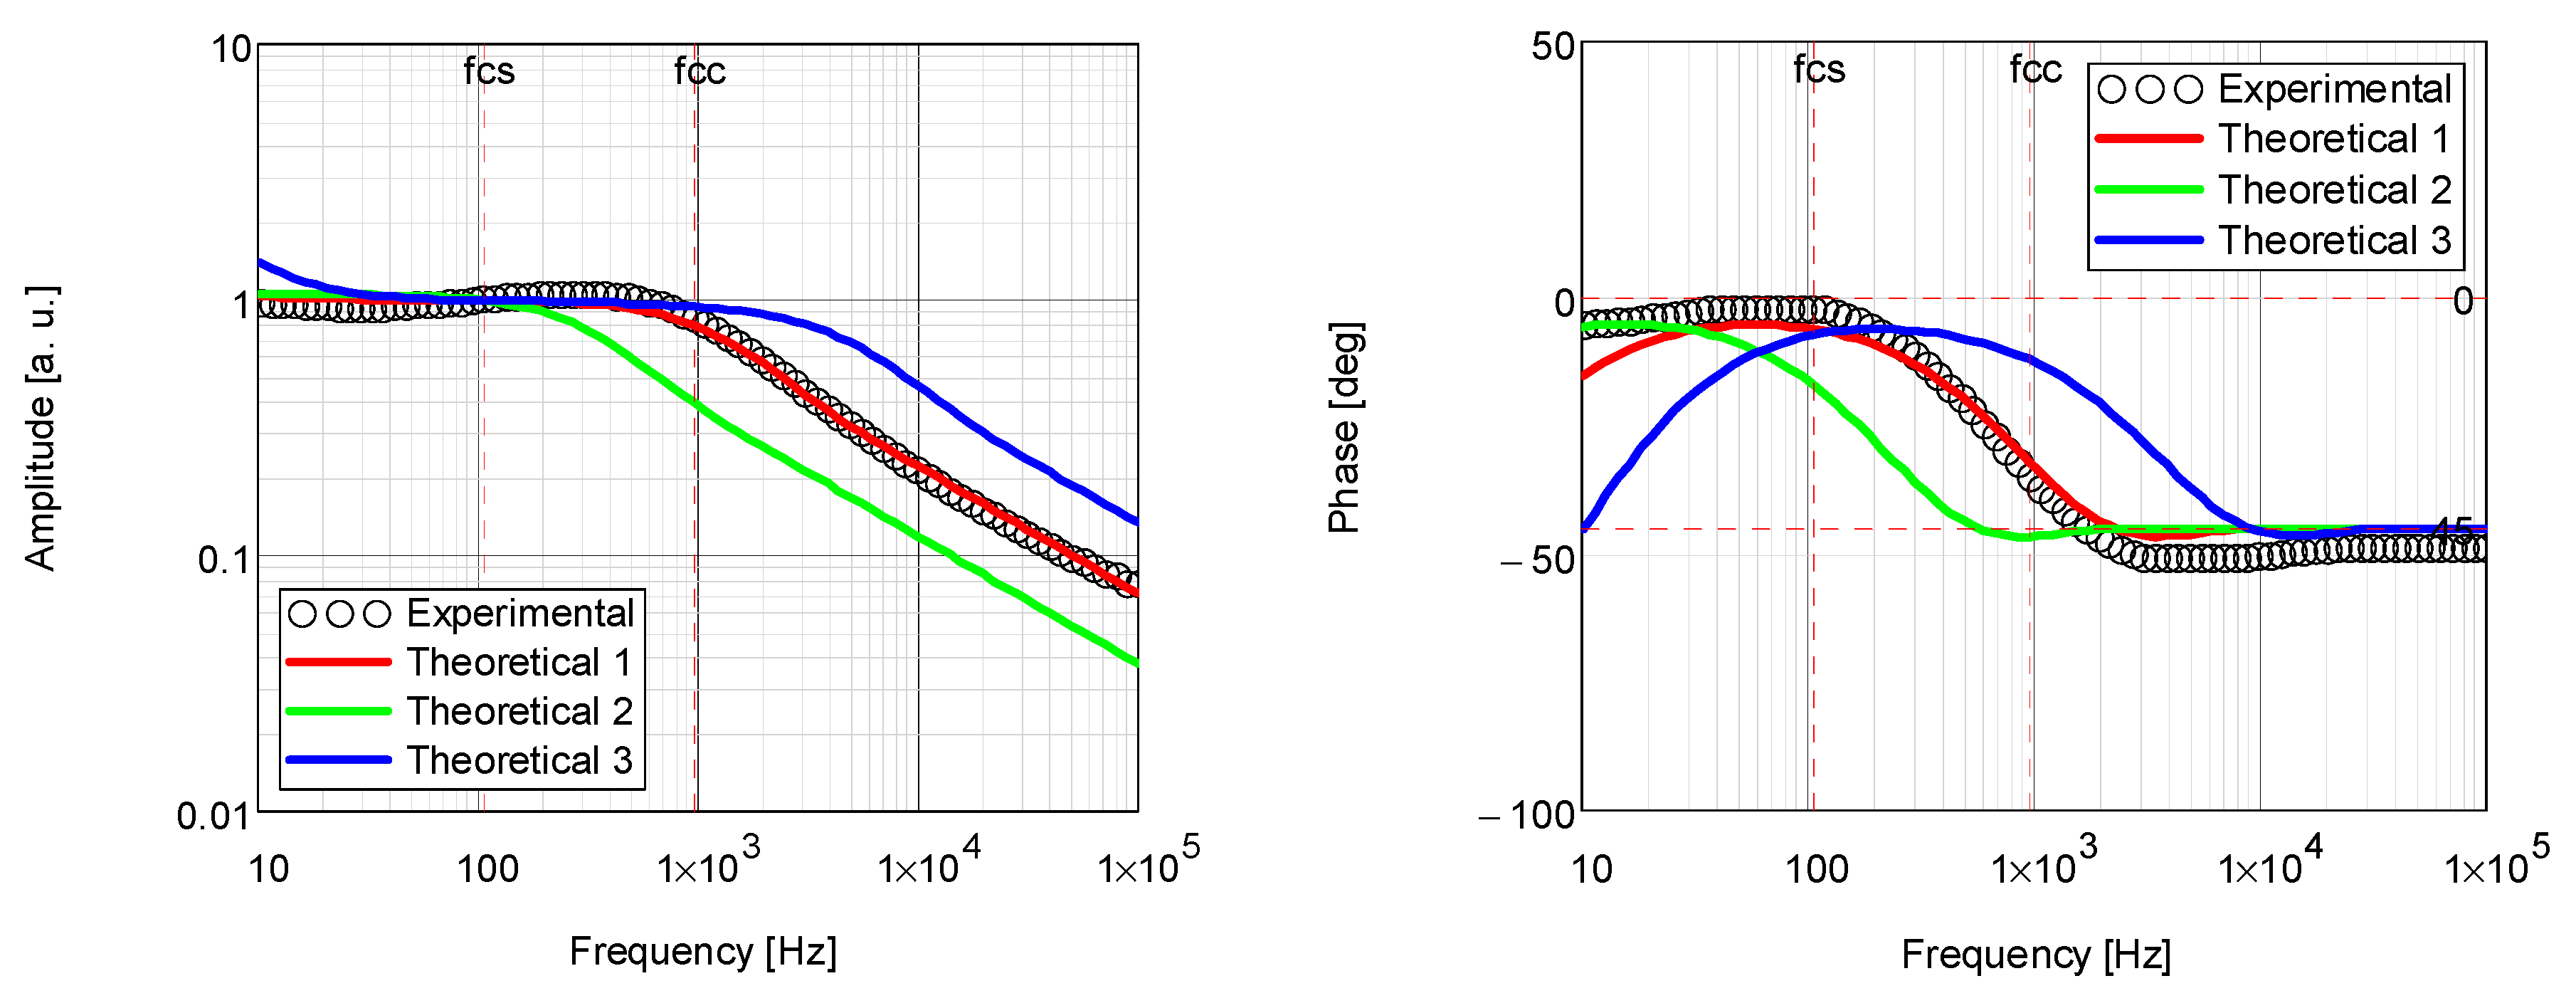
5.2. PTR Analysis
5.3. BDS Analysis
5.4. Correlation between Thermal Properties and Structural Properties
6. Conclusions
Author Contributions
Funding
Conflicts of Interest
References
- Rodič, P.; Iskra, J.; Milošev, I. Study of a sol-gel process in the preparation of hybrid coatings for corrosion protection using FTIR and 1H NMR methods. J. Non-Cryst. Solids 2014, 396–397, 25–35. [Google Scholar] [CrossRef]
- Associates, D.; Davis, J.R. Alloying: Understanding the basics. Choice Rev. Online 2013. [Google Scholar] [CrossRef]
- Rodič, P.; Milošev, I. Corrosion properties of UV cured hybrid sol-gel coatings on AA7075-T6 determined under simulated aircraft conditions. J. Electrochem. Soc. 2014, 161, C412–C420. [Google Scholar] [CrossRef]
- Rodič, P.; Milošev, I. Electrochemical and salt spray testing of hybrid coatings based on Si and Zr deposited on aluminum and its alloys. J. Electrochem. Soc. 2015, 162, C592–C600. [Google Scholar] [CrossRef]
- Rodič, P.; Mertelj, A.; Borovšak, M.; Benčan, A.; Mihailović, D.; Malič, B.; Milošev, I. Composition, structure and morphology of hybrid acrylate-based sol–gel coatings containing Si and Zr composed for protective applications. Surf. Coat. Technol. 2016, 286, 388–396. [Google Scholar] [CrossRef]
- Rodič, P.; Milošev, I. Corrosion inhibition of pure Aluminium and alloys AA2024-T3 and AA7075-T6 by Cerium(III) and Cerium(IV) salts. J. Electrochem. Soc. 2016, 163, C85–C93. [Google Scholar] [CrossRef]
- Figueira, R.B.; Silva, C.J.R.; Pereira, E.V. Organic–inorganic hybrid sol–gel coatings for metal corrosion protection: A review of recent progress. J. Coat. Technol. Res. 2015, 12, 1–35. [Google Scholar] [CrossRef]
- Rodič, P.; Katić, J.; Korte, D.; Desimone, P.M.; Franko, M.; Ceré, S.M.; Metikoš-Huković, M.; Milošev, I. The Effect of Cerium Ions on the Structure, Porosity and Electrochemical Properties of Si/Zr-Based Hybrid Sol-Gel Coatings Deposited on Aluminum. Metals 2018, 8, 248. [Google Scholar] [CrossRef] [Green Version]
- Milošev, I.; Hamulić, D.; Rodič, P.; Carrière, C.; Zanna, S.; Budasheva, H.; Korte, D.; Franko, M.; Mercier, D.; Seyeux, A.; et al. Siloxane polyacrylic sol-gel coatings with alkly and perfluoroalkyl chains: Synthesis, composition, thermal properties and log-term corrosion protection. Appl. Surf. Sci. 2022, 574, 151578. [Google Scholar] [CrossRef]
- Rhee, S.K. Porosity-thermal conductivity correlations for ceramic materials. Mater. Sci. Eng. 1975, 20, 89–93. [Google Scholar] [CrossRef]
- Moron-Fernandez, C.; Verdu-Vazquez, A.; Gil-Lopez, T.; Moron-Barrios, A. Microscope stand for the measurement and characterization of amorphous ferromagnetic materials. IEEE Trans. Instrum. Meas. 2021, 70, 9440877. [Google Scholar] [CrossRef]
- Zhang, J.-Q.; Qi, H.; Liu, S.-B.; Niu, Z.-T.; Yu, X.-Y.; Ren, Y.-T. Research on modulated thermal wave radar imaging technique for photothermal properties of semi-transparent materials. Int. J. Thermophys. 2020, 41, 63. [Google Scholar] [CrossRef]
- Li, G.; Li, C.; Xing, Z.; Wang, H.; Huang, Y.; Guo, W.; Liu, H. Study of the catalytic strengthening of a vacuum carburized layer on alloy steel by rare earth pre-implantation. Materials 2019, 12, 3420. [Google Scholar] [CrossRef] [PubMed] [Green Version]
- Nordal, P.-E.; Kanstad, S.O. Photothermal radiometry. Phys. Scr. 1979, 20, 659–662. [Google Scholar] [CrossRef]
- Salnic, A.; Mandelis, A.; Jean, C. Noncontact measurement of transport properties of long–carrier–lifetime wafers using photothermal radiometry. Appl. Phys. Lett. 1996, 69, 2522–2524. [Google Scholar] [CrossRef]
- Salnik, A.; Mandelis, A.; Ruda, H.; Jean, C. Relative sensitivity of photomodulated reflectance and photothermal infrared radiometry to thermal and carrier plasma waves in semiconductors. Appl. Phys. Lett. 1997, 82, 1853–1859. [Google Scholar] [CrossRef]
- Mandelis, A. Laser infrared photothermal radiometry of semiconductors: Principles and applications to solid state electronics. Solid-State Electron. 1998, 42, 1–15. [Google Scholar] [CrossRef]
- Pham Tu Quoc, S.; Cheymol, G.; Semerok, A. New contactless method for thermal diffusivity measurements using modulated photothermal radiometry. Rev. Sci. Instrum. 2014, 85, 054903. [Google Scholar] [CrossRef]
- Pelzl, J.; Kijamnajsuk, P.; Chirtoc, M.; Horny, N.; Eisenmenger-Sittner, C. Correlation between thermal interface conductance and mechanical adhesion strength in Cu-coated glassy Carbon. Int. J. Thermophys. 2015, 36, 2475–2485. [Google Scholar] [CrossRef]
- Kijamnajsuk, P.; Pelzl, J.; Chirtoc, M.; Horny, N.; Schäfer, D.; Eisenmenger-Sittner, C. Photothermal evidence of laterally inhomogeneous interfacial thermal resistance in Copper-coated carbon samples. Int. J. Thermophys. 2012, 33, 2132–2138. [Google Scholar] [CrossRef]
- Pawlak, M.; Kruck, T.; Spitzer, N.; Dziczek, D.; Ludwig, A.; Wieck, A. Experimental validation of formula for calculation thermal diffusivity in superlattices performed using a combination of two frequency-domain methods: Photothermal infrared radiometry and thermoreflectance. Appl. Sci. 2021, 11, 6125. [Google Scholar] [CrossRef]
- Chrobak, Ł.; Maliński, M. Investigations of the possibility of determination of thermal parameters of Si and SiGe samples based on the Photo Thermal Radiometry technique. Infrared Phys. Technol. 2018, 89, 46–51. [Google Scholar] [CrossRef]
- Pawlak, M.; Maliński, M. Simultaneous measurement of thermal diffusivity and effective infrared absorption coefficient in IR semitransparent and semiconducting n-CdMgSe crystals using photothermal radiometry. Thermochim. Acta 2015, 599, 23–26. [Google Scholar] [CrossRef]
- Pawlak, M. Photothermal, photocarrier, and photoluminescence phenomena in semiconductors studied using spectrally resolved modulated infrared radiometry: Physics and applications. J. Appl. Phys. 2019, 126, 150902. [Google Scholar] [CrossRef] [Green Version]
- Chrobak, Ł.; Maliński, M. Comparison of three non-destructive and contactless techniques for investigations of recombination parameters on an example of silicon samples. Infrared Phys. Technol. 2018, 91, 1–7. [Google Scholar] [CrossRef]
- Chrobak, Ł.; Maliński, M. On Investigations of the optical absorption coefficient of Gold and germanium implanted silicon with the use of the non-destructive contactless photo thermal infrared radiometry. J. Electron. Mater. 2019, 48, 5273–5278. [Google Scholar] [CrossRef] [Green Version]
- Dorywalski, K.; Chrobak, Ł.; Maliński, M. Comparative studies of the optical absorption coefficient spectra in the implanted layers in silicon with the use of non-destructive spectroscopic techniques. Metrol. Meas. Syst. 2020, 27, 323–337. [Google Scholar]
- Kesmia, A.; Satour, F.Z.; Zegadi, A. Spectral absorption coefficient extraction of an unknown layer from photoacoustic measurements of multilayered semiconductors. Infrared Phys. Technol. 2020, 108, 103348. [Google Scholar] [CrossRef]
- Volkov, D.S.; Rogova, O.B.; Proskurnin, M.A. Photoacoustic and photothermal methods in spectroscopy and characterization of soils and soil organic matter. Photoacoustics 2020, 17, 100151. [Google Scholar] [CrossRef]
- Dubyk, K.; Pastushenko, A.; Nychyporuk, T.; Burbelo, R.; Isaiev, M.; Lysenko, V. Thermal conductivity of silicon nanomaterials measured using the photoacoustic technique in a piezoelectric configuration. J. Phys. Chem. Solids 2019, 126, 267–273. [Google Scholar] [CrossRef]
- Riech, I.; Zambrano, M.; Abelenda, A.; Maldonado, F.; Rojas-Marroquín, A.; Jaime, J.; Calderón, A.; Marín, E. Evaluation of thin films intermixing by photoacoustic spectroscopy. Thin Solid Film. 2021, 735, 138871. [Google Scholar] [CrossRef]
- Maliński, M.; Chrobak, Ł.; Patryn, A. Theoretical and experimental studies of a plasma wave contribution. Acta Acust. United Acust. 2009, 95, 60–64. [Google Scholar] [CrossRef]
- Chrobak, Ł.; Maliński, M.; Patryn, A. Influence of plasma waves on the photoacoustic signal of silicon samples. Int. J. Thermophys. 2011, 32, 1986–1997. [Google Scholar] [CrossRef] [Green Version]
- Strzałkowski, K. Effect of lattice disorder on the thermal conductivity of ZnBeSe, ZnMgSe and ZnBeMgSe crystals. Mater. Chem. Phys. 2015, 163, 453–459. [Google Scholar] [CrossRef]
- Strzałkowski, K. Thermal properties of selected II–VI semiconductors determined by photopyroelectric calorimetry technique. J. Therm. Anal. Calorim. 2021, 145, 227–244. [Google Scholar] [CrossRef]
- Leahu, G.; Petronijevic, E.; Li, R.; Belardini, A.; Cesca, T.; Mattei, G.; Sibilia, C. Diffracted beams from metasurfaces: High chiral detectivity by photothermal deflection technique. Adv. Opt. Mater. 2021, 9, 2100670. [Google Scholar] [CrossRef]
- Cabrera, H.; Korte, D.; Budasheva, H.; Asbaghi, B.A.N.; Bellucci, S. Through-plane and in-plane thermal diffusivity determination of graphene nanoplatelets by photothermal beam deflection spectrometry. Materials 2021, 14, 7273. [Google Scholar] [CrossRef]
- Hadi, M.; Younes, J.; Soueidan, M.; Kazan, M. IR photothermal and spectroscopic analysis of proton-irradiated 4H-SiC. Infrared Phys. Technol. 2021, 118, 103891. [Google Scholar] [CrossRef]
- Kusiak, A.; Martan, J.; Battaglia, J.L.; Daniel, R. Using pulsed and modulated photothermal radiometry to measure the thermal conductivity of thin films. Thermochim. Acta 2013, 556, 1–5. [Google Scholar] [CrossRef]
- Battaglia, J.-L.; Ruffio, E.; Kusiak, A.; Pradere, C.; Abisset, E.; Chevalier, S.; Sommier, A.; Batsale, J.-C. The periodic pulse photothermal radiometry technique within the front face configuration. Measurement 2020, 158, 107691. [Google Scholar] [CrossRef]
- Almond, D.P.; Patel, P. Photothermal Science and Techniques; Chapman & Hall: London, UK, 1996. [Google Scholar]
- Rosencwaig, A.; Gersho, A. Theory of the photoacoustic effect with solids. J. Appl. Phys. 1976, 47, 65–69. [Google Scholar] [CrossRef]
- Bennett, C.A.; Patty, R.R. Thermal wave interferometry: A potential application of the photoacoustic effect. Appl. Opt. 1982, 21, 49–58. [Google Scholar] [CrossRef] [Green Version]
- Korte, D.; Franko, M. Application of complex geometrical optics to determination of thermal, transport, and optical parameters of thin films by the photothermal beam deflection technique. J. Opt. Soc. Am. A 2014, 32, 61–74. [Google Scholar] [CrossRef]
- Lim, J.T.; Choi, J.-G.; Bak, H.Y.; Park, S.-H.; Kim, U. Photoacoustic investigation of the carrier transport processes and the thermal properties in n-type GaAs. J. Korean Phys. Soc. 1997, 31, 608–612. [Google Scholar]
- Glorieux, C.; Thoen, J. Thermal depth profile reconstruction by neural network recognition of the photothermal frequency spectrum. J. Appl. Phys. 1996, 80, 6510–6515. [Google Scholar] [CrossRef]
- Williams, J.H. Quantifying Measurement; Morgan & Claypool Publishers: San Rafael, CA, USA, 2016; ISBN 978-1-6817-4433-9/978-1-6817-4432-2. [Google Scholar]
- Kirkup, L.; Frenkel, R.B. An Introduction to Uncertainty in Measurement: Using the GUM (Guide to the Expression of Uncertainty in Measurement); Cambridge University Press: Cambridge, UK, 2010; ISBN 978-0-5117-5553-8. [Google Scholar]
- Andreeva, D.V.; Shchukin, D.G. Smart self-repairing protective coatings. Mater. Today 2008, 11, 24–30. [Google Scholar] [CrossRef]
- Druart, M.-E.; Recloux, I.; Thai, T.T.; Ershov, S.; Snyders, R.; Olivier, M.-G. Impact of the addition of cerium salts (Ce(III) and Ce(IV)) on formation and ageing of a silica sol-gel layer. Surf. Coat. Technol. 2016, 304, 40–50. [Google Scholar] [CrossRef]
- Cambon, J.-B.; Esteban, J.; Ansart, F.; Bonino, J.-P.; Turq, V.; Santagneli, S.H.; Santilli, C.V.; Pulcinelli, S.H. Effect of cerium on structure modifications of a hybrid sol–gel coating, its mechanical properties and anti-corrosion behavior. Mater. Res. Bull. 2012, 47, 3170–3176. [Google Scholar] [CrossRef] [Green Version]


| Coating | Thermal Diffusivity × 10−3 (cm2/s) | Thermal Conductivity × 10−3 (W/cm·K) |
|---|---|---|
| TMZ-I | 2.404 ± 0.073 | 2.730 ± 0.168 |
| TMZ-I/Ce | 2.140 ± 0.078 | 2.090 ± 0.250 |
| TMZ-II | 2.342 ± 0.060 | 2.523 ± 0.117 |
| TMZ-II/Ce | 1.960 ± 0.082 | 1.900 ± 0.250 |
| TMZ-III | 2.112 ± 0.057 | 2.100 ± 0.194 |
| TMZ-III/Ce | 1.838 ± 0.070 | 1.710 ± 0.167 |
| Coating | Thermal Diffusivity αc × 10−3 (cm2/s) | Thermal Conductivity λc × 10−3 (W/cm·K) |
|---|---|---|
| TMZ-I | 2.53 ± 0.08 | 2.64 ± 0.09 |
| TMZ-I/Ce | 2.14 ± 0.07 | 2.21 ± 0.07 |
| TMZ-II | 2.44 ± 0.08 | 2.52 ± 0.08 |
| TMZ-II/Ce | 1.96 ± 0.06 | 2.02 ± 0.07 |
| TMZ-III | 2.05 ± 0.06 | 2.15 ± 0.07 |
| TMZ-III/Ce | 1.75 ± 0.05 | 1.87 ± 0.06 |
Publisher’s Note: MDPI stays neutral with regard to jurisdictional claims in published maps and institutional affiliations. |
© 2022 by the authors. Licensee MDPI, Basel, Switzerland. This article is an open access article distributed under the terms and conditions of the Creative Commons Attribution (CC BY) license (https://creativecommons.org/licenses/by/4.0/).
Share and Cite
Chrobak, Ł.; Korte, D.; Budasheva, H.; Maliński, M.; Rodič, P.; Milošev, I.; Janta-Lipińska, S. Investigations of the Thermal Parameters of Hybrid Sol–Gel Coatings Using Nondestructive Photothermal Techniques. Energies 2022, 15, 4122. https://doi.org/10.3390/en15114122
Chrobak Ł, Korte D, Budasheva H, Maliński M, Rodič P, Milošev I, Janta-Lipińska S. Investigations of the Thermal Parameters of Hybrid Sol–Gel Coatings Using Nondestructive Photothermal Techniques. Energies. 2022; 15(11):4122. https://doi.org/10.3390/en15114122
Chicago/Turabian StyleChrobak, Łukasz, Dorota Korte, Hanna Budasheva, Mirosław Maliński, Peter Rodič, Ingrid Milošev, and Sylwia Janta-Lipińska. 2022. "Investigations of the Thermal Parameters of Hybrid Sol–Gel Coatings Using Nondestructive Photothermal Techniques" Energies 15, no. 11: 4122. https://doi.org/10.3390/en15114122
APA StyleChrobak, Ł., Korte, D., Budasheva, H., Maliński, M., Rodič, P., Milošev, I., & Janta-Lipińska, S. (2022). Investigations of the Thermal Parameters of Hybrid Sol–Gel Coatings Using Nondestructive Photothermal Techniques. Energies, 15(11), 4122. https://doi.org/10.3390/en15114122