1. Introduction
There are numerous products on the global market that are designed to modify the properties of concrete mixtures, for example, to change their consistency, increase their strength, to slow and accelerate the binding process, and to tighten their improvement, workability, etc. [
1,
2]. Some of them are toxic, non-biodegradable, or slightly biodegradable substances. They may contain by-products, and their shorter polymer chains could enter the environment, adversely affecting soil and water ecosystems [
3,
4,
5]. The use of most blends that modify the characteristics of concrete requires protective clothing and special care. Hence, despite the fact that the use of admixtures has a long history, a lot of issues have yet to be resolved. In order to improve some properties of cement mixes, natural products that do not have such a negative impact on the environment can be used [
6].
The growing interest in the use of natural organic “green” compounds in the production of plasticizers has been particularly noticeable in the literature of recent decades. The knowledge results in the production of analogues that can act as substitutes for common compounds derived from crude oil processing. Such substances include biopolymers, i.e., completely biodegradable polymers. Their structure and modifying abilities contribute to the formation of the modifiers of mineral binders, which are being increasingly used in the production of concrete with specified characteristics. These frequently described polymers cover lignin and its derivatives [
7,
8], as well as polysaccharides such as cellulose in the form of cellulose ethers (hydroxyethyl-, hydroxyethyl methyl- or hydroxypropyl methylcellulose) [
9,
10], native starch [
11,
12,
13], modified starch such as starch sulfonates [
14,
15], starch succinate half ester [
16], and starch degradation products, i.e., β-cyclodextrin [
17], or starch hydrolysates, such as dextrins [
3,
18,
19,
20,
21].
Polysaccharides function as water regulators, binding retarders, thickening agents, and viscosity enhancers for concrete mixtures [
3,
11,
19]. Starch belongs to the group of polymers of plant origin and is present in roots, tubers, and fruits. It is a white, odourless, semi-crystalline substance of a heterogeneous chemical structure. Starch consists of two polyglucans: amylose and amylopectin. These polymers are interwoven to form the spatial structure of starch. Starch is an attractive material due to its abundance, the low cost of sourcing it, and its biodegradability, biocompatibility, and susceptibility to modification. Native starch, i.e., natural starch, is of great economic importance, and moreover, its processing allows for generating countless derivatives with different chemical, physicochemical, and functional characteristics. Starch modification enables changed to the parameters of gelatinization, reducing the retrogradation tendency, building in hydrophilic or hydrophobic properties, introducing ionic substituents into a molecule, adjusting viscosity, improving film forming, increasing adhesion strength, etc. [
12,
13,
14,
15,
16].
Dextrins are starch derivatives that are obtained by the partial hydrolysis of starch. This occurs when starch slurry is heated with the addition of acid or in the presence of enzymes (amylases). There are white and yellow dextrins. White dextrins are formed during the drying process of acidified starch at approximately 100 °C. They are partially water-soluble. Yellow dextrins almost completely dissolve in water and they are obtainable in the presence of acid. Their colour is derived from a caramelization process, and different types of yellow dextrins vary in physical properties, mainly regarding their viscosity and solubility [
22].
This paper aims to investigate the effect of the addition of modified starches on the selected physicochemical properties of cementitious pastes and mortars, as well as those of concrete. To determine the possibility of using dextrins as plasticizers, extensive experimental research was carried out. Physicochemical parameters such as moisture, viscosity, solution pH, solubility, and DE were tested. XPS spectrum tests were performed for dextrin d3. The surface activity of dextrins was tested and a microscopic analysis of the mortars was performed. In the case of the rheological tests of the mortars, measurements of the spread of dextrin-doped mixtures were performed. In the case of slurries, the focus was on rheometric tests. For the mortars, the influence of the amount of added dextrin on the compressive strength was also assessed. This research is important because the use of fully biodegradable natural plasticizers contributes to sustainability and ecosystem protection by eliminating the toxic substances contained in some plasticizers or superplasticizers, which can migrate into aquatic and soil ecosystems.
2. Experimental Methods
2.1. Materials
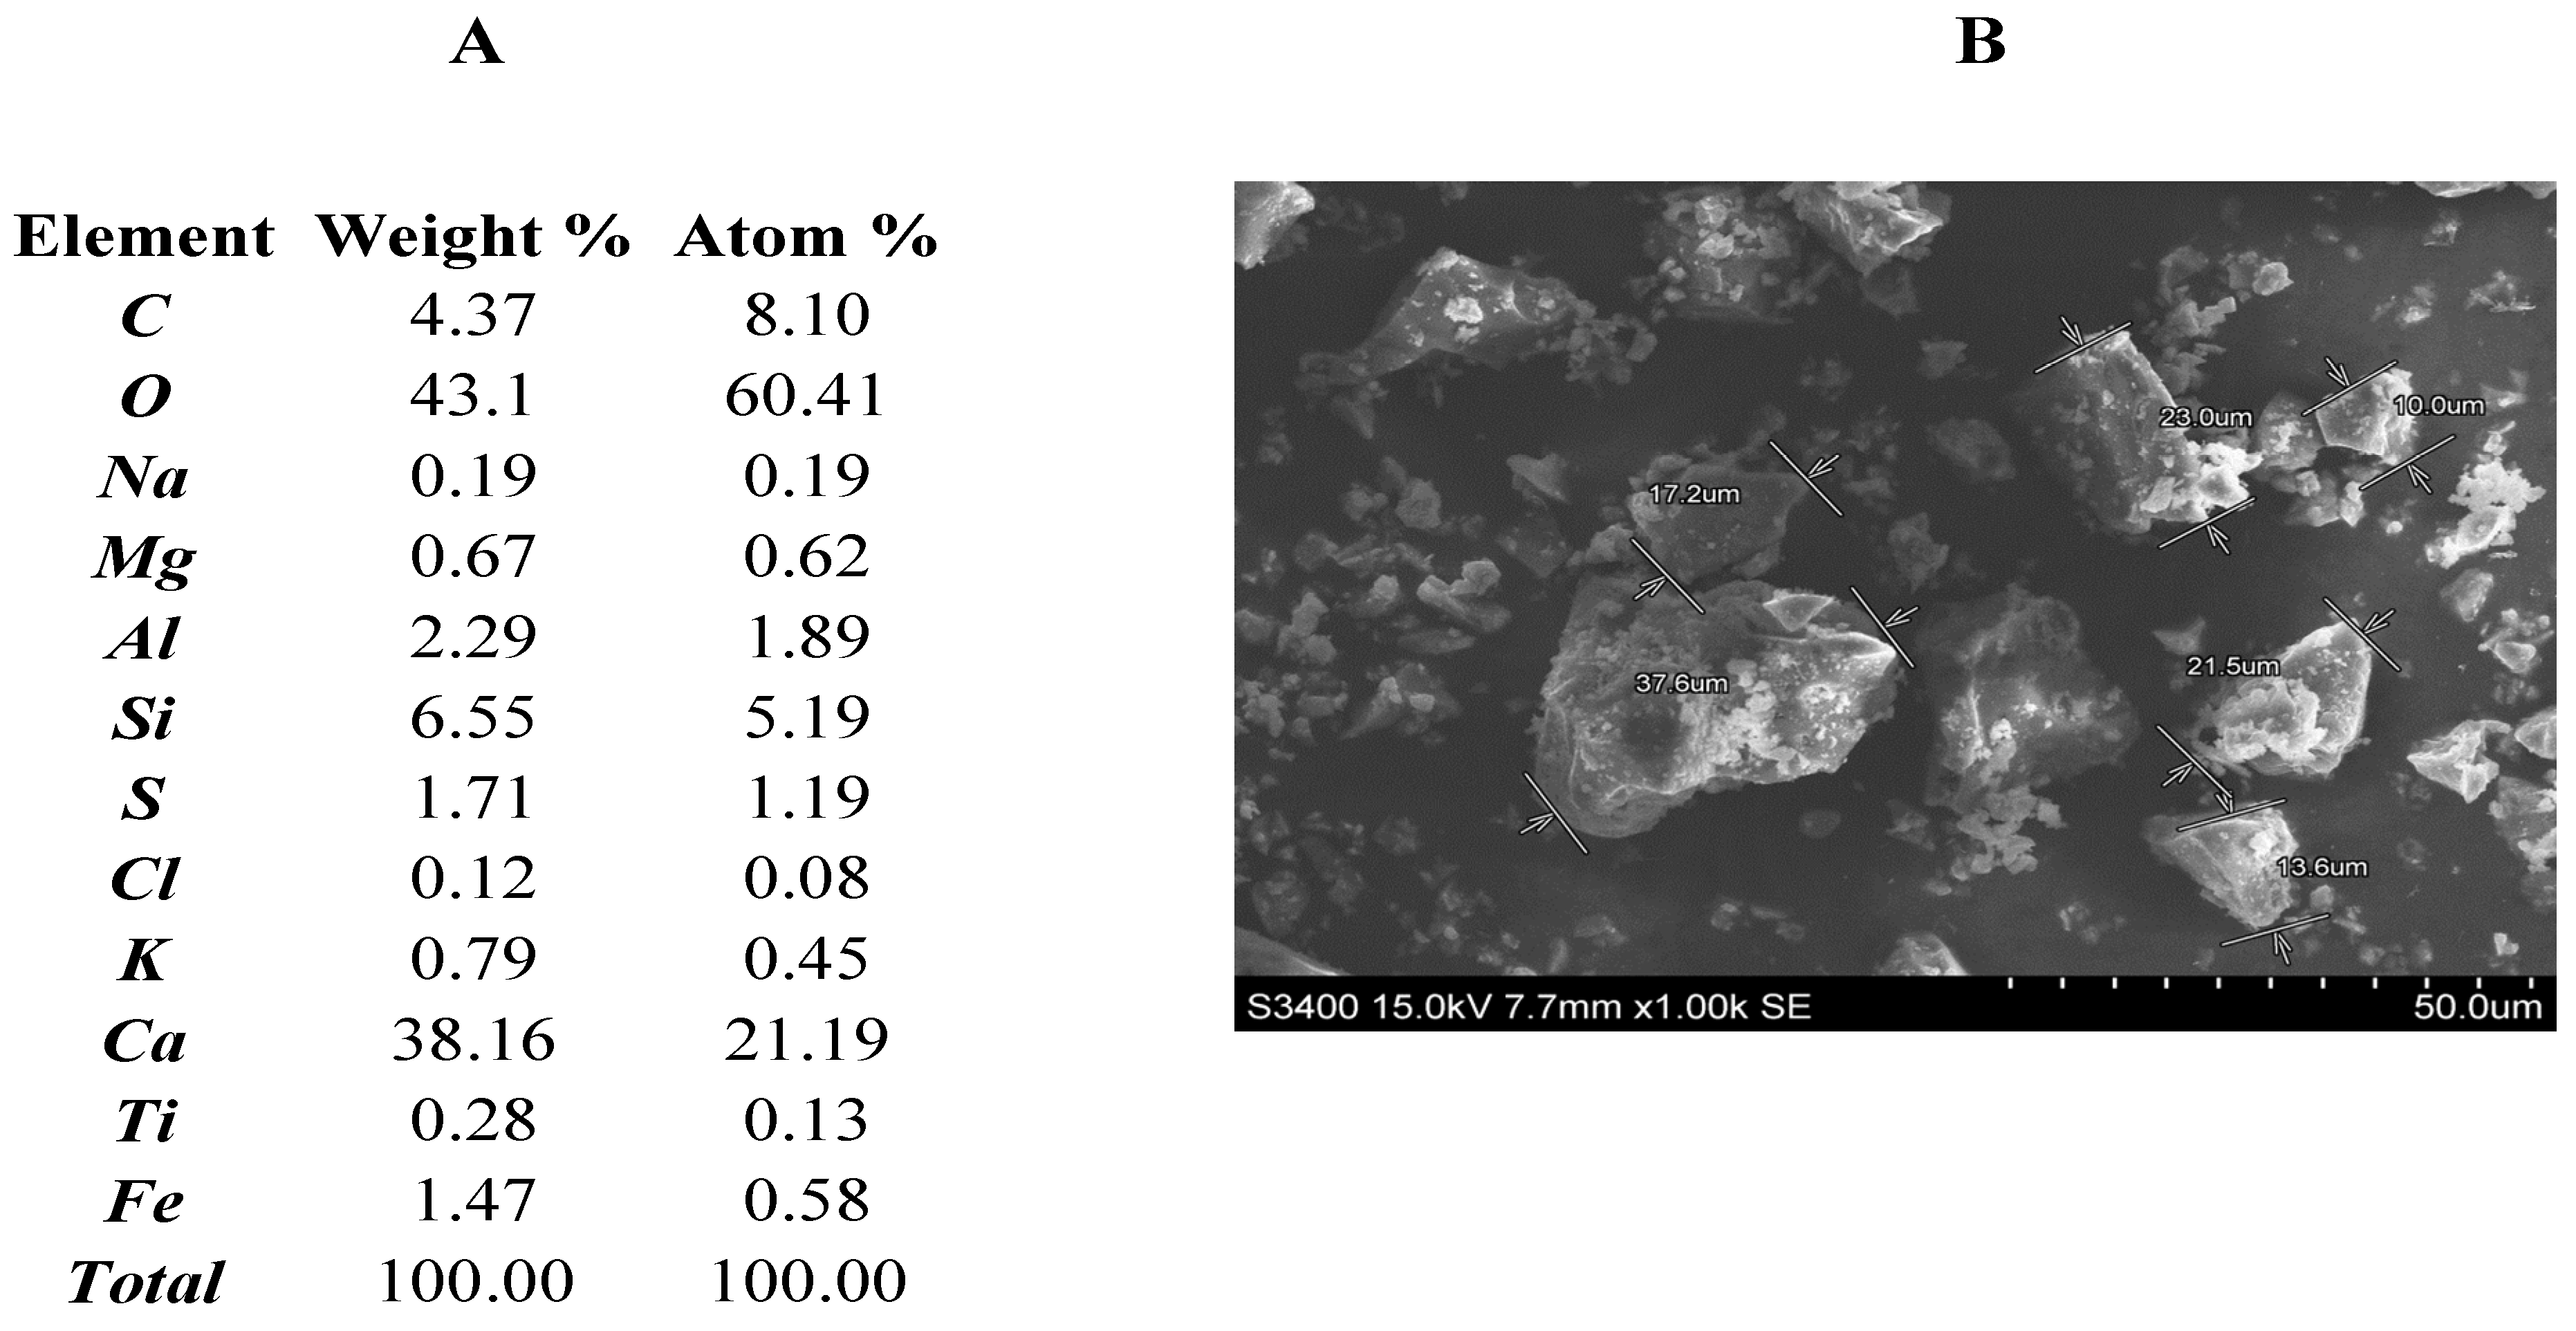
The tests were carried out with the use of Portland cement CEM I 42.5N that conformed to the European standard PN-EN 197-1 and was produced by Górażdże Cement S.A. (Heidelberg Cement Group, Heidelberg, Germany). The elemental composition of the cement (
Figure 1A) used in the research is typical, consisting mainly of oxygen, calcium, silicon, carbon, and aluminium, which confirms the presence of clinker and gypsum as the main components of the Portland cement. Below 0.5% content in the composition can be considered as insignificant, or it may be that their appearance was caused by a device measurement error. The SEM images of the cement used (
Figure 1B) show that the cement particles have irregular, cuboidal shapes, often with sharp edges, the dimensions of which often exceed several tens of micrometres. Cement grains occur individually or in the form of agglomerated grains.
Three biopolymer derivatives—the products of the acid hydrolysis of native potato starch: one white dextrin (hereafter called Dextrin No. 2 or d2) and two yellow dextrins (Dextrin No. 3 and Dextrin No. 5, or d3 and d5, respectively) were examined. All types of dextrins were received from WPPZ S.A. Poland. The basic physical parameters and the degree of polymerisation (DP) of the dextrins used are summarized in
Table 1.
2.2. Testing Procedure
The tests were carried out on mortars with dosages of starch hydrolysates from 0.1% to 0.7%, calculated in relation to the cement weight. Standard quartz sand of 0.125 ÷ 2.00 mm, conforming to European standard EN 196-1, was applied as an aggregate. The mass ratio of aggregate to cement was 1:3, and the water–cement ratio was 0.40 (only for Dextrin No. 3) as well as 0.45 and 0.50, respectively, for all tested dextrins. Admixtures were dissolved in mixing water.
The amount of content materials used, calculated per one excipient, is presented in
Table 2.
Cement mixes were prepared with the use of an automatic cement mixer conforming to EN 196-1.
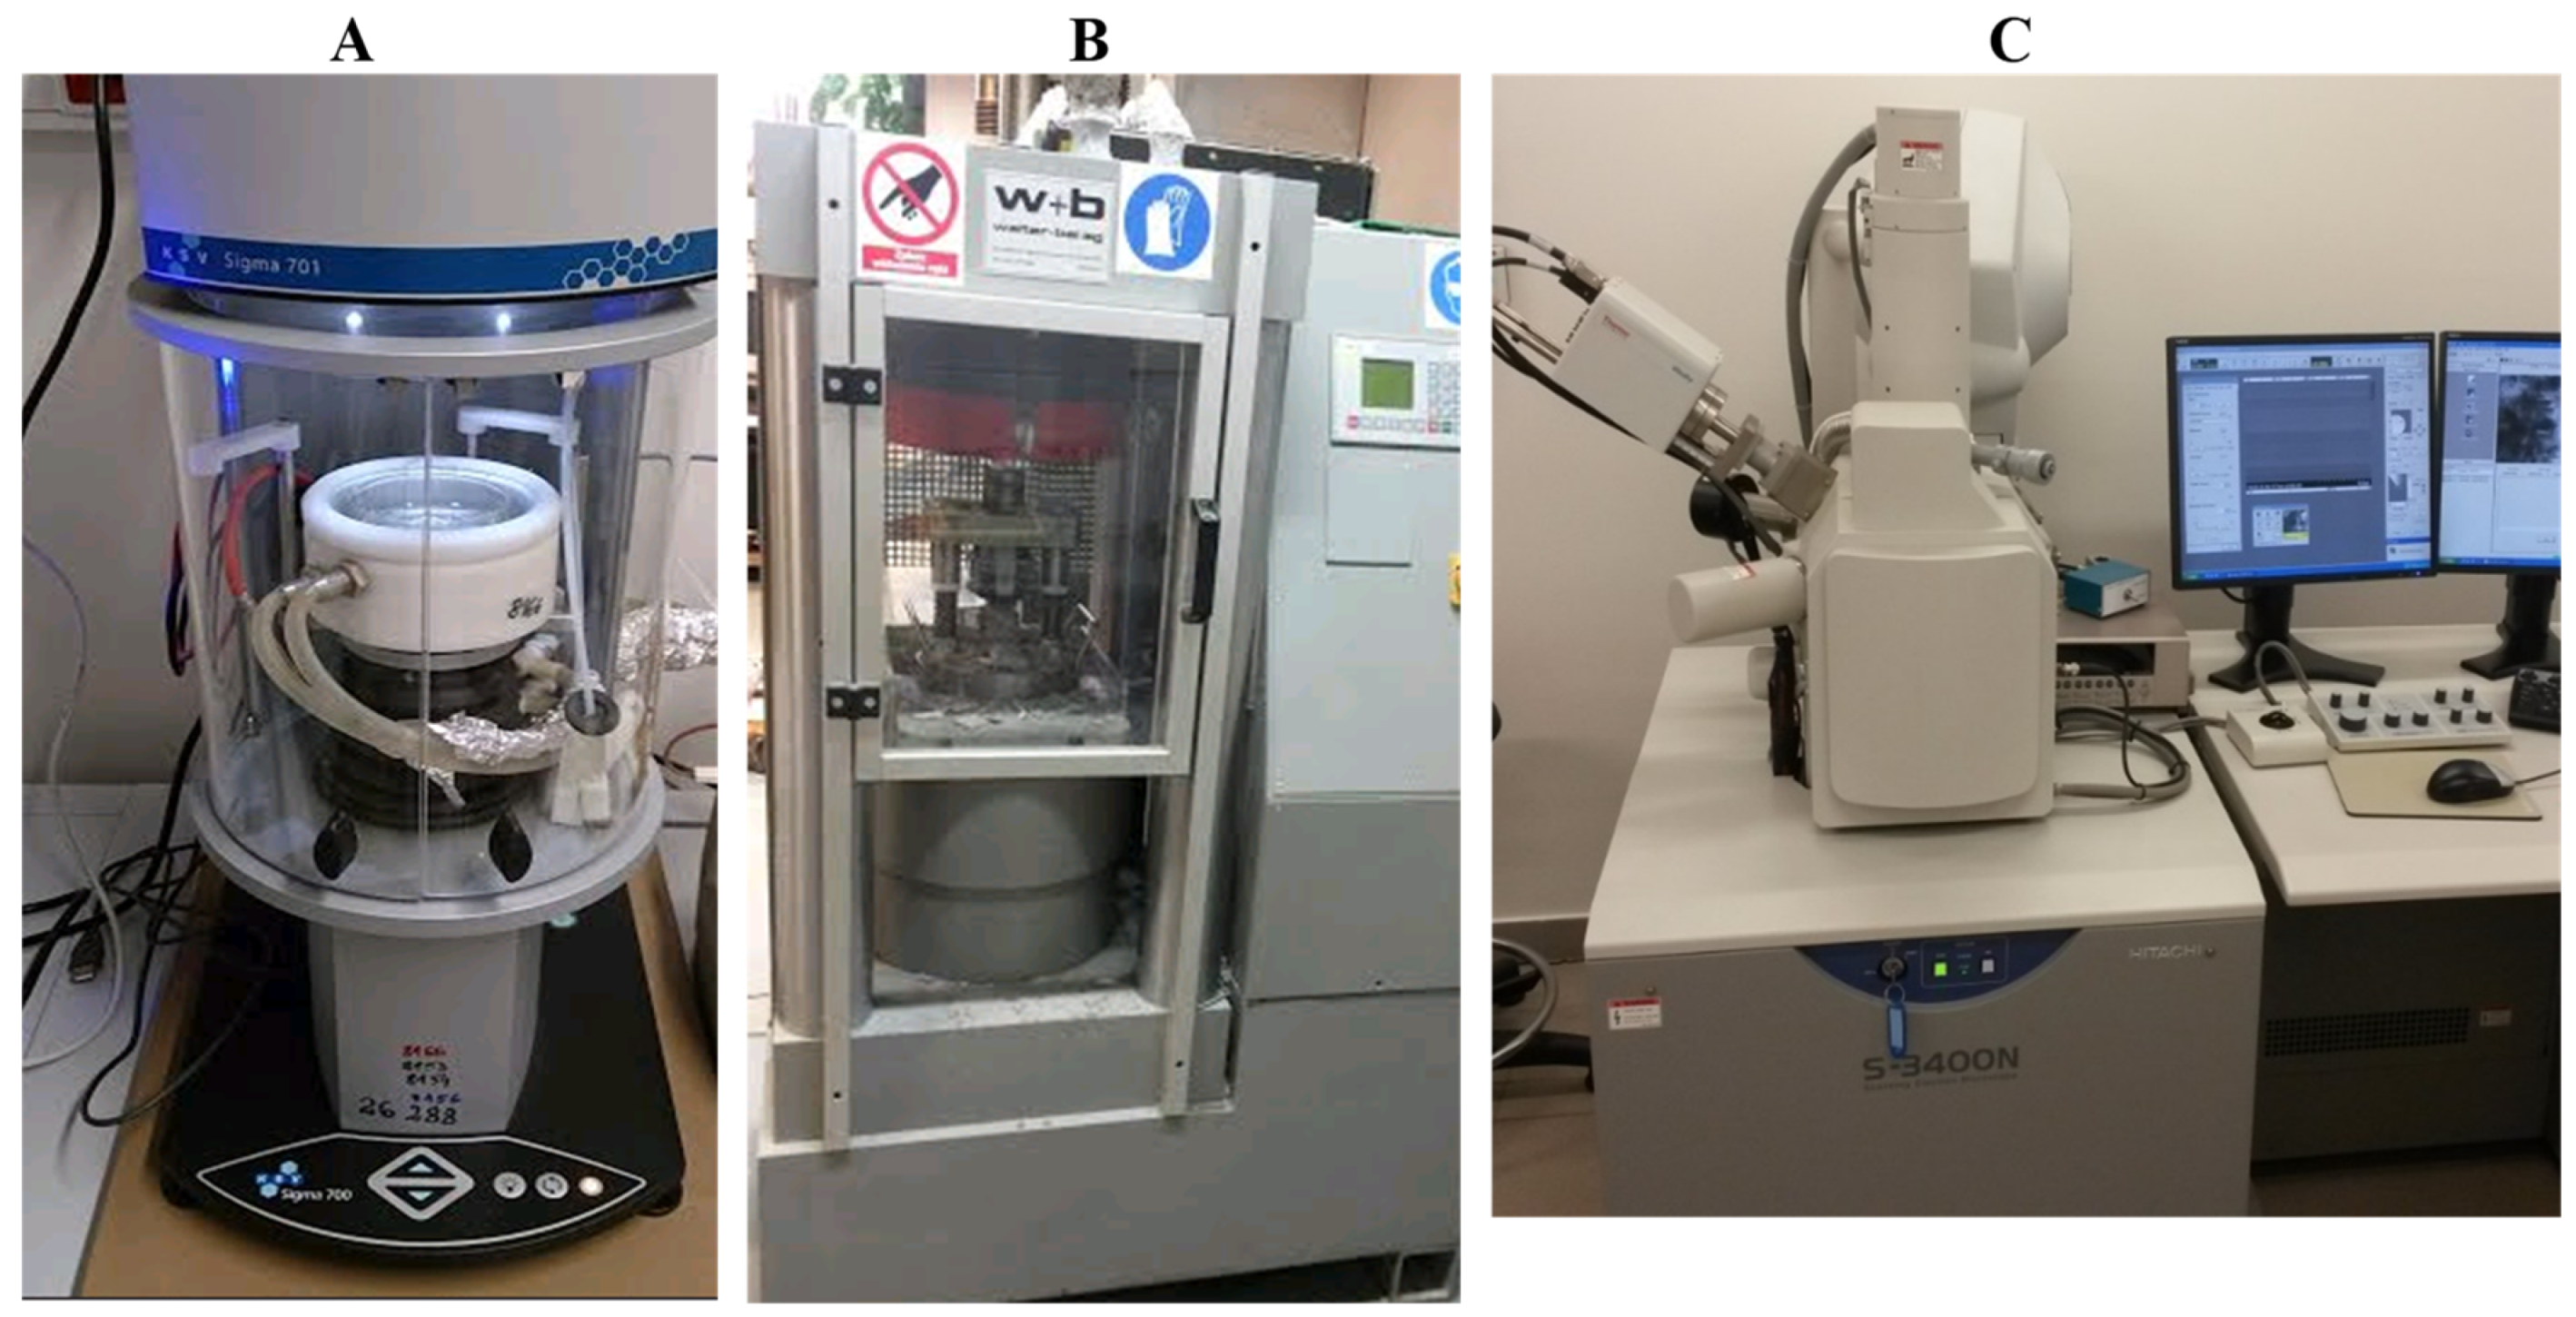
The images of the samples were taken using an S-3400N scanning electron microscope, Hitachi, equipped with an adapter for EDS (energy-dispersive X-ray spectrometry) analysis of ultra-dry materials (Thermo Scientific, Waltham, MA, USA).
The consistency of the fresh cement mortar was designed according to the EN 1015-3 standard, using the flow table for mortars, as described in [
23].
Testing the compressive strength of the cement mortars was carried out according to the PN-EN 196-1 standard. For this purpose, cuboid-shaped beams with dimensions of 40 × 40 × 160 mm were made. After 24 h, the forms were removed, and the samples were placed in water at 20 ± 1 °C. Measurements were taken after 28 days using an automatic press for testing compressive strength (DIGICON 2000, Walter+Bai AG).
The du Noüy ring method was applied to measure the equilibrium surface tension at the air/water interface. The test used a Sigma 701 KVS force tensiometer with the du Noüy ring made of a thin platinum wire. Each measurement was repeated thrice. The experimentally determined isotherms of surface tension were approximated by the Szyszkowski isotherm equation. Based on the Szyszkowski equation coefficients, the value of the adsorption parameters was estimated according to [
24,
25,
26].
Viscosity measurements were carried out with the use of the Thermo Scientific™ HAAKE™ Viscotester™ 550, equipped with an MV-DIN rotor. The viscosity of 40% of the solutions of dextrins was measured at room temperature with a rotational speed of 100 rpm ± 1. Rheological tests on the cement slurries were carried out for samples containing a 0.5% share of a modifying agent in relation to the cement weight, as well as for the
w/
c ratio equal to 0.40 and 0.50, respectively. The aqueous solution of dextrin was added to an adequate quantity of cement, and the whole solution was mixed for 10 min with the use of a mechanical stirrer. Then, the viscosity of the slurry was measured by applying rotor speeds in the range of 10 to 300 rpm ± 1. On the basis of viscosity measurements, the values of the rheological parameters of cement slurries were designated by applying the Bingham model [
27].
XPS analysis was carried out with the PHI VersaProbeII apparatus (ULVAC-PHI, Chigasaki, Japan) using a focused, monochromatic X-ray line Al Kα (1486.6 eV). The beam was focused to a 100 µm spot and used to scan an area of 400 µm × 400 µm on the sample surface. One broad-range spectrum (0-1300 eV) with low resolution (0.5 eV) and a set of high resolution spectra (0.1 eV) in the areas C 1s, O 1s, Al 2p, Si 2p, K 2p, and Ca 2p were measured. During the measurements, surface charge neutralization was applied by irradiating the surface with a beam of low-energy electrons (1 eV) and Argon ions (7 eV Ar
+) to ensure a constant surface potential, despite the emitted photoelectrons. The value of the pressure during the measurement oscillated around 3 × 10
−9 mbar (ultra-high vacuum). The adjustment of the spectral lines was carried out using the PHI Multipak program (v.9.9.0.8, ULVAC-PHI, Inc., Chigasaki, Japan), subtracting the background using the Shirley method [
28].
Pictures of the most-important equipment used in the study are presented in
Figure 2.
3. Results
3.1. Surface Tension
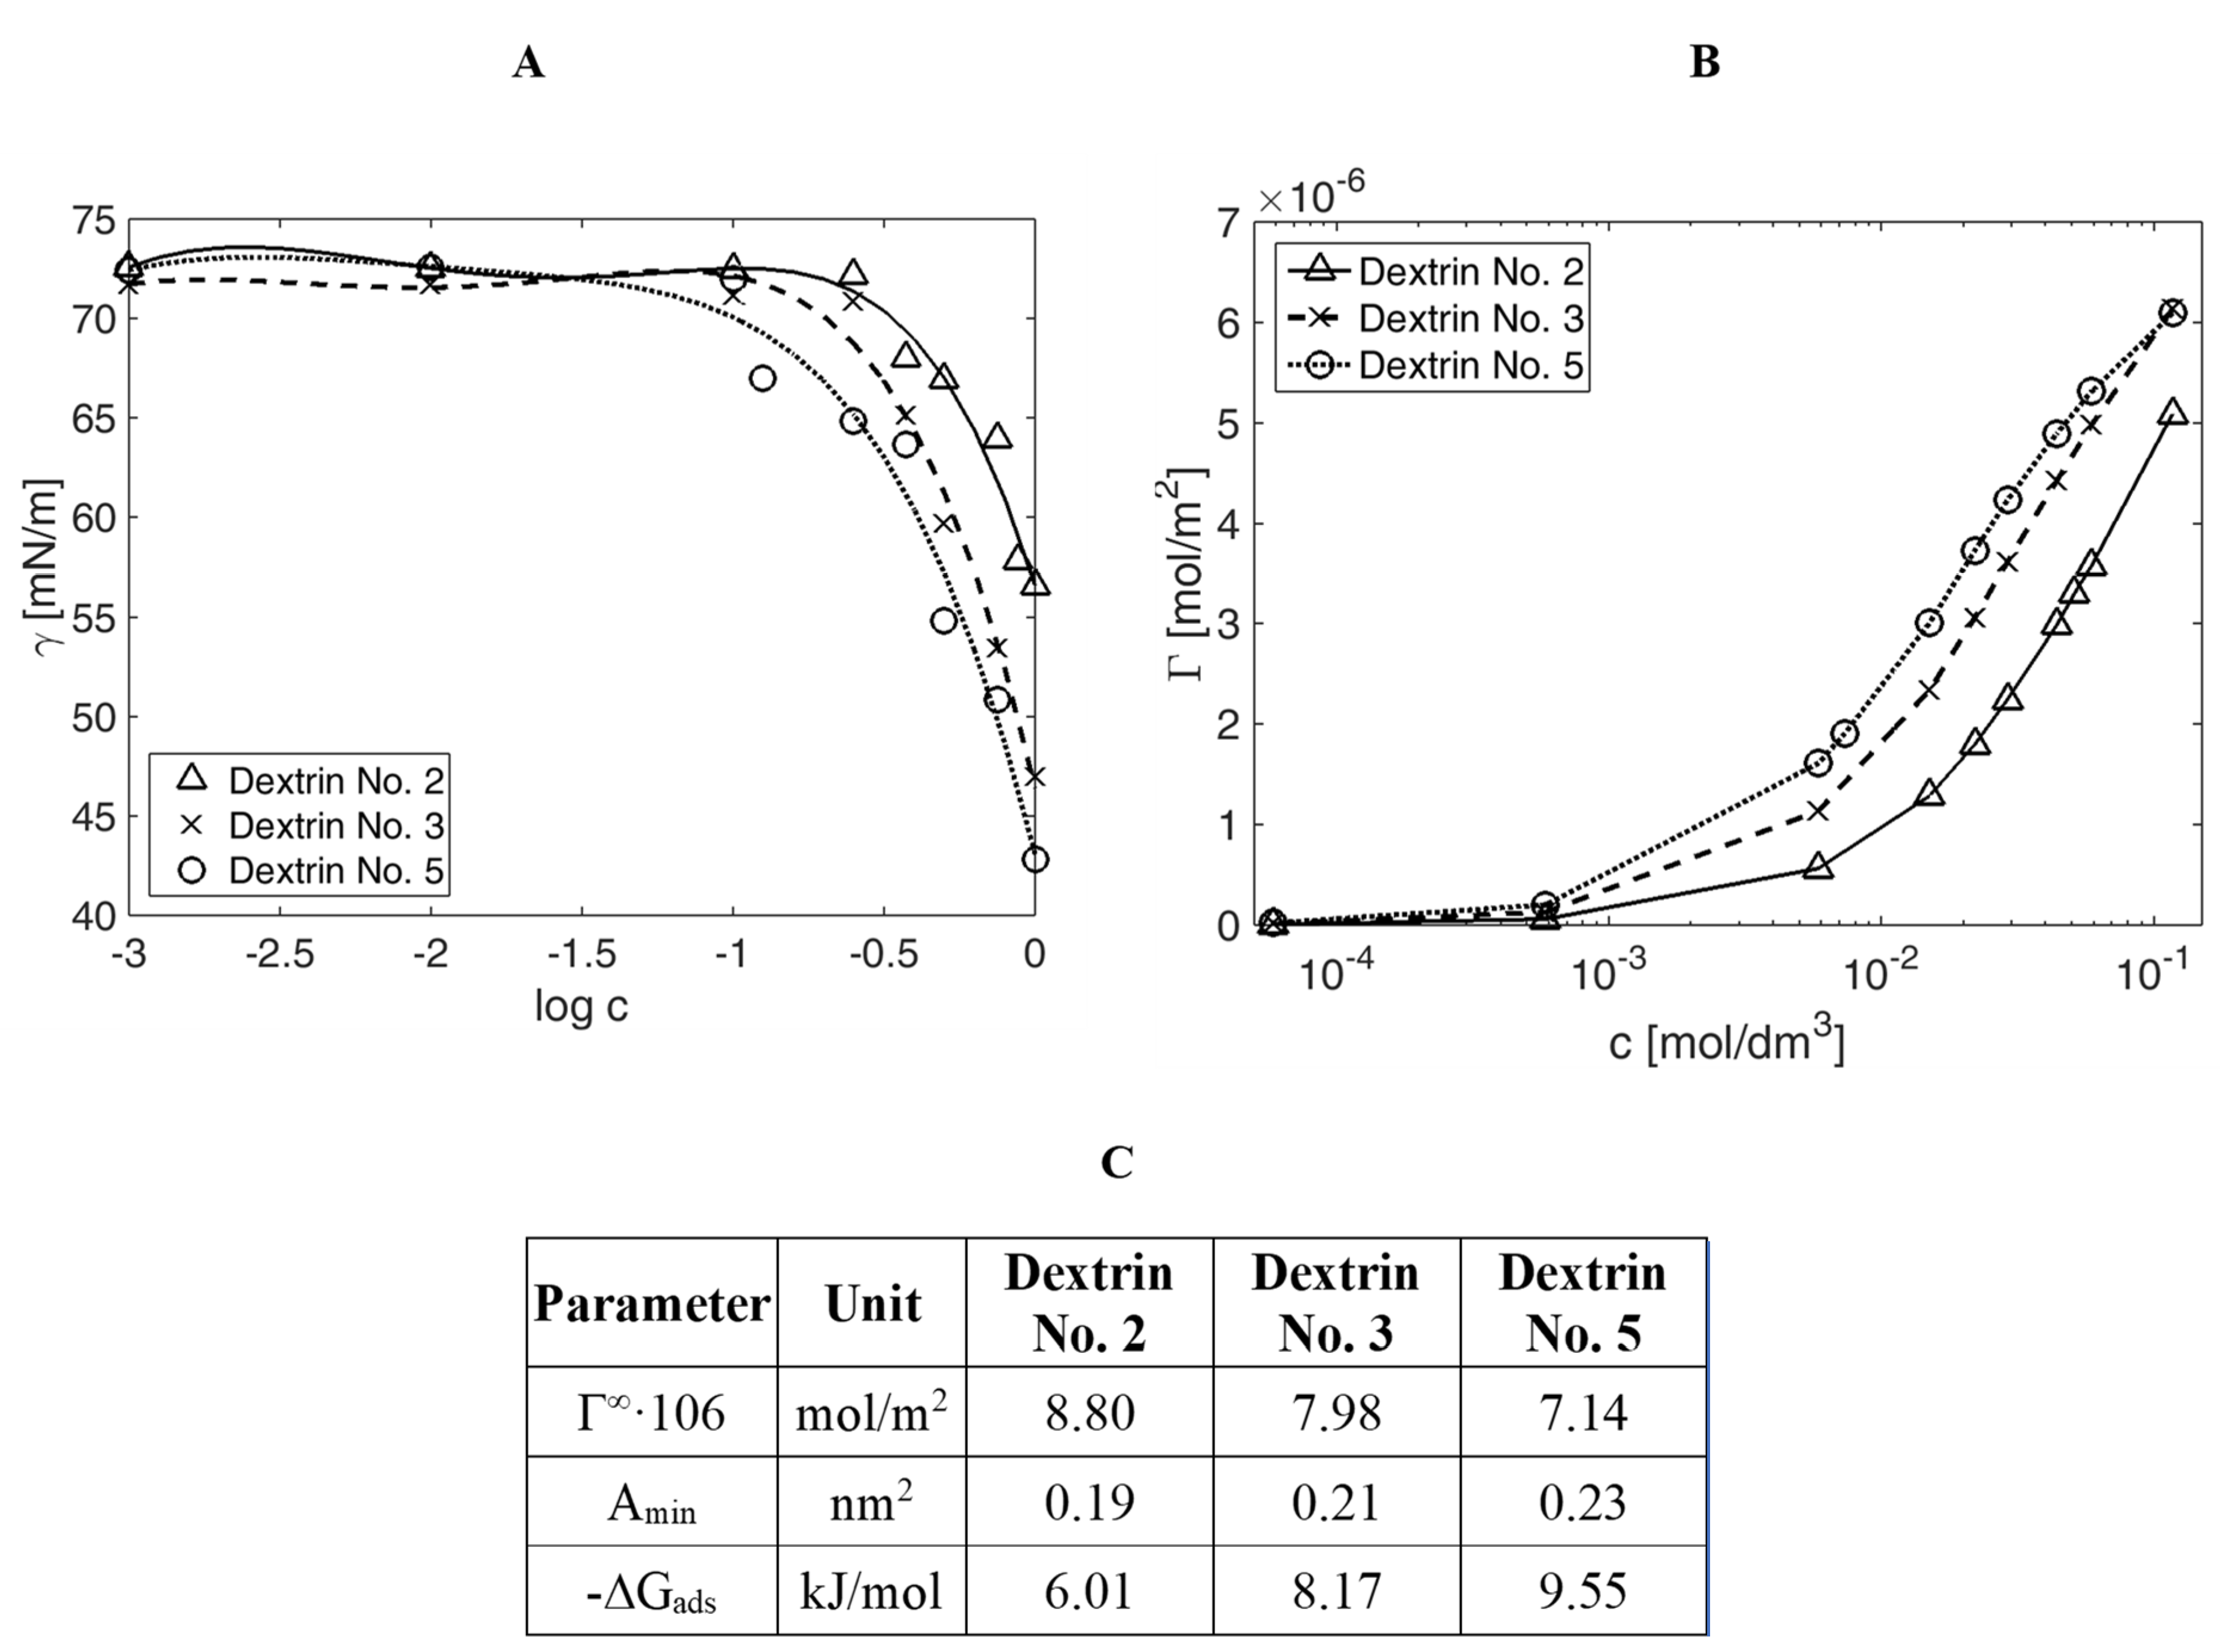
One of the properties that a plasticizer should have is the ability to reduce the surface tension at the air/water interface of the phases. Three formulations of commercial white (d2) and yellow (d3 and d5) dextrins were subjected to surface activity tests.
Figure 3A,B summarizes the results of the surface tension measurements of the different dextrins, according to their concentration in the tested solution, in the form of diagrams that show the relation of the surface tension as a function of the concentration logarithm (measurement error of surface tension amounted to ±0.01 mN/m).
Figure 3C consists of the quantitative characteristics of the surface properties of hydrolysed starch derivatives in the water/air system, i.e., the value of the surface excess (Γ
∞), adsorption free energy (∆
Gads), and the area occupied by a single molecule at the saturated interface of phases (
Amin), calculated with the use of Szyszkowski equation coefficients.
An analysis of the compiled data allowed for the conclusion that in all cases, starch derivatives adsorbed themselves at the interface of air/water phases and reduced the surface tension. Dextrin No. 5 reduced the surface tension most effectively because, up to the value of approximately 42.8 mN/m, the minimum surface tension reduction (to approximately 56.5 mN/m) was noted for Dextrin No. 2.
The adsorption surface layer was similarly dense for all studied derivatives. The highest density value was recorded for d5, and the lowest for the derivative d2. For the studied concentrations, there was no saturation phase for any hydrolysate.
Figure 2C summarizes the adsorption parameters that allowed for a quantitative assessment of the surface activity of the starch hydrolysates.
The adsorption tendency, expressed as the adsorption free energy, was similar for all examined derivatives. Dextrin No. 5 was characterized by the easiest surface adsorption (the lowest value of adsorption free energy). The least-packed adsorption layer was formed by Dextrin No. 2, as evidenced by the value of Γ∞. The orientation of the particles and, thus, the area occupied by a statistical molecule adsorbed at the saturated interface of phases were also similar for all three derivatives, as evidenced from the values Amin.
3.2. XPS Analysis
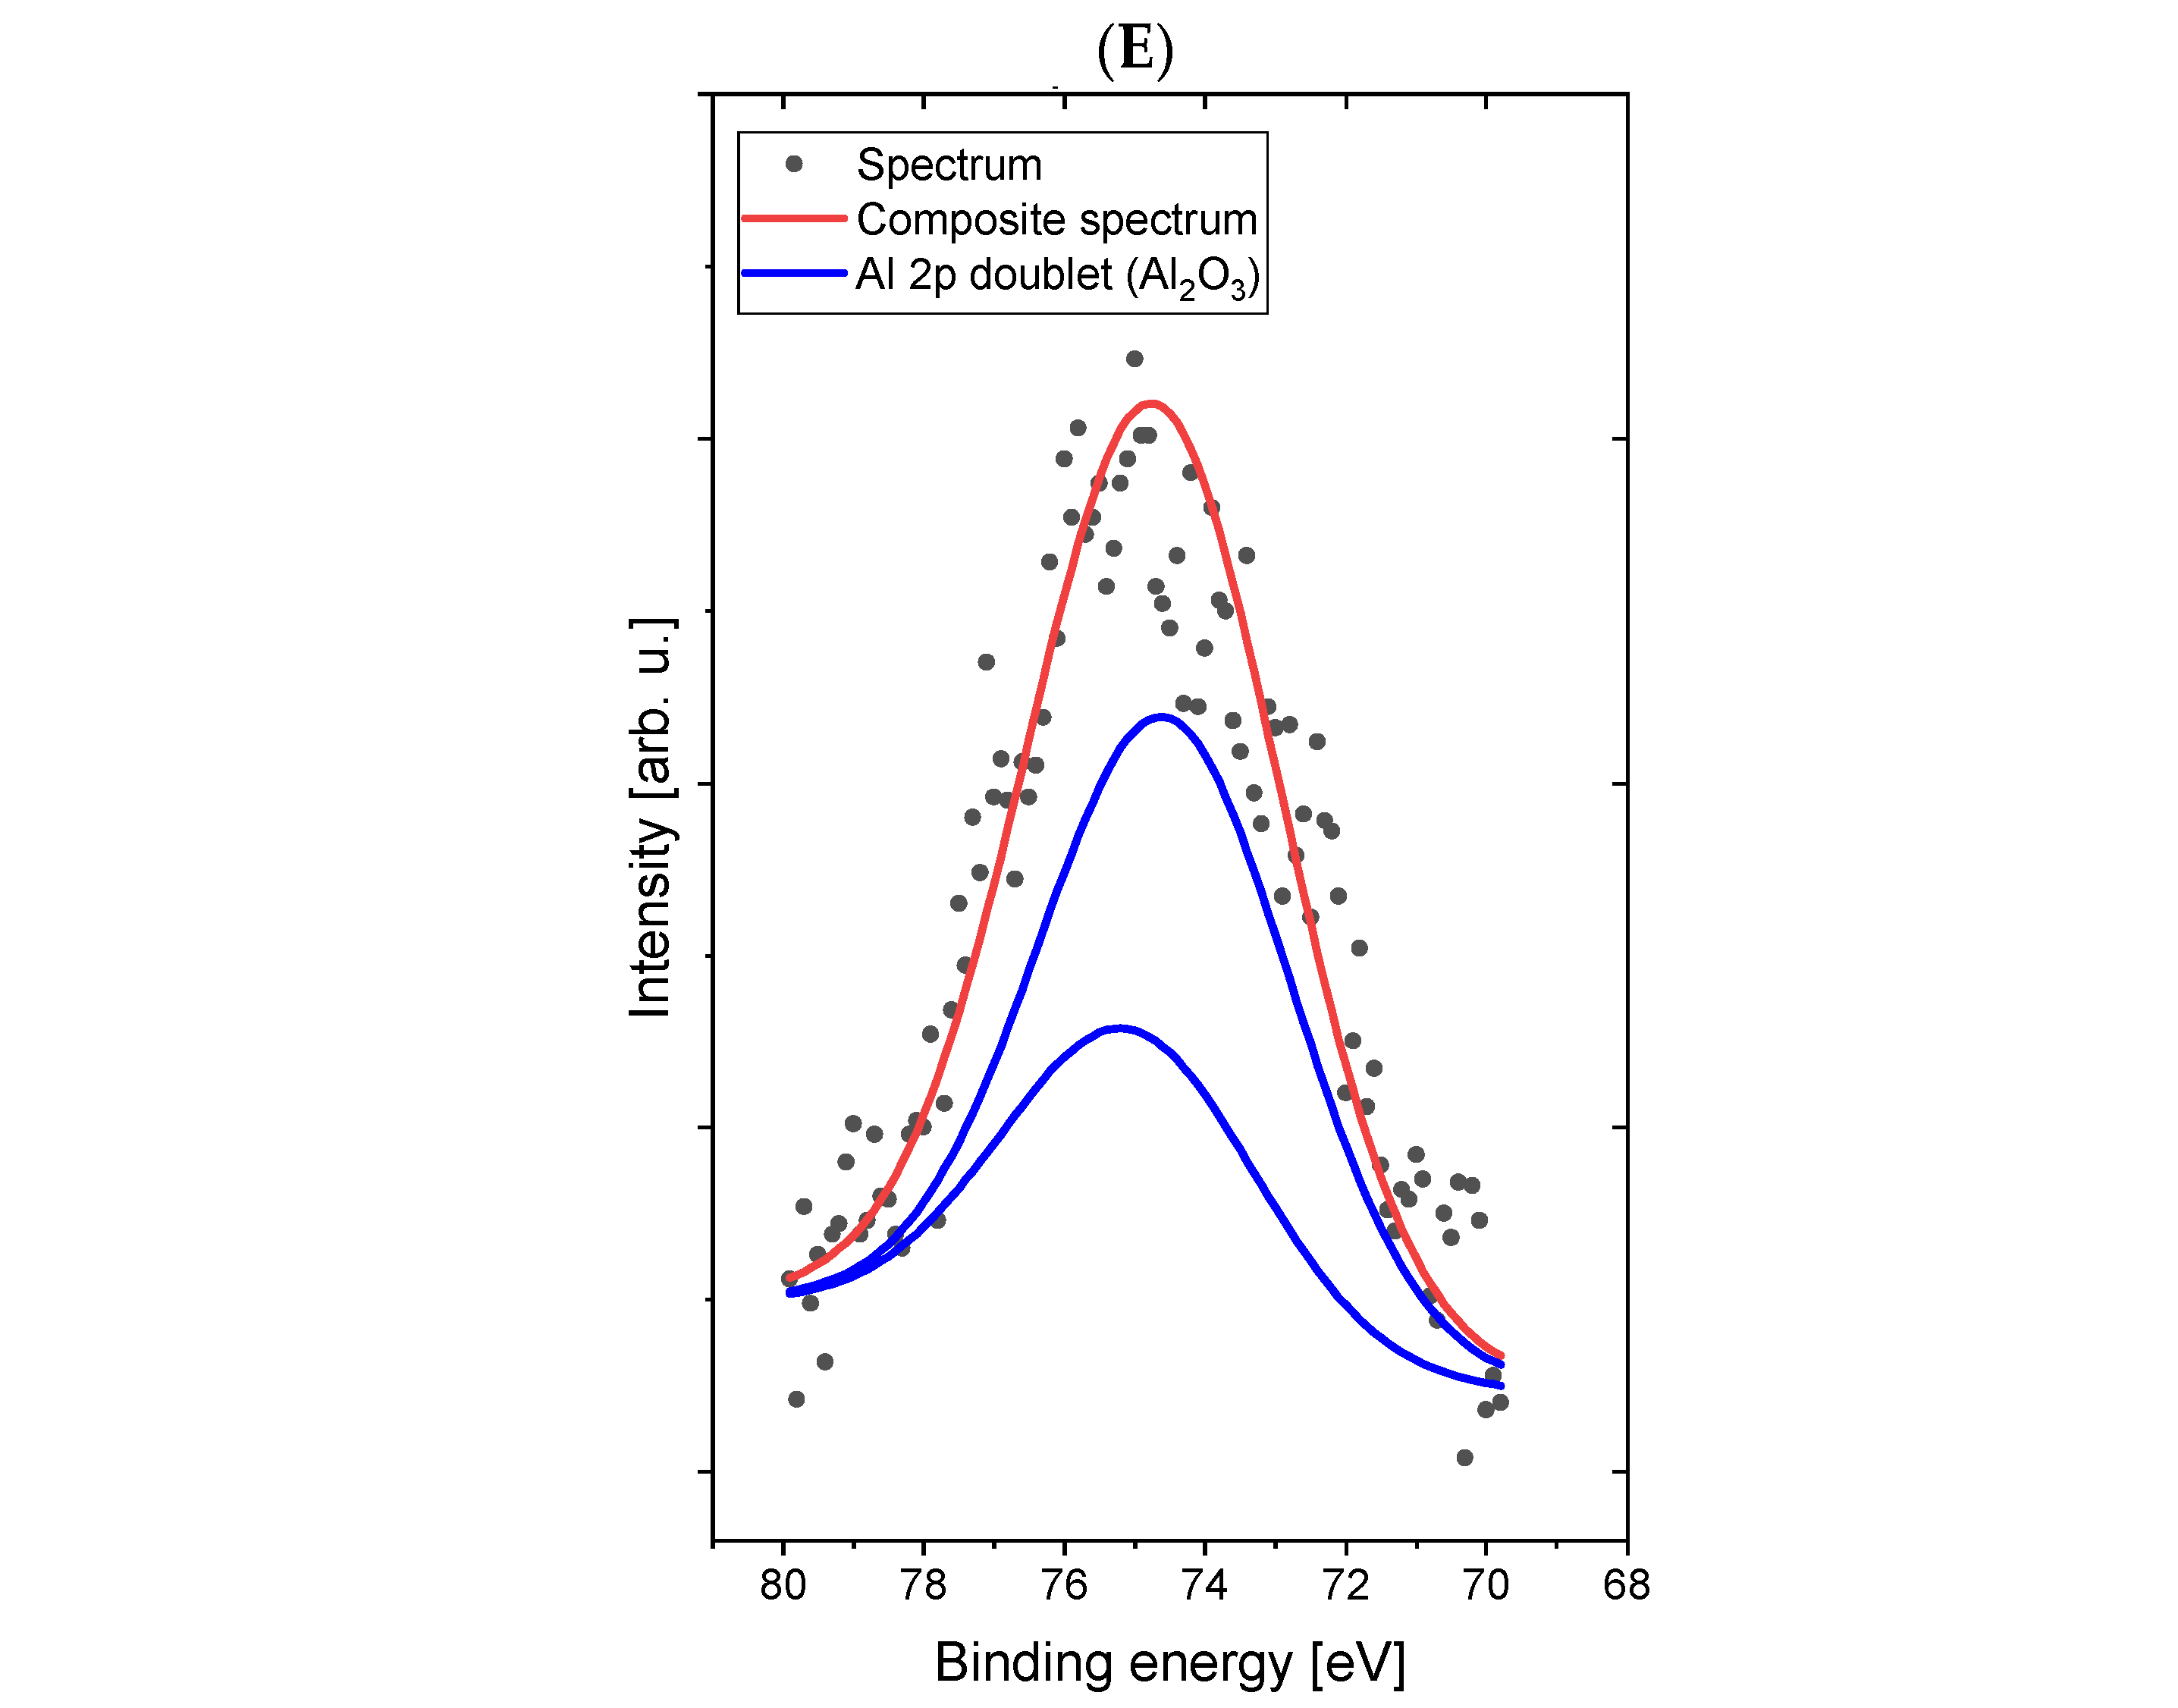
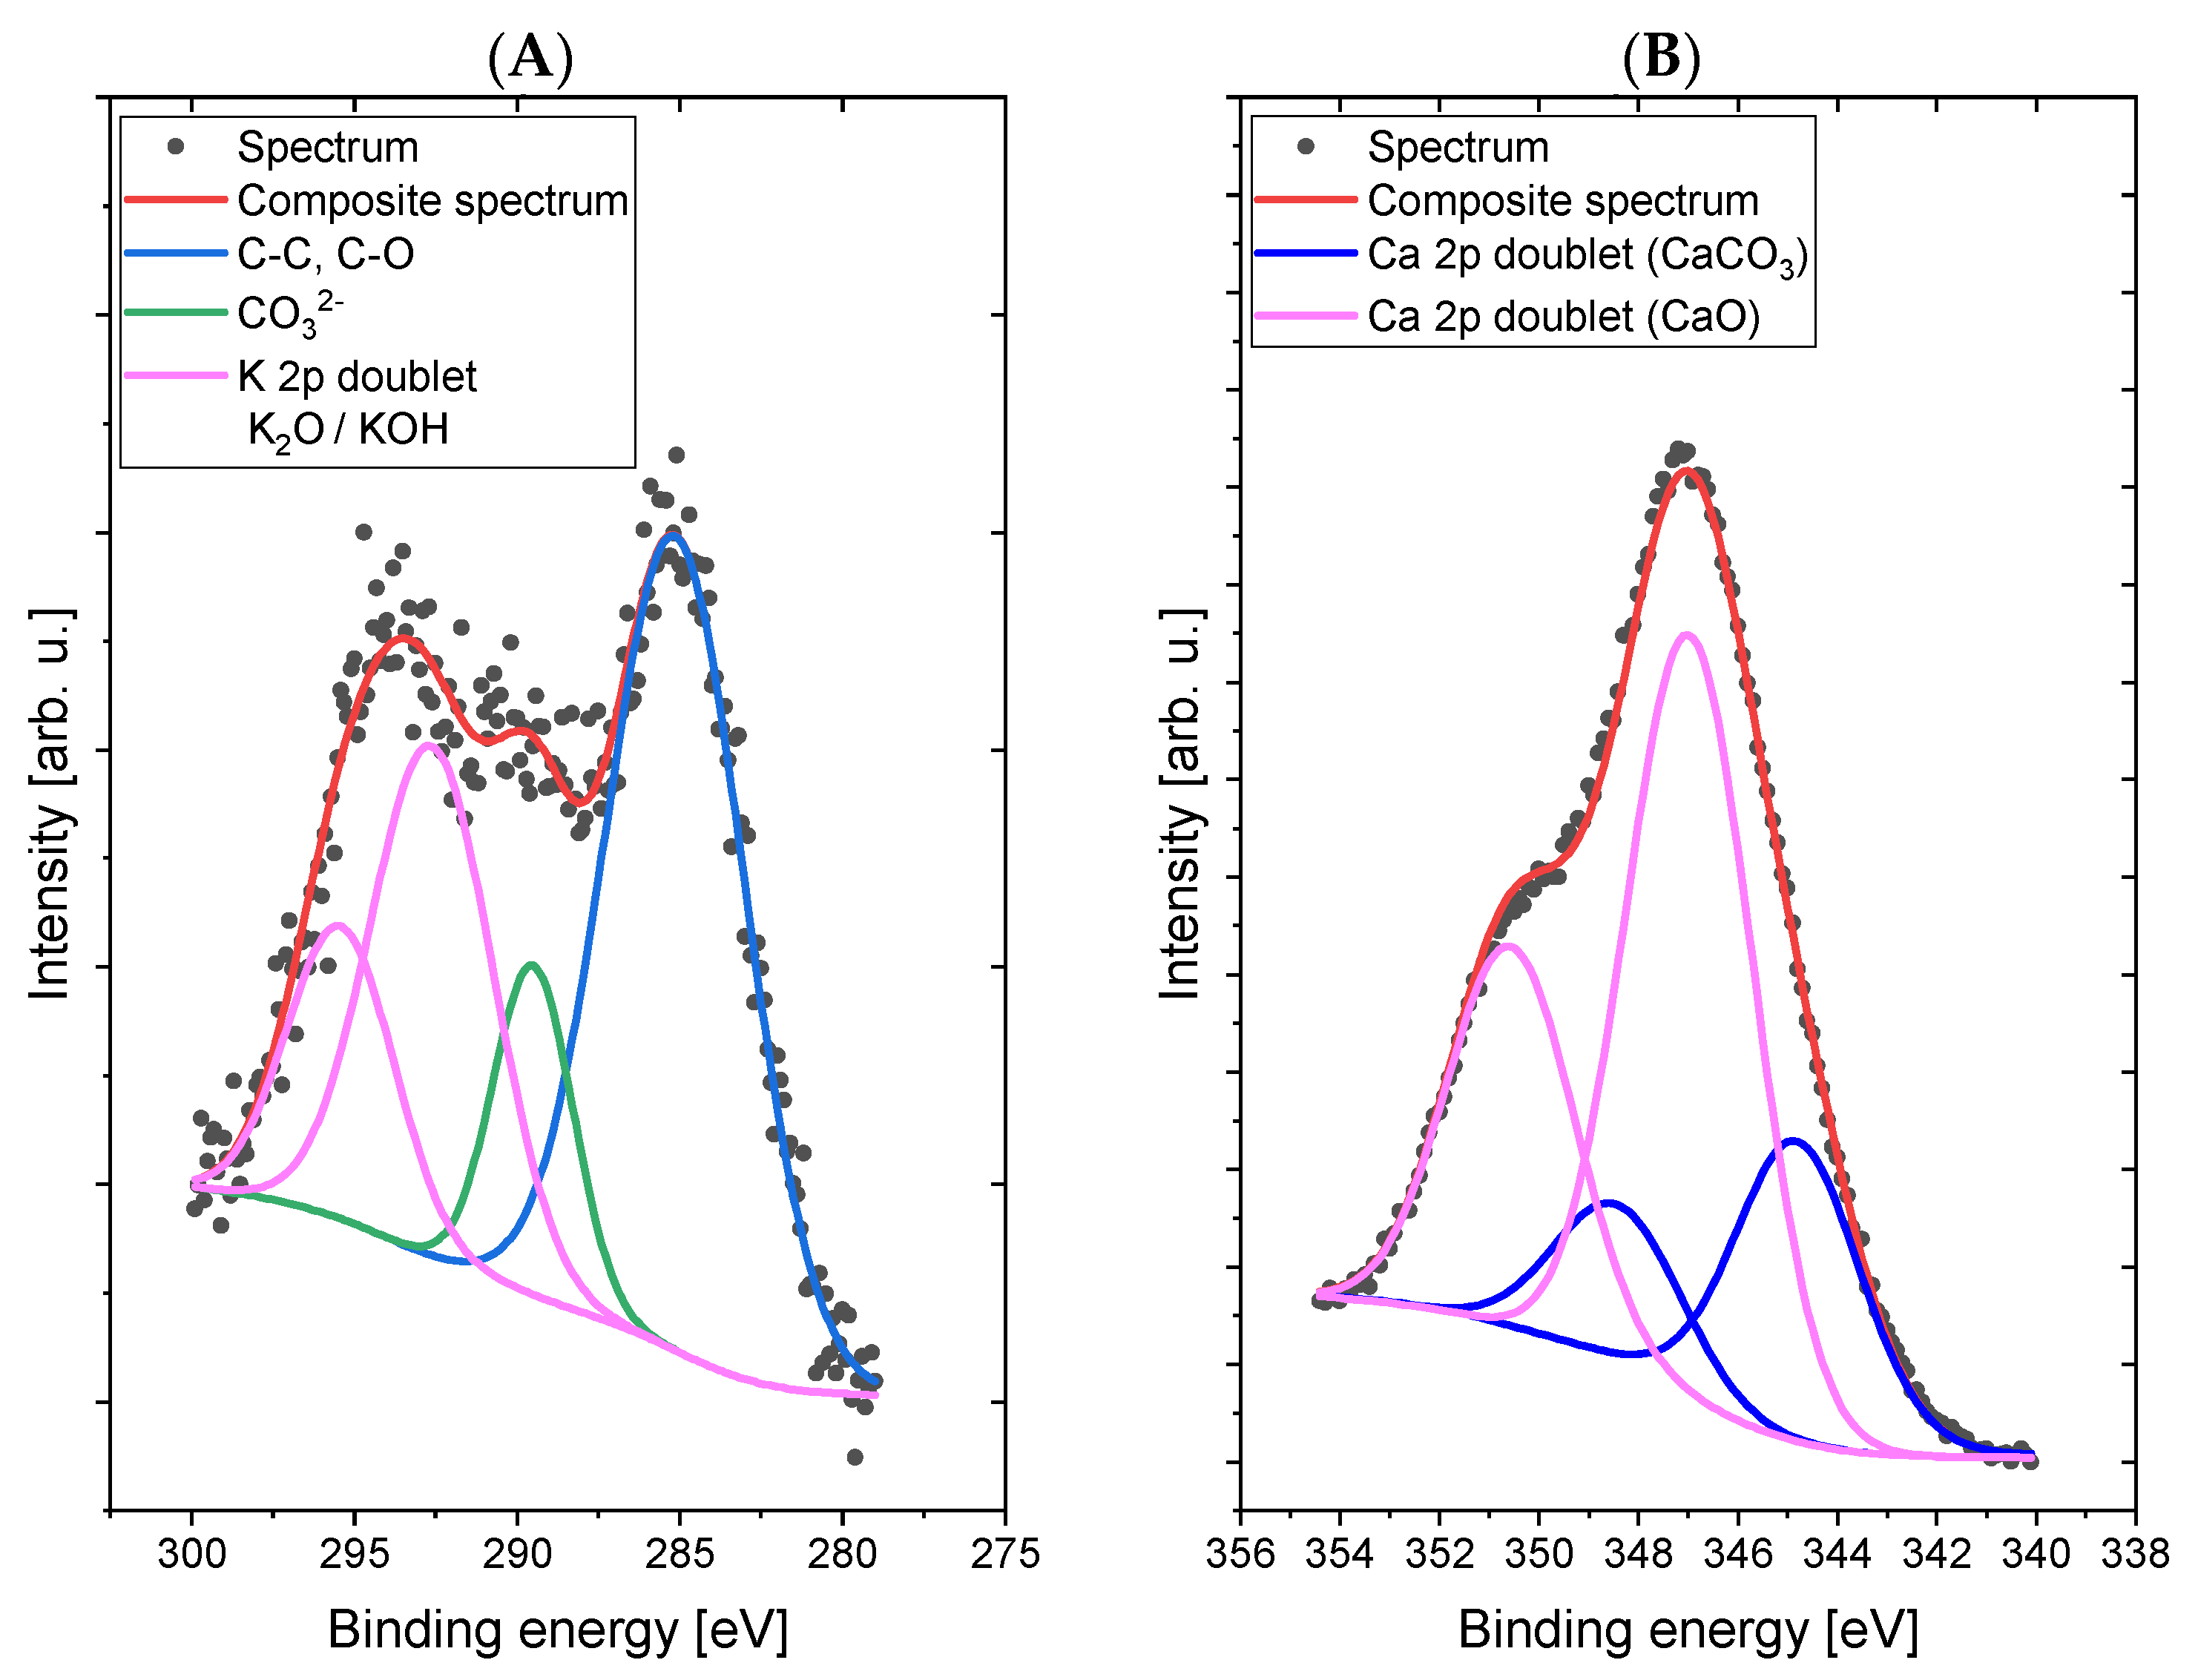
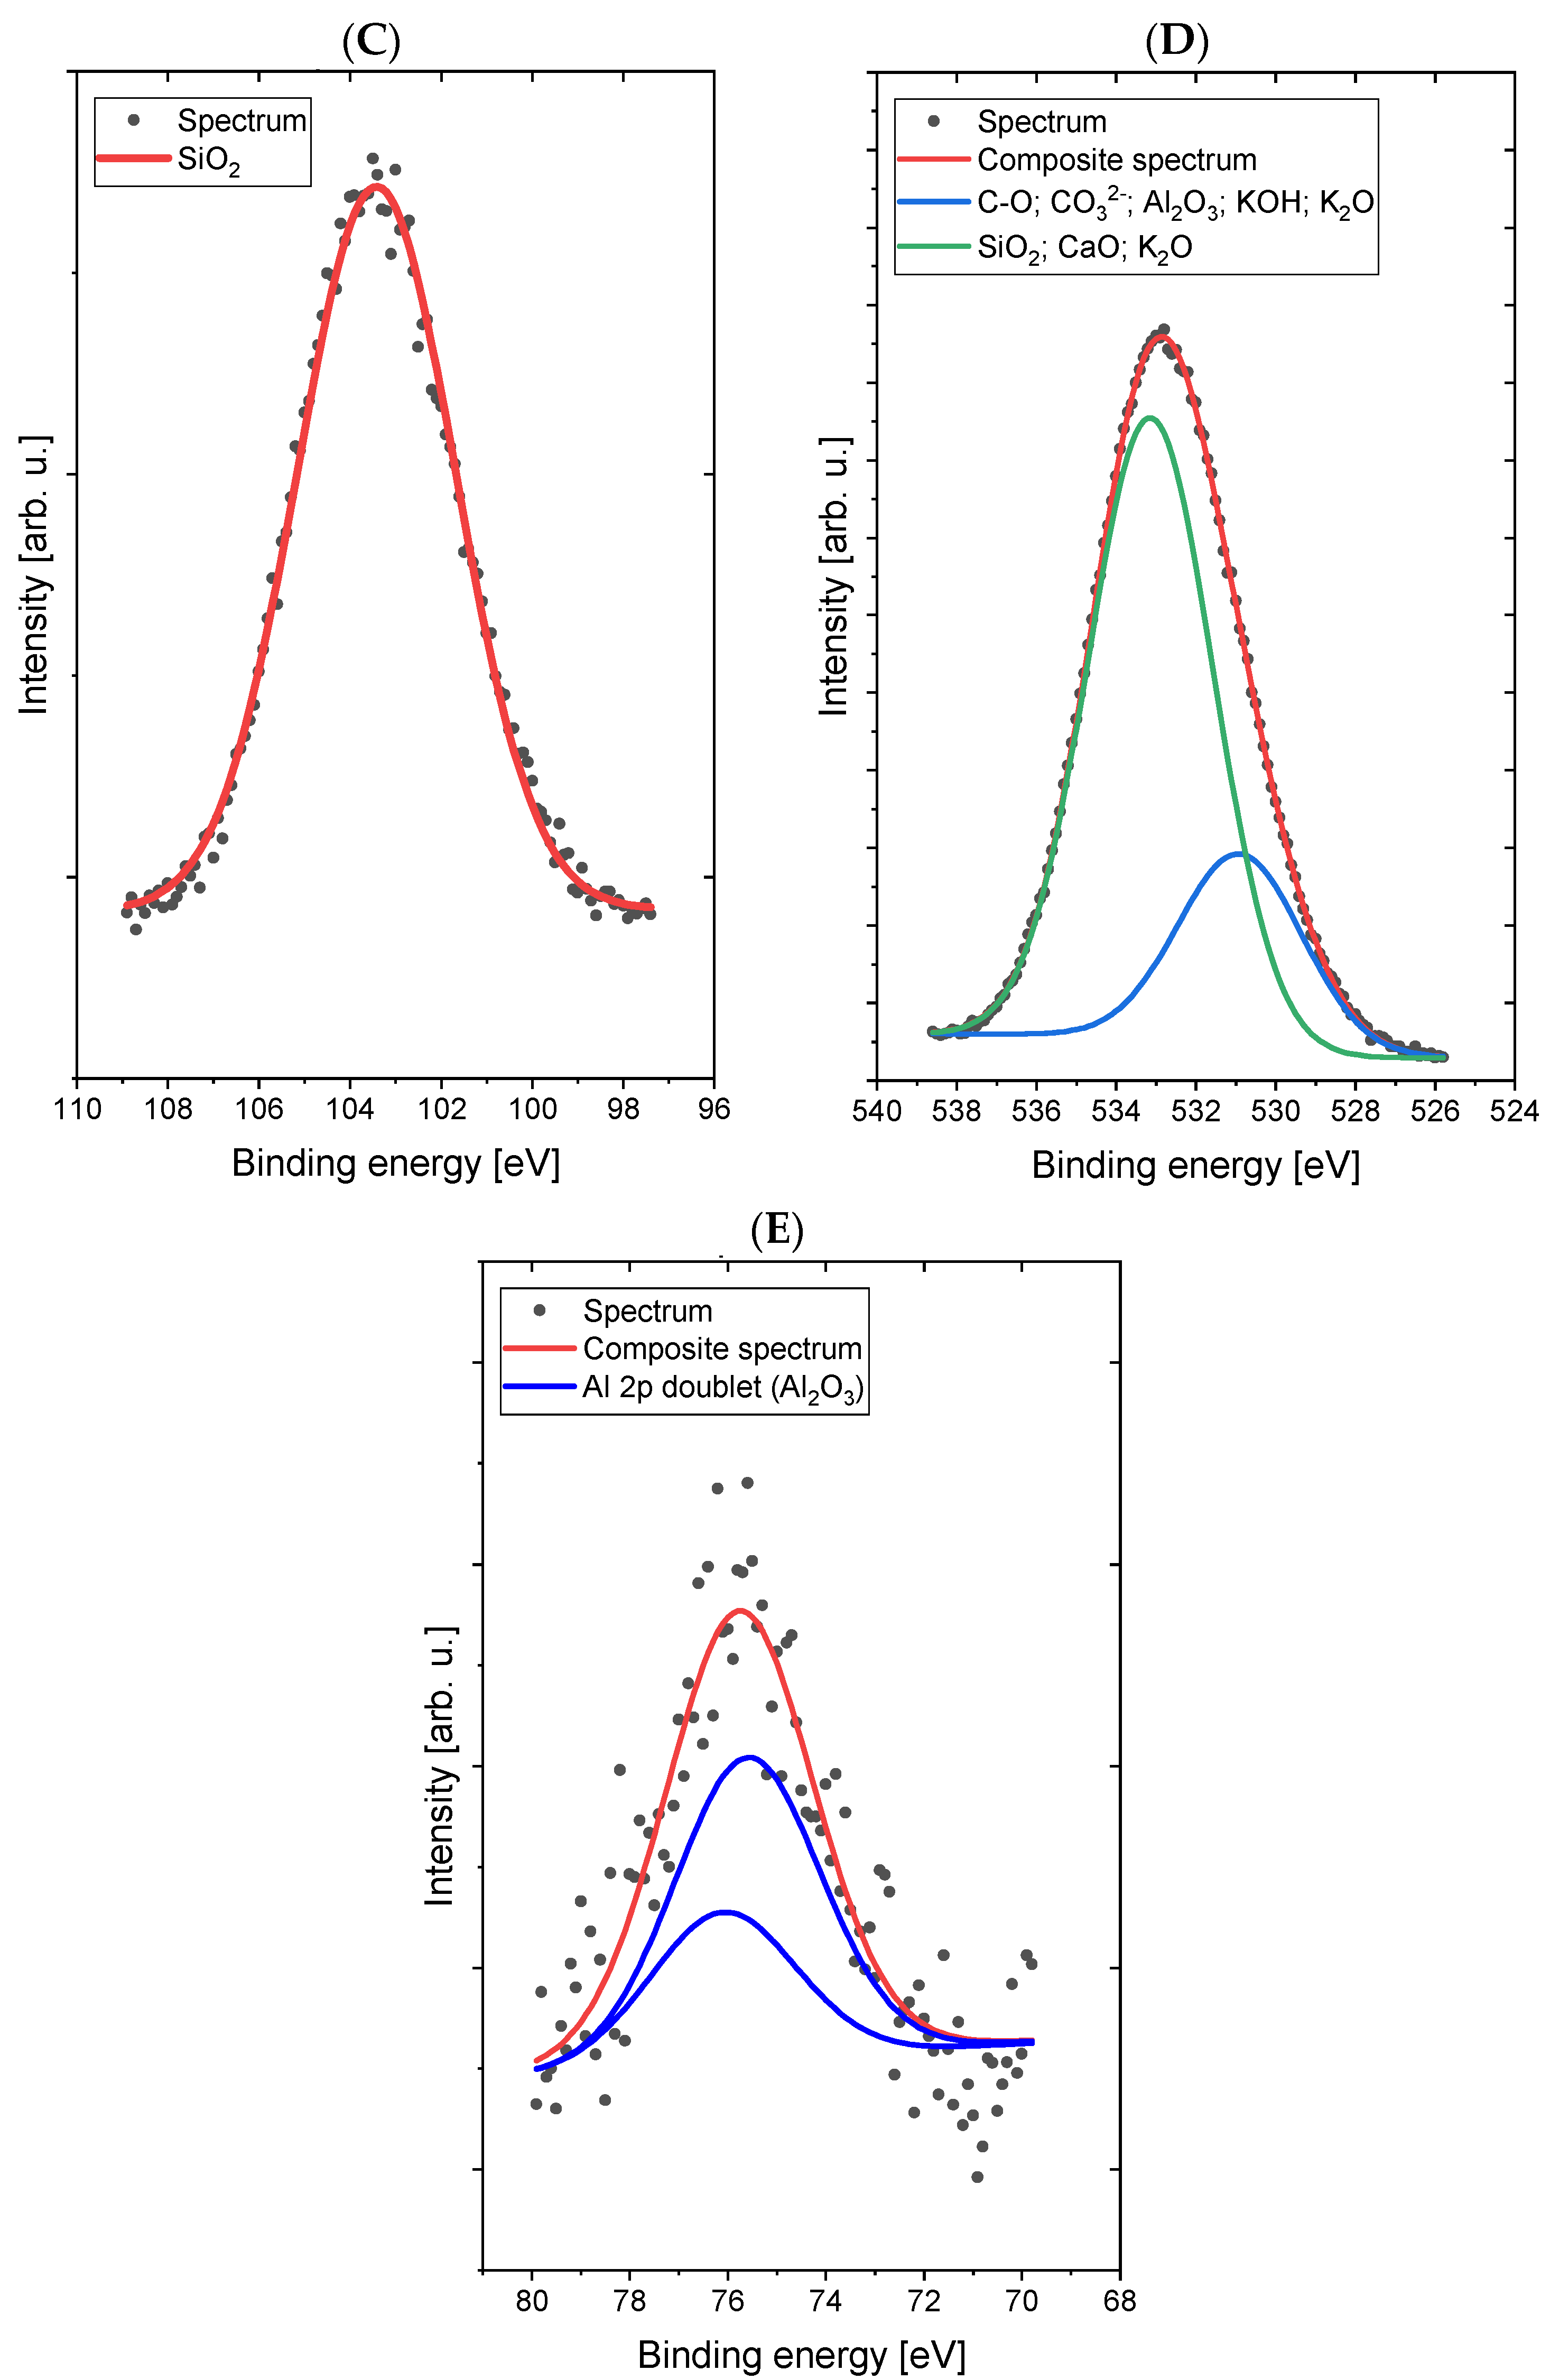
Comparative XPS analyses of a concrete sample without the addition of dextrin (
Figure 4) and a concrete sample containing the starch derivative d3 (
Figure 5) were carried out. The most intense lines were identified and signed on the spectra.
The spectrum in the C 1s/K 2p region was fitted with four lines, of which line 1, lying on 285.0 eV energy, represents a C–C (sp3) and/or C–O bond [
29], line 2, with 289.3 eV energy, is responsible for the presence of carbonate groups (CO
32−) and/or bicarbonate (HCO
3−) [
30] types, lines 3 and 4 are a doublet derived from potassium (line K 2p-separation p
3/2–p
1/2 is 3.5 eV) with the main line 3 lying on the binding energy of 292.7 eV, which indicates the presence of potassium in oxide and/or hydroxide [
30]. The spectrum in the O 1s (oxygen) region was fitted with two lines: line 1, lying on the binding energy of 530.1 eV, corresponds to the binding in the CO
32−-type compounds Al
2O
3, KOH, and K
2O, while the second line, at 532.9 eV, corresponds to bonds in the SiO
2 compounds CaO and K
2O [
30,
31]. Small chemical shifts in the O 1s area for individual oxygen-containing compounds (both organic and inorganic) cause overlapping lines and the inability to clearly interpret the spectrum in this area. The spectrum in the Al 2p region was fitted with a single doublet (p
3/2–p
1/2 separation is 0.5 eV), with the main line lying on 74.1 eV binding energy, which indicates the presence of Al
2O
3 oxide [
32]. The spectrum in the Si 2p region was fitted with a single line lying on 103.5 eV binding energy, which indicates the presence of SiO
2 silicon dioxide [
29]. The spectrum in the Ca 2p region was fitted with two doublets (p
3/2–p
1/2 separation is 3.5 eV), with the first main line lying on the binding energy of 345.0 eV, which indicates the presence of calcium carbonate or hydroxide [
33], and the second main line lying on energy of 347.1 eV, which indicates the presence of calcium oxide [
30].
The atomic concentrations of the elements, and the chemical bonds formed by them, were determined based on the fit of the lines on the high-resolution spectra and are summarized in
Table 3.
An XPS analysis showed the presence of basic cement bonding reaction products in both types of samples. There was also a significant increase in the atomic concentration values for the 285 eV binding energy for Sample 2, which confirms the presence of organic carbon from starch derivatives.
3.3. Rheology of Cement Slurries
Rheological measurements were calculated according to the Bingham model, the results of which are shown in
Table 4.
Analysing the differences in the effect of the particular dextrins on the cement slurries enables a probable conclusion: that dextrin d2 demonstrated the highest values of yield stress for both water–cement ratios, namely, w/c = 0.50 and w/c = 0.40. In contrast, the maximum plastic viscosity was found for dextrin d3 at w/c = 0.40. This dextrin showed both the lowest values for yield point and plastic viscosity. At a w/c ratio = 0.50, the lowest values of yield point were for dextrin d3, and the highest values were for dextrin d2.
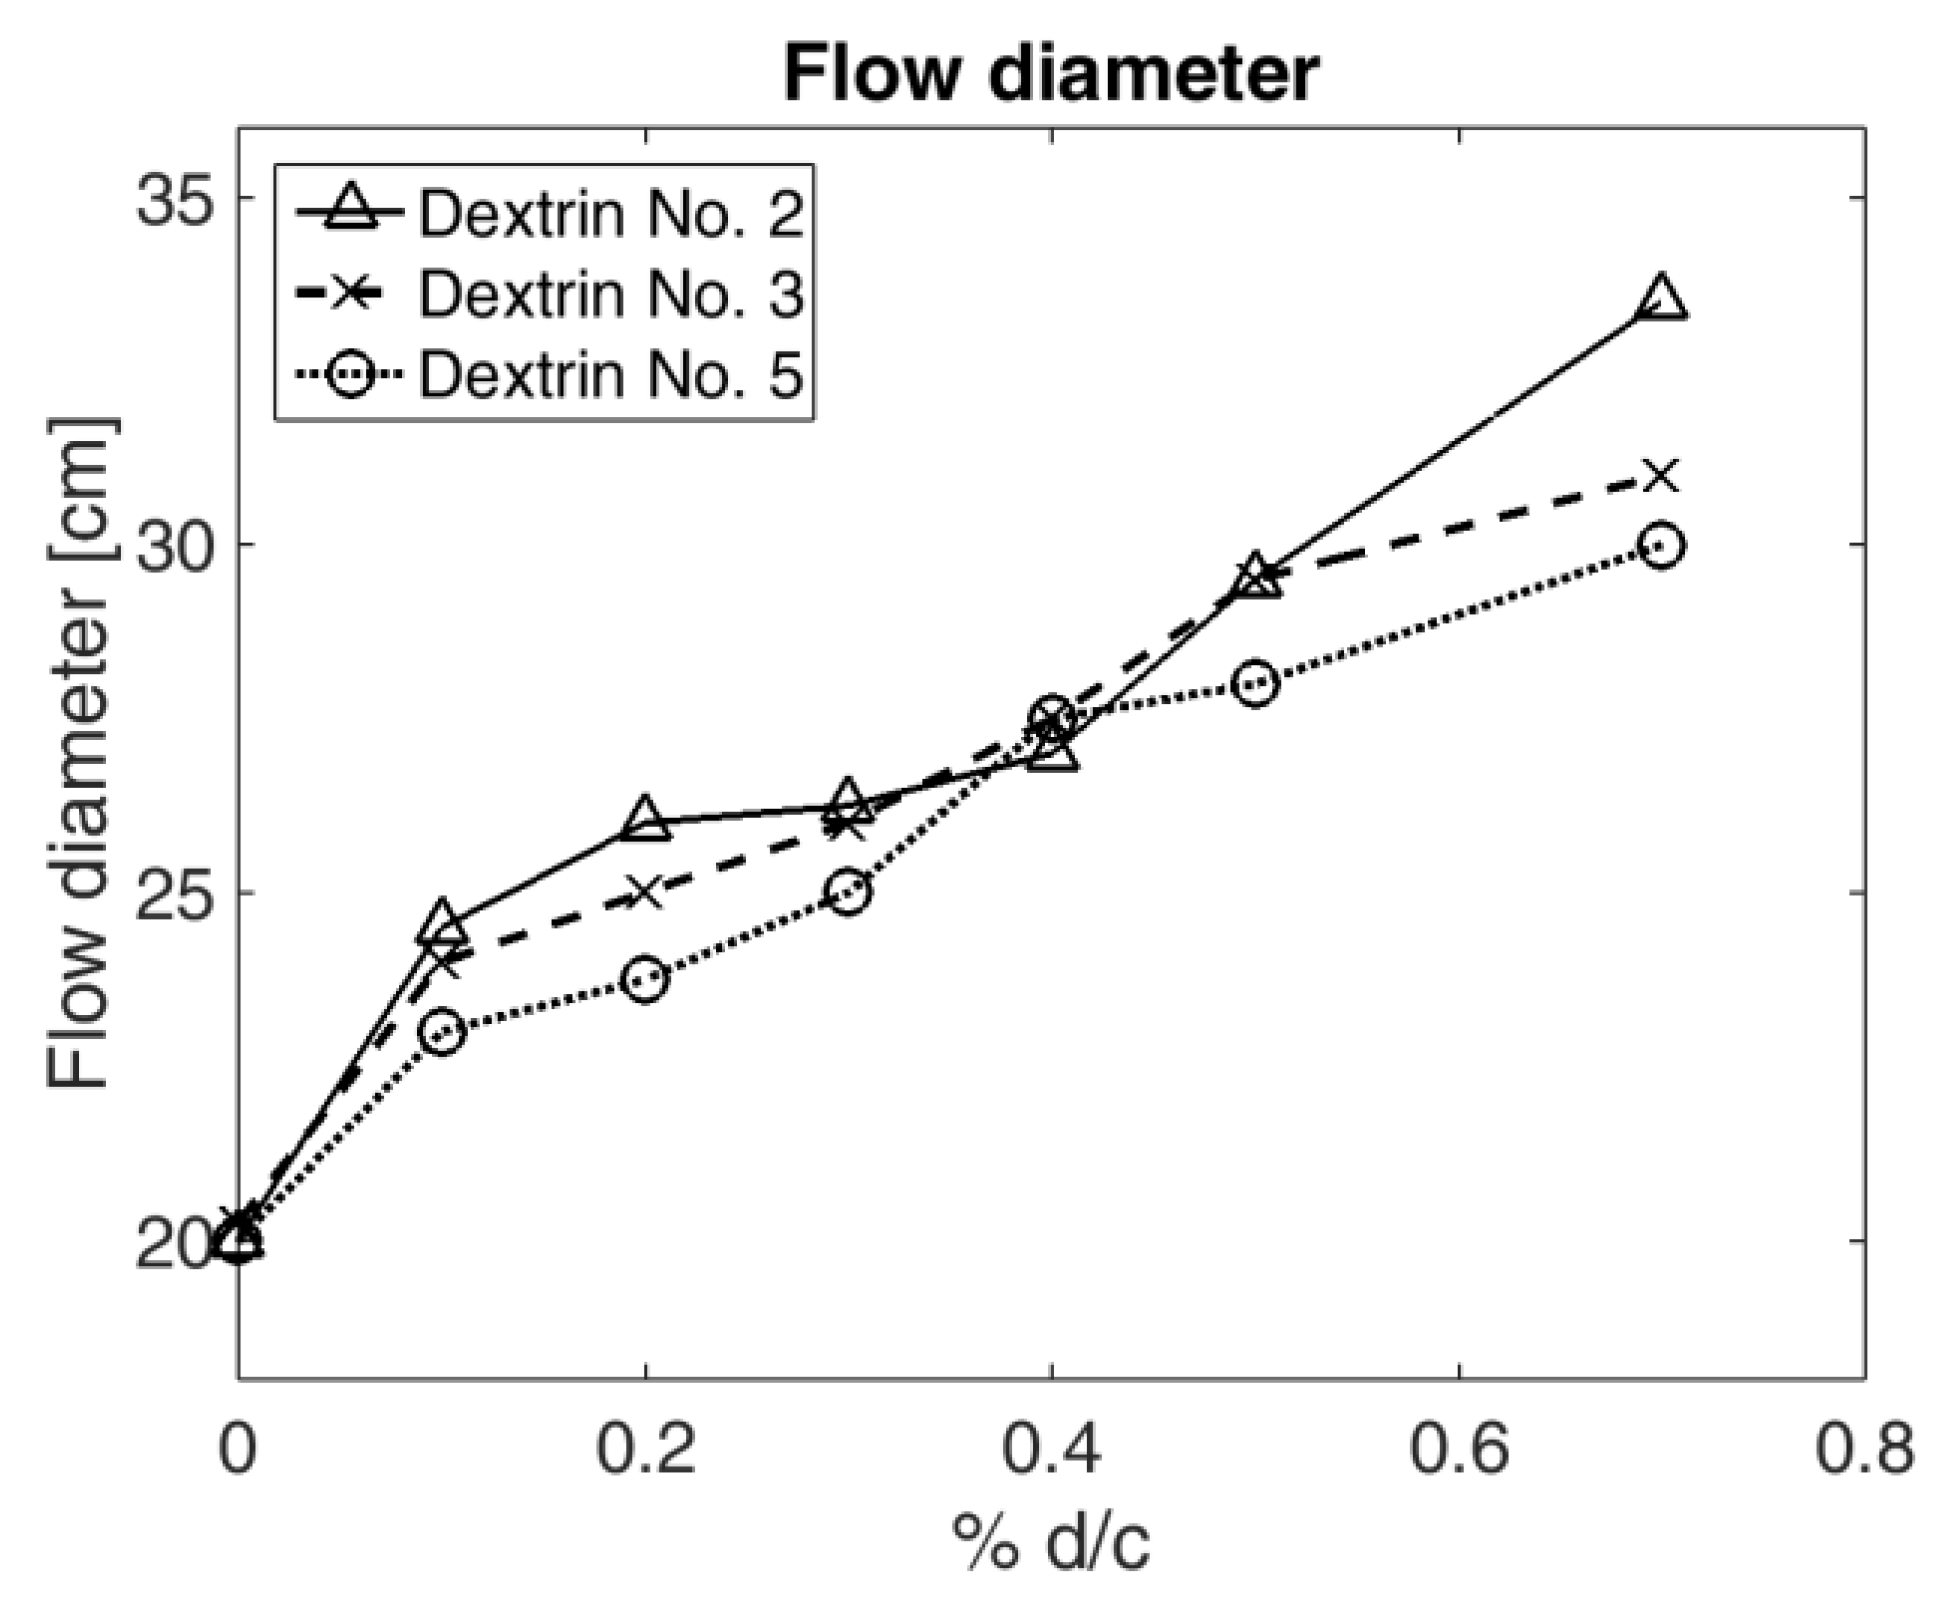
3.4. Cement Mix Flow
Plasticizers may also cause the fluidization of the cement mix. A fluidization analysis allows for the evaluation of material feed workability and the possibility of reducing the mixing water content.
The flow of fresh concrete mix for all types of dextrin in relation to their percentage share of the cement weight (0.0 ÷ 0.7%) is shown in
Figure 6.
The flow of the mix without an admixture was equal to 20 cm (single measurement error was equal to 2 × 10⁻³ m). After the analysis, a probable conclusion could be reached, namely, that after the addition of dextrin, the mortar is fluidized. With the increase of dextrin share, the diameter of the cement mix flow increased as well. With a 0.7% share of dextrin d2, the flow diameter was increased by 67.5%, in comparison to the mix without an admixture. Using the diagram, it can be concluded that if 0.7% of d2 was added to the mix, the value of the flow achieved was 8.06% higher as compared to d3, and more than 11.67% as compared to d5. With a 0.4% share of hydrolysate for all studied dextrins, similar flow values were obtained.
3.5. Microscopic Analysis of Cement Mortars
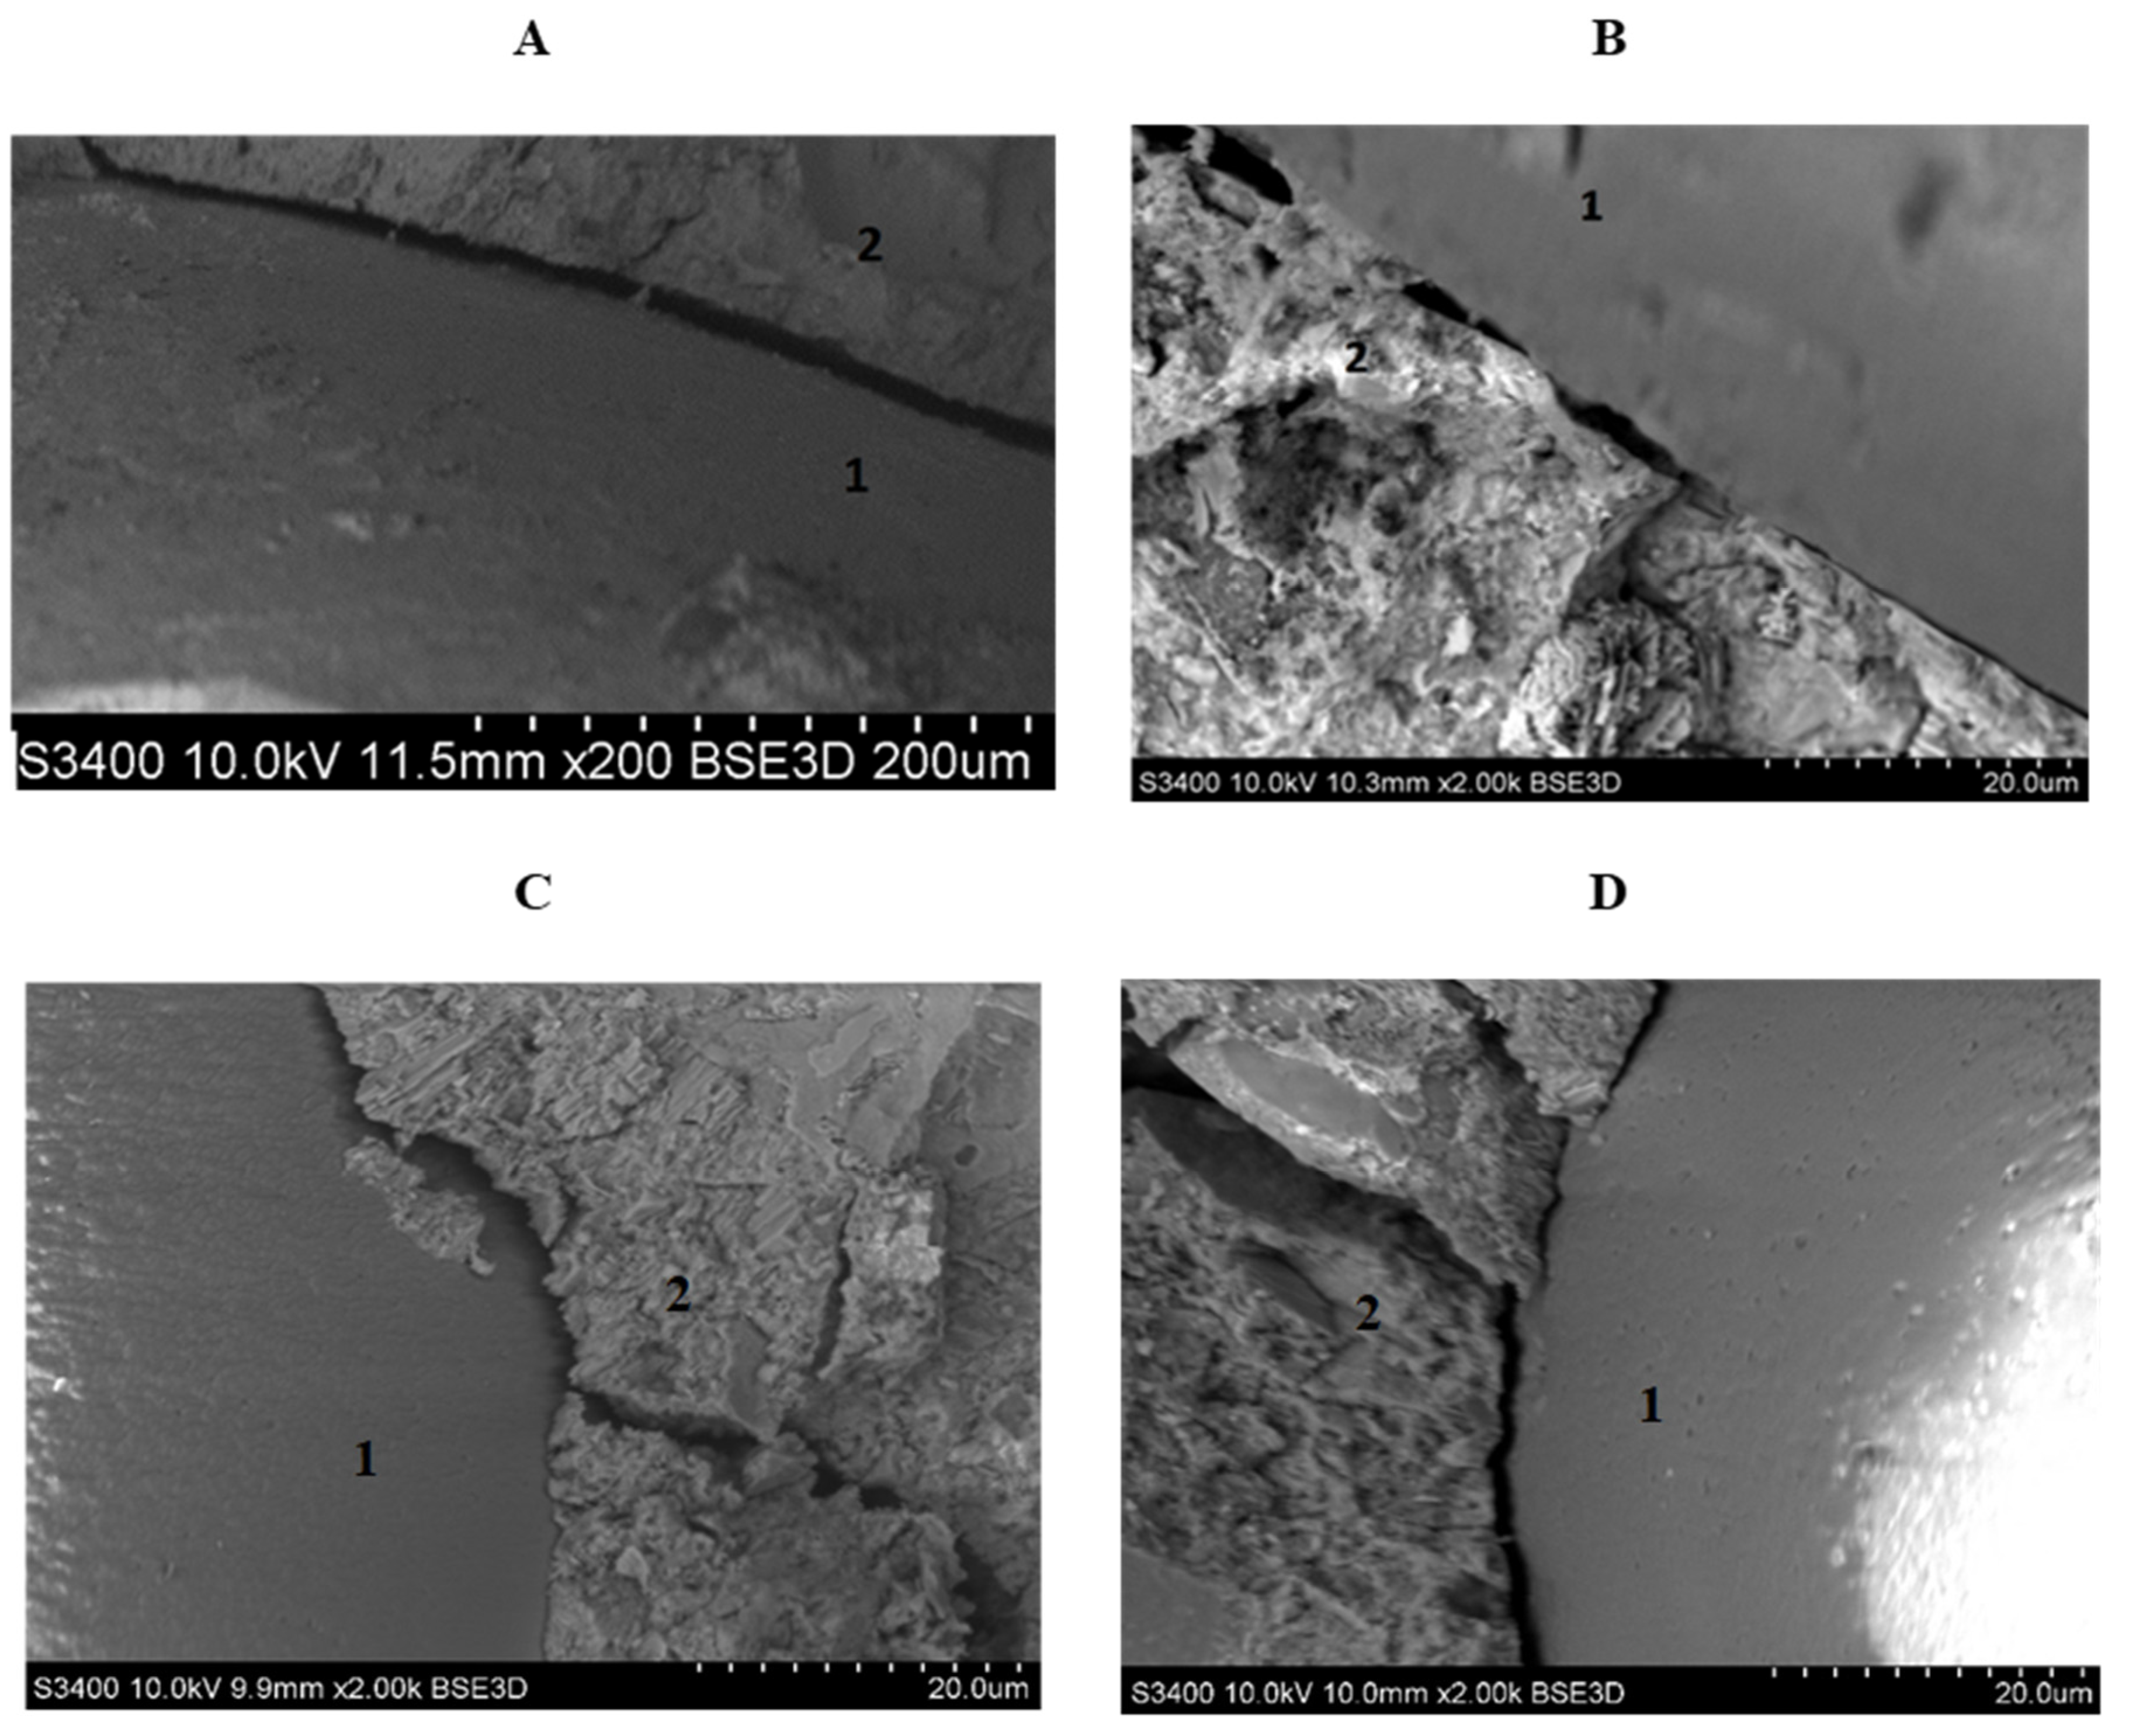
The microscopic analysis of samples presented in
Figure 7 allowed for confirming that, in the case of cement mortar with the addition of d2, the space between the cement slurry and the aggregate was much less than that of cement without the use of admixtures. It is worth noting that the space between the mortar with d2 and the aggregate was visible only by using a magnification of 10-fold greater than that used for the sample without dextrin. It can also be concluded that the slurry with the addition of the starch hydrolysate lagged aggregate granular particles more tightly. A similar correlation was also found for other studied dextrins.
3.6. Strength
3.6.1. Strength of Cement Mortars with the Addition of Dextrins
The next stage of the study examined the effect of dextrins on the compressive strength of cement mortar beams with a variable water–cement ratio (w/c ratio).
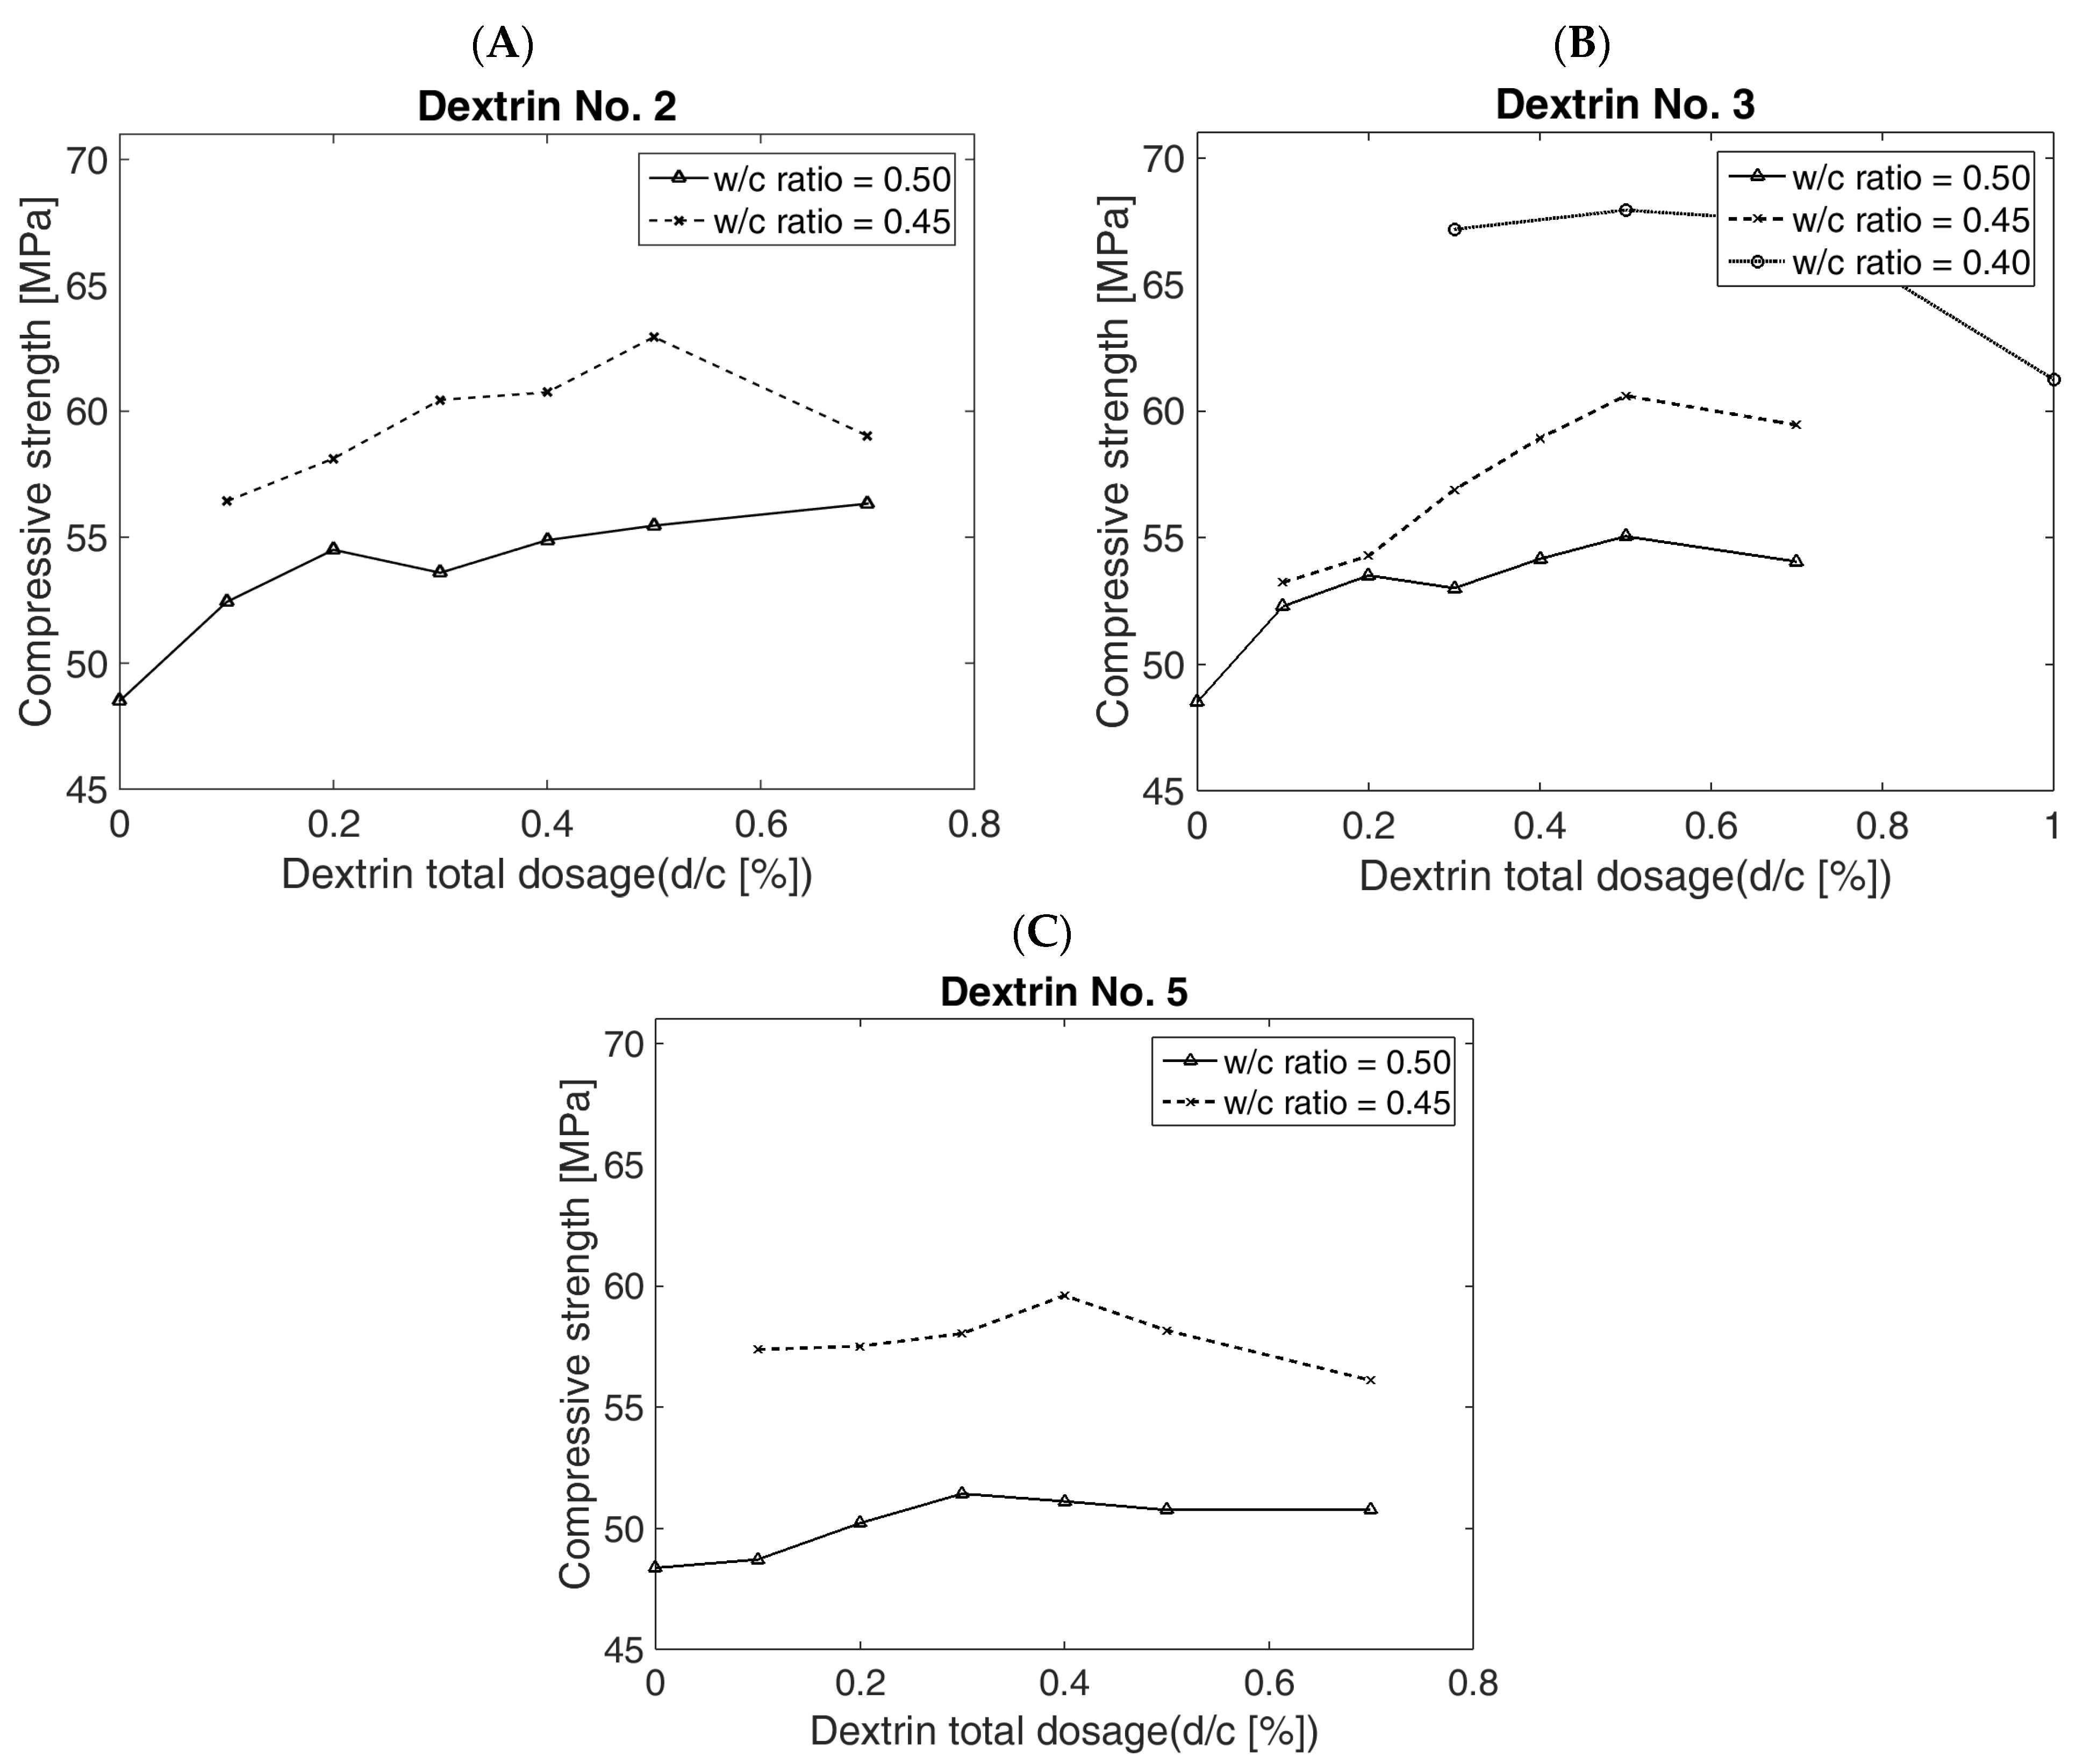
Figure 8A shows the results of the compressive strength of the cement beams with the addition of Dextrin No. 2 in ratios from 0.1 to 0.7% to the cement weight (
d/
c). The tests were carried out for two different
w/
c ratios—of 0.45 and 0.50, respectively. The reference value of the compressive strength of the cement beams, without the addition of dextrin, was 48.5 MPa. The most significant change in strength at
w/
c = 0.5 was obtained for the addition of dextrin at the level of 0.1–0.2%
d/
c, while a further increase in the share of the substance had little effect on the change in the strength value. The increase in the compressive strength of the cement mortar beams with a 0.2% share of d2/
c was 12.37%, and with a 0.7% share of d2/
c was 16.18%.
The decrease in the w/c ratio to a value of 0.45 resulted in a significant increase in the compressive strength of the cement beams. With the increase in the dextrin d2 share, an almost-linear increase in the strength value could be observed.
With a 0.5% share of d2/c, the strength reached its maximum value, which was 29.9% higher than the reference value. A further increase in d/c resulted in a significant decrease in strength.
Figure 8B illustrates the effect of the share increase in dextrin d3 on the compressive strength of the cement beams at
w/
c ratios equal to 0.40, 0.45, and 0.50.
With the w/c ratio = 0.50, it can be observed that there was an almost-linear increase in the strength value for the addition of d3—from 0.1% to 0.2 d/c. With a 0.2% share of d3/c, the strength value was increased by over 10.3%. A further increase in the share of the substance resulted in a smaller increase in the strength value. With a 0.5% share of d3, the maximum compression strength, equal to 55.05 MPa, was recorded, which was 13.5% higher than the reference value. Moreover, for a w/c = 0.45, there was an almost-linear increase in strength, which reached its maximum value at 0.5% share of dextrin d3 added to the cement mortar (the increase in the strength value was approximately 25%).
A further decrease in the w/c ratio, to the value of 0.40 (for 0.5% d3/c), resulted in an increase in the strength value of up to 67.9 MPa, which provided a 40% increase in strength.
For all w/c ratios, a decrease in strength was observed after increasing the proportion of d3 by more than 0.5%. However, the strength values for a 0.7% share of dextrin d3 were still higher in comparison to the reference value.
Figure 8C demonstrates the effect of the increase in the share of dextrin d5 on the strength of the cement beams at
w/
c ratios equal to 0.45 and 0.50.
For a w/c = 0.50, there was a noticeable increase in the compressive strength of the cement beams, which reached its highest value for d/c = 0.3%. The increase in strength was approximately 6% in comparison to the reference value.
A further decrease in the ratio of w/c to the value of 0.45 resulted in a significant increase in strength. Its highest value (for 0.40% d5/c) was 59.6 MPa, which provided an increase by 23% in comparison to the reference sample.
3.6.2. Statistical Analysis of the Results
For cement mortars doped with dextrins d2, d3, and d5, statistical analyses of compressive strength using two-way analysis of variance (ANOVA) were carried out. The analysis included the results obtained for
w/
c = 0.50 and dextrin content in the mixture from 0.0 ÷ 0.7%
d/
c. For the analysis, two main factors were identified. The first one is the type of dextrin used, while the second one is the dextrin content in the cement mix. Research hypotheses are presented in
Table 5.
Prior to the main statistical tests, the variance homogeneity and normality tests were performed. The results show that the basic assumptions about equality of variance and normality of distribution for all analysed cases were met. In the next step, a two-way ANOVA was performed, the results of which are shown in
Table 6.
The obtained results were compared with the assumed significance level p of 0.05. Since all the p-values obtained are less than the assumed significance level, all H0 hypotheses were rejected for alternative hypotheses H1. It can, therefore, be concluded that both the type of dextrin used and its percentage content in the mixture have a significant effect on the resulting compressive strength of the cement mortars. This property is probably due to the steric (long-chain-bound polymeric) and hydrophilic (related to the surface activity of the dextrin) mechanisms of the action of the plasticizers.
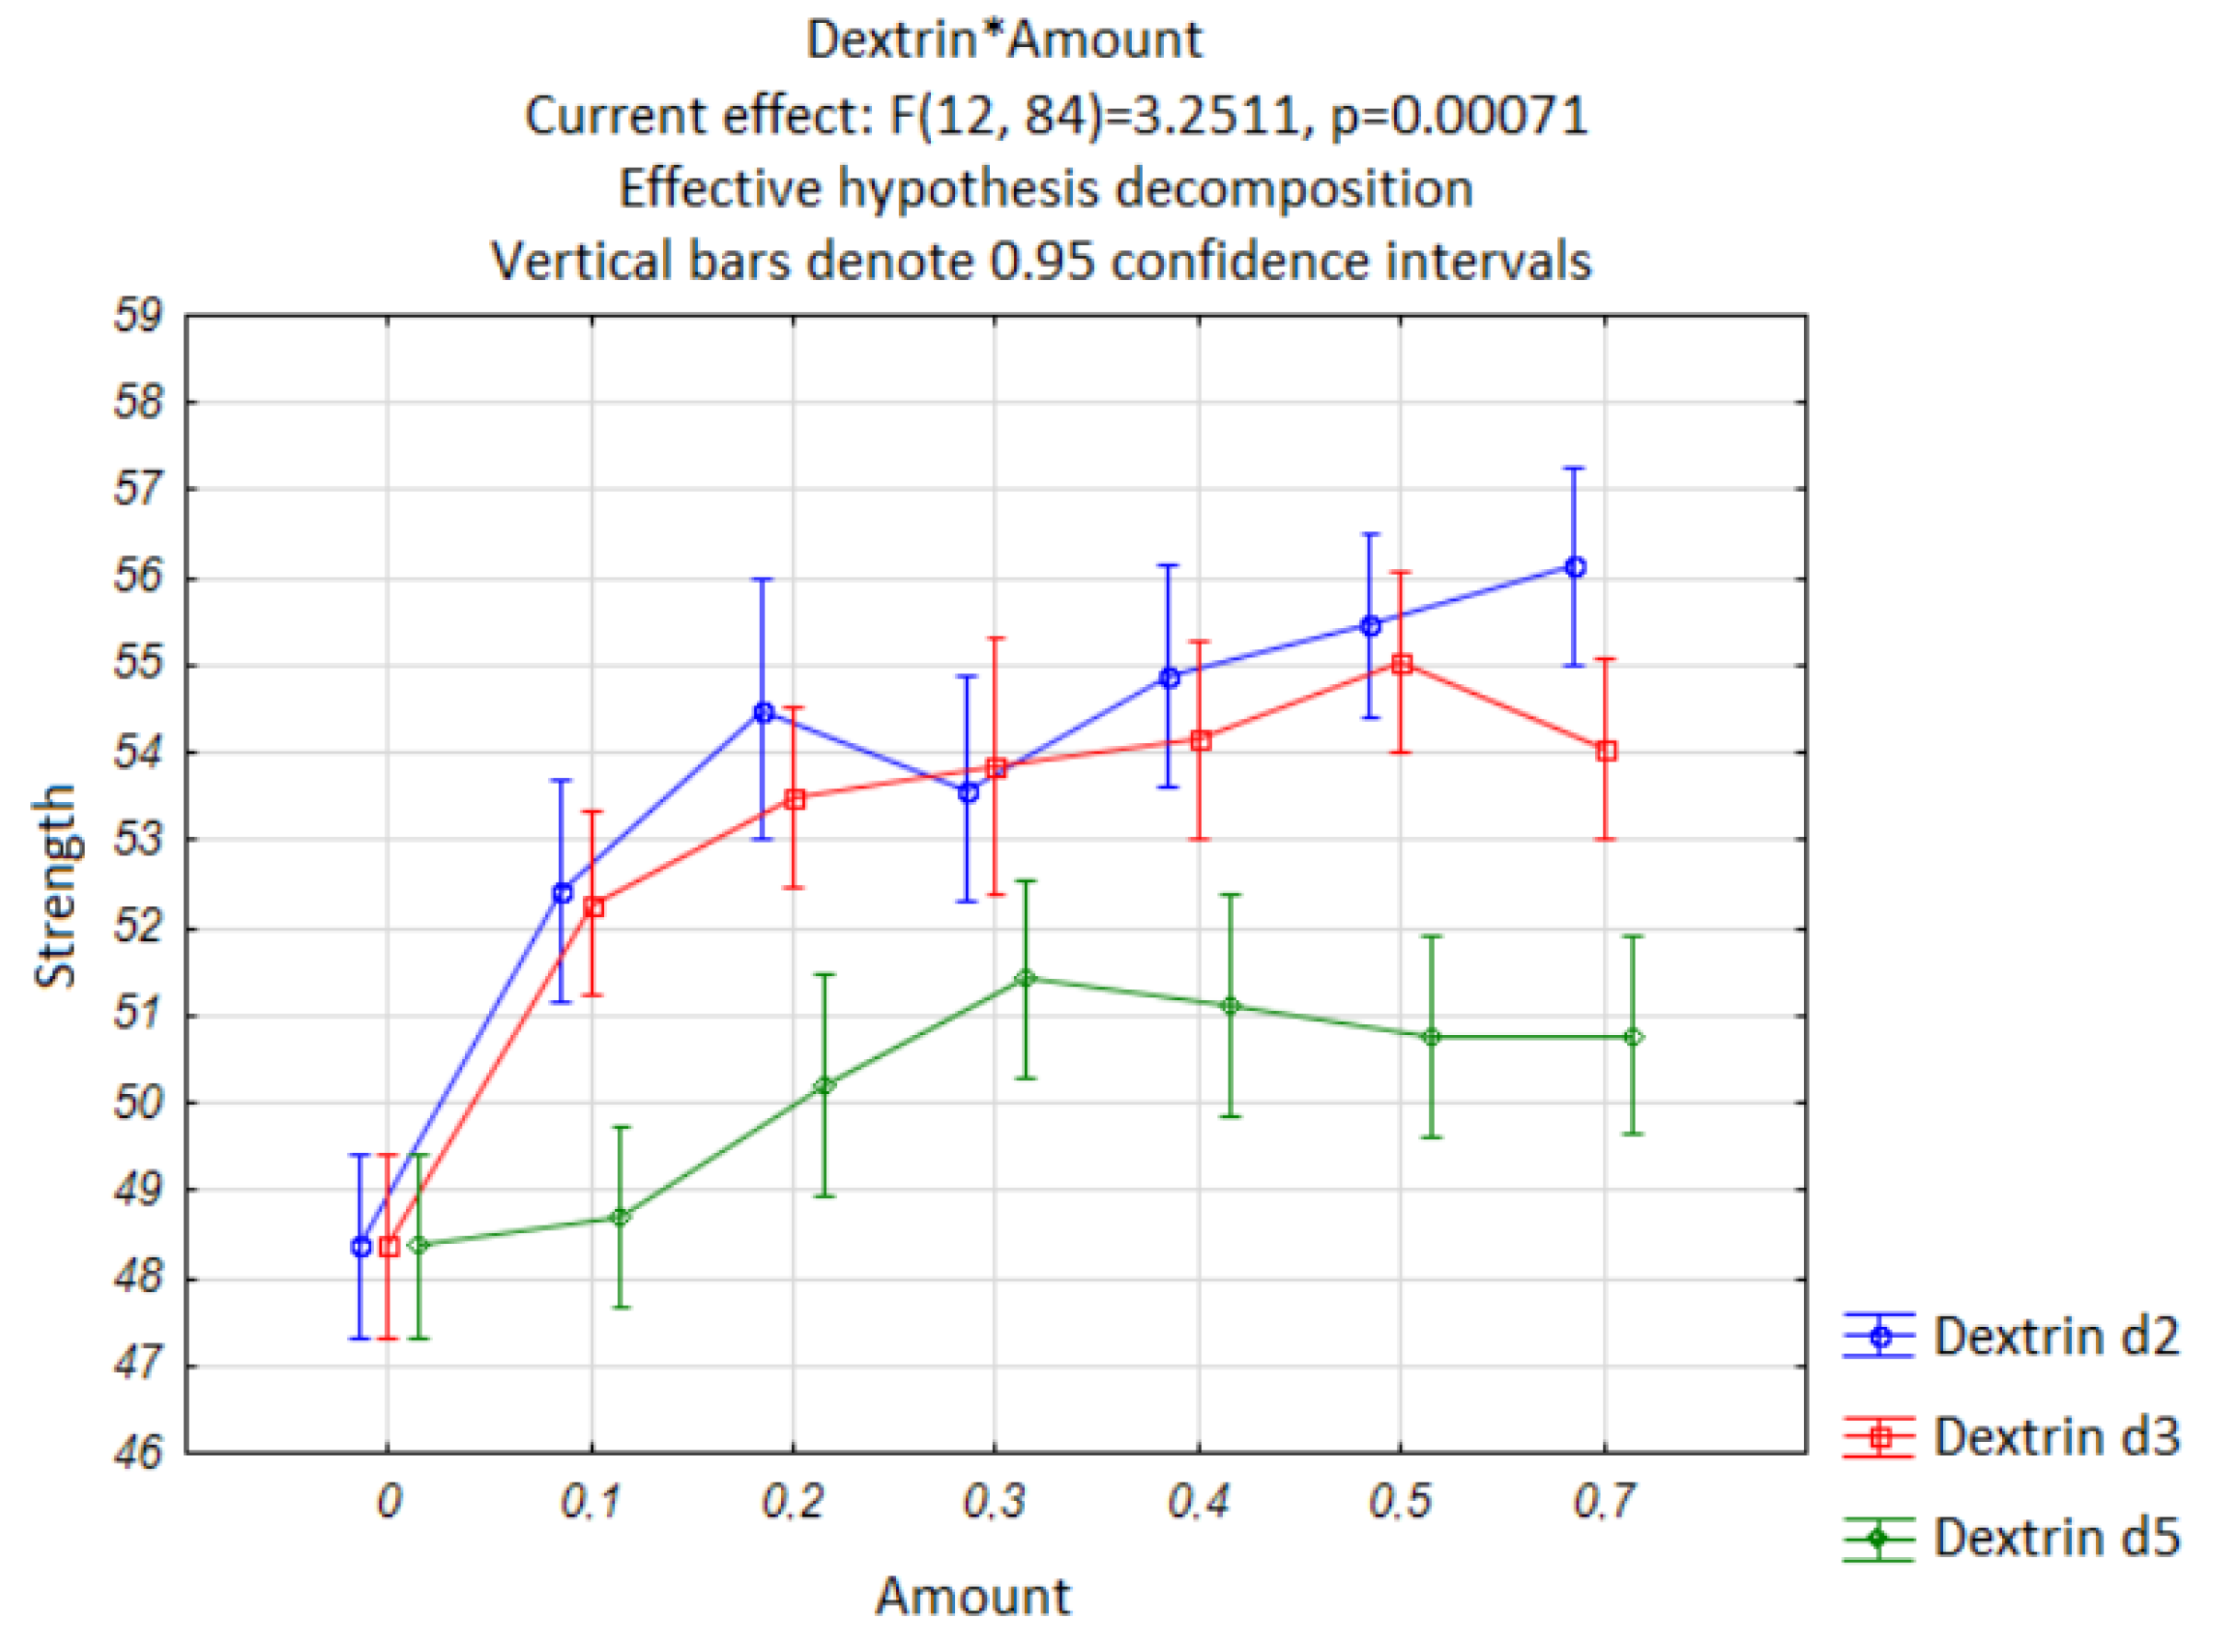
On the basis of the analysis performed, the compressive strengths of the cement beams was graphed and the confidence intervals for the α = 0.05 significance level were also shown (
Figure 9), which underlines the fact that the results, from a statistical point of view, differ significantly.
It can be noted that the first group is composed of the results for the reference samples and for almost all the results obtained for dextrin d5 (excluding results for 0.3% d5/c). This suggests that, in almost all cases, the addition of dextrin d5 does not significantly affect the compressive strength of the cement mortar. A separate group is characterized by the highest mean compressive strength. These include admixtures d2 and d3, with an admixture content of at least 0.2% d/c.
3.7. Choosing the Optimal Amount of Dextrin Admixture
The MAUT (multi-attribute utility theory) method [
34], belonging to the multi-criteria decision-making (MCDM) tools, was used to determine the optimal amount of dextrin admixture. The analysis was performed for the
w/
c ratio = 0.5. Twenty-one alternatives was adopted, i.e., three main alternatives, representing the three types of dextrin d2, d3, d5, and seven levels of impurity percentage, i.e., 0, 0.1, 0.2, 0.3, 0.4, 0.5, and 0.7%, for each type of dextrin. In the analysis, three criteria were used for their selection: strength, flow, and cost of the admixture. The weights for individual criteria were set arbitrarily, with the assumption that the spread of the mixture is of the greatest importance; with 50% weight, strength weights of 30% and 20% were set for the economic criterion. In this case, both the strength’s and the mixture’s spread are stimulants, while the cost criterion is a de-stimulant. For each criterion and each alternative, an evaluation matrix was prepared based on laboratory experience. For the economic criterion, the cost of the admixture was determined by taking the admixture price to be PLN 15 per kilogram.
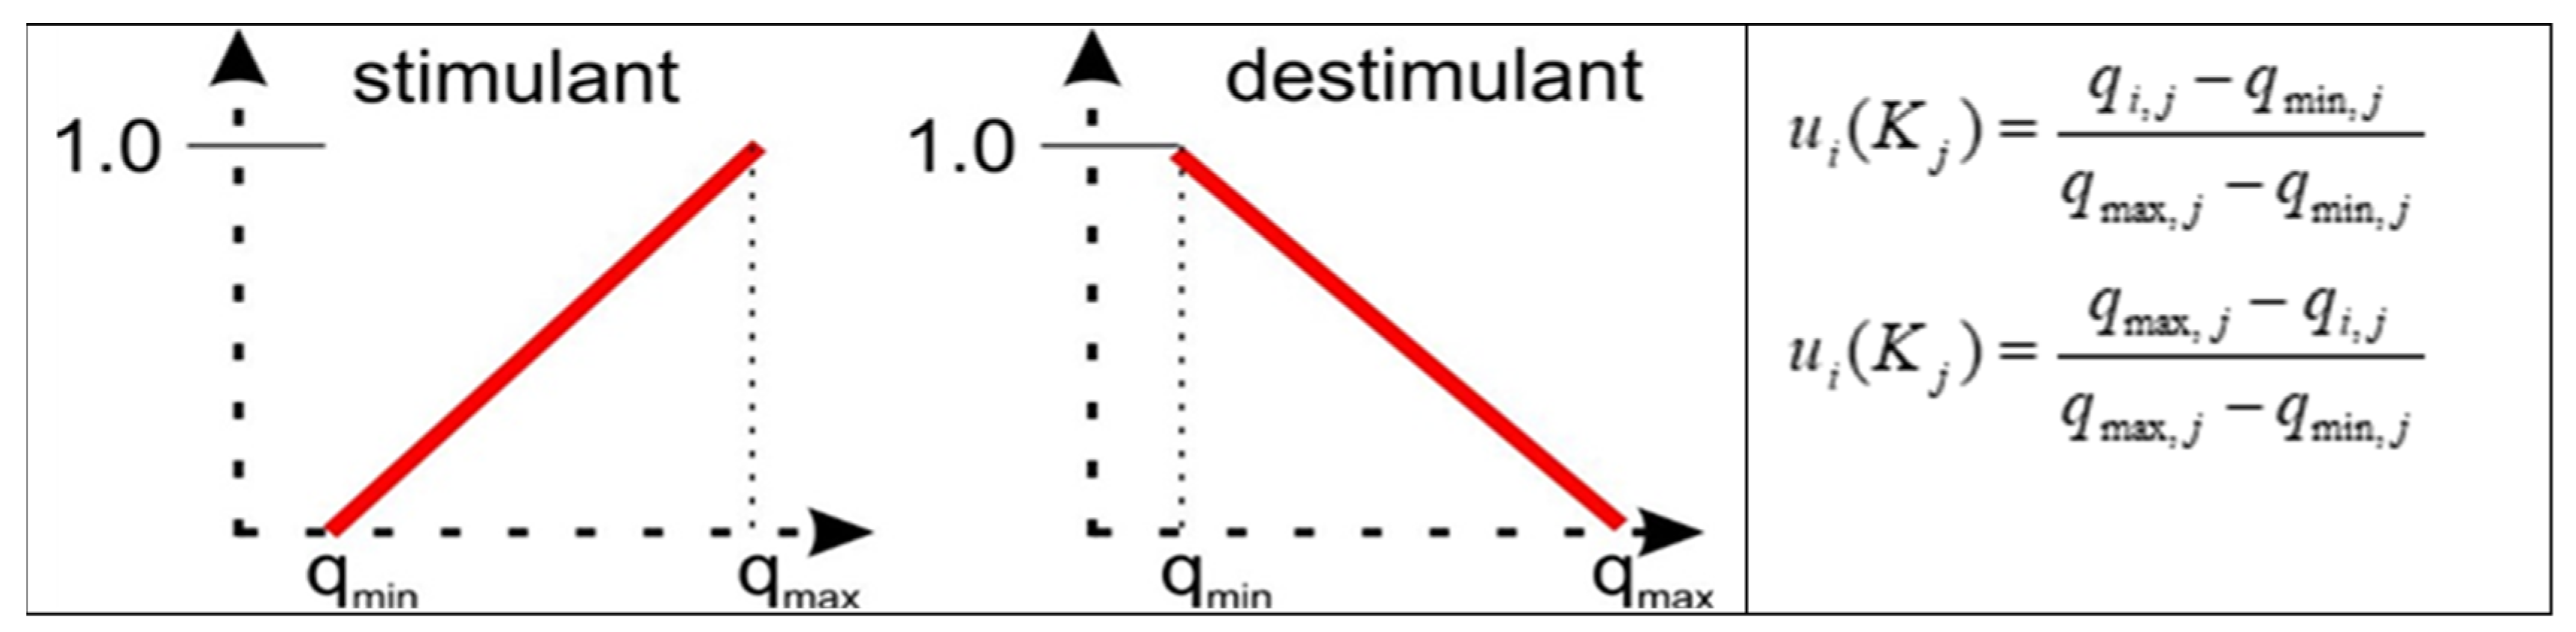
As the values of individual assessments were characterized by large differences in values between the criteria, it was advisable to perform normalization. Each of the obtained assessments was subjected to linear normalization within a given criterion.
For the stimulant, the normalization was carried out in such a way (
Figure 10) that, after normalization, the highest value within a given criterion was equal to one, while the lowest value was equal to zero. The remaining values were linearly interpolated. Conversely, for the distribution function, the normalized value was equal to 1 for both the lowest and the highest values within the criterion.
Then, the normalized scores were multiplied, within the individual criteria, by the weights adopted, and then summed up against individual alternatives. The solution for which the sum for the alternative was the highest was adopted as the optimal solution. The obtained ranking shows that the optimal solution is a d2 alternative with a dextrin content of 0.5%. The obtained ranking of alternatives is summarized in
Table 7 below.
When analysing the obtained ranking, it was also observed that, within the d2 alternative and for all sub-alternatives, their ranking was higher than the corresponding sub-alternatives of the other main alternatives d3 and d5. Thus, it could be stated that the doping of the mortars with dextrin d2 is more advantageous, while the optimal variant is the d2 alternative of 0.5%.
It should also be noted that the sensitivity analysis showed that the economic factor had the least impact on the final ranking. The cost of the supplement will be decisive only when the weight for this criterion is about 50%. Then, the d2 0.2% alternative turns out to be the optimal solution.
By modifying the weights for the strength and flow criteria, the sum of the individual ratings in the ranking changed, as expected, while the order of the individual alternatives remained practically unchanged.
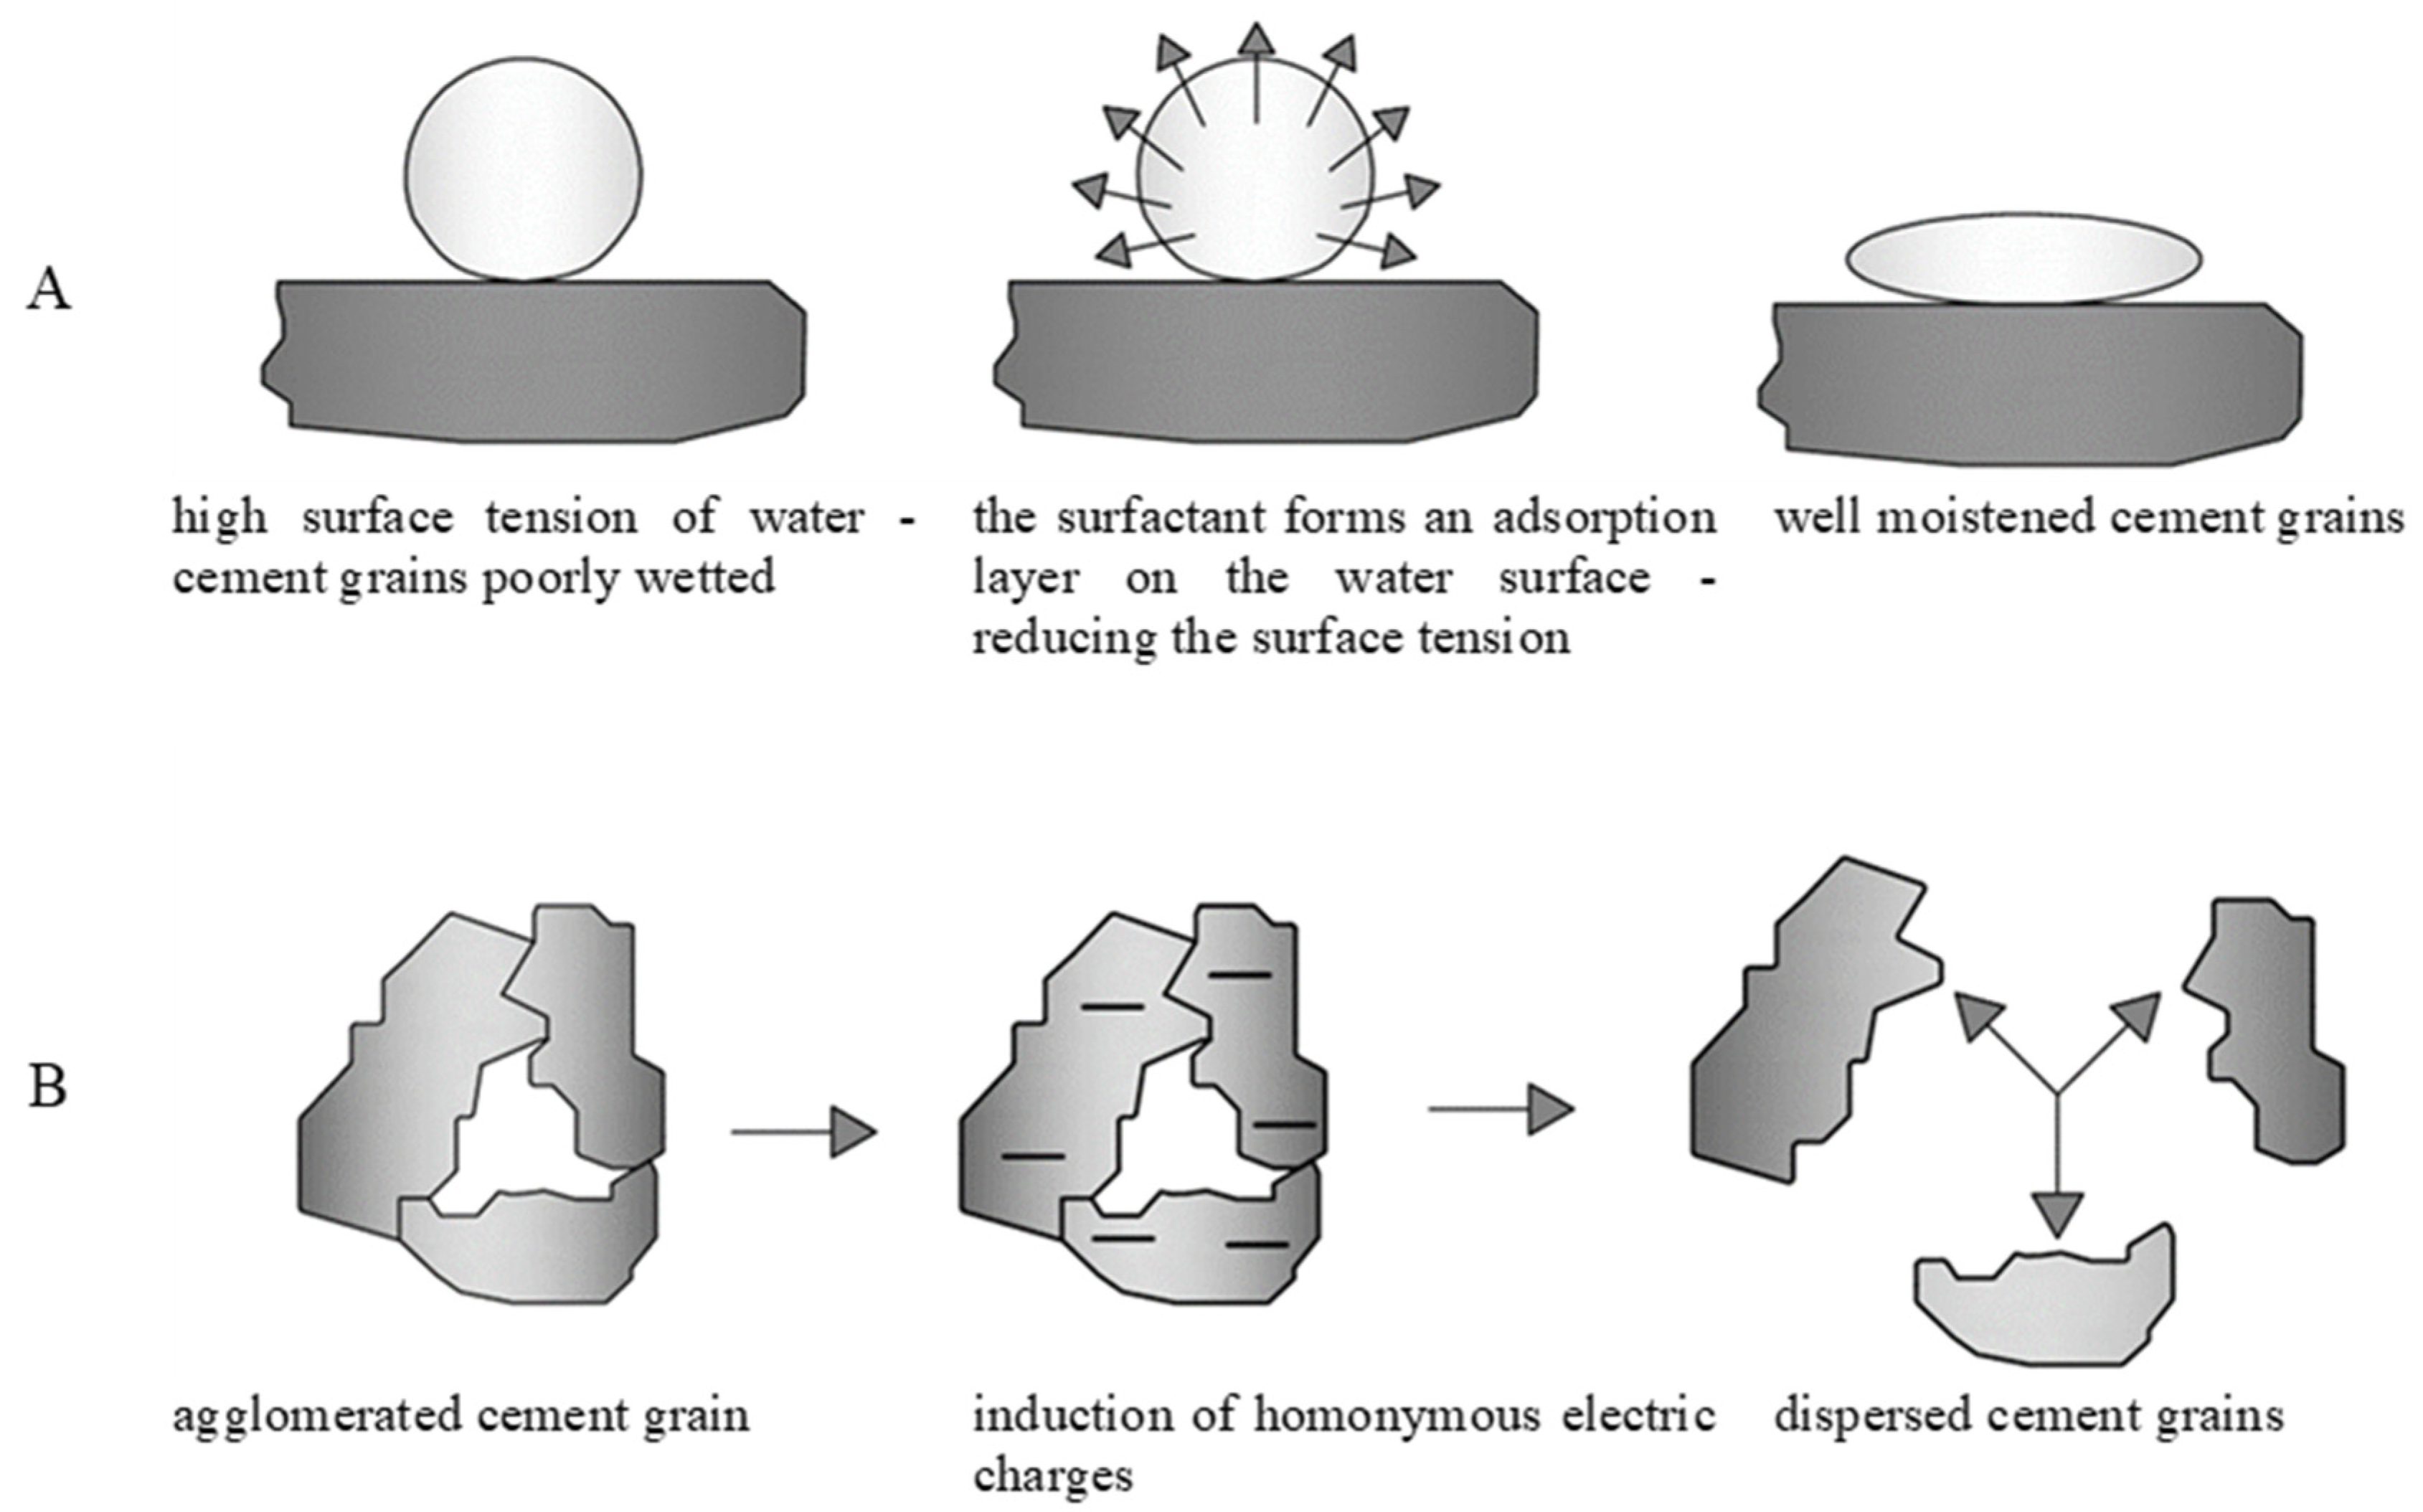
4. Discussion
Taking into consideration the properties and chemical structures of the starch hydrolysates, the authors predicted two mechanisms of interaction of the biopolymer with the cement components as the most probable ones—specifically, the hydrophilic mechanism and the dispersing mechanism. The hydrophilic mechanism (
Figure 11A) is related to the surface activity of the admixtures. Surface activity is the ability of surfactant molecules to aggregate, under adsorption, at the interface of a given system. Surface tension is the physical phenomenon that occurs at the interface between a liquid surface and a gas, another liquid, or a solid. It is defined as the energy per unit area, or as the work required to extend it by that unit. The change in surface tension is a result of the adsorption of substances on a given surface. The reason for the existence of surface tension is related to the forces of attraction between liquid molecules. The surface tension at the interface between two immiscible liquids is also known as interfacial tension.
Surfactants have a variety of abilities to reduce the surface tension of water and wetting that, in turn, lead to different degrees of plasticization of the cement composites. Reducing the water surface tension is related to the dipole structure of surfactant molecules. Such molecules consist mostly of a positively charged hydrophobic part and a negatively charged hydrophilic part. These molecules position themselves at the water–air interface, turning the hydrophilic part towards water and the hydrophobic part towards air. Because of this, an “elastic membrane”—an adsorption surface—is formed on the surface, the tightness of which depends on the surfactant material.
The formation of adsorption layers is a required condition for the reduction of interfacial tensions that leads to an increase in the fluidity of cement composites [
35]. The effectiveness of the liquefaction also depends largely on the structure of the macromolecules—i.e., the length of the polymer chains. For example, in the case of cross-linked biopolymers, a lesser concentration of short-chain particles is conducive to a greater adsorption of the liquid on the surface of the cement grains. Uchikawa [
36] and Kim et al. [
37] found in their studies that the liquefaction of the mixture is higher with less adsorption.
Among the many commercially available admixtures (both plasticizing and liquefying), there are also some that are not surfactants and that exhibit only a dispersing effect, thus increasing the liquefaction of cementitious composites. A schematic of the dispersing mechanism is shown in
Figure 11B. The mechanism of action of such substances is based on the adsorption of admixture molecules on the surface of cement grains and dust particles, resulting in the neutralization of surface charges and the induction of a repulsive force between cement grains. The absorbed negatively charged molecules impart this charge to the entire surface. The formation of an electrical double layer (the so-called Helmholz–Stern layer) and a Zeta electrokinetic potential [
38] at the phase boundary occurs. This leads to the creation of significant repulsive forces, which cause the agglomerates of cement particles to break down into smaller fragments, releasing air and water which, so far, have been closed off.
It is also worth noting that there is a clear difference in the course and nature of adsorption between naphthalene and melamine superplasticizers and surfactants. This is related to the fact that the use of plasticizers causes a significant reduction of the surface tension at the interface, which leads to moderate air entrainment of the concrete mix.
On the other hand, superplasticizers have a reverse effect, which practically does not change the surface tension, but rather significantly reduces the interfacial energy at the solid–liquid interface, as a result of which there is practically no air entrainment in the concrete mix, with the simultaneous intense dispersing effect of these admixtures. On the other hand, by increasing the particle number, the cement accelerates its hydration.
As presented, even a little amount of each studied dextrin increases the fluidization of a cement mix and the compressive strength of mortar. The analysis of the strength and flow tests demonstrated that the highest values of the above parameters were obtained for samples with the addition of dextrin d2; the minimum increase was obtained for cement mortar beams with the addition of dextrin d5. However, when dextrin is added to the slurry, it results in a significant reduction of its yield point τ0, accompanied by a decrease in its plastic viscosity ηpl. The type of dextrin used is a parameter of secondary importance.
The degree of polymerisation of added dextrin is seen as having an effect on the physical parameters of cement mortar: the shorter the polymer chain of the studied dextrin (the lower the DP value; see
Table 1), the more packed the adsorbent layer (
Figure 3C) and the greater the flow diameter of the cement mortar.
5. Conclusions
The study was conducted using white dextrin and yellow dextrin. The dextrins differed in terms of cold water solubility and viscosity parameters, which is due to the difference in the chain length of the various types of hydrolysates. This is directly related to the content of reducing groups and the degree of polymerisation of the starch derivative molecules.
The analysis of strength tests demonstrated that the highest values of compressive strength for both the w/c = 0.50 and w/c = 0.45 ratios were obtained for samples with the addition of dextrin d2. The minimum increase in strength was obtained for cement mortar beams with the addition of dextrin d5.
The addition of dextrin d3 allowed for a decrease in the w/c ratio to the value of 0.40, which resulted in an increase in compressive strength of 40%, compared to the reference value. Thus, the addition of each of the analysed dextrins increases the compressive strength of cement beams; however, in most cases, the use of a higher than 0.5% share value does not provide an optimum result from the viewpoint of strength.
It was found that even a little amount of dextrin increases the fluidization of the cement mix, which results directly from the fact that particles of dextrin include short carbohydrate chains, and possibly from their surface activity at a given range of concentrations.
The conducted research contributes to the development of knowledge about natural, biodegradable plasticizers used in concrete technology. Conducting further research could result in the product being commercially available as a commercial plasticizer.
Author Contributions
Conceptualization, M.S.; Data curation, E.K.; Formal analysis, M.S. and E.K.; Investigation, M.S. and E.K.; Methodology, M.S. and E.K.; Software, M.S. and E.K.; Supervision, K.P.; Validation, K.P.; Writing—original draft, M.S., E.K. and K.P. All authors have read and agreed to the published version of the manuscript.
Funding
The publication was co-financed within the framework of the Ministry of Science and Higher Education programme as “Regional Initiative Excellence” in years 2019–2022, Project No. 005/RID/2018/19.
Institutional Review Board Statement
Not applicable.
Informed Consent Statement
Not applicable.
Data Availability Statement
Not applicable.
Conflicts of Interest
The authors declare no conflict of interest.
References
- Amakye, S.Y.; Abbey, S.J.; Olubanwo, A.O. Consistency and mechanical properties of sustainable concrete blended with brick dust waste cementitious materials. SN Appl. Sci. 2021, 3, 420. [Google Scholar] [CrossRef]
- Wang, L.; Guo, F.; Yang, H.; Wang, Y.; Tang, S. Comparison of Fly Ash, PVA Fiber, MgO and SRA on the Frost Resistance of Face Slab Concrete. Fractals 2021, 29, 2140002. [Google Scholar] [CrossRef]
- Vieira, M.C.; Klemm, D.; Einfeldt, L.; Albrecht, G. Dispersing agents for cement based on modified polysaccharides. Cem. Concr. Res. 2005, 35, 883–890. [Google Scholar] [CrossRef]
- Wolf, C.; Storm, T.; Lange, F.T.; Reemtsma, T.; Brauch, H.J.; Eberle, S.H.; Jekel, M. Analysis of sulfonated naphthalene-formaldehyde condensates by ion-pair chromatography and their quantitative determination from aqueous environmental samples. Anal. Chem. 2000, 72, 5466–5472. [Google Scholar] [CrossRef] [PubMed]
- Ruckstuhl, S.; Suter, M.J.F.; Kohler, H.P.E.; Giger, W. Leaching and primary biodegradation of sulfonated naphthalenes and their formaldehyde condensates from concrete superplasticizers in groundwater affected by tunnel construction. Environ. Sci. Technol. 2002, 36, 3284–3289. [Google Scholar] [CrossRef]
- Awolusi, T.F.; Sojobi, A.O.; Oguntayo, D.O.; Akinkurolere, O.O.; Orogbade, B.O. Effects of calcined clay, sawdust ash and chemical admixtures on Strength and Properties of concrete for pavement and flooring applications using Taguchi approach. Case Stud. Constr. Mater. 2021, 15, e00568. [Google Scholar] [CrossRef]
- Li, Y.; Zhu, H.; Yang, C.; Zhang, Y.; Xu, J.; Lu, M. Synthesis and super retarding performance in cement production of diethanolamine modified lignin surfactant. Constr. Build. Mater. 2014, 52, 116–121. [Google Scholar] [CrossRef]
- Nadif, A.; Hunkeler, D.; Käuper, P. Sulfur-free lignins from alkaline pulping tested in mortar for use as mortar additives. Bioresour. Technol. 2002, 84, 49–55. [Google Scholar] [CrossRef]
- Pourchez, J.; Ruot, B.; Debayle, J.; Pourchez, E.; Grosseau, P. Some aspects of cellulose ethers influence on water transport and porous structure of cement-based materials. Cem. Concr. Res. 2010, 40, 242–252. [Google Scholar] [CrossRef] [Green Version]
- Pourchez, J.; Peschard, A.; Grosseau, P.; Guyonnet, R.; Guilhot, B.; Vallée, F. HPMC and HEMC influence on cement hydration. Cem. Concr. Res. 2006, 36, 288–294. [Google Scholar] [CrossRef] [Green Version]
- Rols, S.; Ambroise, J.; Péra, J. Effects of different viscosity agents on the properties of self-leveling concrete. Cem. Concr. Res. 1999, 29, 261–266. [Google Scholar] [CrossRef]
- Izaguirre, A.; Lanas, J.; Álvarez, J.I. Behaviour of a starch as a viscosity modifier for aerial lime-based mortars. Carbohydr. Polym. 2010, 80, 222–228. [Google Scholar] [CrossRef] [Green Version]
- Leemann, A.; Winnefeld, F. The effect of viscosity modifying agents on mortar and concrete. Cem. Concr. Compos. 2007, 29, 341–349. [Google Scholar] [CrossRef]
- Zhang, D.; Ju, B.; Zhang, S.; He, L.; Yang, J. The study on the dispersing mechanism of starch sulfonate as a water-reducing agent for cement. Carbohydr. Polym. 2007, 70, 363–368. [Google Scholar] [CrossRef]
- El-Rehim, H.A.A.; Hegazy, E.-S.A.; Diaa, D.A. Radiation synthesis of eco-friendly water reducing sulfonated starch/acrylic acid hydrogel designed for cement industry. Radiat. Phys. Chem. 2013, 85, 139–146. [Google Scholar] [CrossRef]
- Zhang, D.; Ju, B.; Zhang, S.; Yang, J. The study on the synthesis and action mechanism of starch succinate half ester as water-reducing agent with super retarding performance. Carbohydr. Polym. 2008, 71, 80–84. [Google Scholar] [CrossRef]
- Lv, S.; Gao, R.; Cao, Q.; Li, D.; Duan, J. Preparation and characterization of poly-carboxymethyl-β-cyclodextrin superplasticizer. Cem. Concr. Res. 2012, 42, 1356–1361. [Google Scholar] [CrossRef]
- Peschard, A.; Govin, A.; Grosseau, P.; Guilhot, B.; Guyonnet, R. Effect of polysaccharides on the hydration of cement paste at early ages. Cem. Concr. Res. 2004, 34, 2153–2158. [Google Scholar] [CrossRef] [Green Version]
- Peschard, A.; Govin, A.; Pourchez, J.; Fredon, E.; Bertrand, L.; Maximilien, S.; Guilhot, B. Effect of polysaccharides on the hydration of cement suspension. J. Eur. Ceram. Soc. 2006, 26, 1439–1445. [Google Scholar] [CrossRef] [Green Version]
- Riddell, W.C.; Kirk, G.B. Cementitious Compositions. U.S. Patent 2,662,024, 8 December 1953. [Google Scholar]
- Kelly, T.M.; Falls, C.; Mielenz, R.C. Hydraulic Cement Mix Containing Saccharide Polymers. U.S. Patent 3,432,317, 11 March 1969. [Google Scholar]
- Terpstra, K.R.; Woortman, A.J.J.; Hopman, J.C.P. Yellow dextrins: Evaluating changes in structure and colour during processing. Starch-Starke 2010, 62, 449–457. [Google Scholar] [CrossRef]
- Konował, E.; Sybis, M.; Modrzejewska-Sikorska, A.; Milczarek, G. Synthesis of dextrin stabilized colloidal silver nanoparticles and their application as modifiers of cement mortar. Int. J. Biol. Macromol. 2017, 104, 165–172. [Google Scholar] [CrossRef] [PubMed]
- Le Thanh-Blicharz, J.; Lewandowicz, G.; Błaszczak, W.; Prochaska, K. Starch modified by high-pressure homogenisation of the pastes—Some structural and physico-chemical aspects. Food Hydrocoll. 2012, 27, 347–354. [Google Scholar] [CrossRef]
- Prochaska, K.; Konował, E.; Sulej-Chojnacka, J.; Lewandowicz, G. Physicochemical properties of cross-linked and acetylated starches and products of their hydrolysis in continuous recycle membrane reactor. Colloid Surf. B-Biointerfaces 2009, 74, 238–243. [Google Scholar] [CrossRef] [PubMed]
- Konował, E.; Lewandowicz, G.; Le Thanh-Blicharz, J.; Prochaska, K. Physicochemical characterisation of enzymatically hydrolysed derivatives of acetylated starch. Carbohydr. Polym. 2012, 87, 1333–1341. [Google Scholar] [CrossRef]
- Tattersall, G.H.; Banfill, P.F.G. The Rheology of Fresh Concrete; Pitman Books Limited: Boston, MA, USA, 1983. [Google Scholar]
- Shirley, D.A. High-resolution X-Ray photoemission spectrum of valence bands of gold. Phys. Rev. B 1972, 5, 4709. [Google Scholar] [CrossRef] [Green Version]
- Beamson, G.; Briggs, D. High Resolution XPS of Organic Polymers: The Scienta ESCA300 Database. J. Chem. Educ. 1993, 70, A25. [Google Scholar]
- Wagner, A.D.; Naumkin, A.V.; Kraut-Vass, A.; Allison, J.W.; Powell, C.J.; Rumble, J.R.J. NIST Standard Reference Database. Available online: http:/srdata.nist.gov/xps/ (accessed on 1 April 2022).
- Briggs, D. Surface Analysis of Polymers by XPS and Static SIMS; Cambridge University Press: New York, NY, USA, 2005. [Google Scholar]
- Chang, S.L.; Anderegg, J.W.; Thiel, P.A. Surface oxidation of an AlPdMn quasicrystal, characterized by X-ray photoelectron spectroscopy. J. Non-Cryst. Solids 1996, 195, 95–101. [Google Scholar] [CrossRef]
- Landis, W.J.; Martin, J.R. X-ray photoelectron spectroscopy applied to gold-decorated mineral standards of biological interest. J. Vac. Sci. Technol. 1984, 2, 1108–1111. [Google Scholar] [CrossRef]
- Wallenius, J.; Dyer, J.S.; Fishburn, P.C.; Steuer, R.E.; Zionts, S.; Deb, K. Multiple criteria decision making, multiattribute utility theory: Recent accomplishments and what lies ahead. Manag. Sci. 2008, 54, 1336–1349. [Google Scholar] [CrossRef] [Green Version]
- Neville, A.M. Properties of Concrete, 5th ed.; Prentice Hall: Hoboken, NJ, USA, 2012. [Google Scholar]
- Uchikawa, H.; Sawaki, D.; Hanehara, S. Influence of kind and added timing of organic admixture on the composition, structure and property of fresh cement pastes. Cem. Concr. Res. 1995, 25, 353–364. [Google Scholar] [CrossRef]
- Kim, B.-G.; Jiang, S.; Jolicoeur, C.; Aitcin, P.-C. The adsorption behavior of PNS superplasticizer and its relation to fluidity of cement paste. Cem. Concr. Res. 2000, 30, 887–893. [Google Scholar] [CrossRef]
- Stern, O.Z. Theory of the Electrical Double Layer; Electrochem: Raynham, MA, USA, 1924; Volume 30, p. 508. (In Germany) [Google Scholar]
Figure 1.
Characteristics of Portland cement: (A) elemental analysis, (B) SEM image (×1000) with dimensions of individual grains.
Figure 1.
Characteristics of Portland cement: (A) elemental analysis, (B) SEM image (×1000) with dimensions of individual grains.
Figure 2.
Pictures of the most-important equipment used in the study: (A) Sigma 701 tensiometer (KSV); (B) automatic press for testing concrete compressive strength (DIGICON 2000, Walter + Bai AG); (C) general view of the stand for sample analysis using SEM and EDS methods.
Figure 2.
Pictures of the most-important equipment used in the study: (A) Sigma 701 tensiometer (KSV); (B) automatic press for testing concrete compressive strength (DIGICON 2000, Walter + Bai AG); (C) general view of the stand for sample analysis using SEM and EDS methods.
Figure 3.
(A) The surface tension, (B) the excess surface, and (C) the adsorption parameters for the aqueous solutions of dextrins in the air/water system.
Figure 3.
(A) The surface tension, (B) the excess surface, and (C) the adsorption parameters for the aqueous solutions of dextrins in the air/water system.
Figure 4.
High-resolution XPS spectra of Sample 1 (without addition of dextrin) in the areas C 1s/K 2p (A), O 1s (B), Al 2p (C), Si 2p (D), and Ca 2p (E).
Figure 4.
High-resolution XPS spectra of Sample 1 (without addition of dextrin) in the areas C 1s/K 2p (A), O 1s (B), Al 2p (C), Si 2p (D), and Ca 2p (E).
Figure 5.
High-resolution XPS spectra of Sample 2 (with addition of d3) in the areas C 1s/K 2p (A), O 1s (B), Al 2p (C), Si 2p (D), and Ca 2p (E).
Figure 5.
High-resolution XPS spectra of Sample 2 (with addition of d3) in the areas C 1s/K 2p (A), O 1s (B), Al 2p (C), Si 2p (D), and Ca 2p (E).
Figure 6.
Cement mix flow.
Figure 6.
Cement mix flow.
Figure 7.
SEM image of cement mortar after 28 days. 1—aggregate, 2—cement slurry: (A) without bio-admixtures (200× magnification), (B) with the addition of d2 (magnification 2000×), (C) with the addition of d3 (magnification 2000×), and (D) with the addition of d5 (magnification 2000×).
Figure 7.
SEM image of cement mortar after 28 days. 1—aggregate, 2—cement slurry: (A) without bio-admixtures (200× magnification), (B) with the addition of d2 (magnification 2000×), (C) with the addition of d3 (magnification 2000×), and (D) with the addition of d5 (magnification 2000×).
Figure 8.
Compressive strength of cement mortars with the addition of: (A) Dextrin No. 2, (B) Dextrin No. 3, and (C) Dextrin No. 5.
Figure 8.
Compressive strength of cement mortars with the addition of: (A) Dextrin No. 2, (B) Dextrin No. 3, and (C) Dextrin No. 5.
Figure 9.
Confidence interval analysis.
Figure 9.
Confidence interval analysis.
Figure 10.
Normalization of stimulants and destimulants.
Figure 10.
Normalization of stimulants and destimulants.
Figure 11.
Diagrams of operation of (A) the hydrophilic mechanism and (B) the dispersant mechanism.
Figure 11.
Diagrams of operation of (A) the hydrophilic mechanism and (B) the dispersant mechanism.
Table 1.
Dextrin—the table of parameters.
Table 1.
Dextrin—the table of parameters.
| Dextrin | d2 | d3 | d5 |
|---|
| Type | white | yellow | yellow |
| Moisture (%) | 9.3 | 8.6 | 10.2 |
| DP | 23 | 35 | 47 |
| pH value of 1% solution | 3.5 | 3.5 | 3.5 |
| Solubility at 20 °C, (%) | <65 | >95 | >95 |
| Viscosity, 40% at 20 °C, 100 rpm (Pa·s) | 0.19 | 0.04 | 0.07 |
Table 2.
Amount of water, cement, and aggregate used, depending on the w/c ratio.
Table 2.
Amount of water, cement, and aggregate used, depending on the w/c ratio.
| w/c | Water (g) | Cement (g) | Aggregate (g) | Sum (g) |
|---|
| 0.40 | 180.0 | 450.0 | 1350.0 | Σ = 1980.0 |
| 0.45 | 202.5 | 450.0 | 1350.0 | Σ = 2002.5 |
| 0.50 | 225.0 | 450.0 | 1350.0 | Σ = 2025.0 |
Table 3.
Summary list of atomic concentrations (at%) of elements with breakdown into matched chemical environments.
Table 3.
Summary list of atomic concentrations (at%) of elements with breakdown into matched chemical environments.
| | C | O | Al | Si | K | Ca |
|---|
| Binding energy (eV) | 285.0 | 289.3 | 530.2 | 532.9 | 74.1 | 103.5 | 292.7 | 345.0 | 347.1 |
| Chemical environment | C-C; C-O | CO32− | CO32−; Al2O3; KOH; K2O | SiO2; CaO; K2O | Al2O3 | SiO2 | KOH | CaCO3; Ca(OH)2 | CaO |
| Sample 1 | 1.8 | 1.1 | 22.8 | 41.3 | 3.1 | 19.6 | 0.4 | 4.2 | 5.7 |
| Sample 2 | 7.5 | 1.8 | 15.2 | 47.3 | 1.8 | 10.9 | 1.1 | 4.3 | 10.2 |
Table 4.
The effect of w/c ratio and the type of starch hydrolysate on the rheological parameters of the cement slurries.
Table 4.
The effect of w/c ratio and the type of starch hydrolysate on the rheological parameters of the cement slurries.
| Dextrin | w/c Ratio | Bingham Model |
|---|
| τ0 (Pa) | ηpl (Pa∙s) |
|---|
| CEM I | 0.40 | 21.134 | 0.181 |
| d2 | 0.40 | 5.779 | 0.142 |
| d3 | 0.40 | 4.932 | 0.152 |
| d5 | 0.40 | 3.307 | 0.099 |
| CEM I | 0.50 | 11.64 | 0.127 |
| d2 | 0.50 | 2.721 | 0.048 |
| d3 | 0.50 | 1.464 | 0.048 |
| d5 | 0.50 | 1.481 | 0.043 |
Table 5.
Research hypotheses for mortar beams doped with dextrins d2, d3, and d5.
Table 5.
Research hypotheses for mortar beams doped with dextrins d2, d3, and d5.
| Factor | Hypotheses |
|---|
| 1. Dextrin type | H0: the type of dextrin has no significant effect on the compressive strength of the mortar beams |
| H1: the type of dextrin has a significant effect on the compressive strength of the mortar beams |
| 2. Dextrin dosage | H0: the amount of dextrin used has no significant effect on the compressive strength of the mortar beams |
| H1: the amount of dextrin used has a significant effect on the compressive strength of the mortar beams |
| 3. Interplay of factors 1 and 2 | H0: the interaction of factors 1 and 2 has no significant effect on the compressive strength of mortar beams |
| H1: the interaction of factors 1 and 2 has a significant effect on the compressive strength of the mortar beams |
Table 6.
Results of two-way ANOVA for the compressive strength of mortar beams doped with d2, d3, and d5.
Table 6.
Results of two-way ANOVA for the compressive strength of mortar beams doped with d2, d3, and d5.
| Effect | One-Dimensional Significance Tests for Strength
Sigma-Restricted Parameterization
Effective Hypothesis Decomposition |
|---|
| SS | Degrees | MS | F | p-Value |
|---|
| Intercept | 272,908.7 | 1 | 272,908.7 | 166,422.5 | 0.000000 |
| Dextrin | 224.2 | 2 | 112.1 | 68.4 | 0.000000 |
| Amount | 384.2 | 6 | 64.0 | 39.0 | 0.000000 |
| Dextrin*Amount | 64.0 | 12 | 5.3 | 3.3 | 0.000708 |
| Error | 137.7 | 84 | 1.6 | | |
Table 7.
Ranking of alternatives for w/c = 0.5.
Table 7.
Ranking of alternatives for w/c = 0.5.
| d2 |
| 0 | 0.1 | 0.2 | 0.3 | 0.4 | 0.5 | 0.7 |
| 3.642599 | 5.404973 | 6.00178 | 5.646262 | 6.775185 | 8.183513 | 7.02764 |
| d3 |
| 0 | 0.1 | 0.2 | 0.3 | 0,4 | 0,5 | 0.7 |
| 1.986872 | 4.245684 | 4.70112 | 5.004143 | 5.761199 | 6.0017 | 5.789406 |
| d5 |
| 0 | 0.1 | 0.2 | 0.3 | 0.4 | 0.5 | 0.7 |
| 2.241763 | 3.27338 | 3.929187 | 4.528354 | 5.071001 | 4.78424 | 4.98566 |
| Publisher’s Note: MDPI stays neutral with regard to jurisdictional claims in published maps and institutional affiliations. |
© 2022 by the authors. Licensee MDPI, Basel, Switzerland. This article is an open access article distributed under the terms and conditions of the Creative Commons Attribution (CC BY) license (https://creativecommons.org/licenses/by/4.0/).


