
Motor Stator Insulation Stress Due to Multilevel Inverter Voltage Output Levels and Power Quality †


Abstract
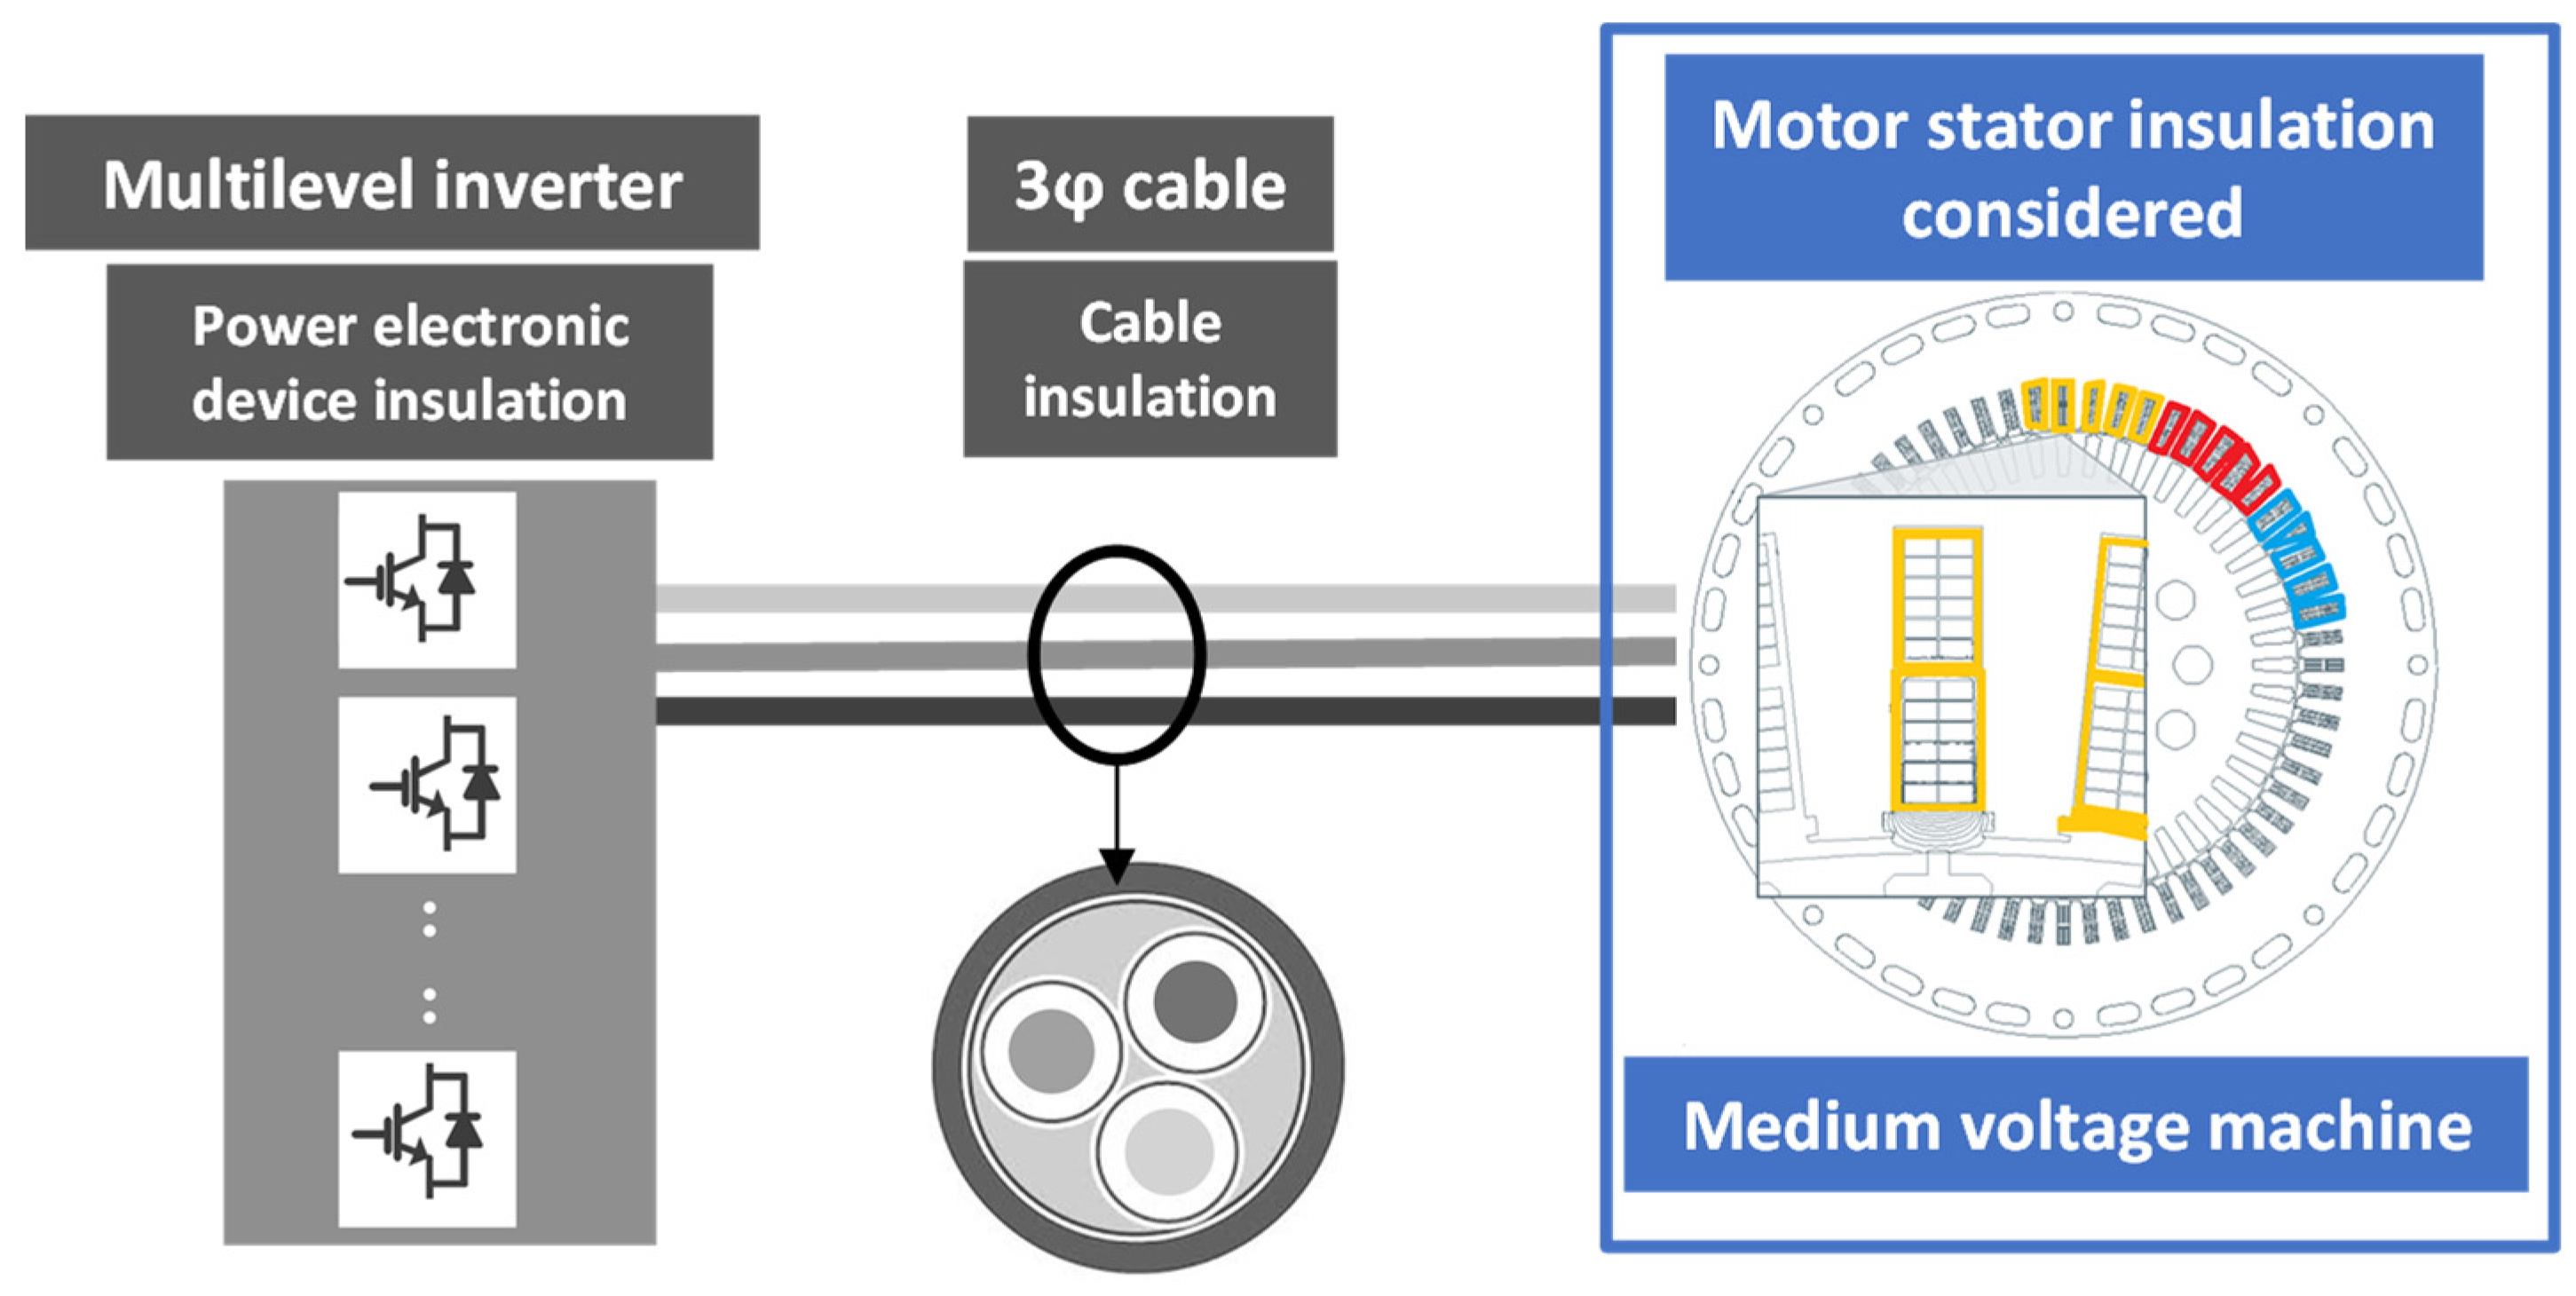
:1. Introduction
2. Insulation Stress
2.1. Dielectric Stress
2.2. Leakage Currents
2.3. Total Harmonic Distortion (THD)
3. Simulations
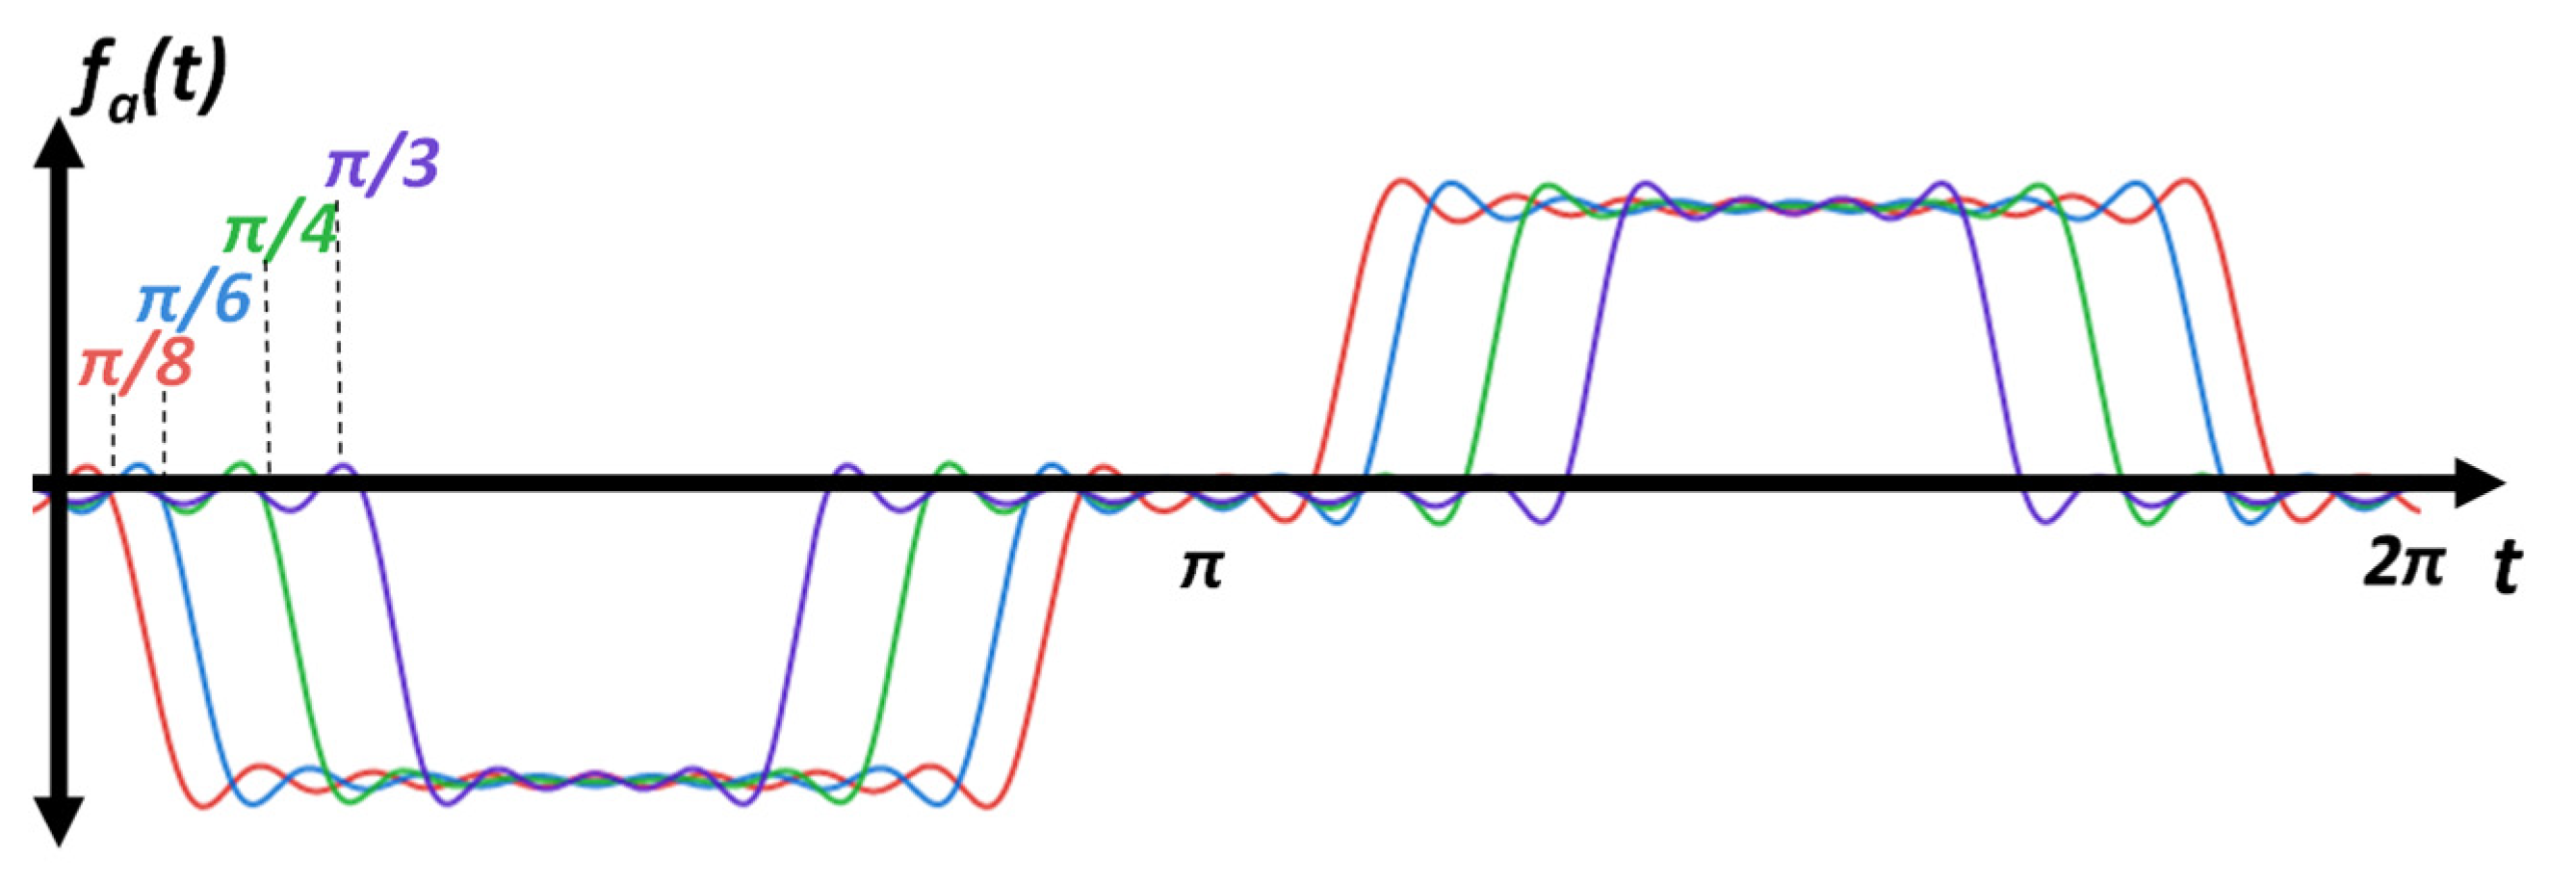
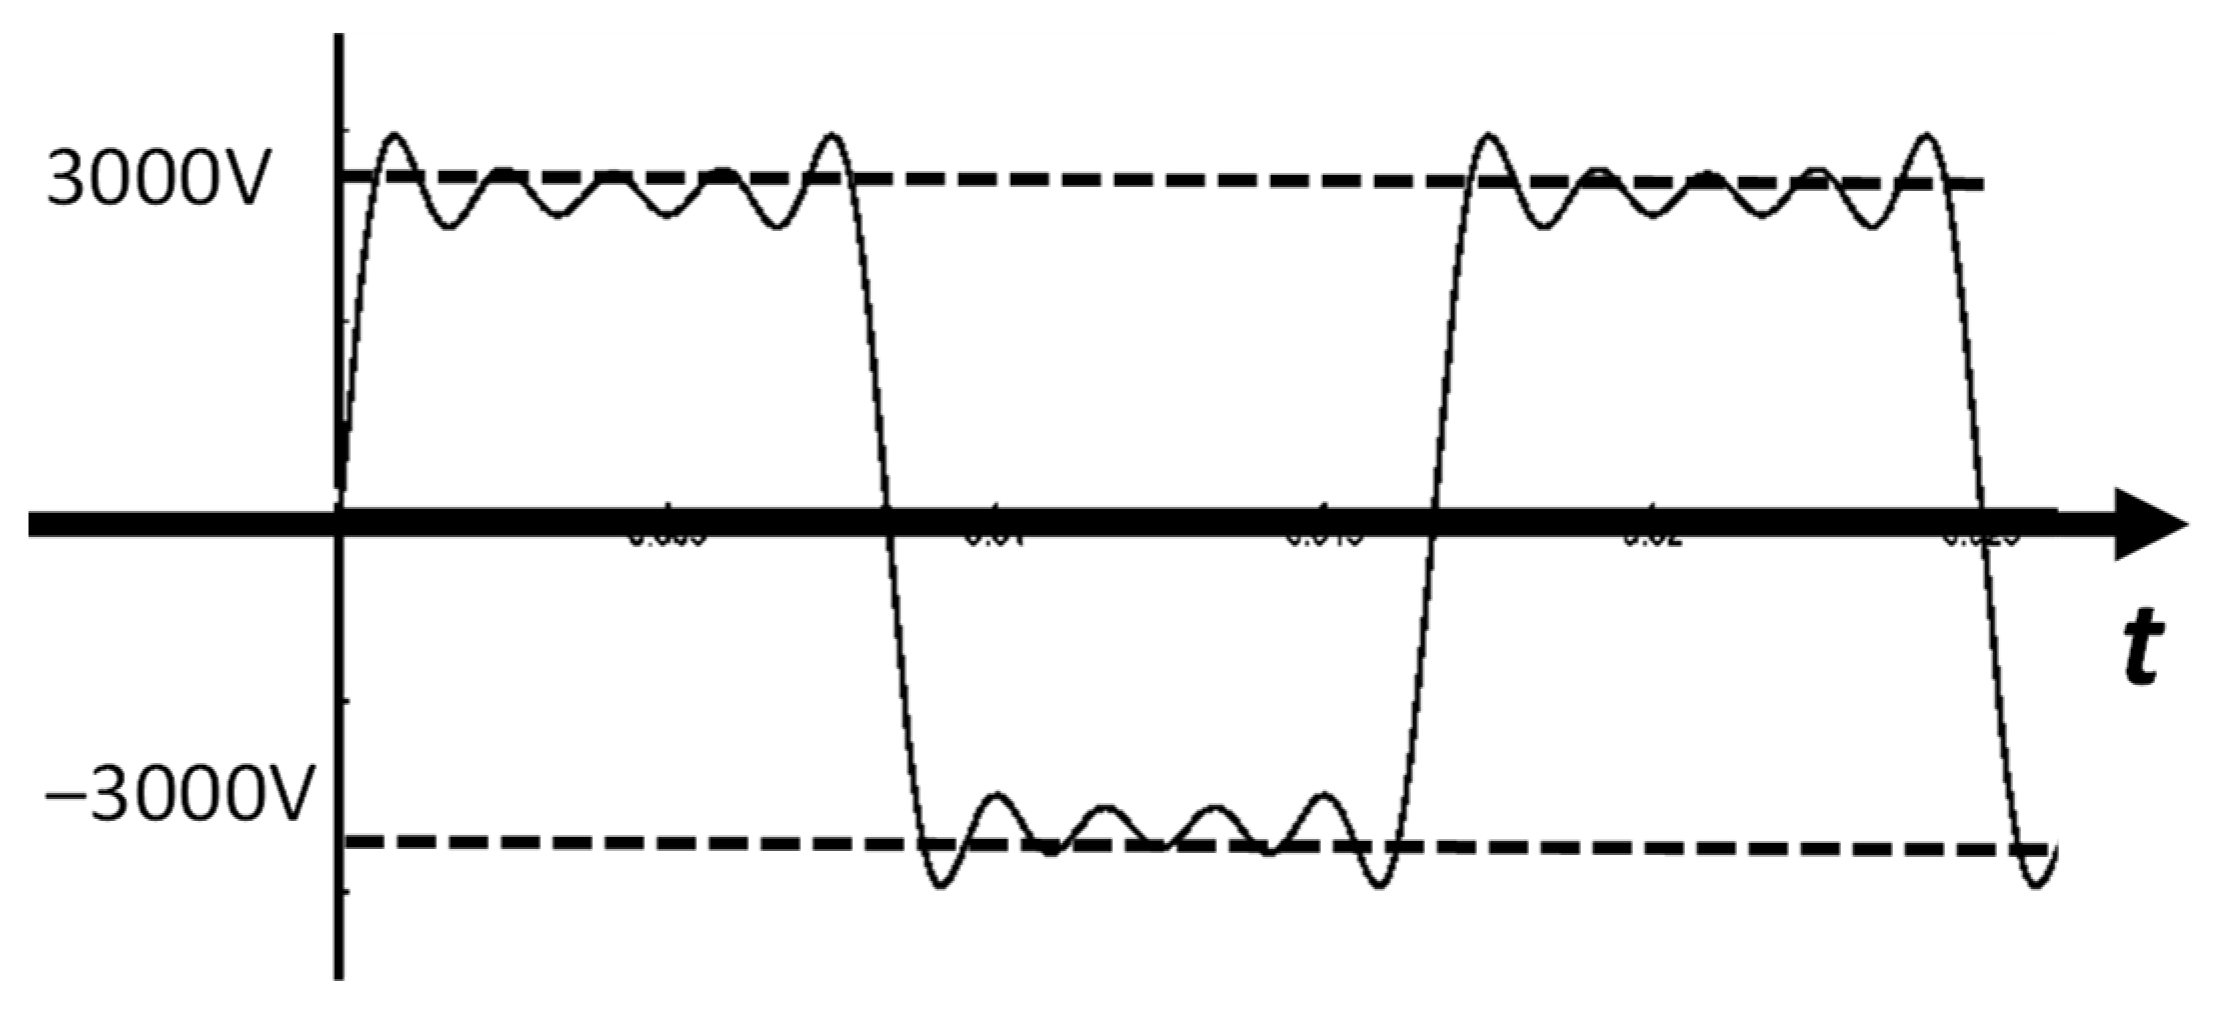
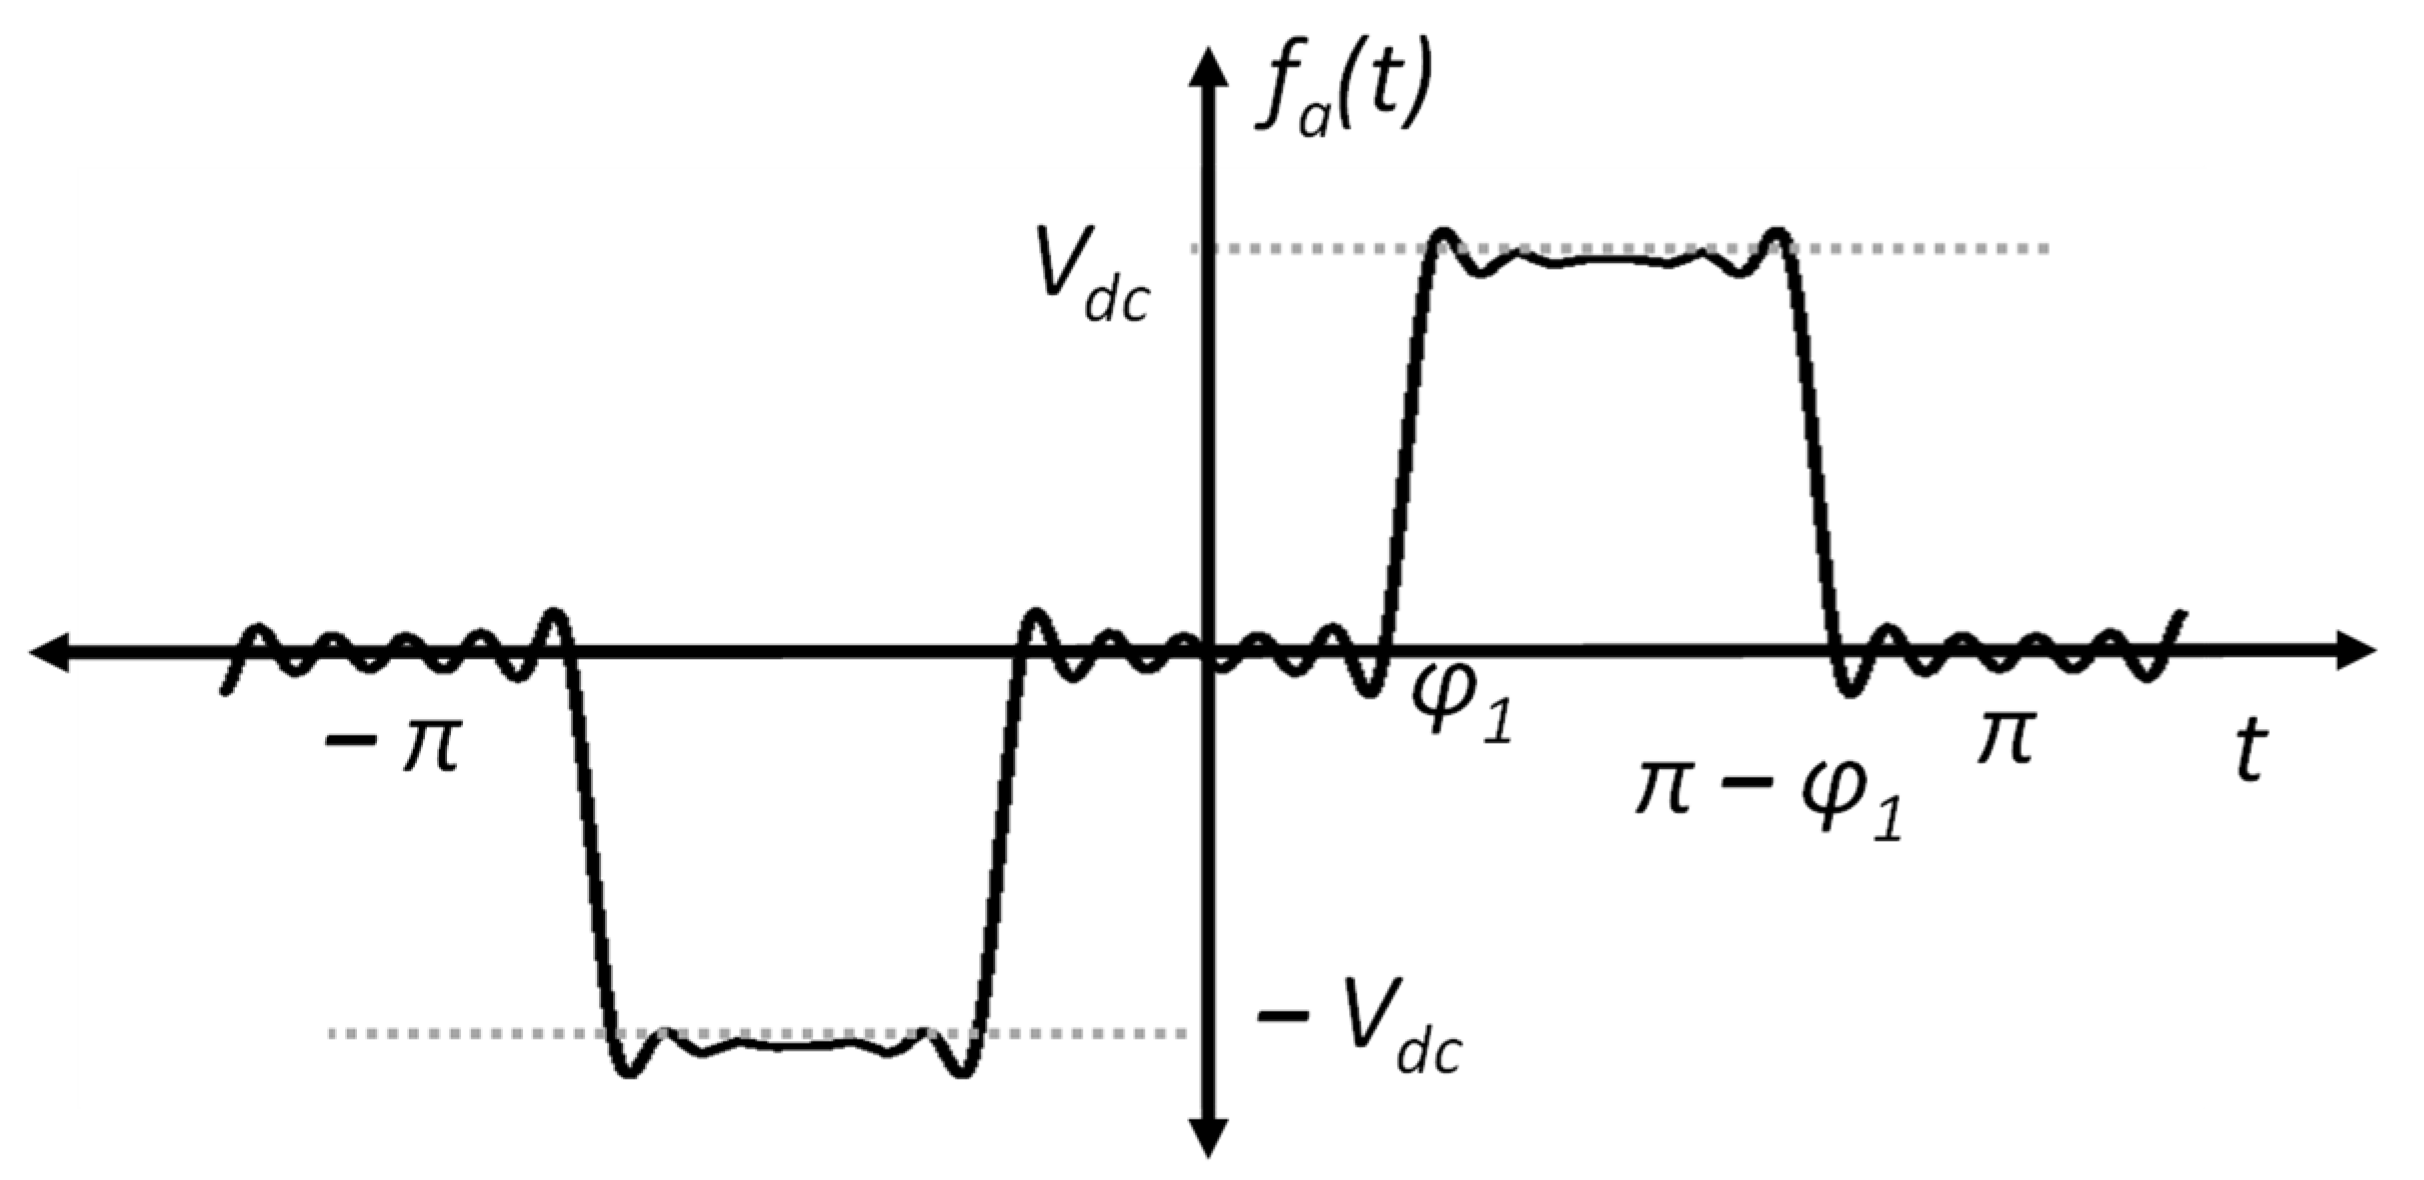
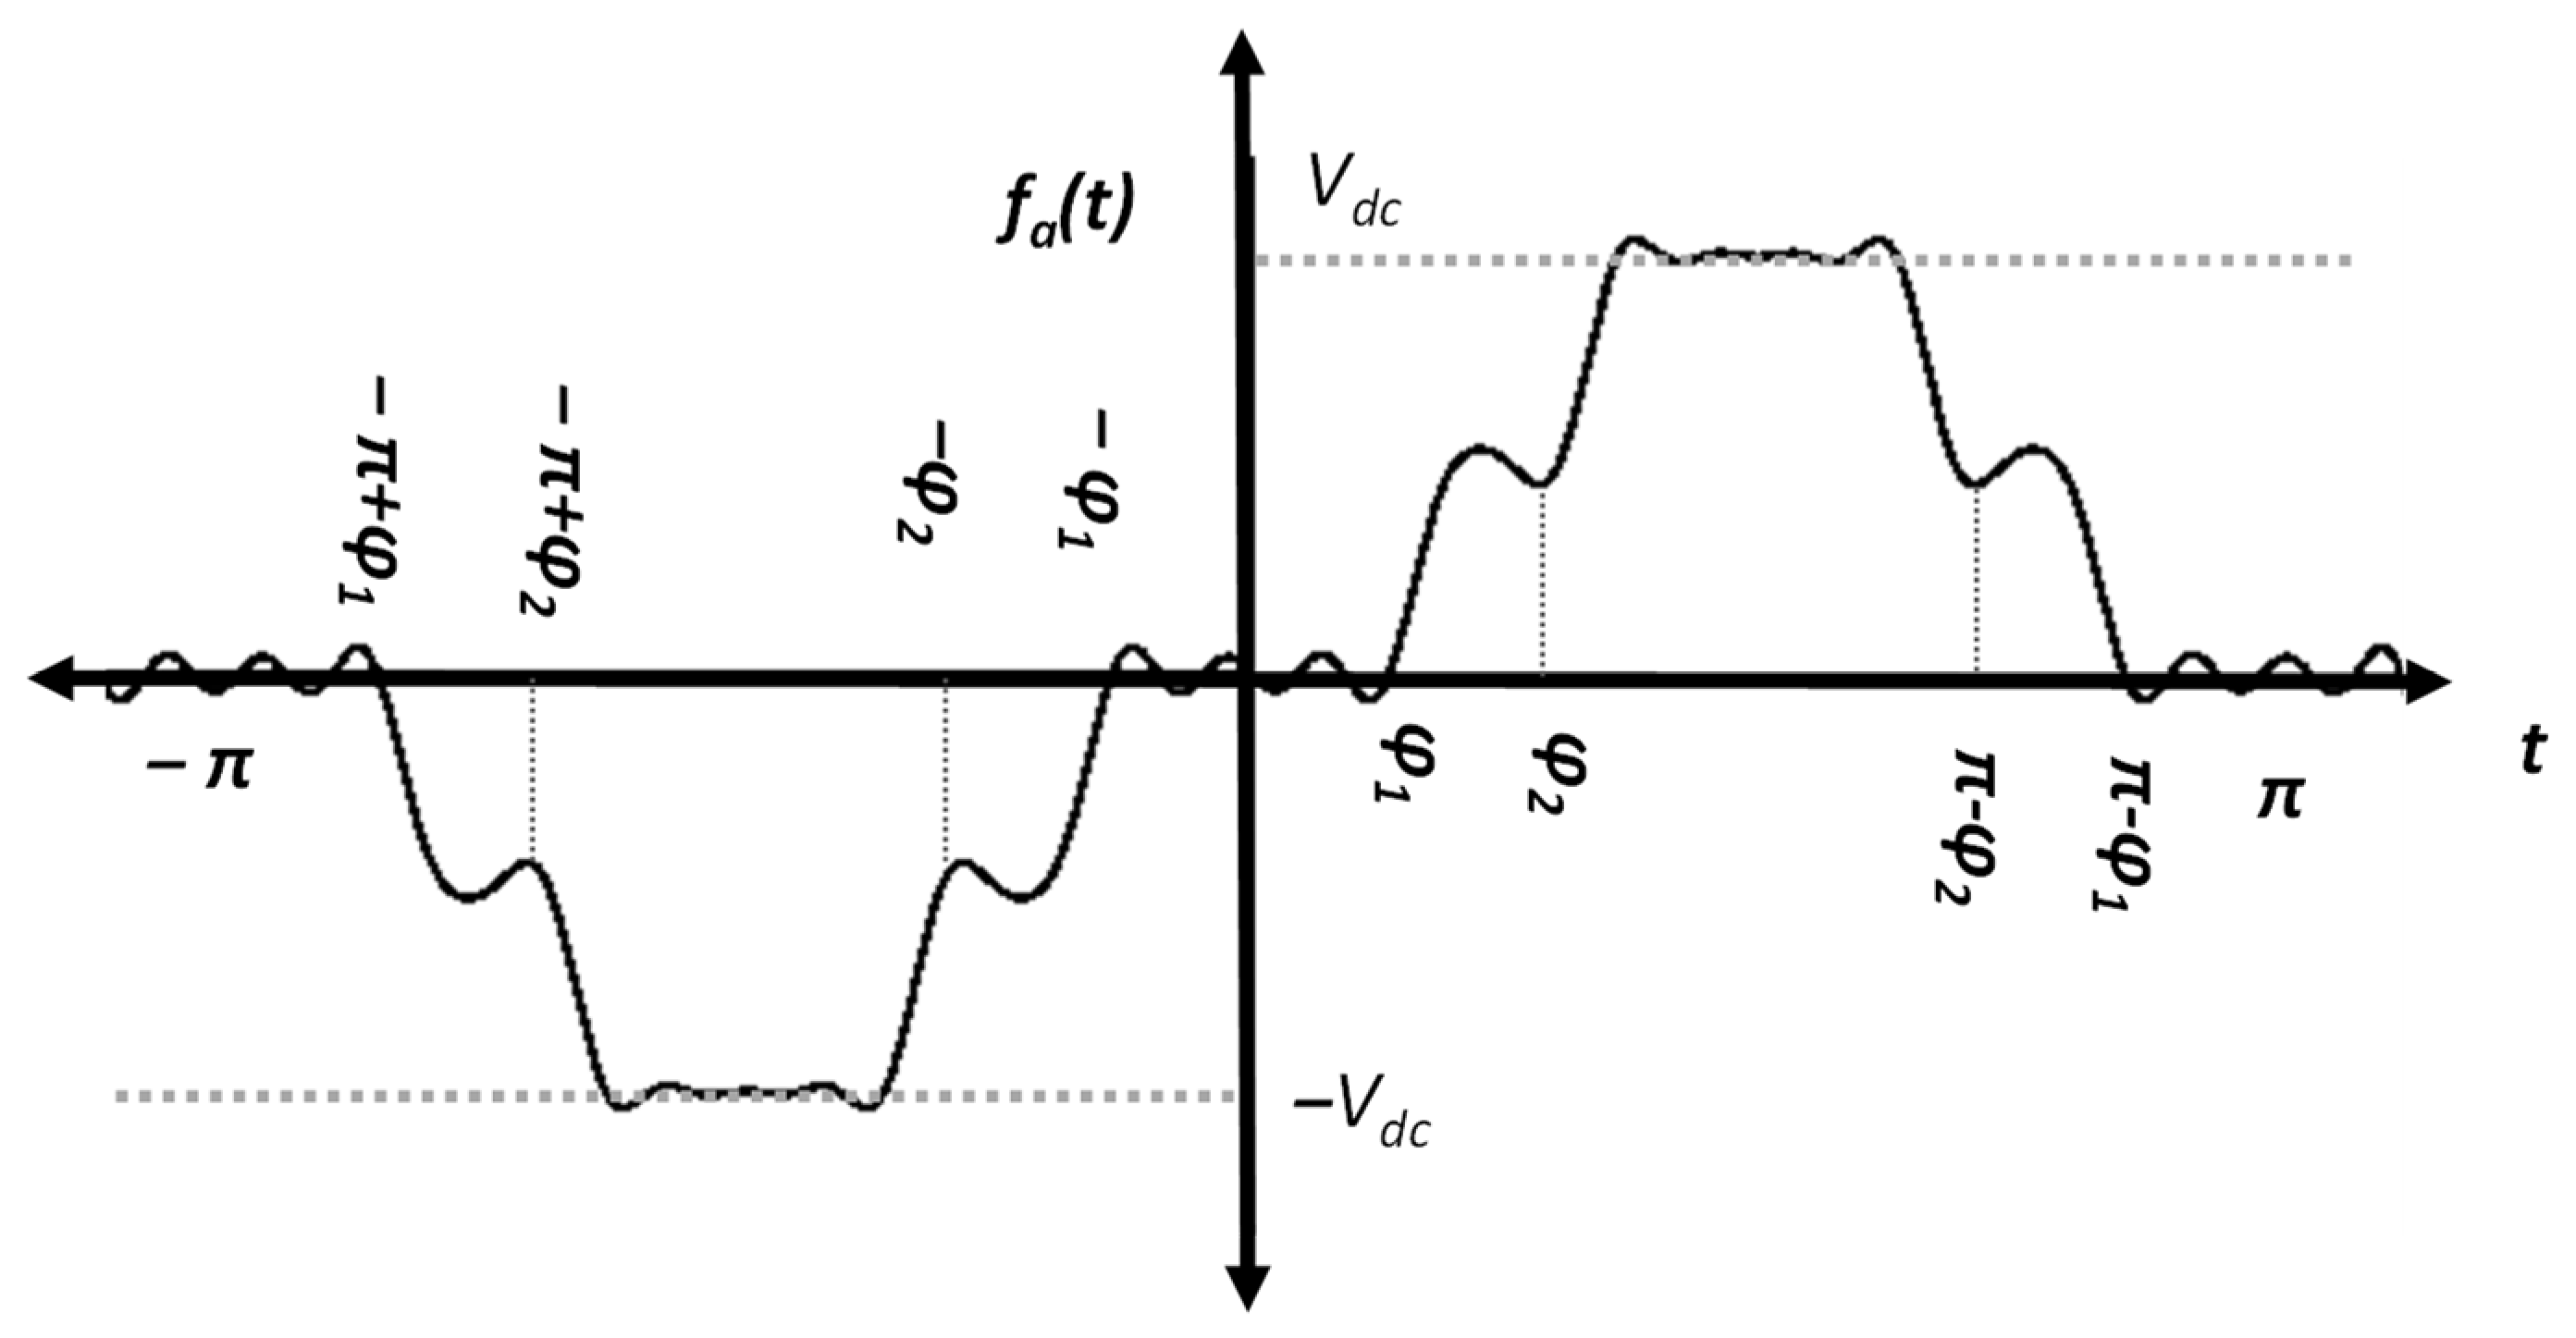
3.1. Analysis of Multilevel Inverter Output Waveform
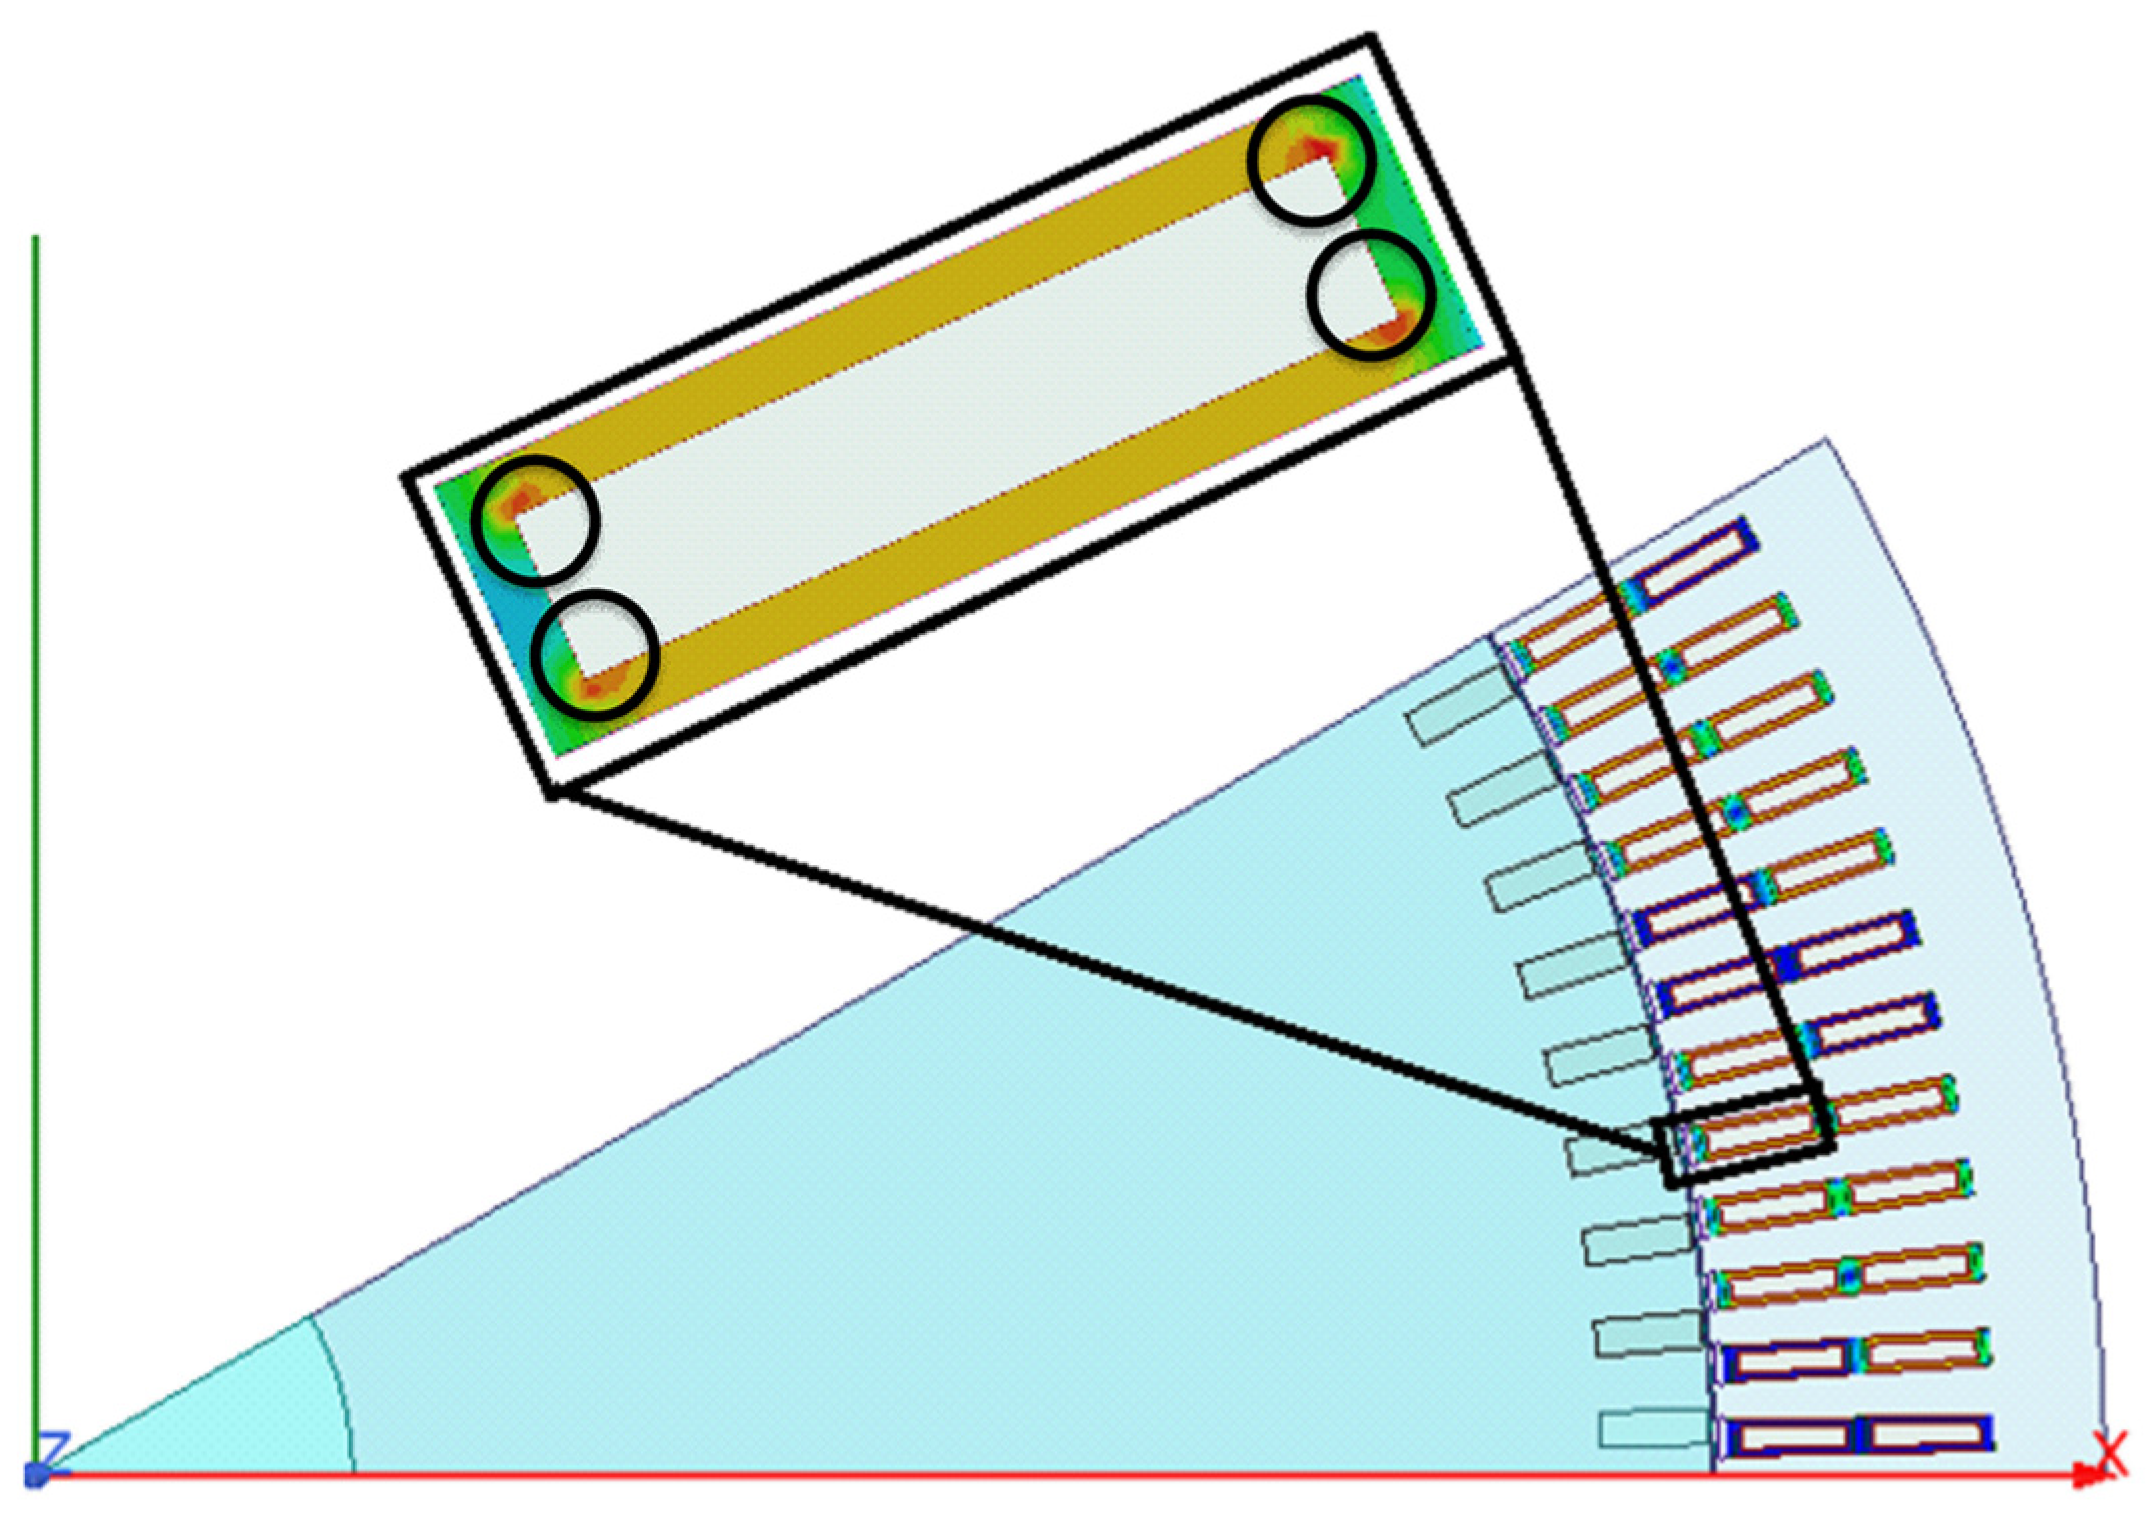
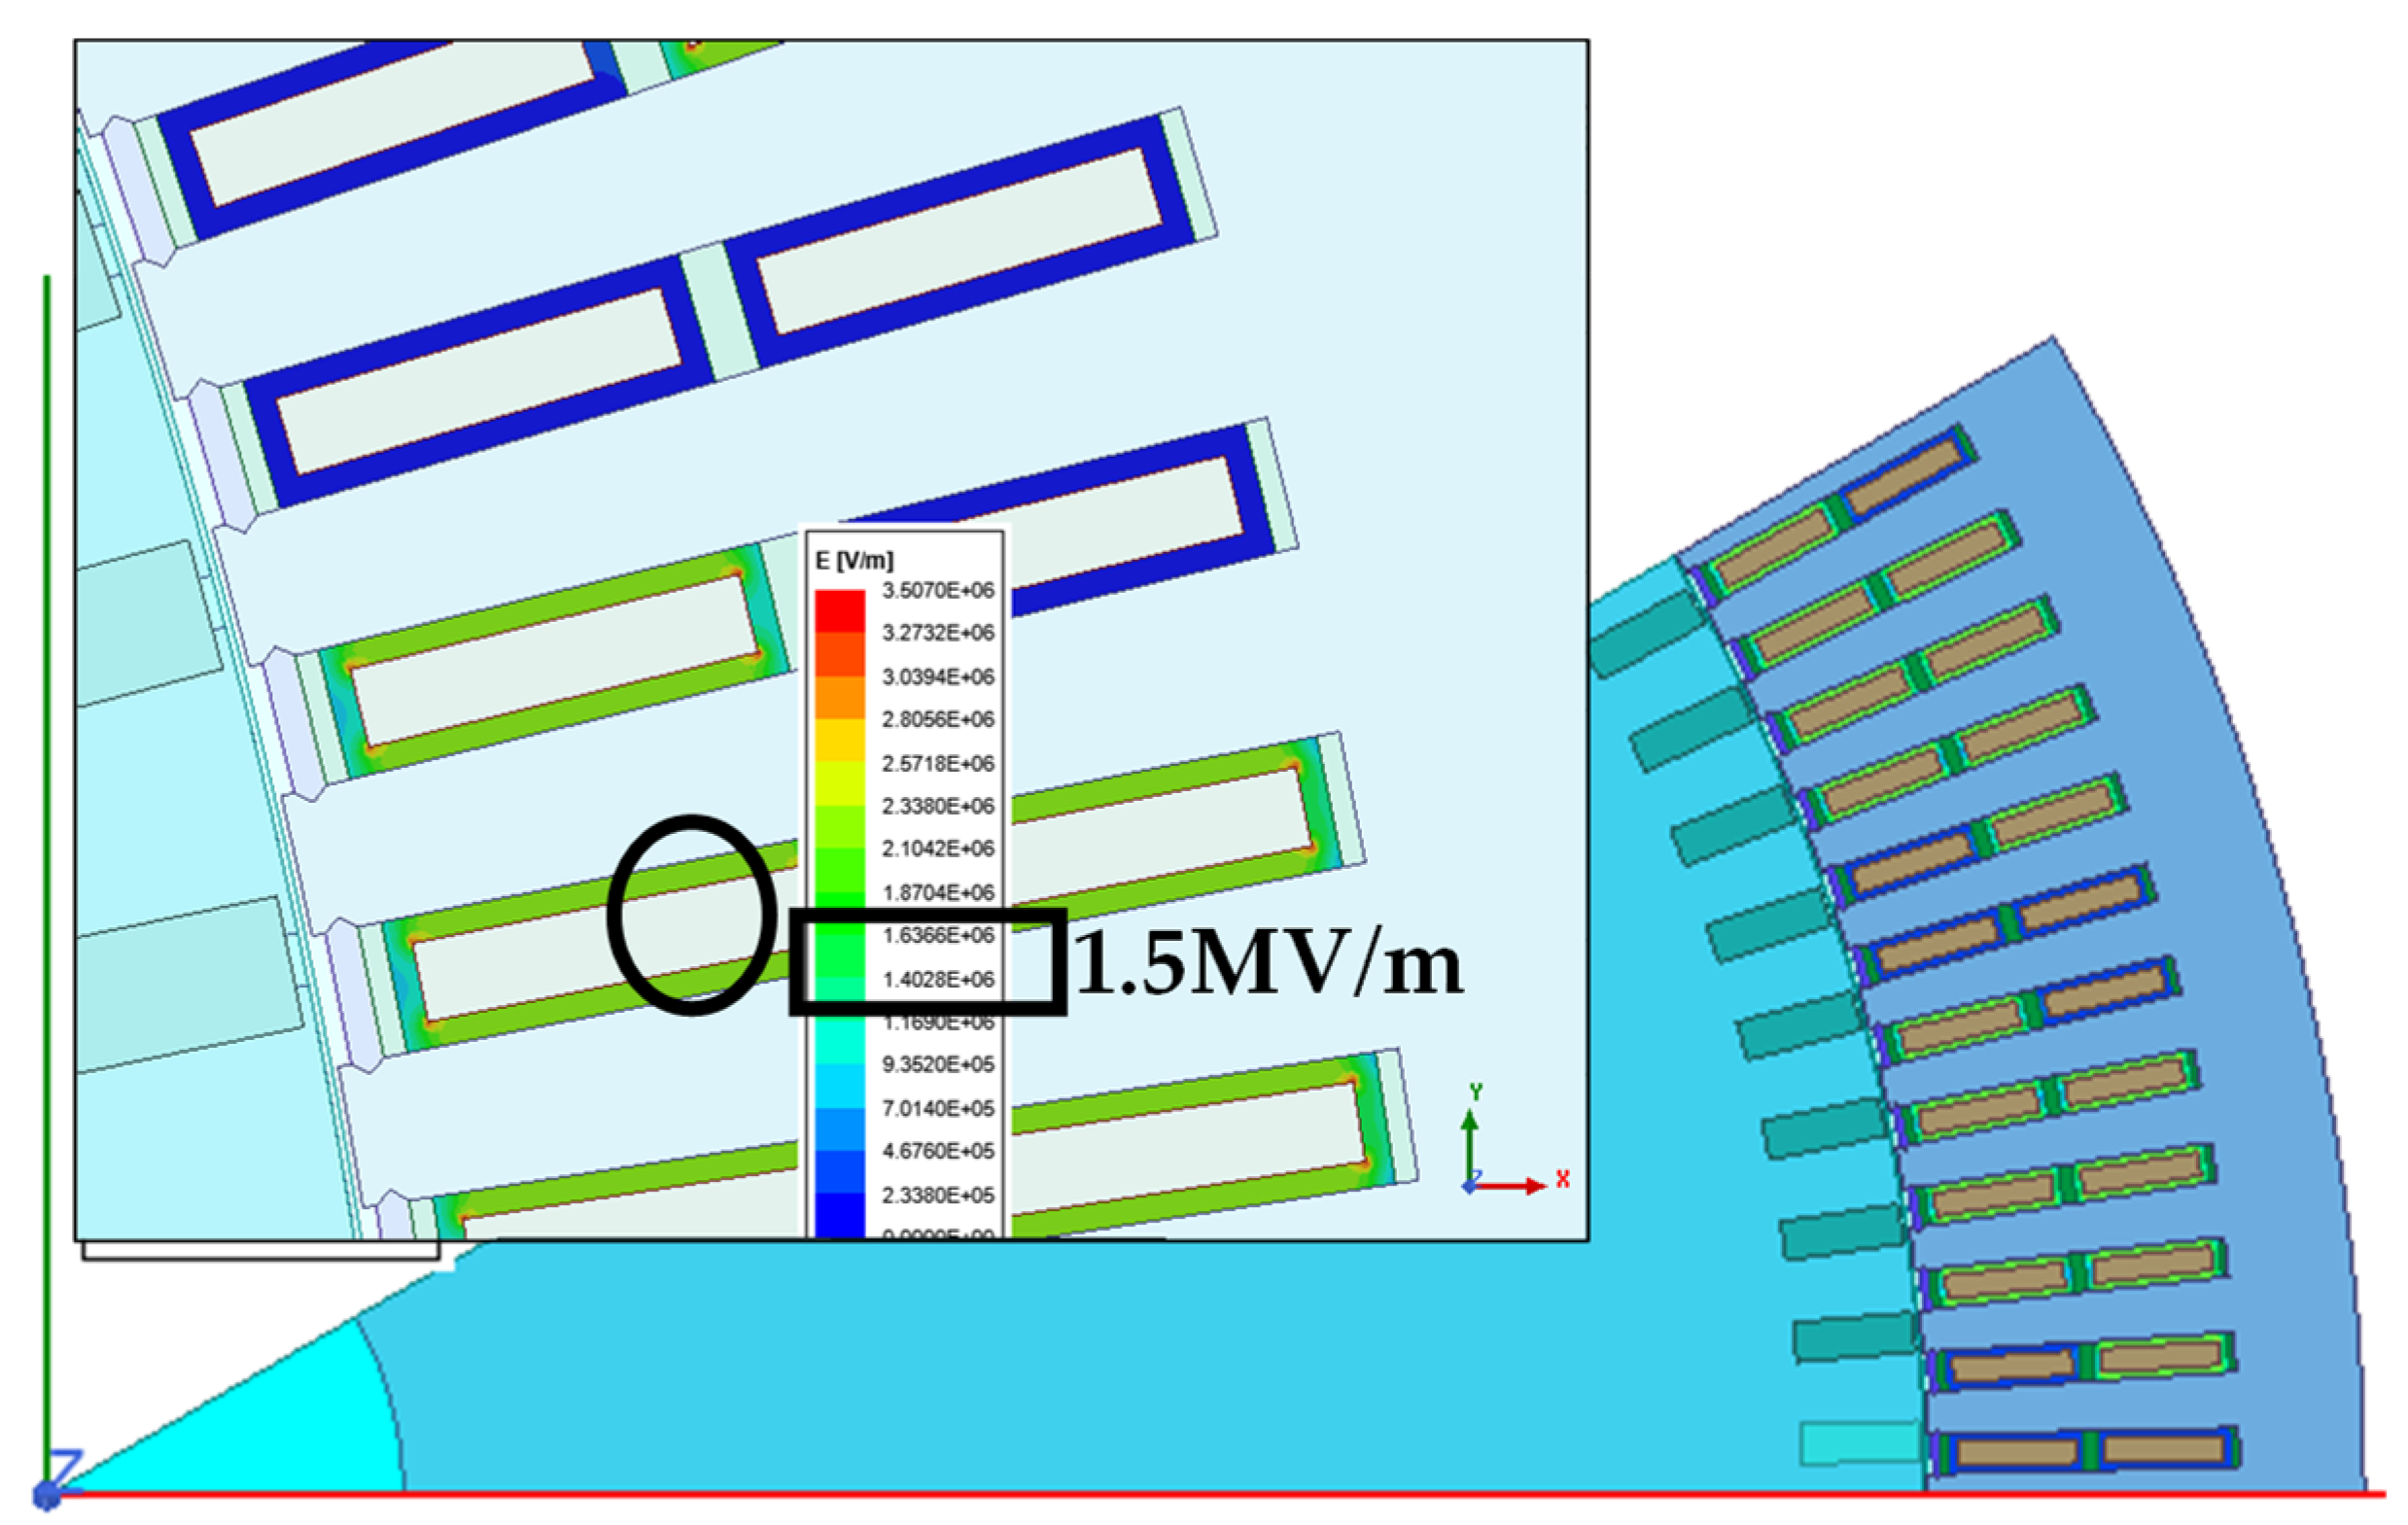
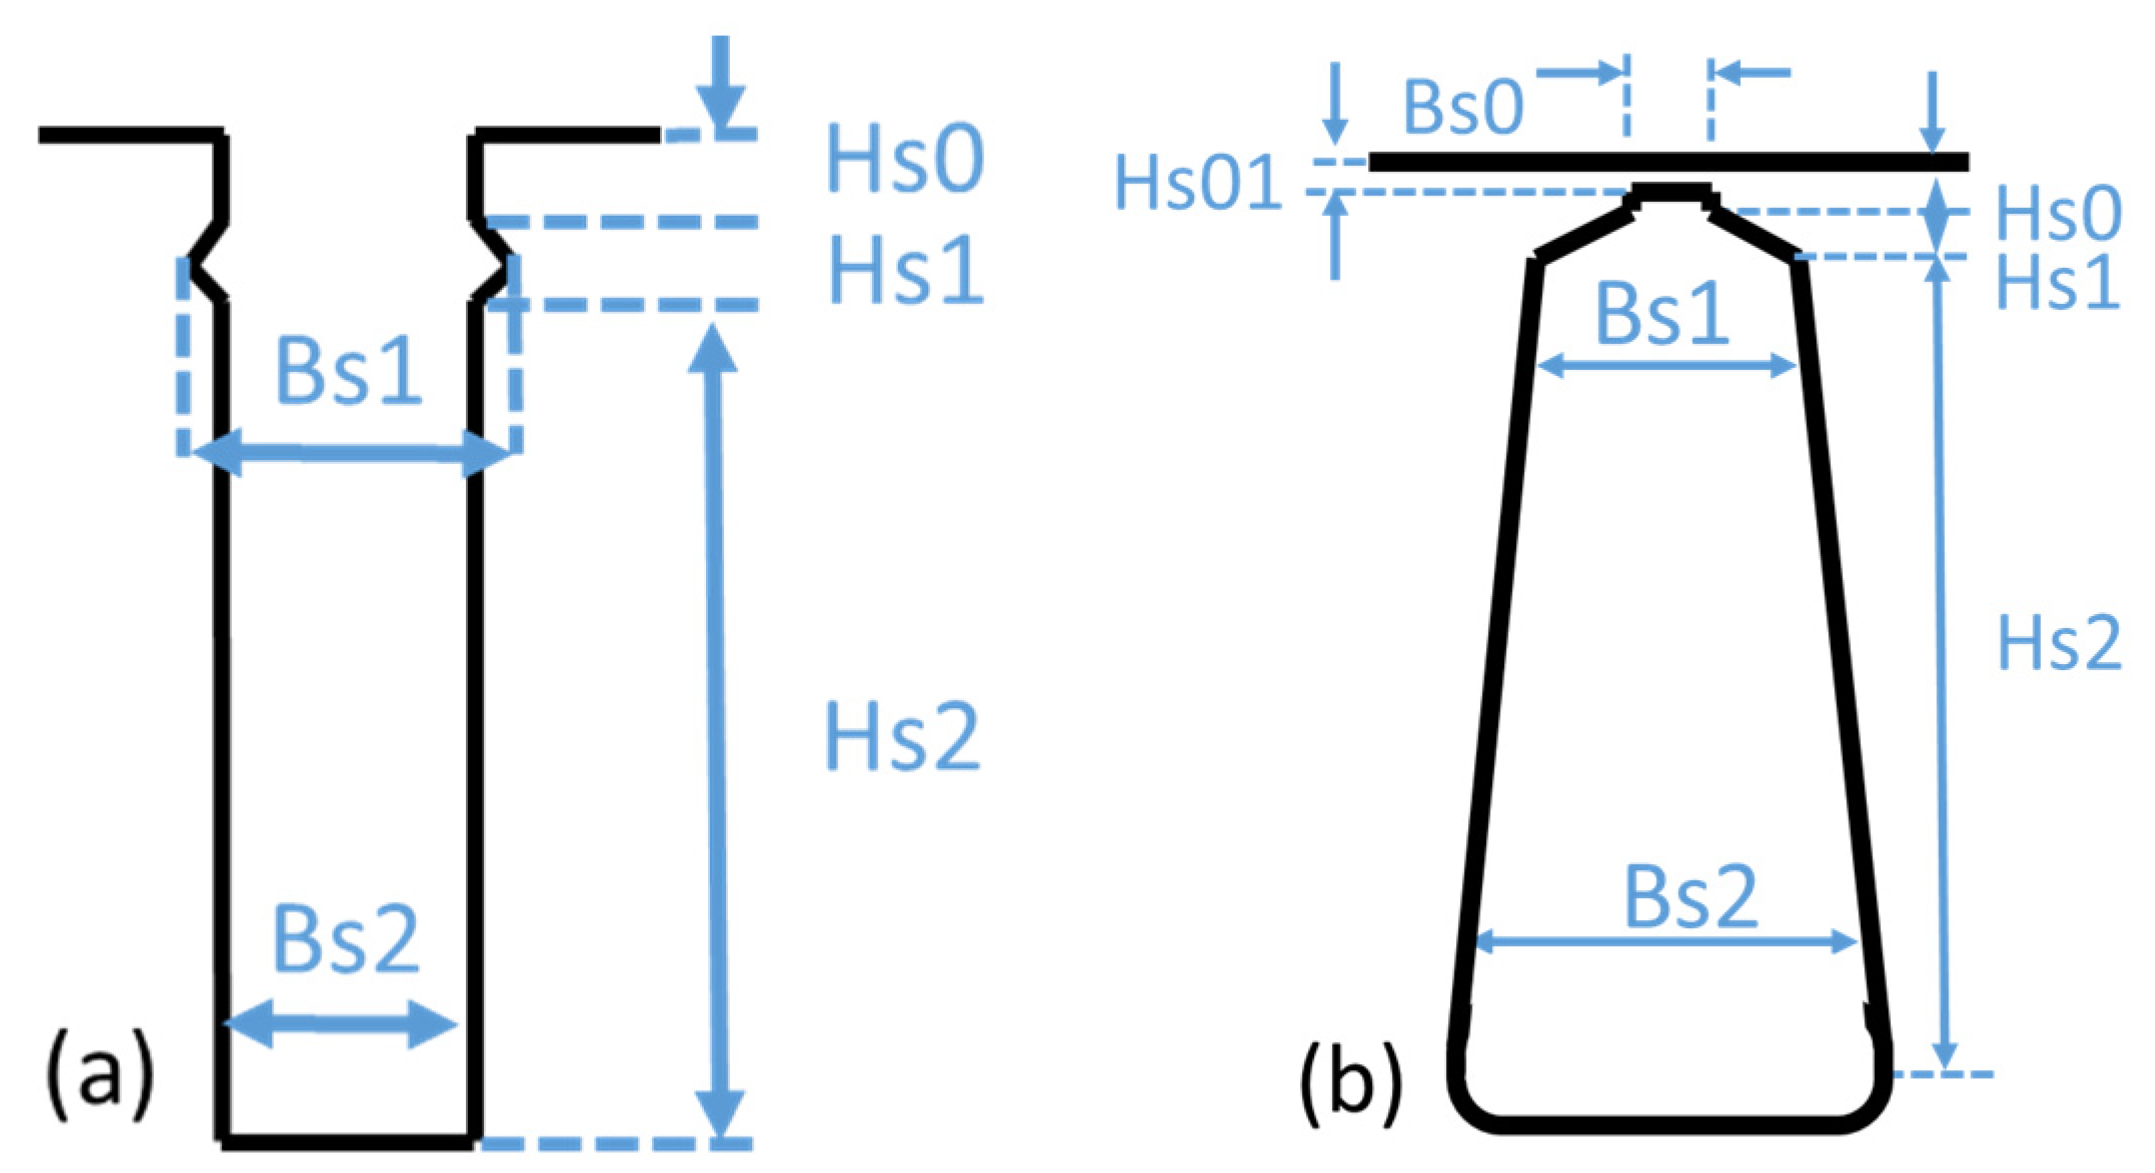
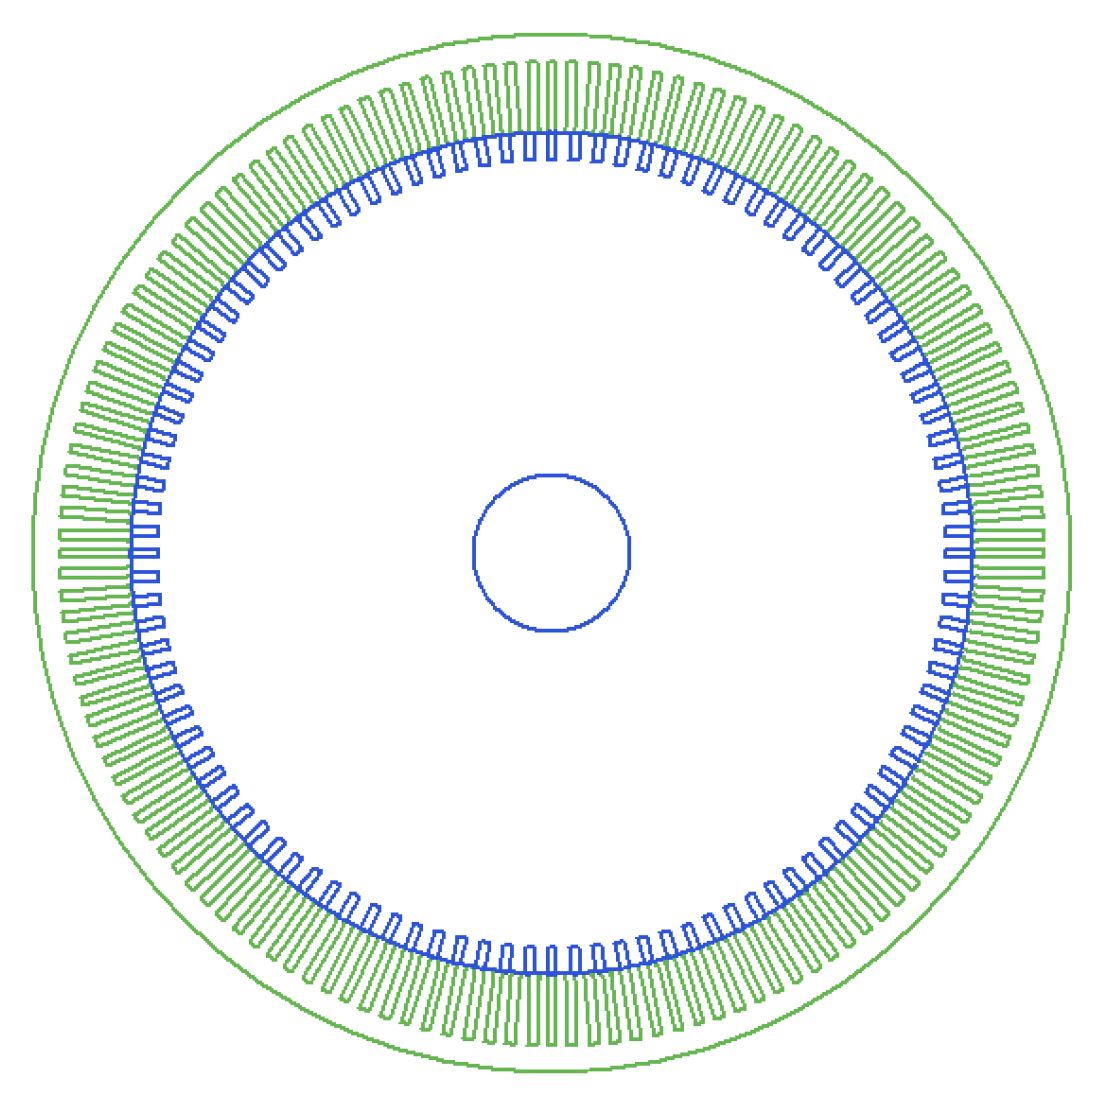
3.2. Finite Element Modeling of Medium-Voltage Machine
4. Results
4.1. Effect of Increase in Number of Voltage Levels
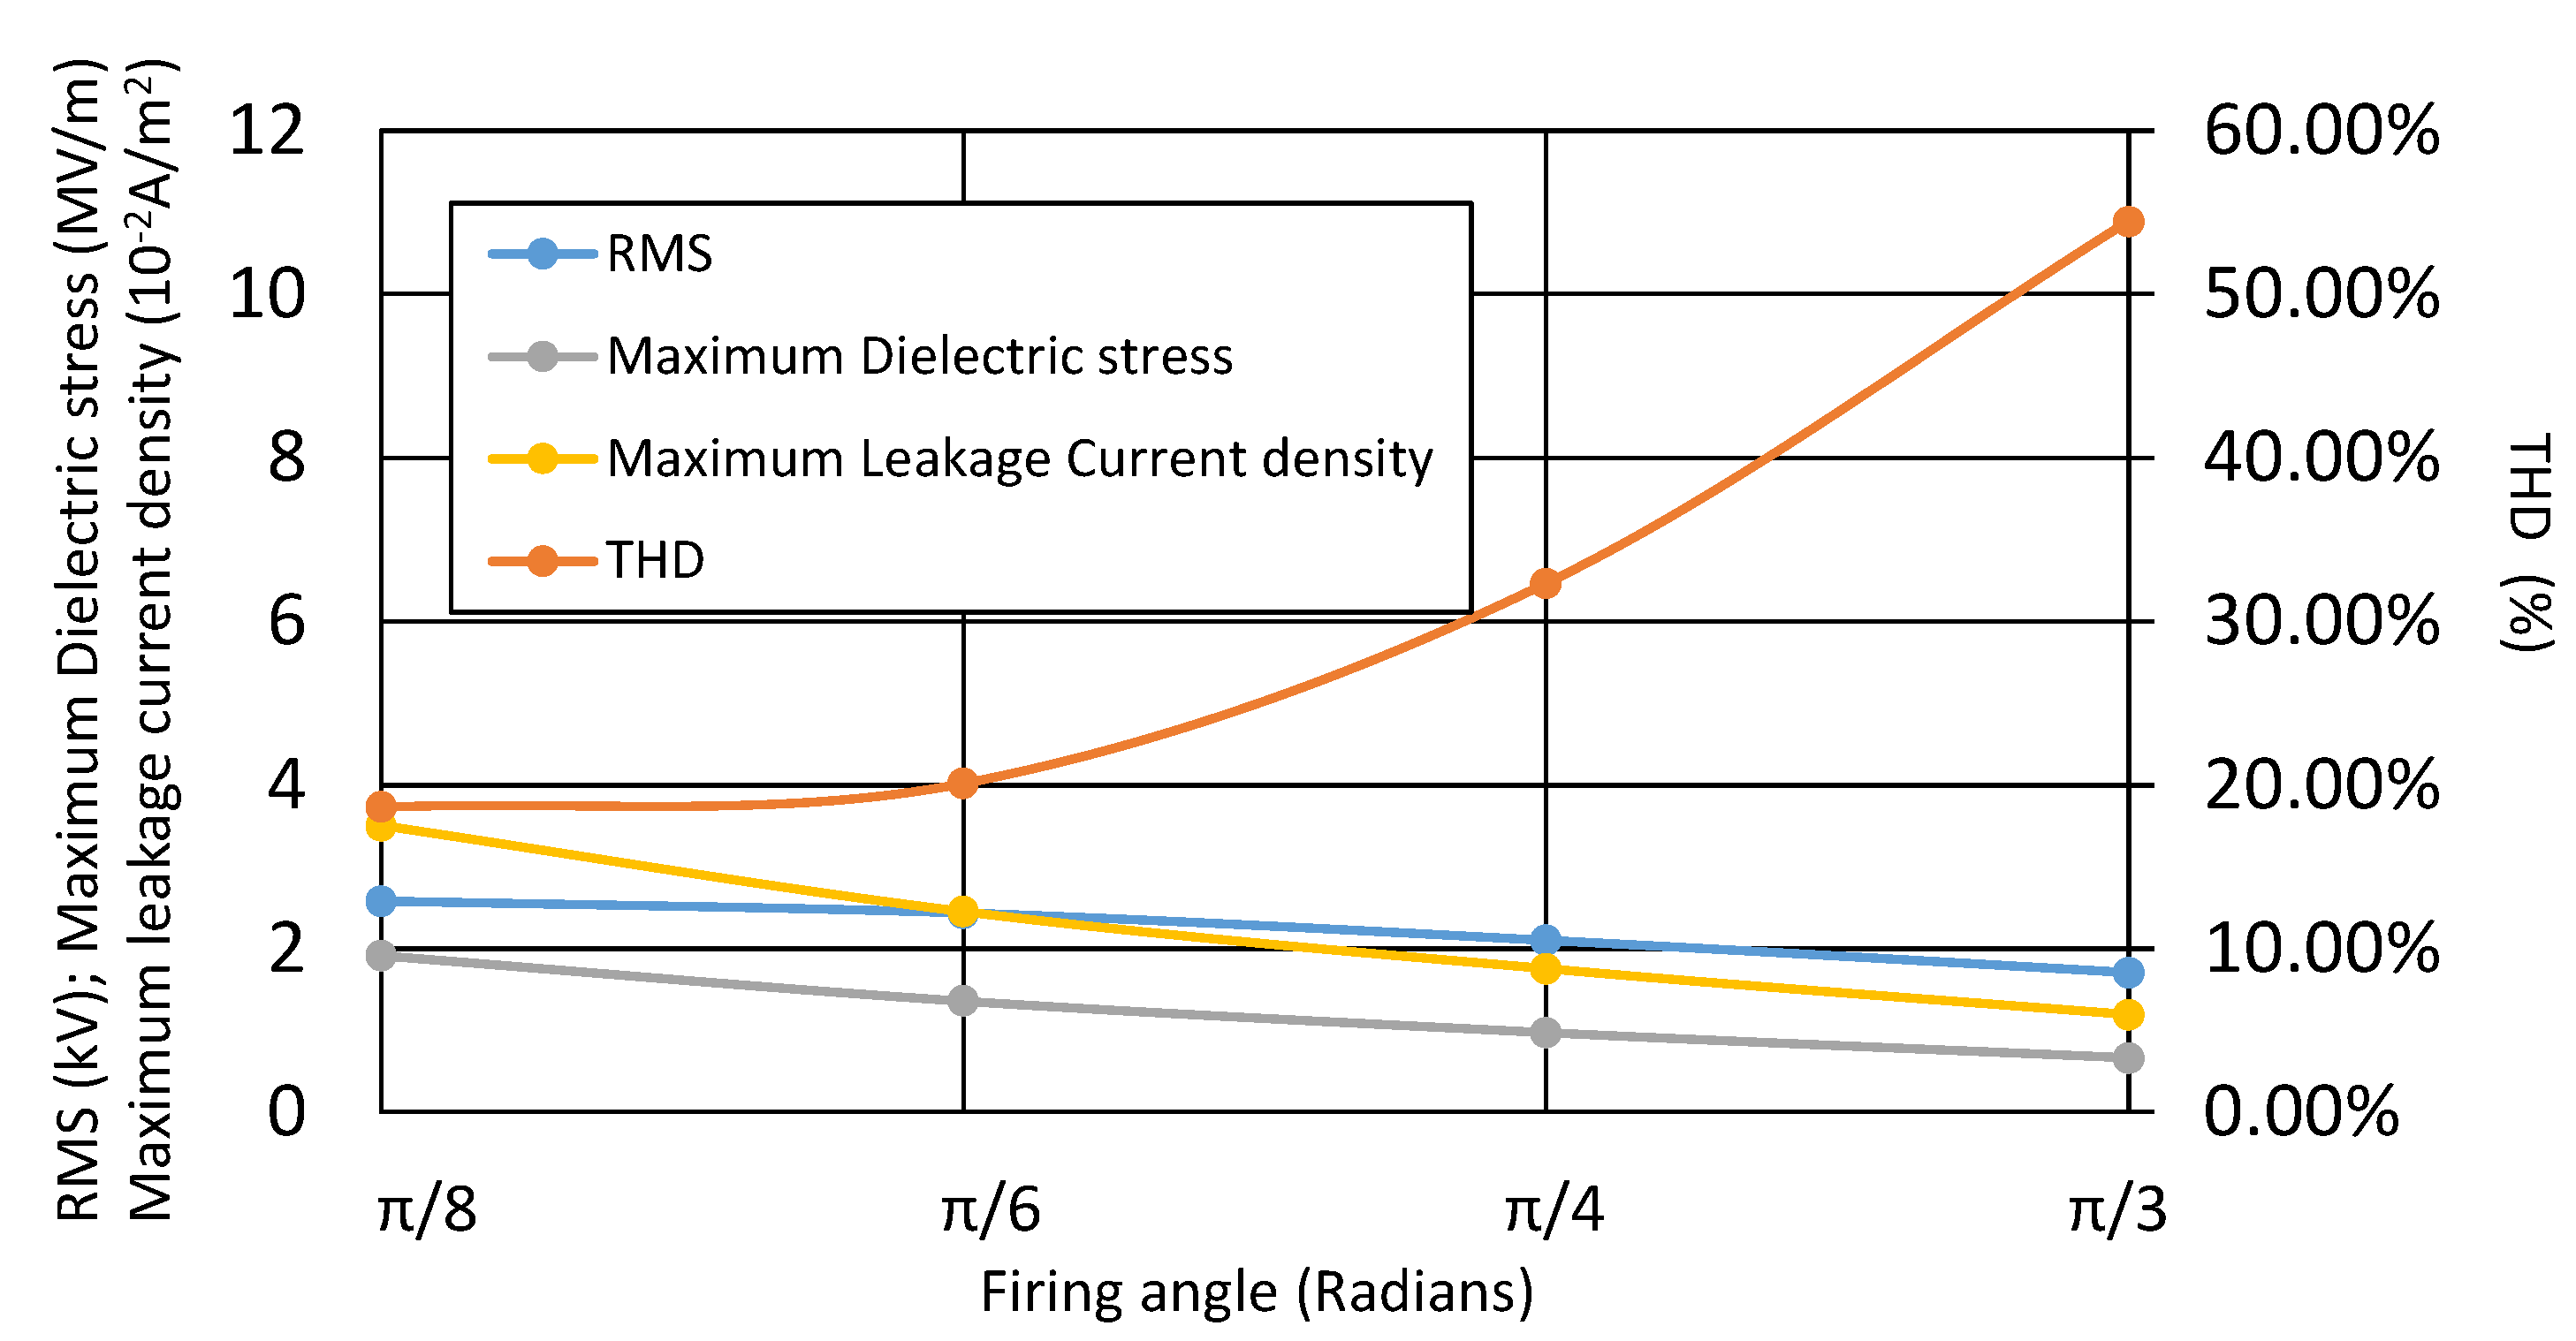
4.2. Effect of Increase in Firing Angle
5. Experimental Results
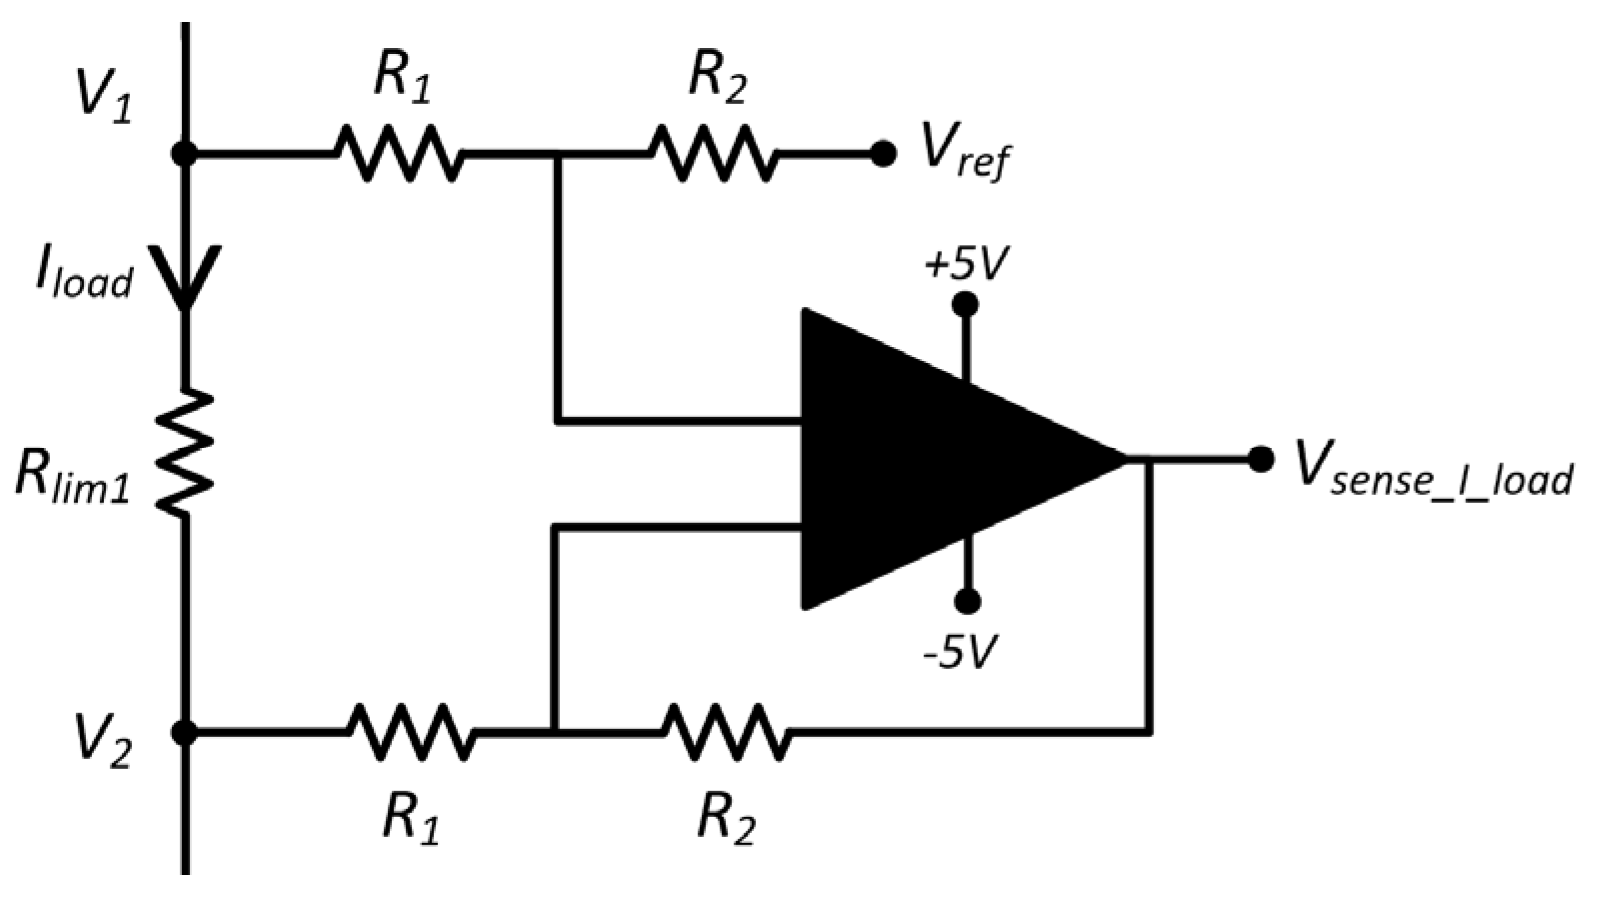
5.1. Low-Voltage Experimental Setup
5.1.1. Effect of Firing Angle on Insulation Dielectric Stress
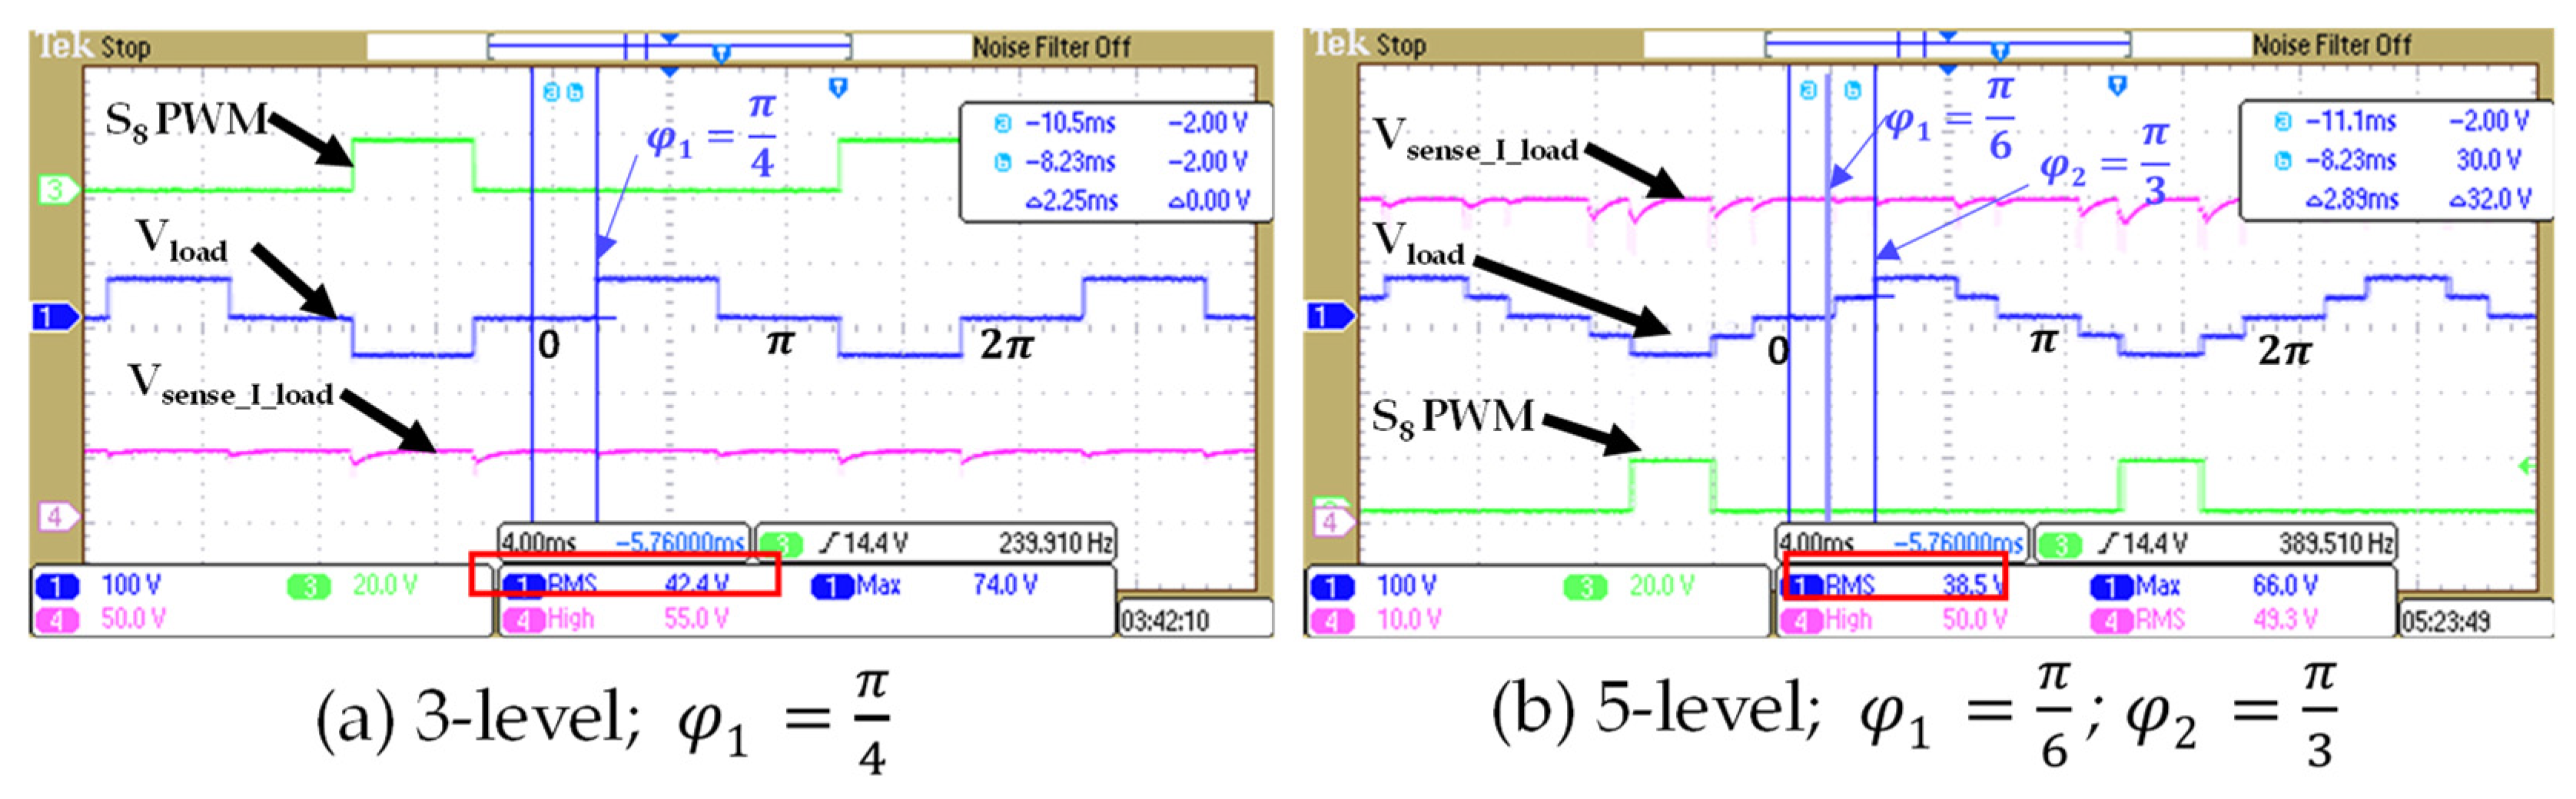
5.1.2. Effect of Increase in Voltage Levels
5.2. Additional MV Simulations and Experimental Results
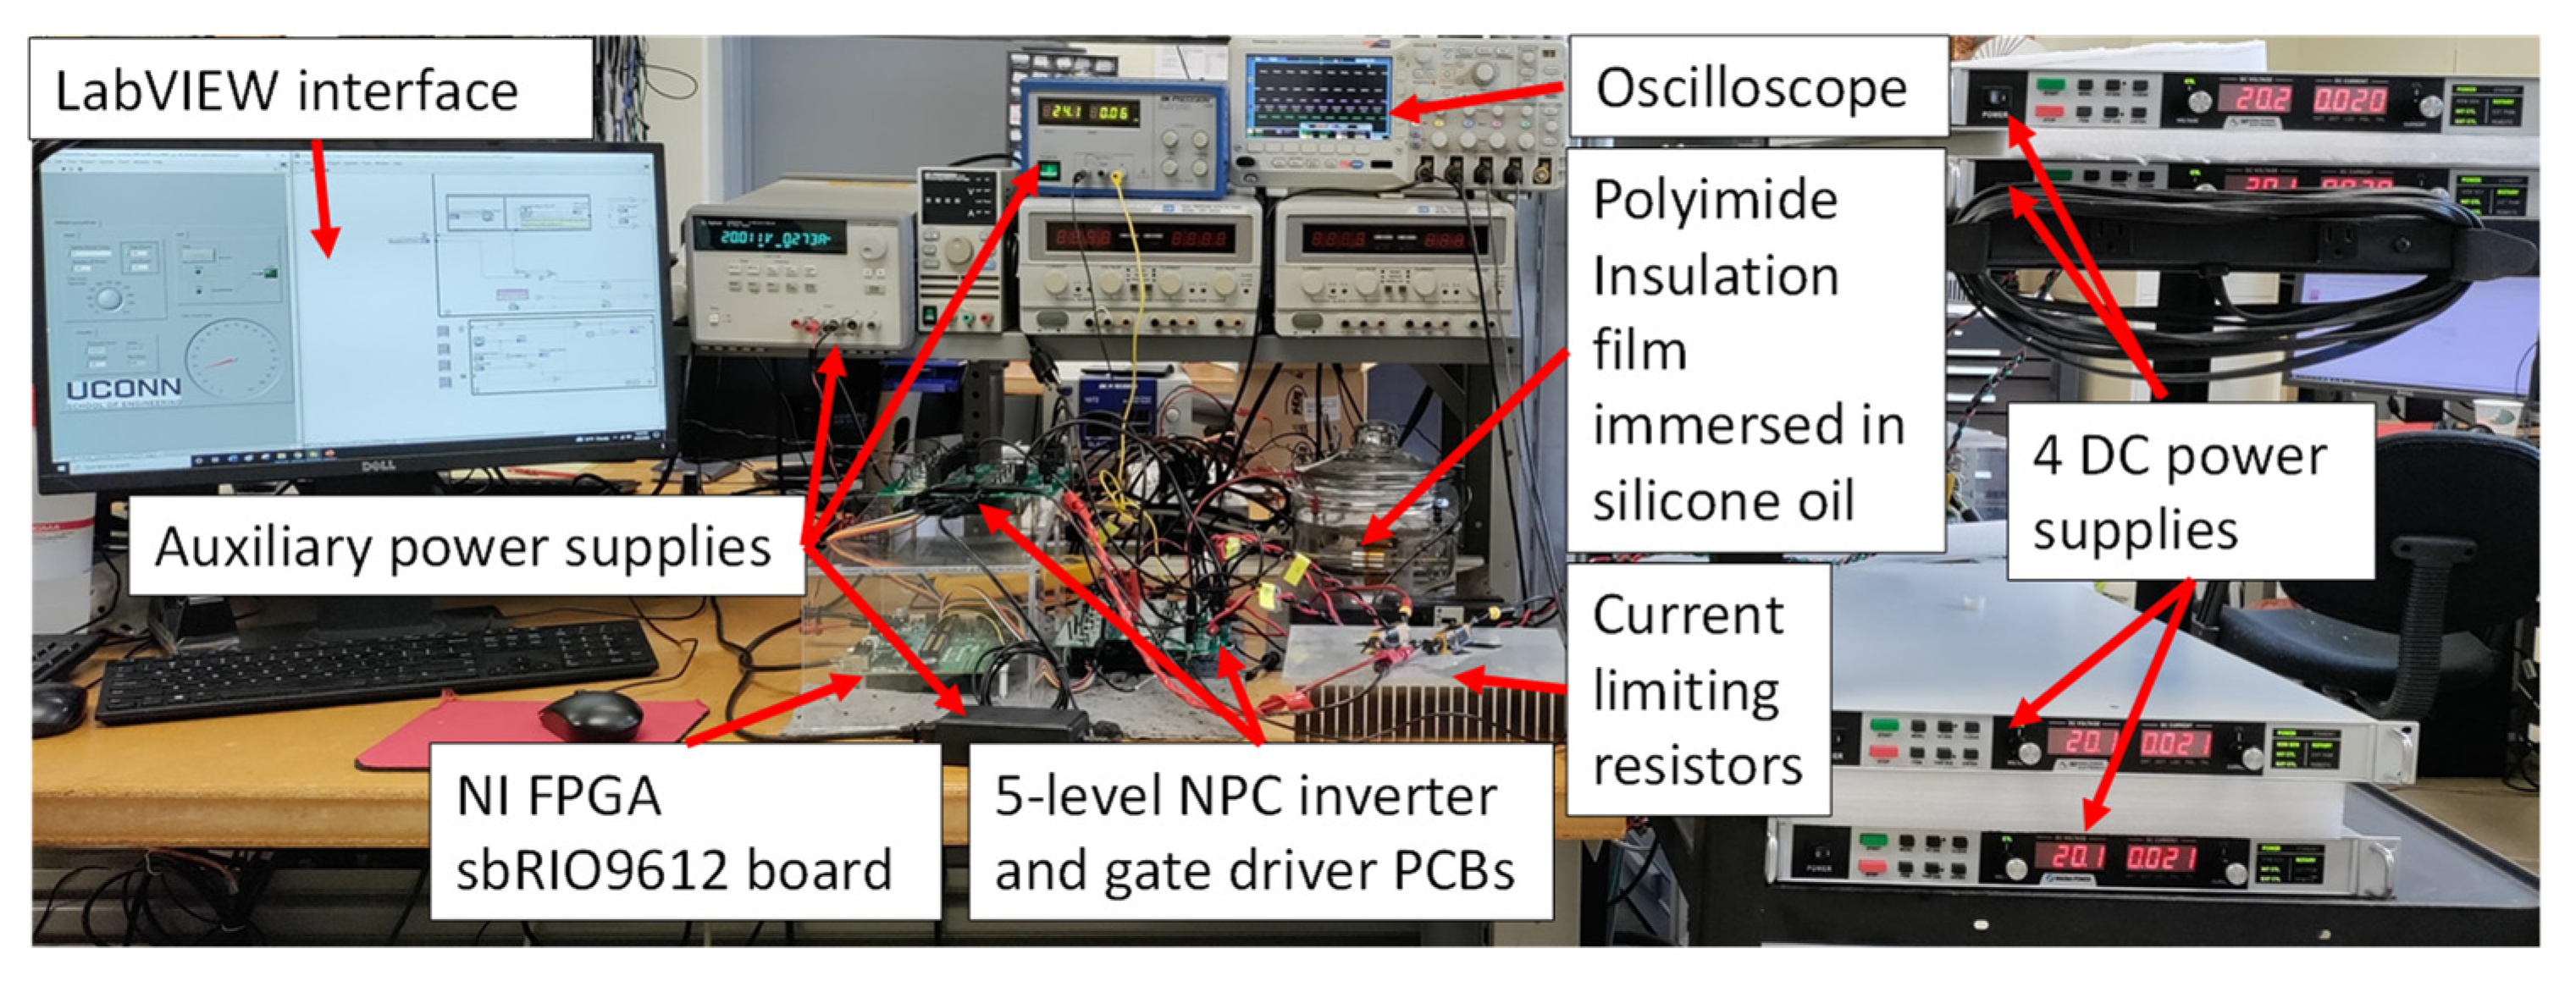
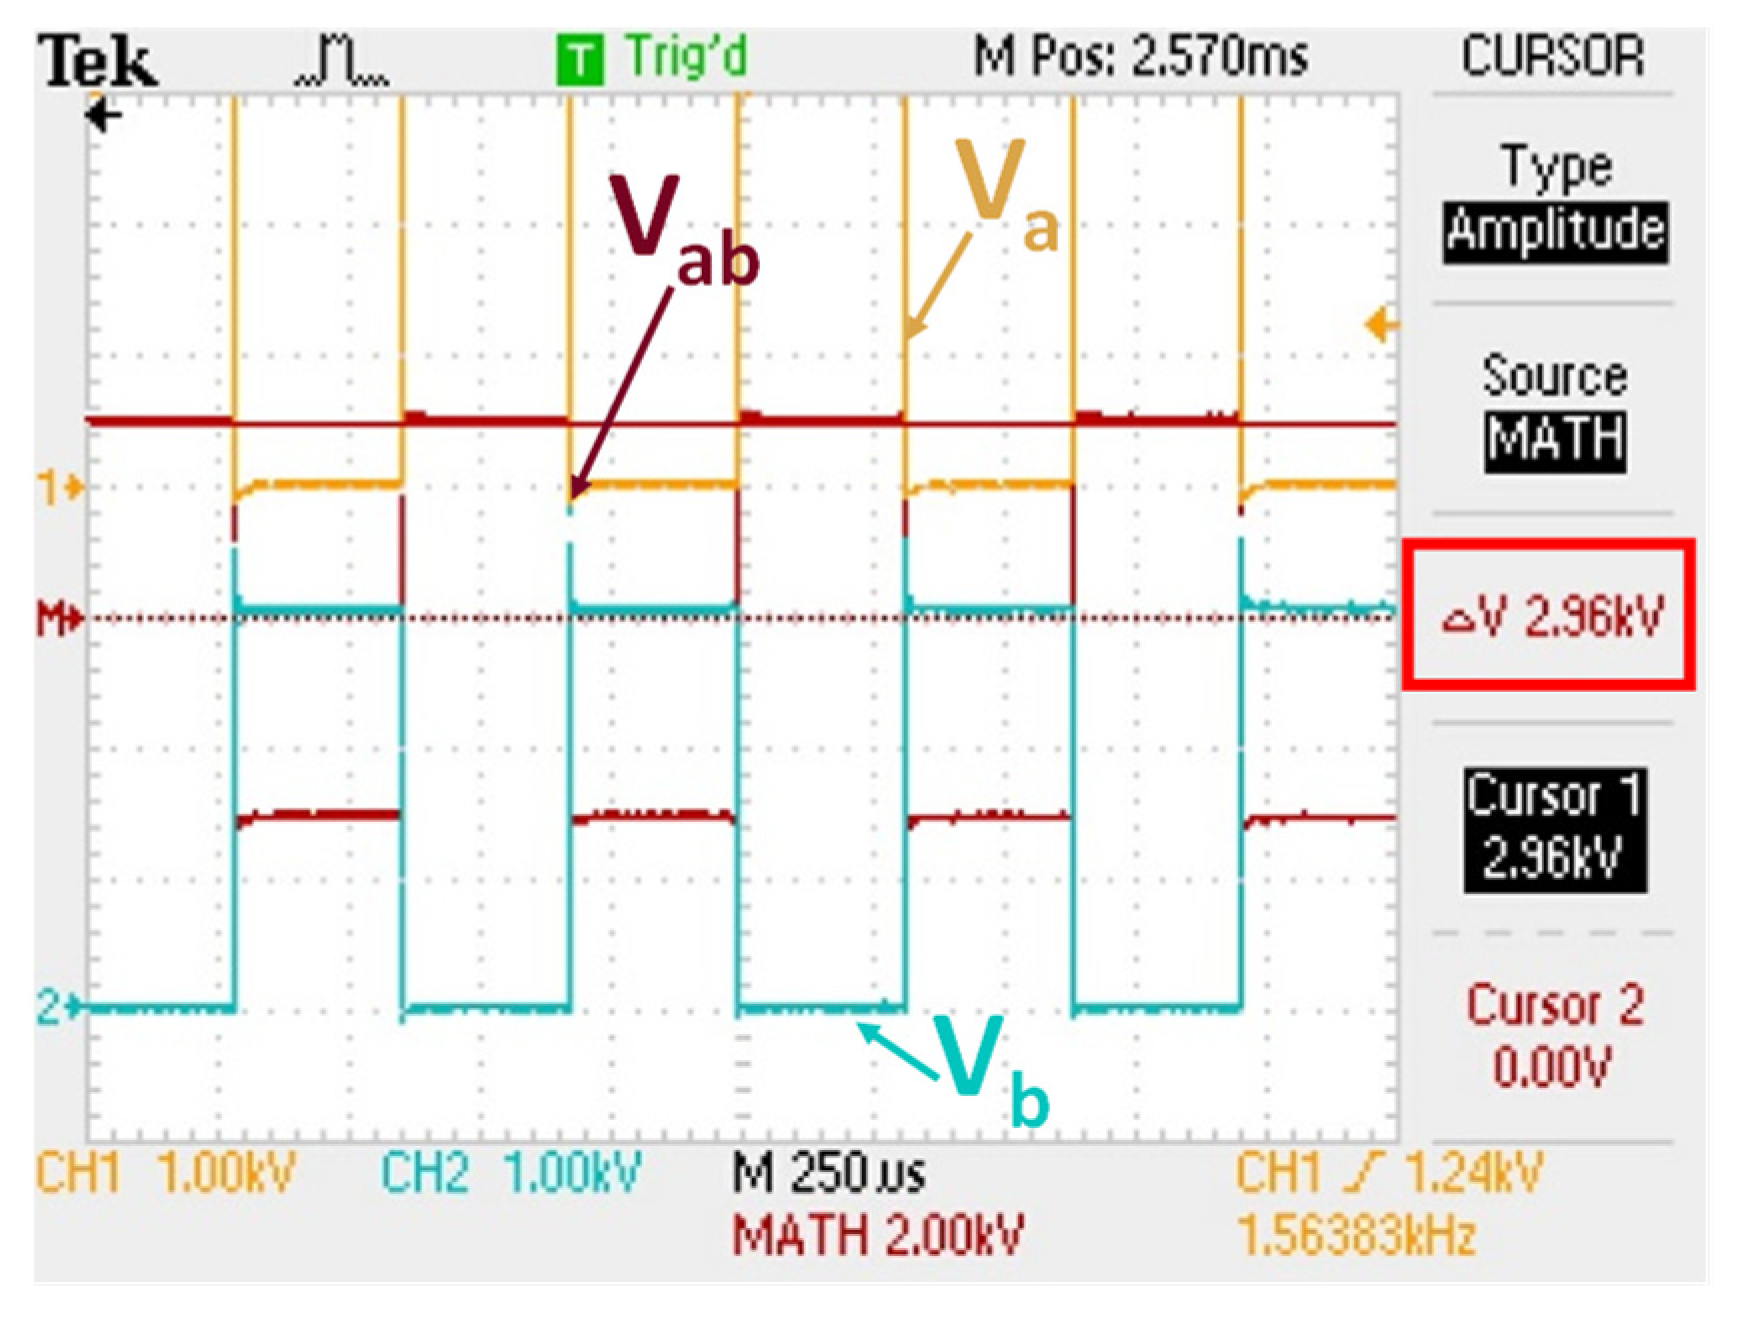
5.2.1. MV Experimental Testbed
5.2.2. Analysis and Simulations
6. Conclusions
- Insulation community—to define motor class insulation for different WBG converters and wave shapes;
- Motor design community—to choose appropriate insulation to ensure reliable and safe operation of motors;
- Power electronics community—to develop new WBG multilevel converter control schemes to optimally reduce the insulation stress and THD at same time.
Author Contributions
Funding
Data Availability Statement
Acknowledgments
Conflicts of Interest
References
- Rodriguez, J.; Lai, J.S.; Peng, F.Z. Multilevel Inverters: A Survey of Topologies, Controls, and Applications. IEEE Trans. Ind. Electron. 2002, 49, 724–738. [Google Scholar] [CrossRef] [Green Version]
- El-Hosainy, A.; Hamed, H.A.; Azazi, H.Z.; El-Kholy, E.E. A Review of Multilevel Inverter Topologies, Control Techniques, and Applications. In Proceedings of the Nineteenth International Middle East Power Systems Conference (MEPCON), Cairo, Egypt, 19–21 December 2017; pp. 1265–1275. [Google Scholar]
- Gianoglio, C.; Ragusa, E.; Gastaldo, P.; Gallesi, F.; Guastavino, F. Online Predictive Maintenance Monitoring Adopting Convolutional Neural Networks. Energies 2021, 14, 4711. [Google Scholar] [CrossRef]
- Seri, P.; Montanari, G.C.; Hebner, R. Partial Discharge Phase and Amplitude Distribution and Life of Insulation Systems Fed with Multilevel Inverters. In Proceedings of the IEEE Transportation Electrification Conference and Expo (ITEC), Detroit, MI, USA, 19–21 June 2019; pp. 1–6. [Google Scholar]
- Hammarström, T.J.Å.; Bengtsson, T.; Gubanski, S.M. Partial discharge characteristics in motor insulations under exposure to multi-level inverters. In Proceedings of the 2017 IEEE Conference on Electrical Insulation and Dielectric Phenomenon (CEIDP), Fort Worth, TX, USA, 22–25 October 2017; pp. 307–310. [Google Scholar]
- Hammarström, T.J.Å. Multilevel PWM: A Tool to Explore Insulation PD Characteristics. IEEE Trans. Instrum. Meas. 2019, 68, 4075–4084. [Google Scholar] [CrossRef]
- Florkowski, M.; Błaszczyk, P.; Klimczak, P. Partial discharges in insulation systems subjected to multilevel converters. In Proceedings of the IEEE International Power Modulator and High Voltage Conference (IPMHVC), San Francisco, CA, USA, 5–9 July 2016; pp. 320–324. [Google Scholar]
- Hammarström, T. The Implications on the PD Characteristics of Unipolar versus Bipolar PWM Waveforms. In Proceedings of the IEEE Electrical Insulation Conference (EIC), Calgary, AB, Canada, 16–20 June 2019; pp. 42–45. [Google Scholar]
- Collin, P. Design, Taking into Account the Partial Discharges Phenomena, of the Electrical Insulation System (EIS) of High Power Electrical Motors for Hybrid Electric Propulsion of Future Regional Aircrafts. Ph.D. Thesis, Université Paul Sabatier-Toulouse III, Toulouse, France, 2020. [Google Scholar]
- Christe, A.; Coulinge, E.; Dujic, D. Insulation coordination for a modular multilevel converter prototype. In Proceedings of the 18th European Conference on Power Electronics and Applications (EPE’16 ECCE Europe), Karlsruhe, Germany, 5–9 September 2016; pp. 1–9. [Google Scholar]
- Binder, A. Energietechnische Gesellschaft Fachbereich Elektrische Maschinen und Antriebe. In Monitoring und Diagnose Elektrischer Maschinen und Antriebe: Stand der Forschung, Entwicklungstendenzen; VDE-Haus: Frankfurt am Main, Germany, 2001. [Google Scholar]
- Electrical Apparatus Service Association (EASA). Failures in Three Phase Stator Windings; EASA: St. Louis, MO, USA, 2019; Available online: https://easa.com/resources/failures-in-three-phase-stator-windings (accessed on 13 March 2022).
- Nguyen, H.H.; Mirza, A.Y.; Chen, W.; Liu, Y.; Ronzello, J.; Chapman, J.; Bazzi, A.M.; Cao, Y. Investigation of 2D Nano-Structured Winding Insulation for High Torque Density Medium-Voltage Motor. IEEE Access 2021, 9, 2274–2282. [Google Scholar] [CrossRef]
- Mirza, A.Y.; Nyugen, H.; Bazzi, A.M.; Cao, Y. Investigating the Effect of Multilevel Inverters on Motor Stator Insulation Stress. In Proceedings of the IEEE Energy Conversion Congress and Exposition (ECCE), Vancouver, BC, Canada, 10–14 October 2021; pp. 5569–5572. [Google Scholar]
- Liu, Y.; Nguyen, H.; Bazzi, A.M.; Cao, Y. Torque Enhancement and Re-Rating of Medium-Voltage Induction Machines Using Nano-Structured Stator Winding Insulation. In Proceedings of the IEEE Electric Ship Technologies Symposium (ESTS), Arlington, VA, USA, 14–17 August 2017; pp. 232–237. [Google Scholar]
- Cook, D. Integrated systems approach to induction motor selection and design. In Proceedings of the American Society of Naval Engineers, Electrical Machine Technical Symposium, Virginia Beach, VA, USA, 10–12 June 2014. [Google Scholar]
- Hombu, M.; Ueda, S.; Ueda, A. A Current Source GTO Inverter with Sinusoidal Inputs and Outputs. IEEE Trans. Ind. Appl. 1987, IA-23, 247–255. [Google Scholar] [CrossRef]
- Ahmadi, D.; Zou, K.; Li, C.; Huang, Y.; Wang, J. A Universal Selective Harmonic Elimination Method for High-Power Inverters. IEEE Trans. Power Electron. 2011, 26, 2743–2752. [Google Scholar] [CrossRef]
- Mirza, A.; Chen, W.; Nguyen, H.; Cao, Y.; Bazzi, A.M. High-Voltage High-Frequency Testing for Medium-Voltage Motor Insulation Degradation. In Proceedings of the IEEE Energy Conversion Congress and Exposition (ECCE), Portland, OR, USA, 23–27 September 2018; pp. 2444–2447. [Google Scholar]


| Machine | |||
| Number of Poles | 24 | ||
| Reference Speed | 193 RPM | ||
| Rated Output Power | 4500 HP | ||
| Rated Voltage | 4160 V | ||
| Operating Temperature | 75 °C | ||
| Winding Connection | Wye | ||
| Frequency | 40 Hz | ||
| Stray Loss Factor | 0.00 | ||
| Frictional Loss | 283 W | ||
| Windage Loss | 0 W | ||
| Insulation | Mica (stator ground-wall insulation) | ||
| Spacer | FR4-epoxy | ||
| Wedge | PTFE | ||
| Machine ⇒ Stator | Machine ⇒ Rotor | ||
| Outer Diameter Inner Diameter Length Number of Slots Steel Type Slot Type | 1170 mm | Number of Slots | 108 |
| 950 mm | Outer Diameter | 948 mm | |
| 1000 mm | Inner Diameter | 180 mm | |
| 144 | Length | 1000 mm | |
| M36_24 G | Steel type | M36_24 G | |
| 6 | Slot type | 3 | |
| Machine ⇒ Stator Slot | Machine ⇒ Rotor Slot | ||
| Hs0 Hs1 Hs2 Bs1 Bs2 | 1 mm 2.5 mm 75 mm 12 mm 10 mm | Hs0 | 1 mm |
| Hs01 | 0 mm | ||
| Hs1 | 0 mm | ||
| Hs2 | 30 mm | ||
| Bs0 | 4 mm | ||
| Bs1 | 10 mm | ||
| Bs2 | 10 mm | ||
| Rs | 0 mm | ||
| Machine ⇒ Stator Winding | Machine ⇒ Rotor Winding | ||
| Winding material Pitch Number of Strands Winding Type Winding Layers Parallel Branches Conductors per Slot Wire Size | Copper 5 1 Whole-Coiled 2 2 10 8 mm × 4.4 mm | Bar Conductor | Copper |
| End Length | 25 mm | ||
| End Ring Width | 25 mm | ||
| End Ring Height | 25 mm | ||
| Property | Value |
|---|---|
| Relative permittivity | 5.4 |
| Relative permeability | 1 |
| Bulk conductivity | 1.11 × 10⁻¹³ Siemen/m |
| Dielectric loss tangent | 0.0003 |
| Mass density | 2500 kg/m3 |
| # | Machine Part | Material |
|---|---|---|
| 1 | Stator Core | M36 Steel |
| 2 | Stator Winding Bar | Copper |
| 3 | Rotor Core | M36 Steel |
| 4 | Rotor Bar | Copper |
| 5 | Stator ground-wall insulation | Mica |
| 6 | Spacer | FR4-epoxy |
| 7 | Wedge | PTFE |
| MLI Levels | Firing Angles (rad) | RMS (V) Peak Values of MLI Matched to 3000 V | Maximum Dielectric Stress (MV/m) | Maximum Leakage Current Density (A/m2) |
|---|---|---|---|---|
| 2 | 0 | 3000 | 2.91 | 0.0526 |
| 3 | π/4 | 1244.5 | 0.773 | 0.0175 |
| 5 | π/6, π/3 | 641.74 | 0.668 | 0.0119 |
| (rad) | RMS (V) | THD % | Maximum Dielectric Stress (MV/m) | Maximum Leakage Current Density (A/m2) |
|---|---|---|---|---|
| 2580.60 | 18.64% | 1.913 | 0.035 | |
| 2431.77 | 20.10% | 1.3572 | 0.0245 | |
| 2099.73 | 32.3% | 0.97169 | 0.0175 | |
| 1704.18 | 54.42% | 0.65882 | 0.0119 |
| (rad) | RMS (V) | THD % | Maximum Dielectric Stress (MV/m) | Maximum Leakage Current Density (A/m2) |
|---|---|---|---|---|
| , | 2514.24 | 12.8% | 0.0599 | |
| , | 2408.76 | 11.61% | 3.1596 | 0.0570 |
| π/8, π/4 | 2240.57 | 13.18% | 2.8238 | 0.0509 |
| (rad) | RMS (V) | THD % | Maximum Dielectric Stress (MV/m) | Maximum Leakage Current Density (A/m2) |
|---|---|---|---|---|
| π/10, π/9, π/8 | 3928.95 | 18.49% | 5.778 | 0.1042 |
| π/9, π/8, π/7 | 3847.47 | 17.609% | 5.472 | 0.0986 |
| π/8, π/7, π/6 | 3737.675 | 17.014% | 4.852 | 0.0875 |
| MV Simulations | LV Experiments | ||||
|---|---|---|---|---|---|
| MLI Levels | Firing Angles (rad) | RMS (V) | Dielectric Stress across Insulation (MV/m) | RMS (V) | Dielectric Stress across Insulation (MV/m) |
| 3 | 2580.60 | 1.913 | 51.6 | 0.290213 | |
| 3 | 2431.77 | 1.3572 | 48.9 | 0.275028 | |
| 3 | 2099.73 | 0.97169 | 42.4 | 0.238470 | |
| 3 | 1704.18 | 0.65882 | 34.7 | 0.195163 | |
| Simulations Vdc Scaled to Achieve Similar Peak Voltage 3000 V | Experiments | ||||
|---|---|---|---|---|---|
| MLI Levels | Firing Angles (rad) | RMS (V) | Max Dielectric Stress across Insulation (MV/m) | RMS (V) | Max Dielectric Stress across Insulation (MV/m) |
| 3 | 1244.50 1000 | 0.773 | 42.4 | 0.238470 | |
| 5 | 0.668 | 38.5 | 0.216535 | ||
| Property | Value |
|---|---|
| Relative permittivity | 3.4 |
| Bulk conductivity | 6.66 × 10⁻²⁰ Siemen/m |
| Dielectric loss tangent | 0.0018 |
Publisher’s Note: MDPI stays neutral with regard to jurisdictional claims in published maps and institutional affiliations. |
© 2022 by the authors. Licensee MDPI, Basel, Switzerland. This article is an open access article distributed under the terms and conditions of the Creative Commons Attribution (CC BY) license (https://creativecommons.org/licenses/by/4.0/).
Share and Cite
Mirza, A.Y.; Bazzi, A.; Nguyen, H.H.; Cao, Y. Motor Stator Insulation Stress Due to Multilevel Inverter Voltage Output Levels and Power Quality. Energies 2022, 15, 4091. https://doi.org/10.3390/en15114091
Mirza AY, Bazzi A, Nguyen HH, Cao Y. Motor Stator Insulation Stress Due to Multilevel Inverter Voltage Output Levels and Power Quality. Energies. 2022; 15(11):4091. https://doi.org/10.3390/en15114091
Chicago/Turabian StyleMirza, Arshiah Yusuf, Ali Bazzi, Hiep Hoang Nguyen, and Yang Cao. 2022. "Motor Stator Insulation Stress Due to Multilevel Inverter Voltage Output Levels and Power Quality" Energies 15, no. 11: 4091. https://doi.org/10.3390/en15114091
APA StyleMirza, A. Y., Bazzi, A., Nguyen, H. H., & Cao, Y. (2022). Motor Stator Insulation Stress Due to Multilevel Inverter Voltage Output Levels and Power Quality. Energies, 15(11), 4091. https://doi.org/10.3390/en15114091